
Photocatalytic Conversion of Organic Pollutants in Air: Quantum Yields Using a Silver/Nitrogen/TiO2 Mesoporous Semiconductor under Visible Light


 ,
, 
Abstract
1. Introduction
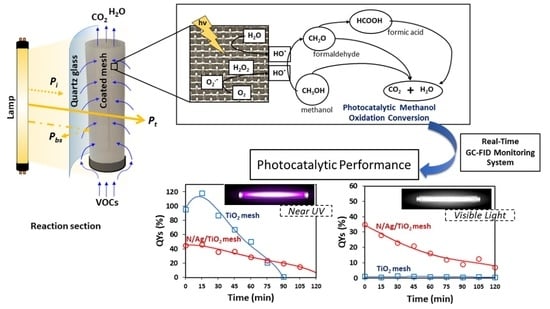
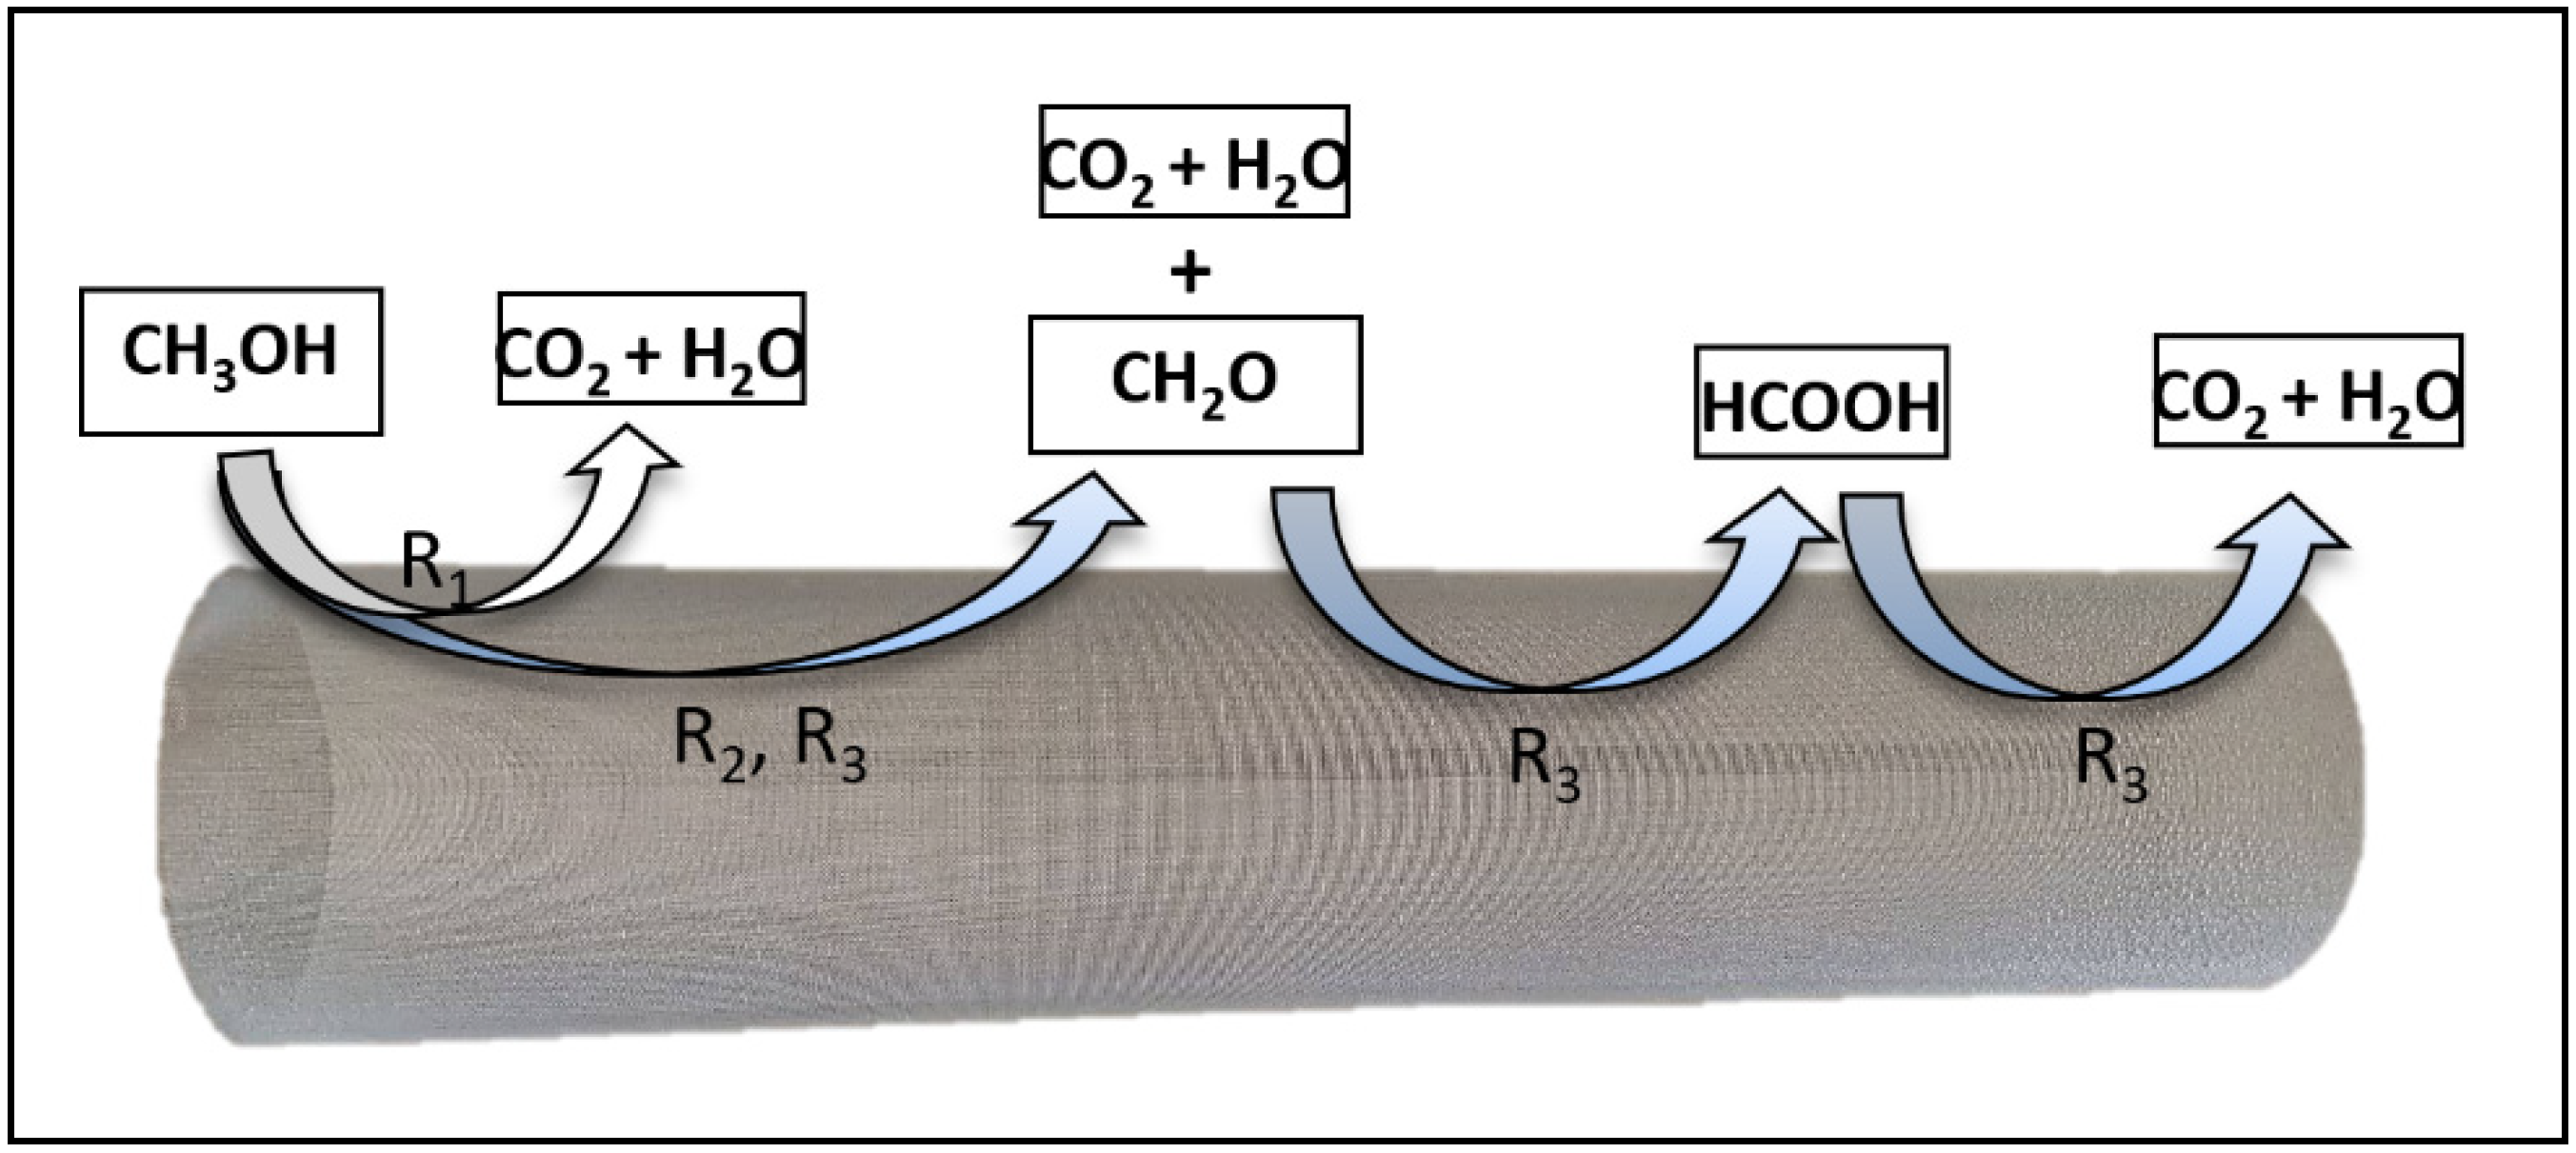
2. Photocatalytic Mechanism of Methanol
3. Results and Discussions
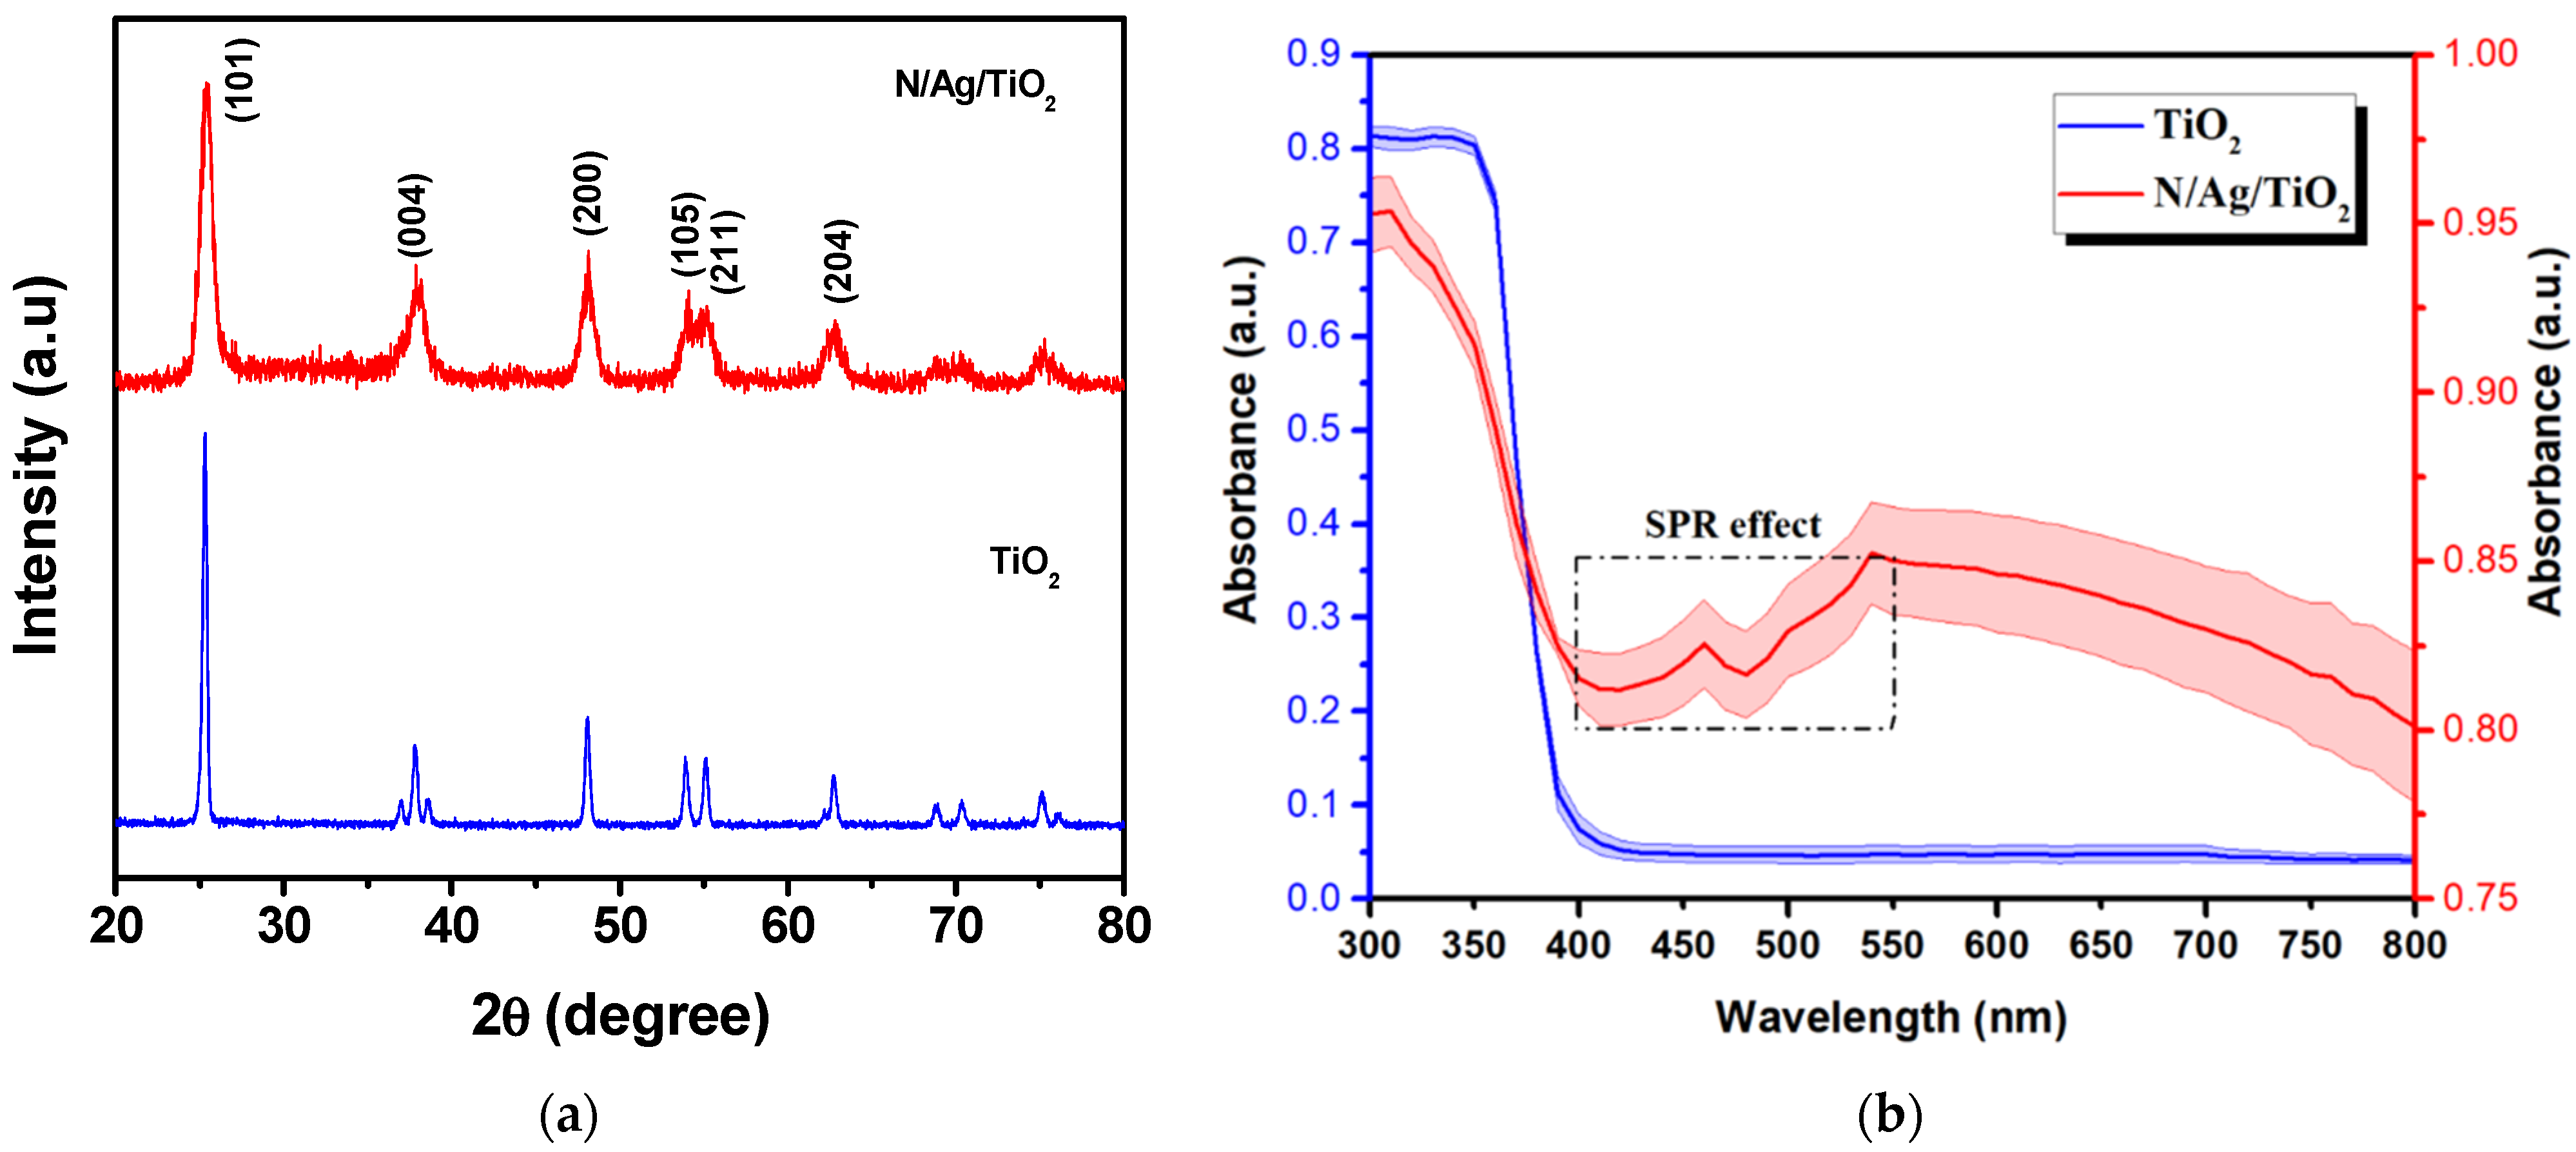
3.1. Properties of the Prepared Photocatalysts
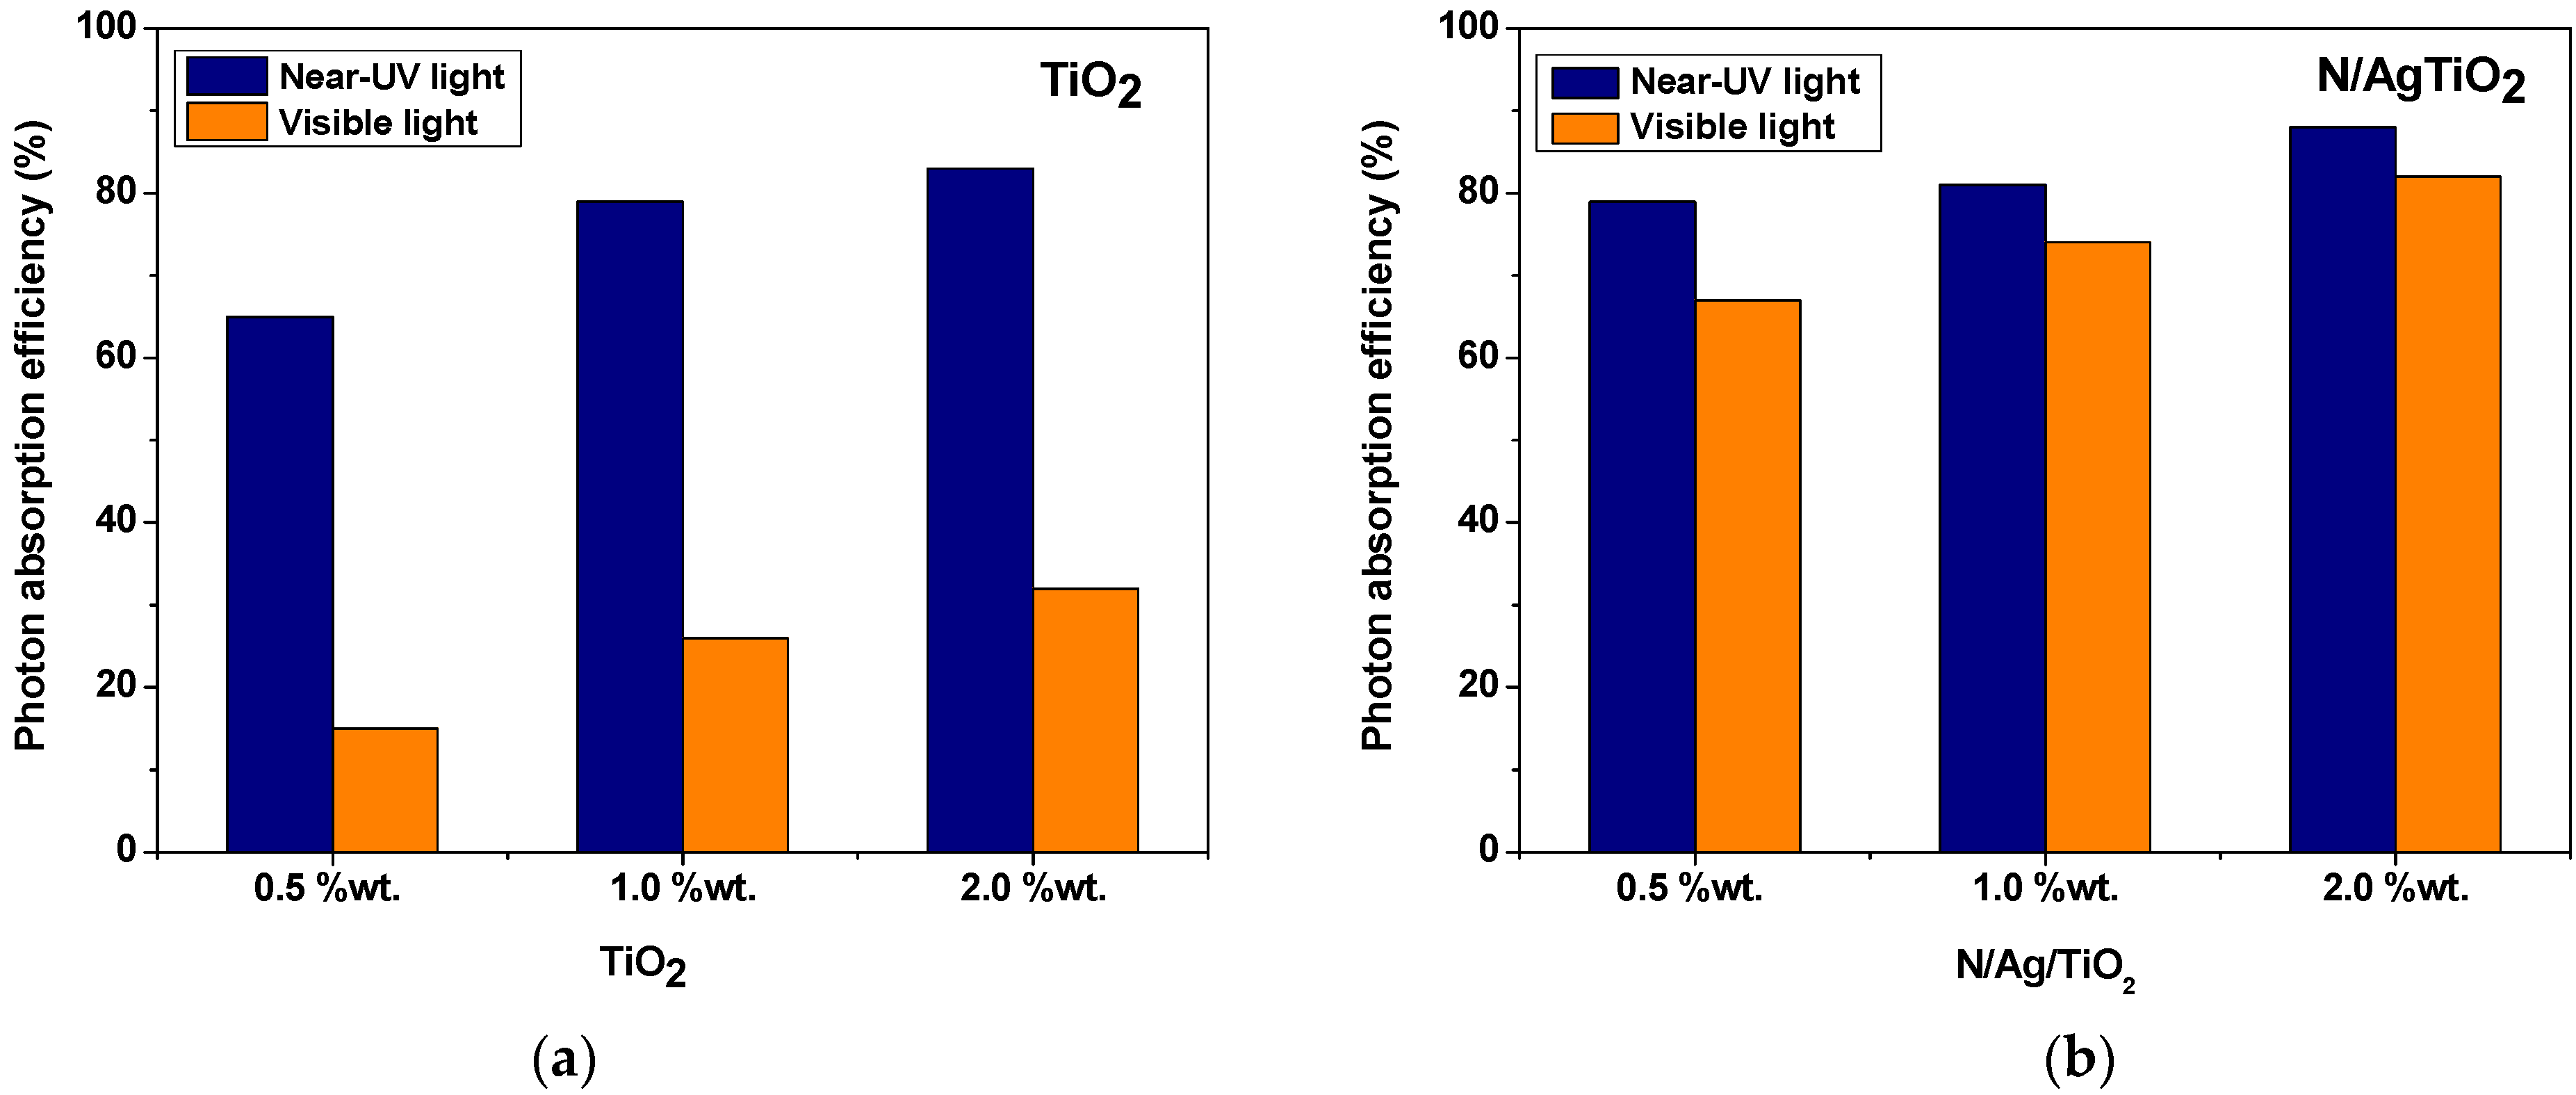
3.2. Photon Absorption Efficiency
3.3. Photocatalytic Conversion of Methanol
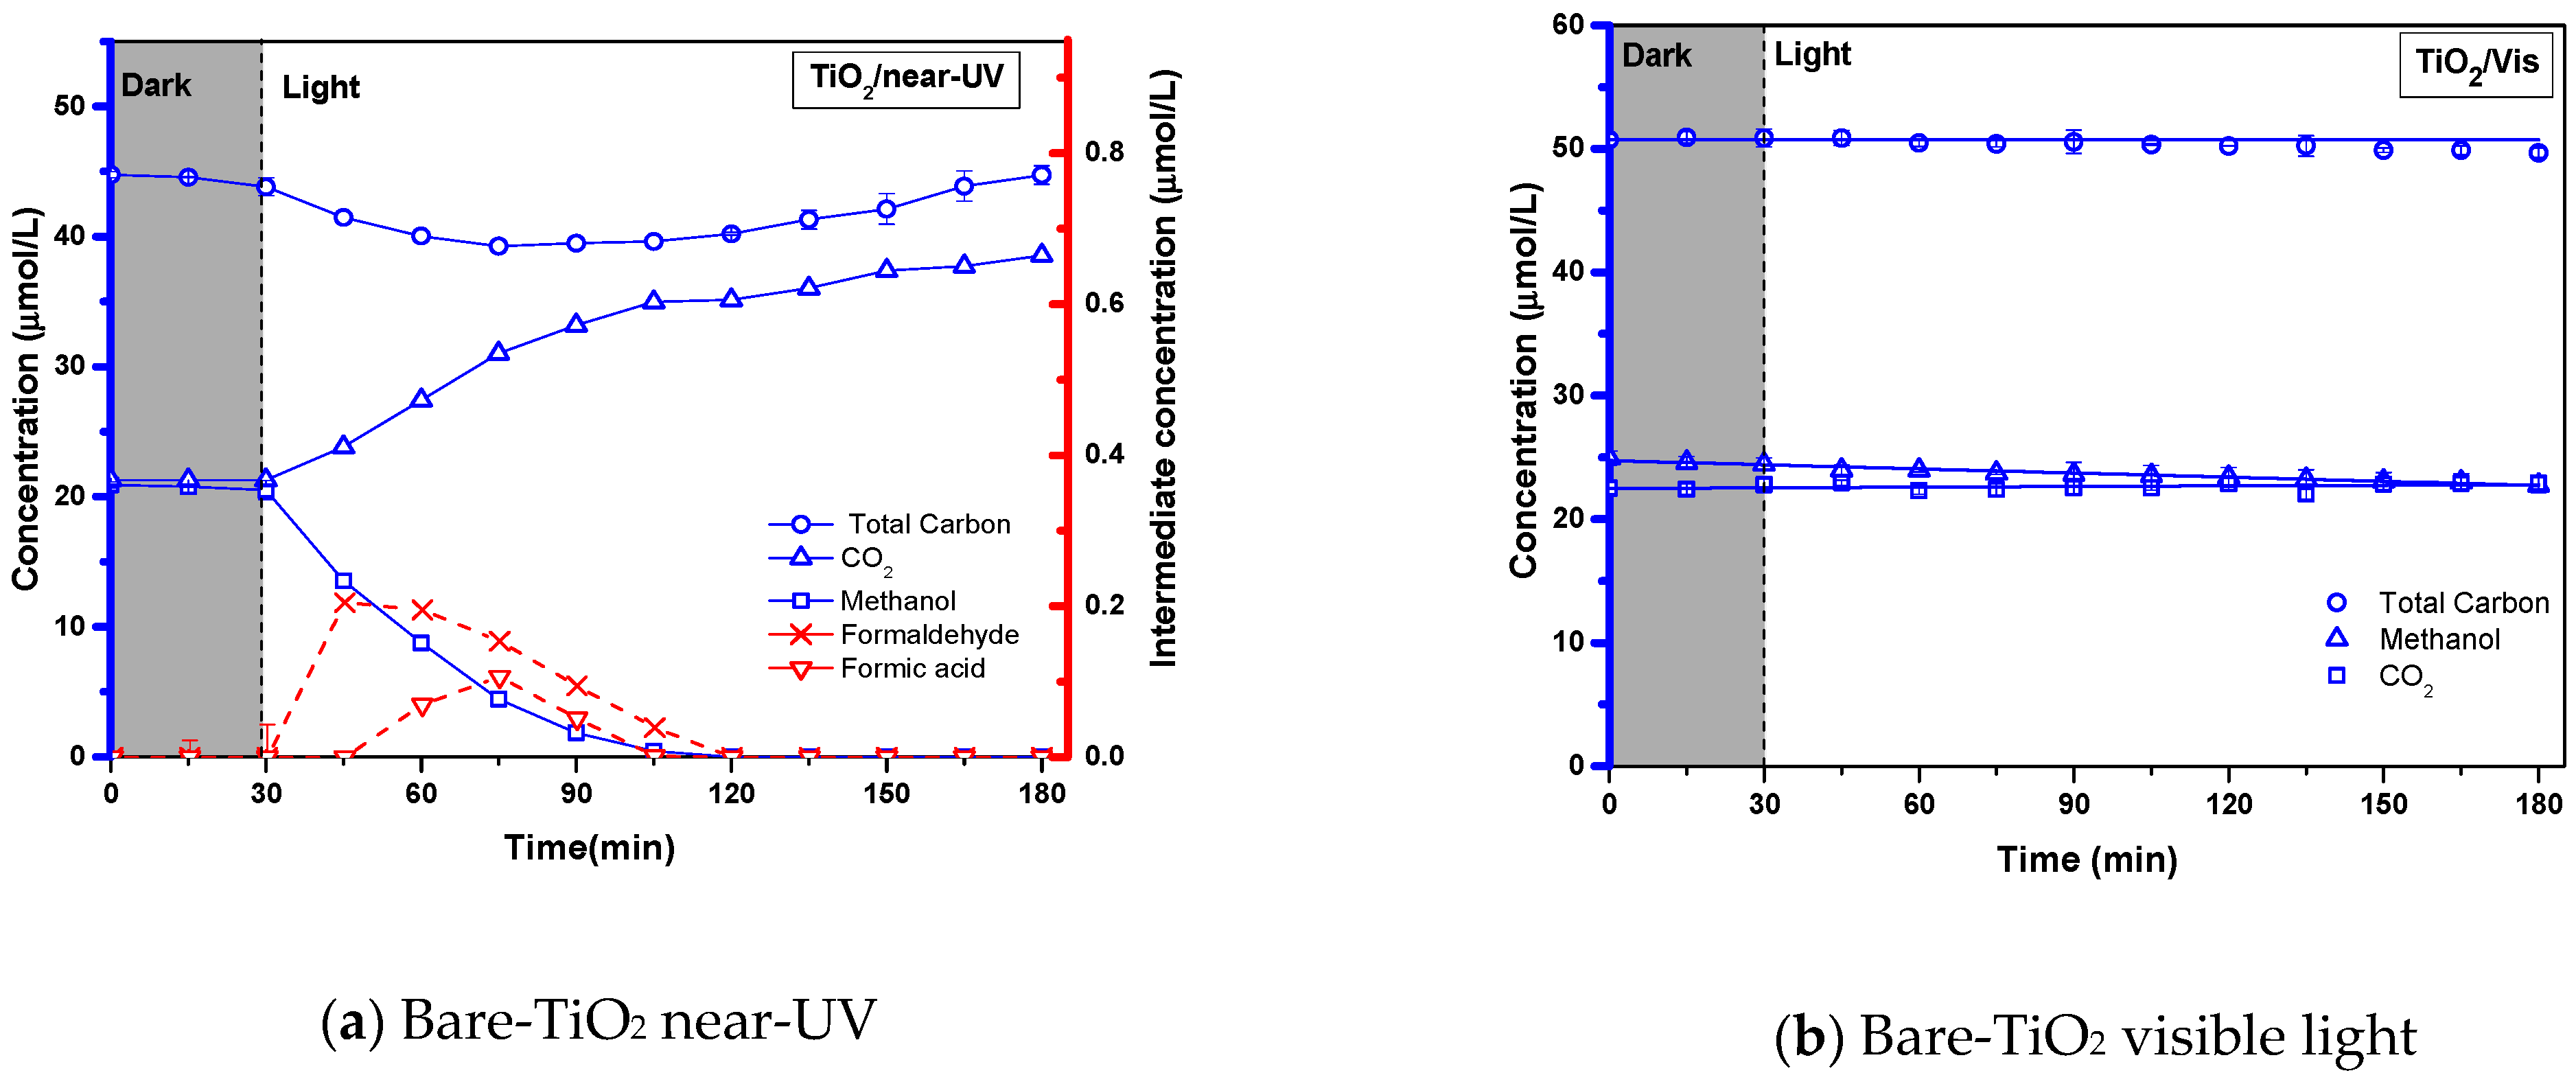
3.3.1. Photocatalytic Methanol Conversion by bare-TiO2 and N/Ag/TiO2 under Near-UV and Visible Light Irradiation
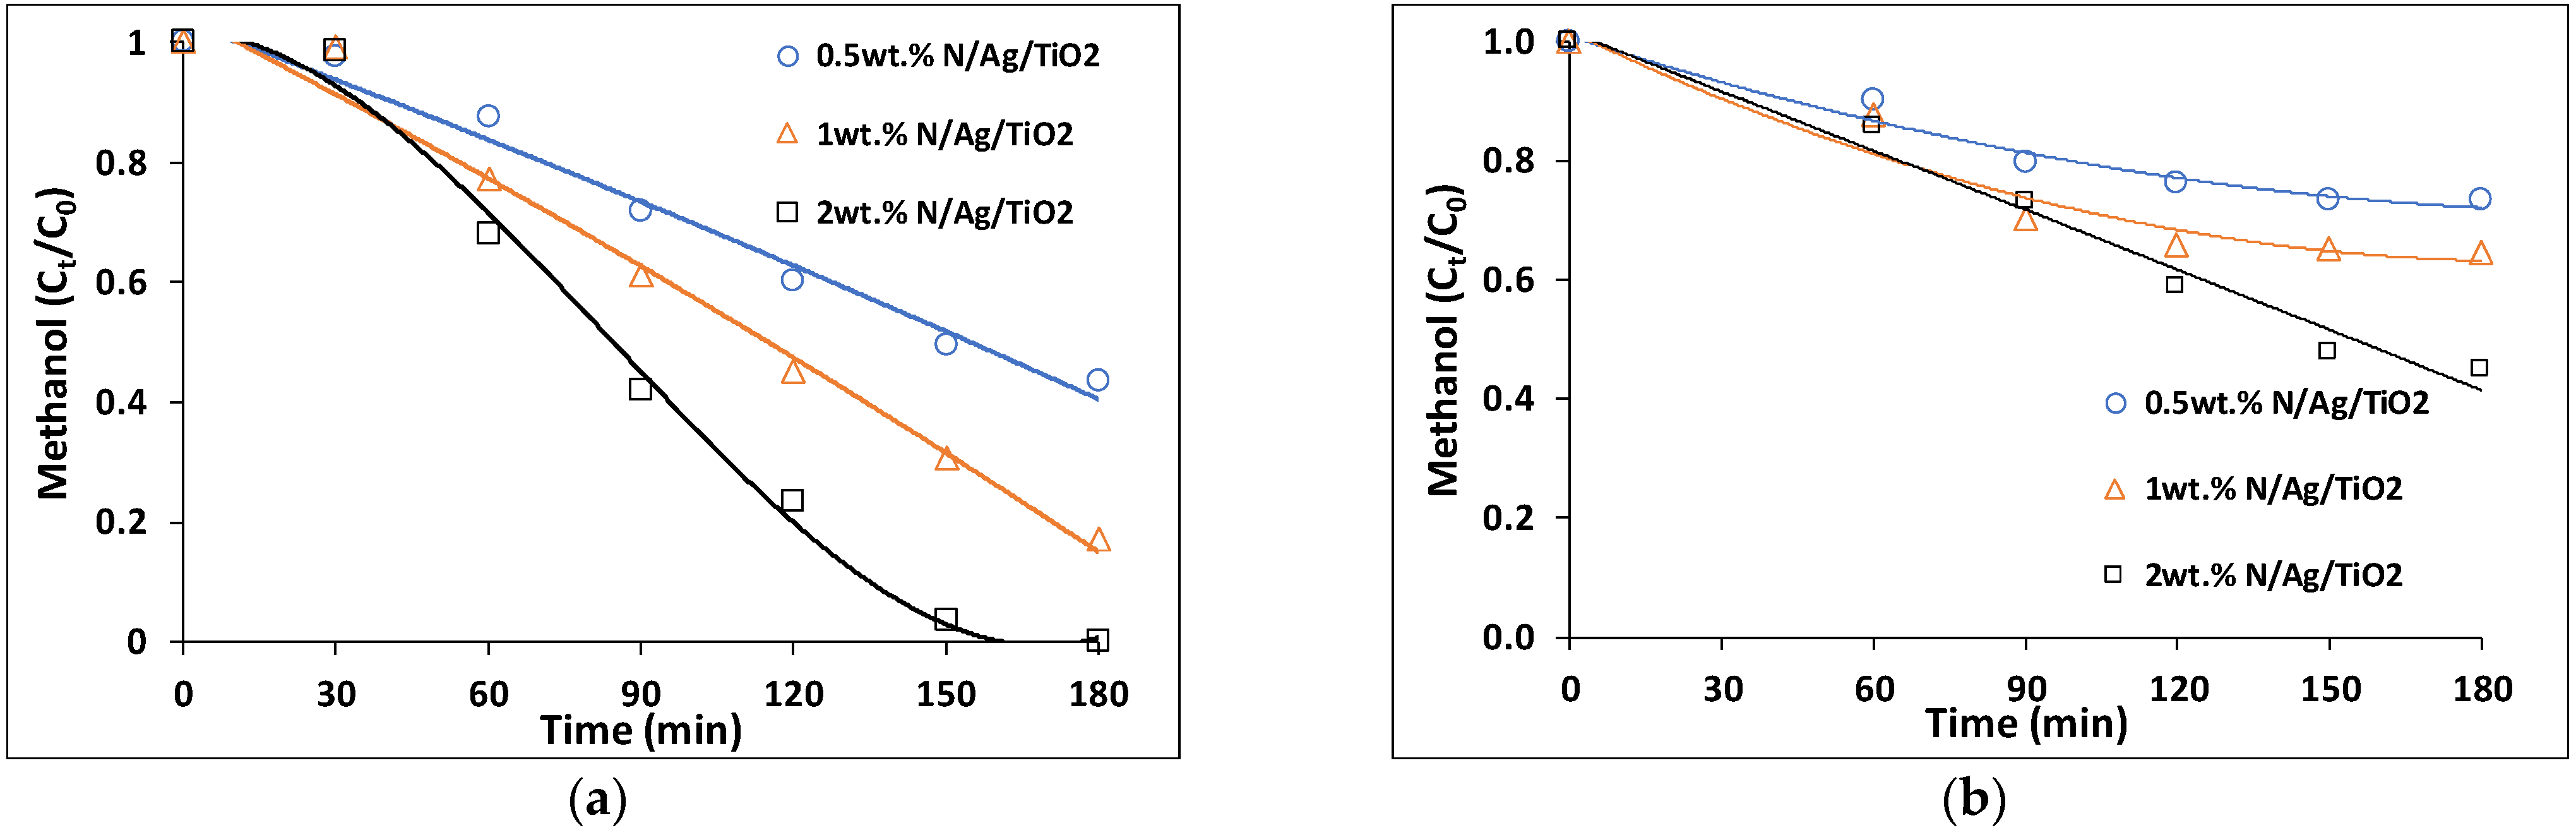
3.3.2. Effect of Photocatalyst Loading
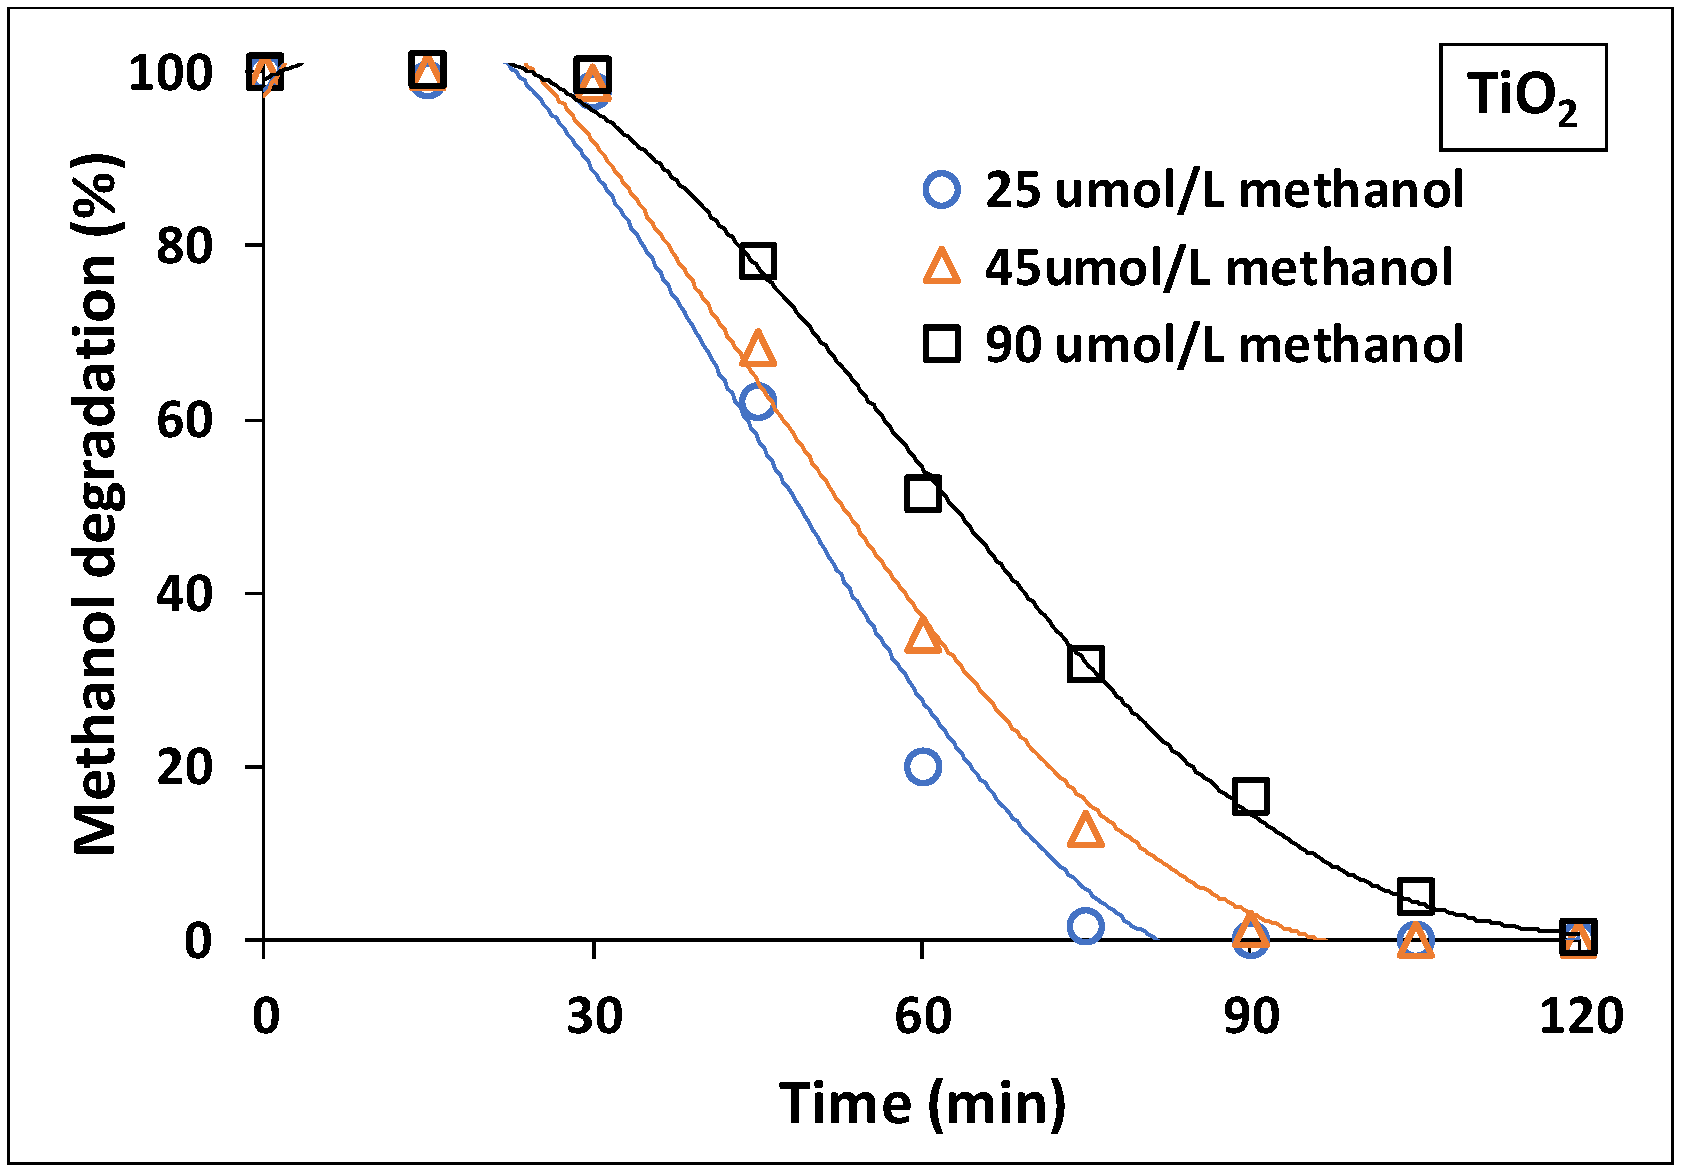
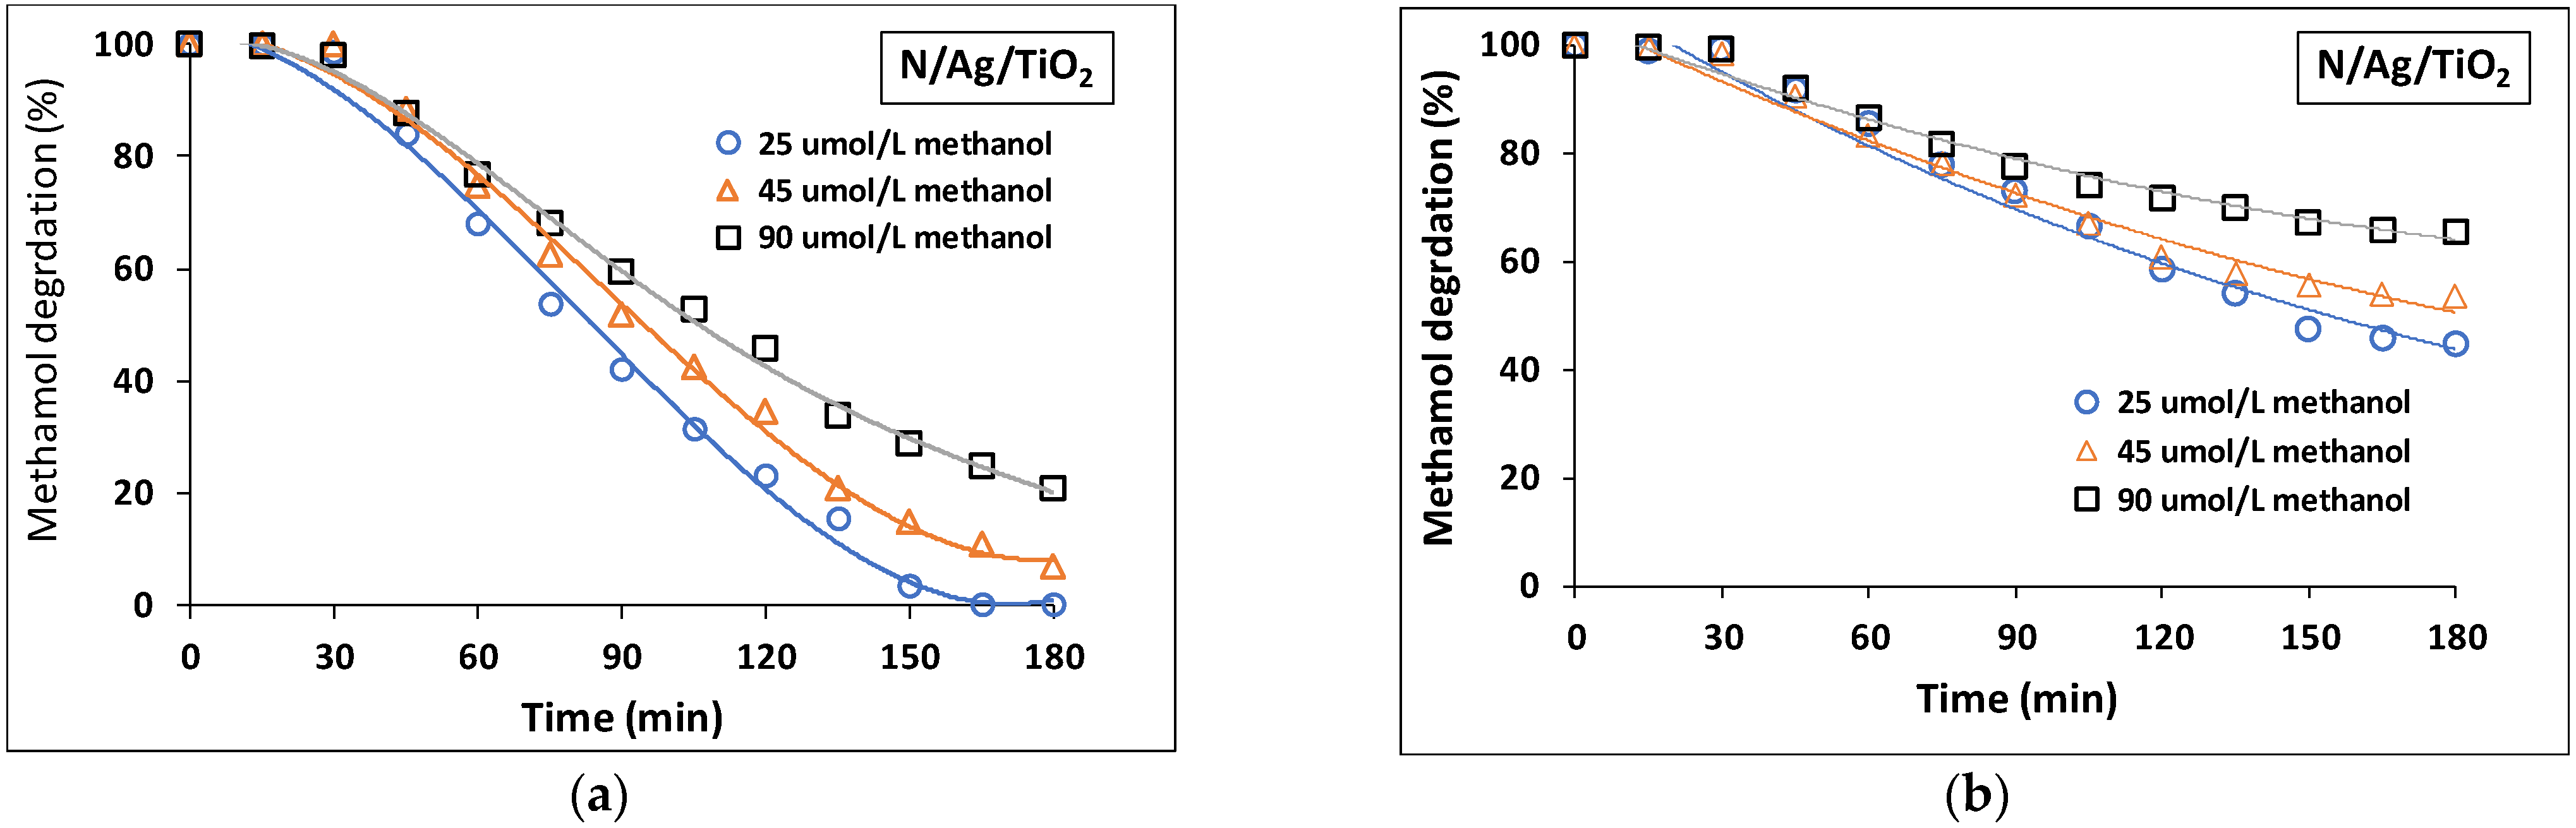
3.3.3. Effect of Initial Methanol Concentration
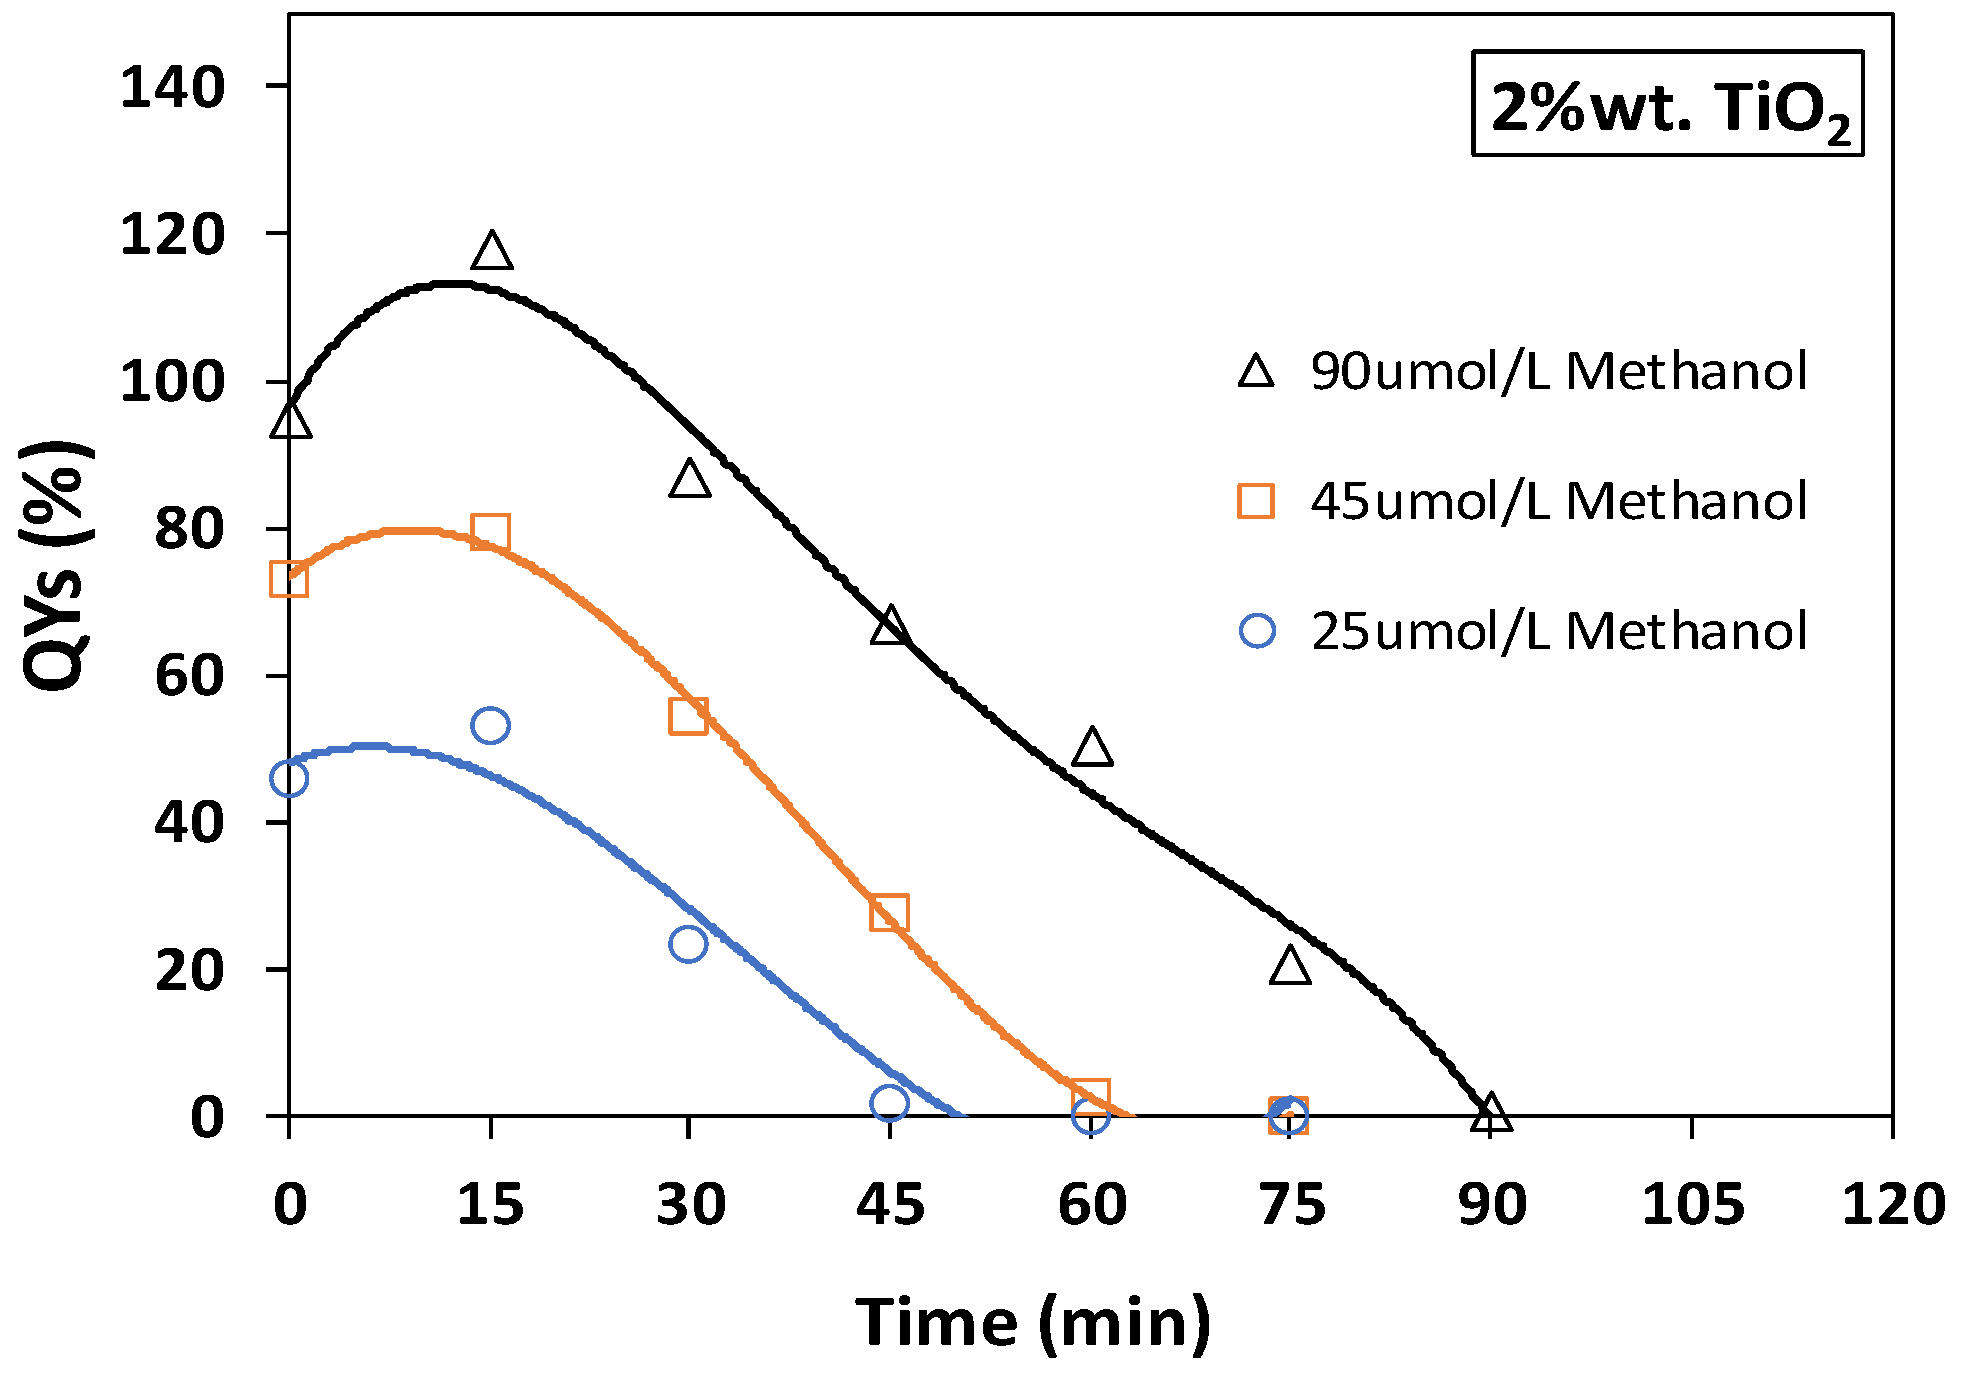
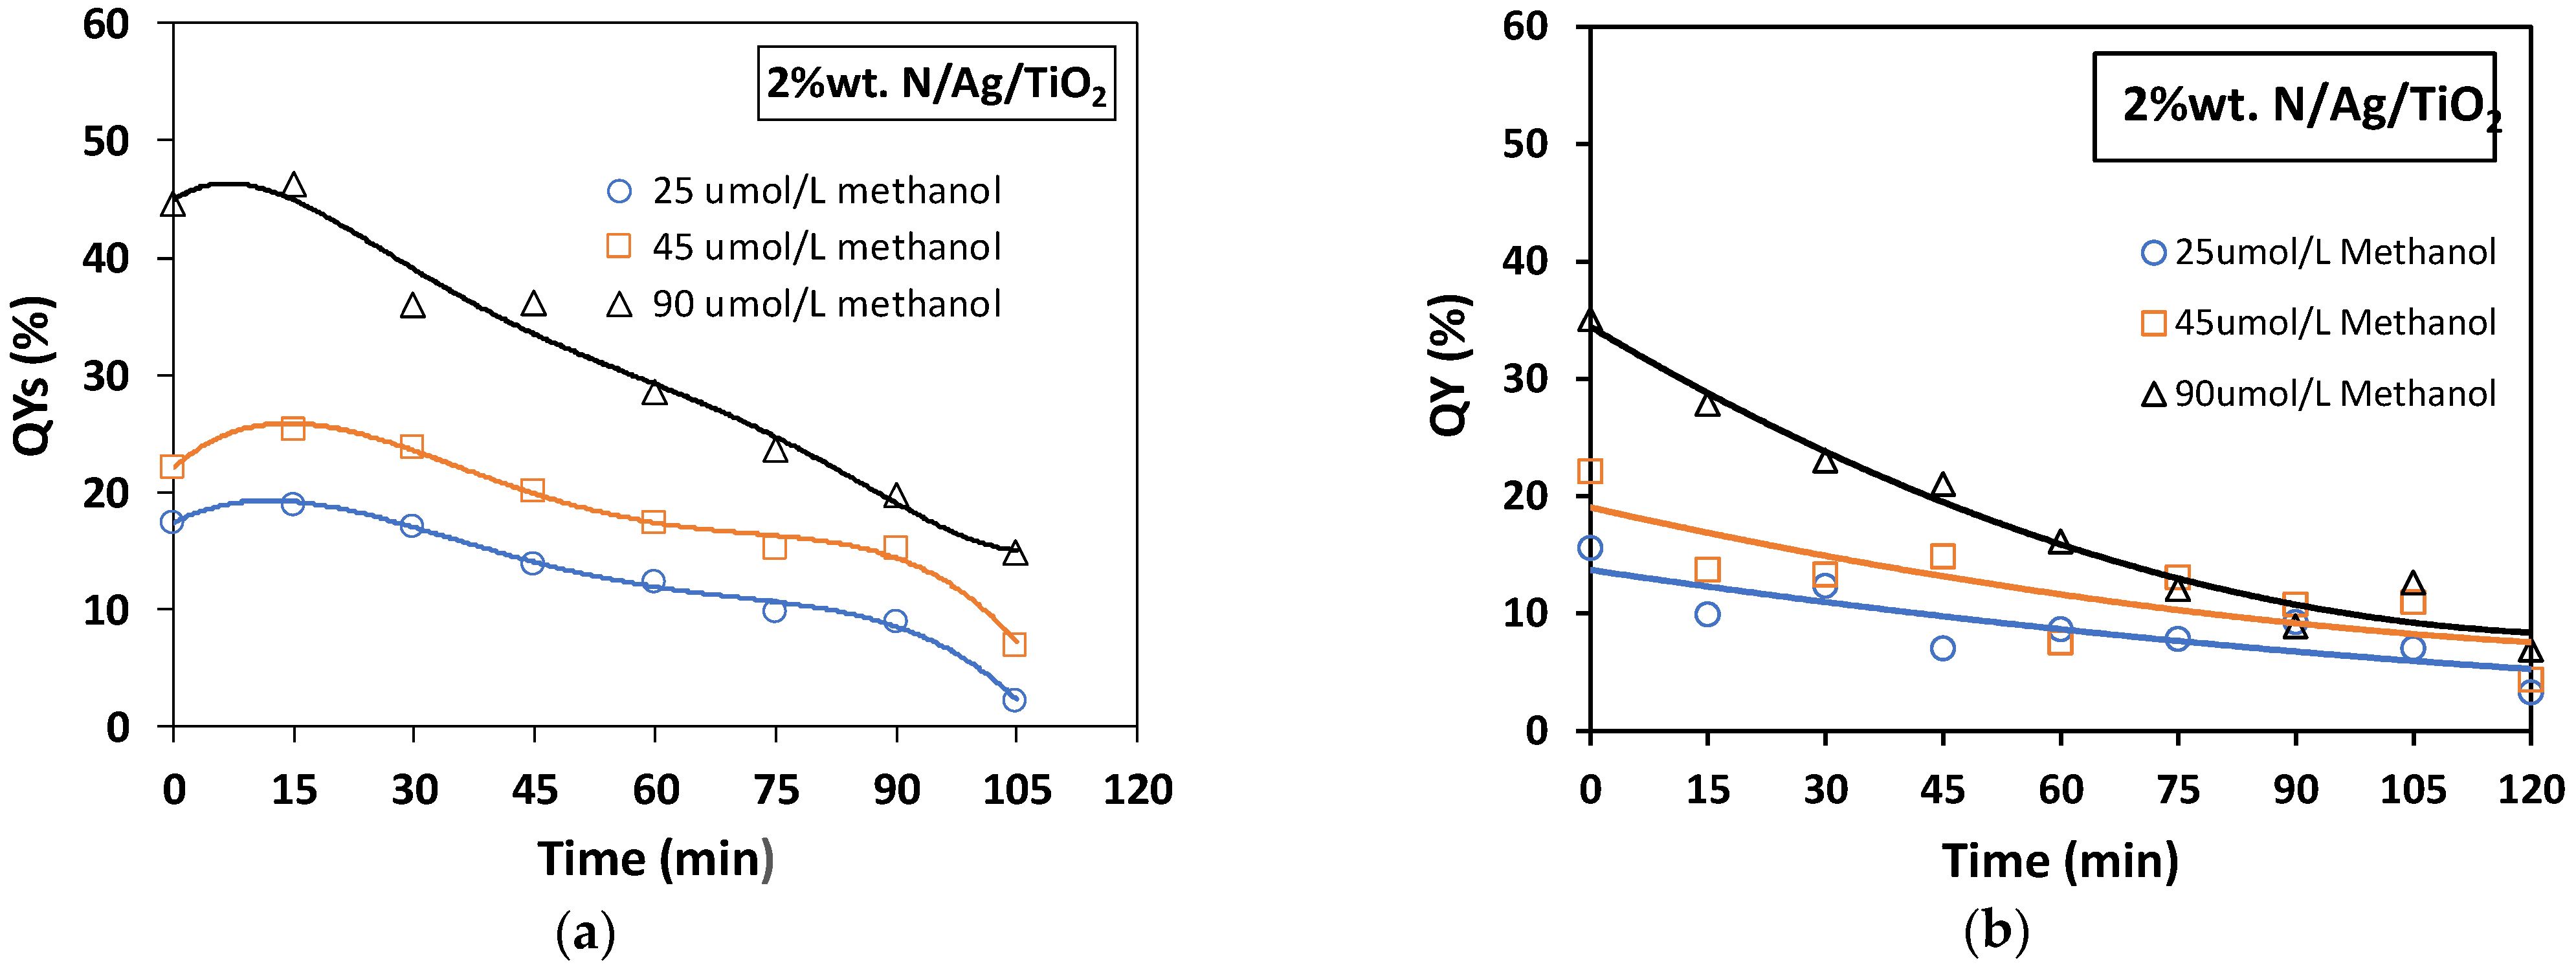
3.3.4. Quantum Yield Efficiencies
4. Materials and Methods
4.1. Preparation of Photocatalysts
4.2. Photocatalyst Characterization Methods
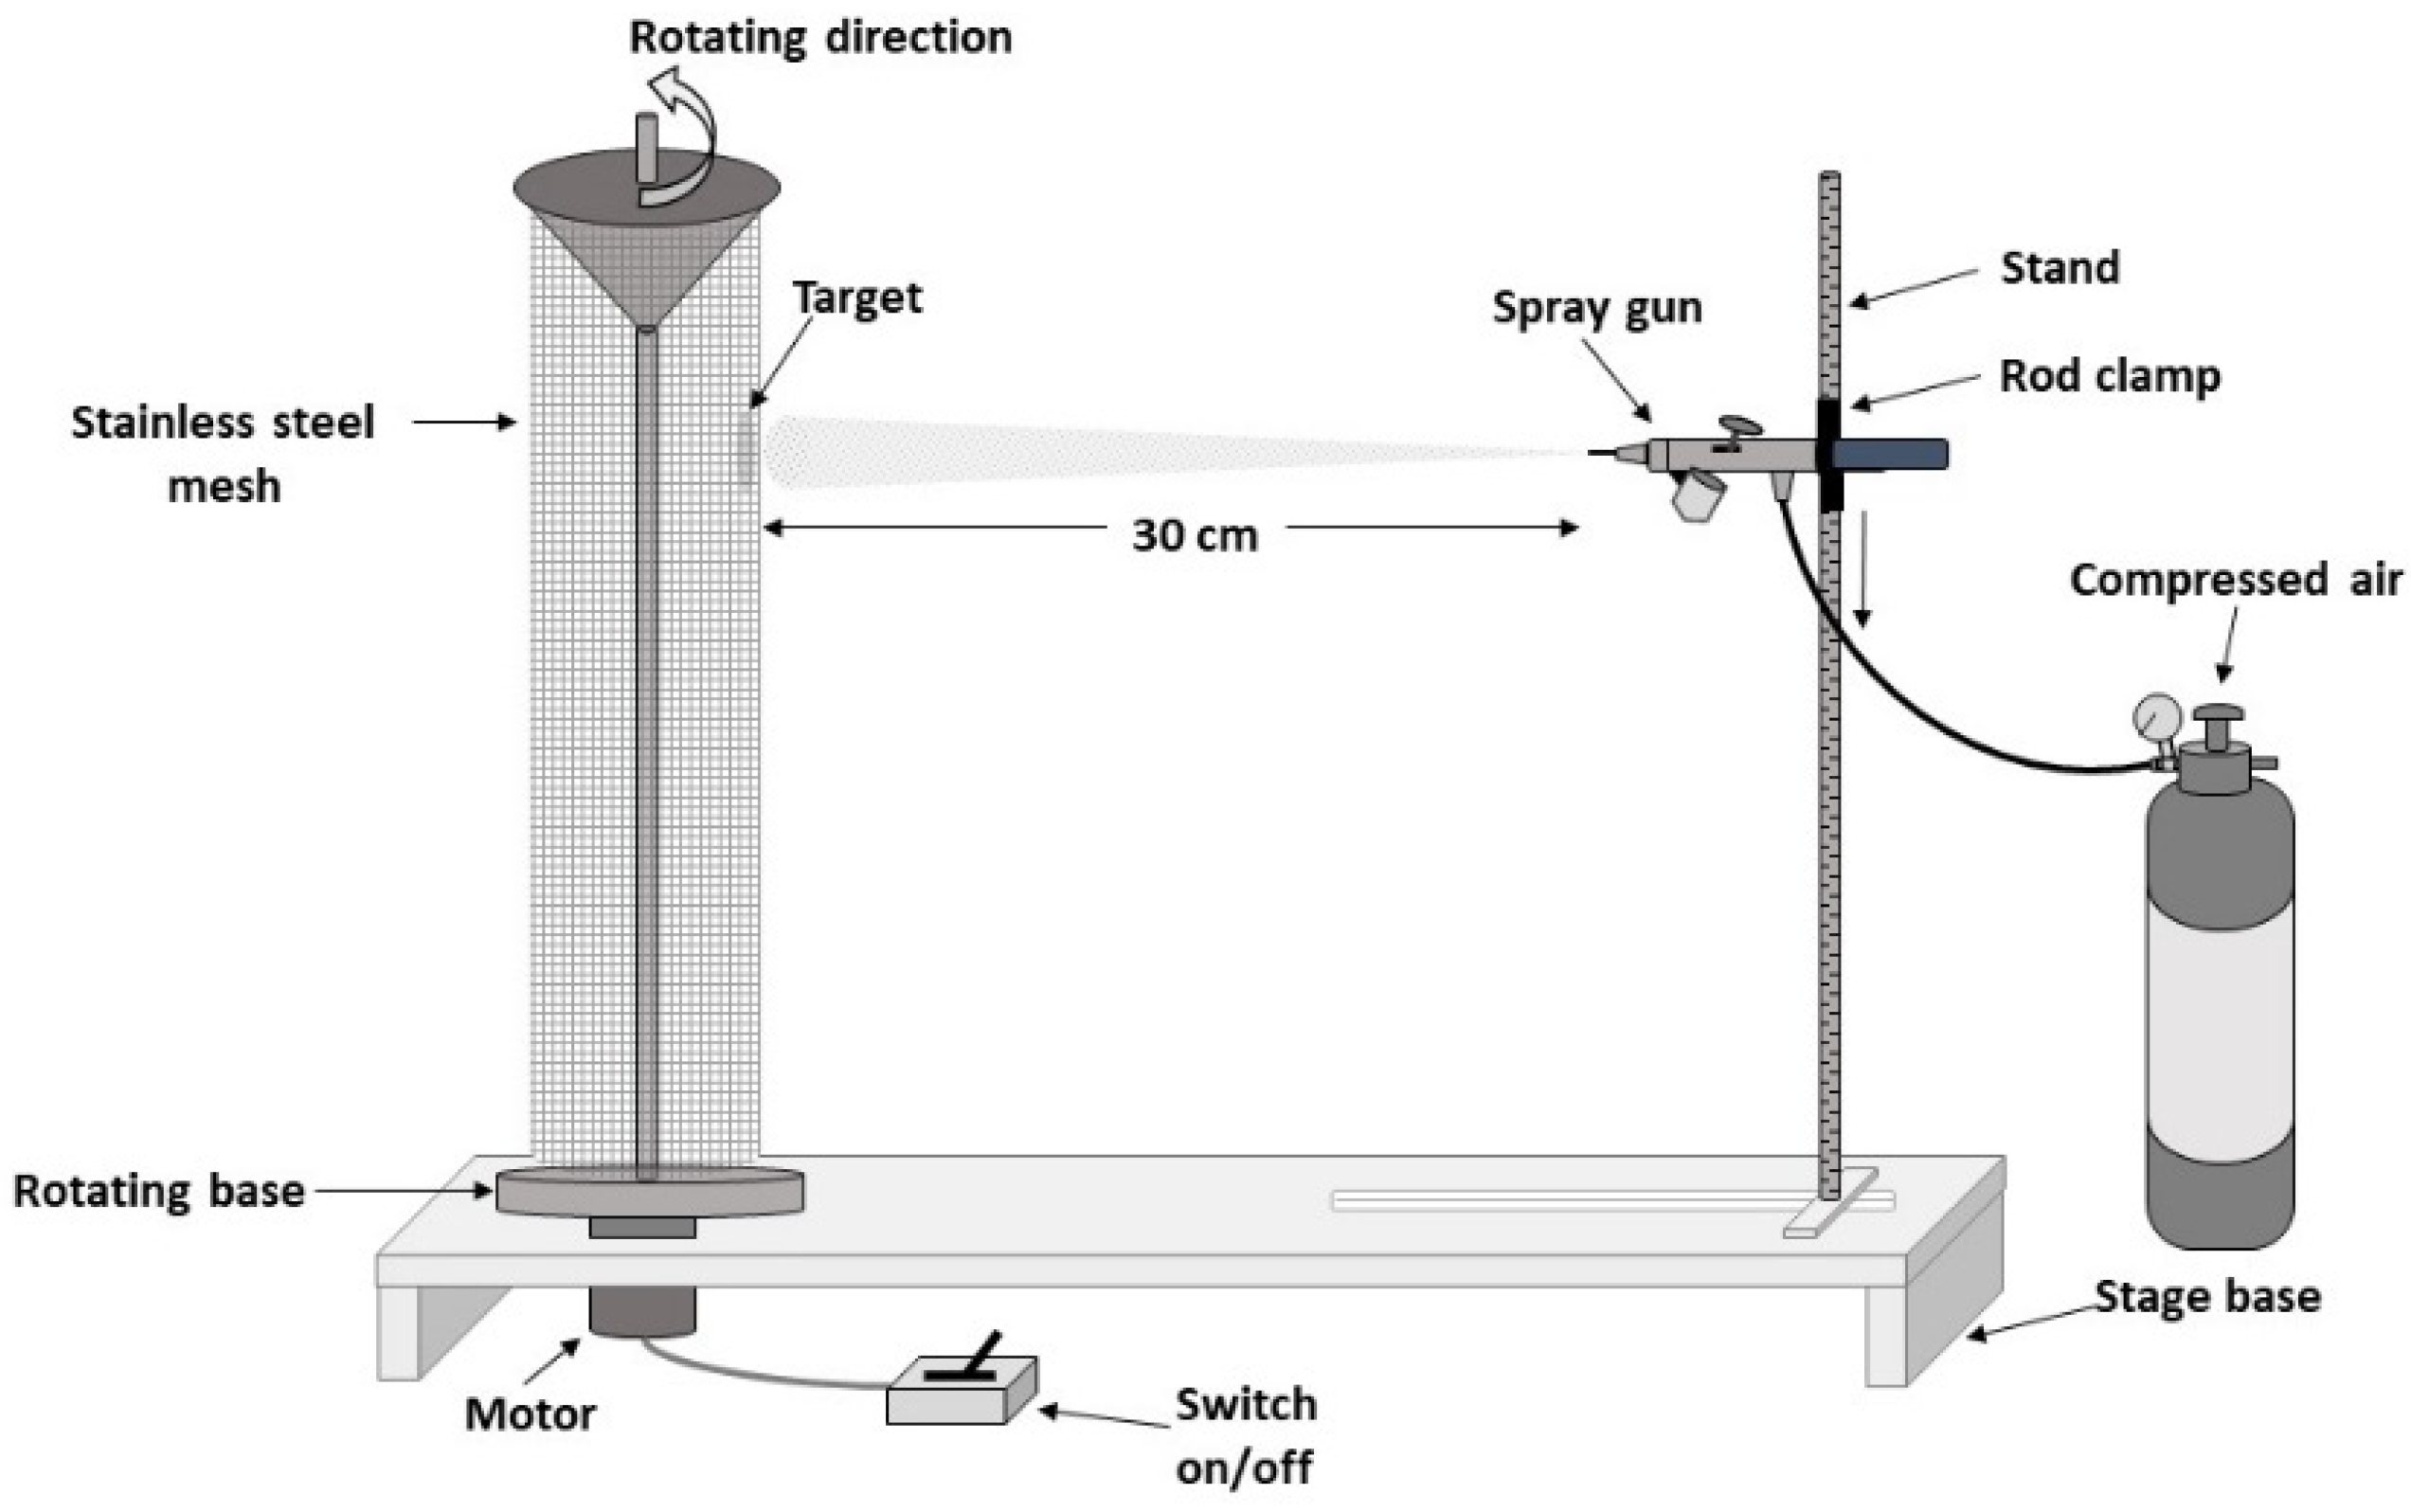
4.3. Spray Coating for Photocatalyst Immobilization
- A cylindrical shaped mesh was cleaned with acetone, alcohol and deionized water to remove all dirt, oils or grease, before letting it dry.
- A cleaned cylindrical shaped stainless-steel woven mesh was set on a rotating base with a constant velocity of 12 rpm. A 150 Badger nozzle gun (Badger Air-Brush Co., Franklin Park, IL, USA) was held on a stand, which was fixed at a distance of 30 cm from the cylinder mesh surface.
- The bare-TiO2 or N/Ag/TiO2 particle suspension with different concentrations (5, 10 and 20 wt.%) were prepared using distilled water (50 mL), by sonicating the particle slurries for 30 min. Furthermore, and to avoid the particle settling during spray coating, the particle suspension was stirred continuously using a magnetic stirrer.
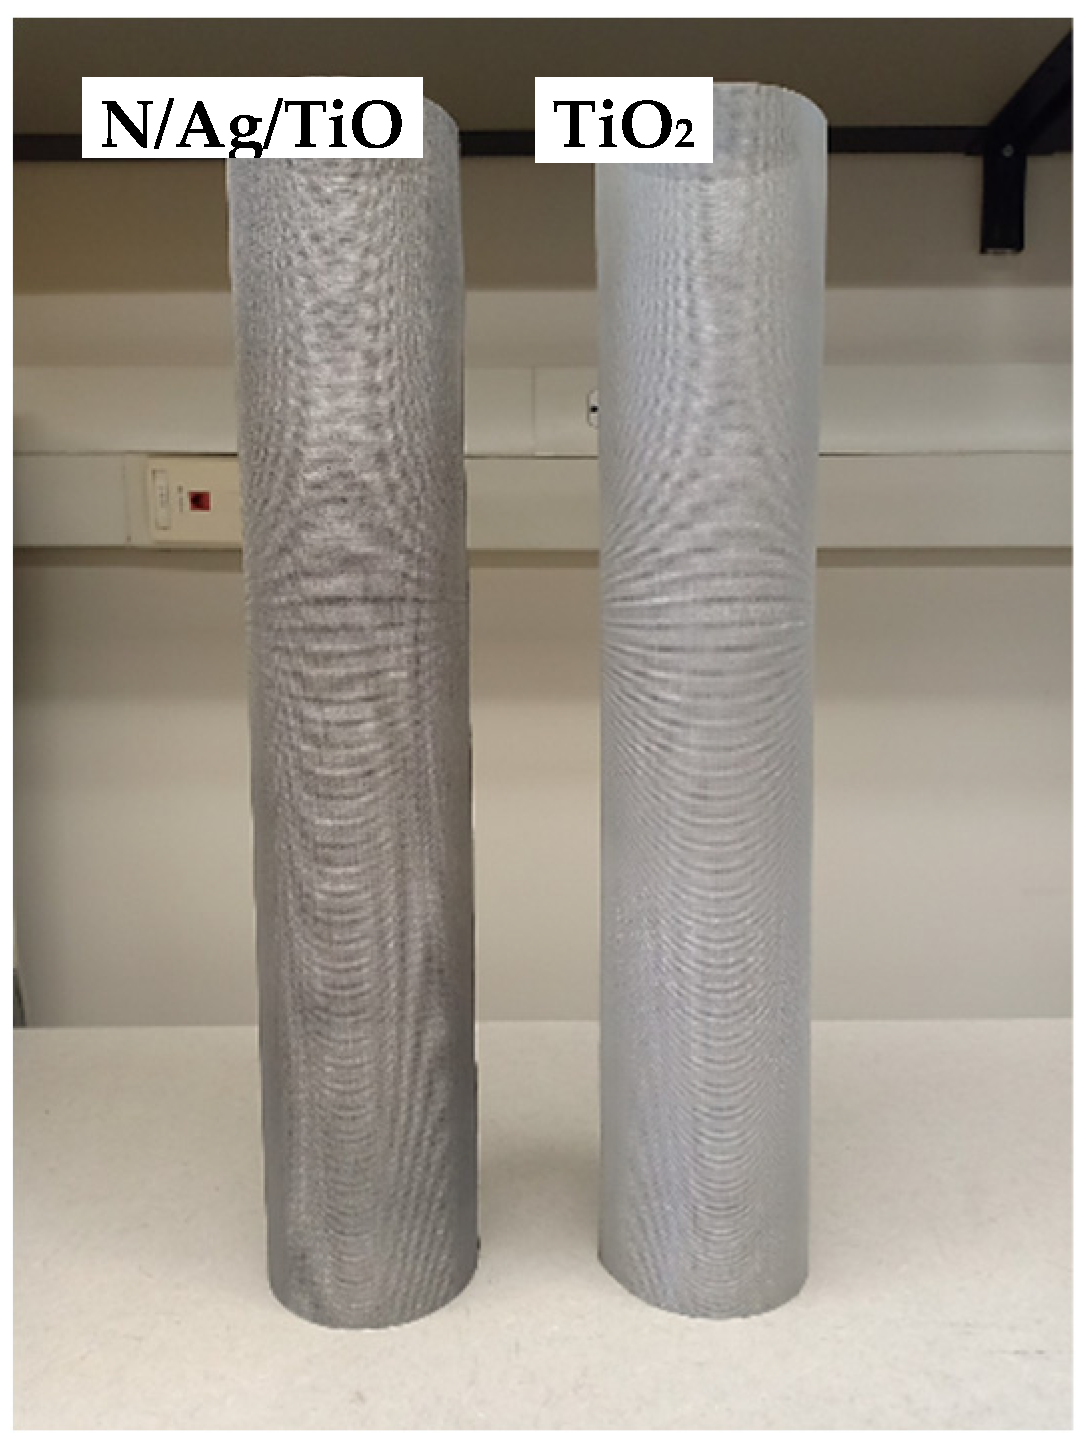
- A 1.31 mL suspension volume was injected into a paint cup and then sprayed onto the mesh surface with an adequate and constant air pressure of 20 psia. This required coating was typically achieved after three-cylinder rotations, with the spray gun providing a homogeneous coating to all areas of the metallic mesh (Figure 14). To cover the entire height of the cylindrical mesh, the gun level was adjusted for every coating step, starting from the top and moving down every 5 cm.
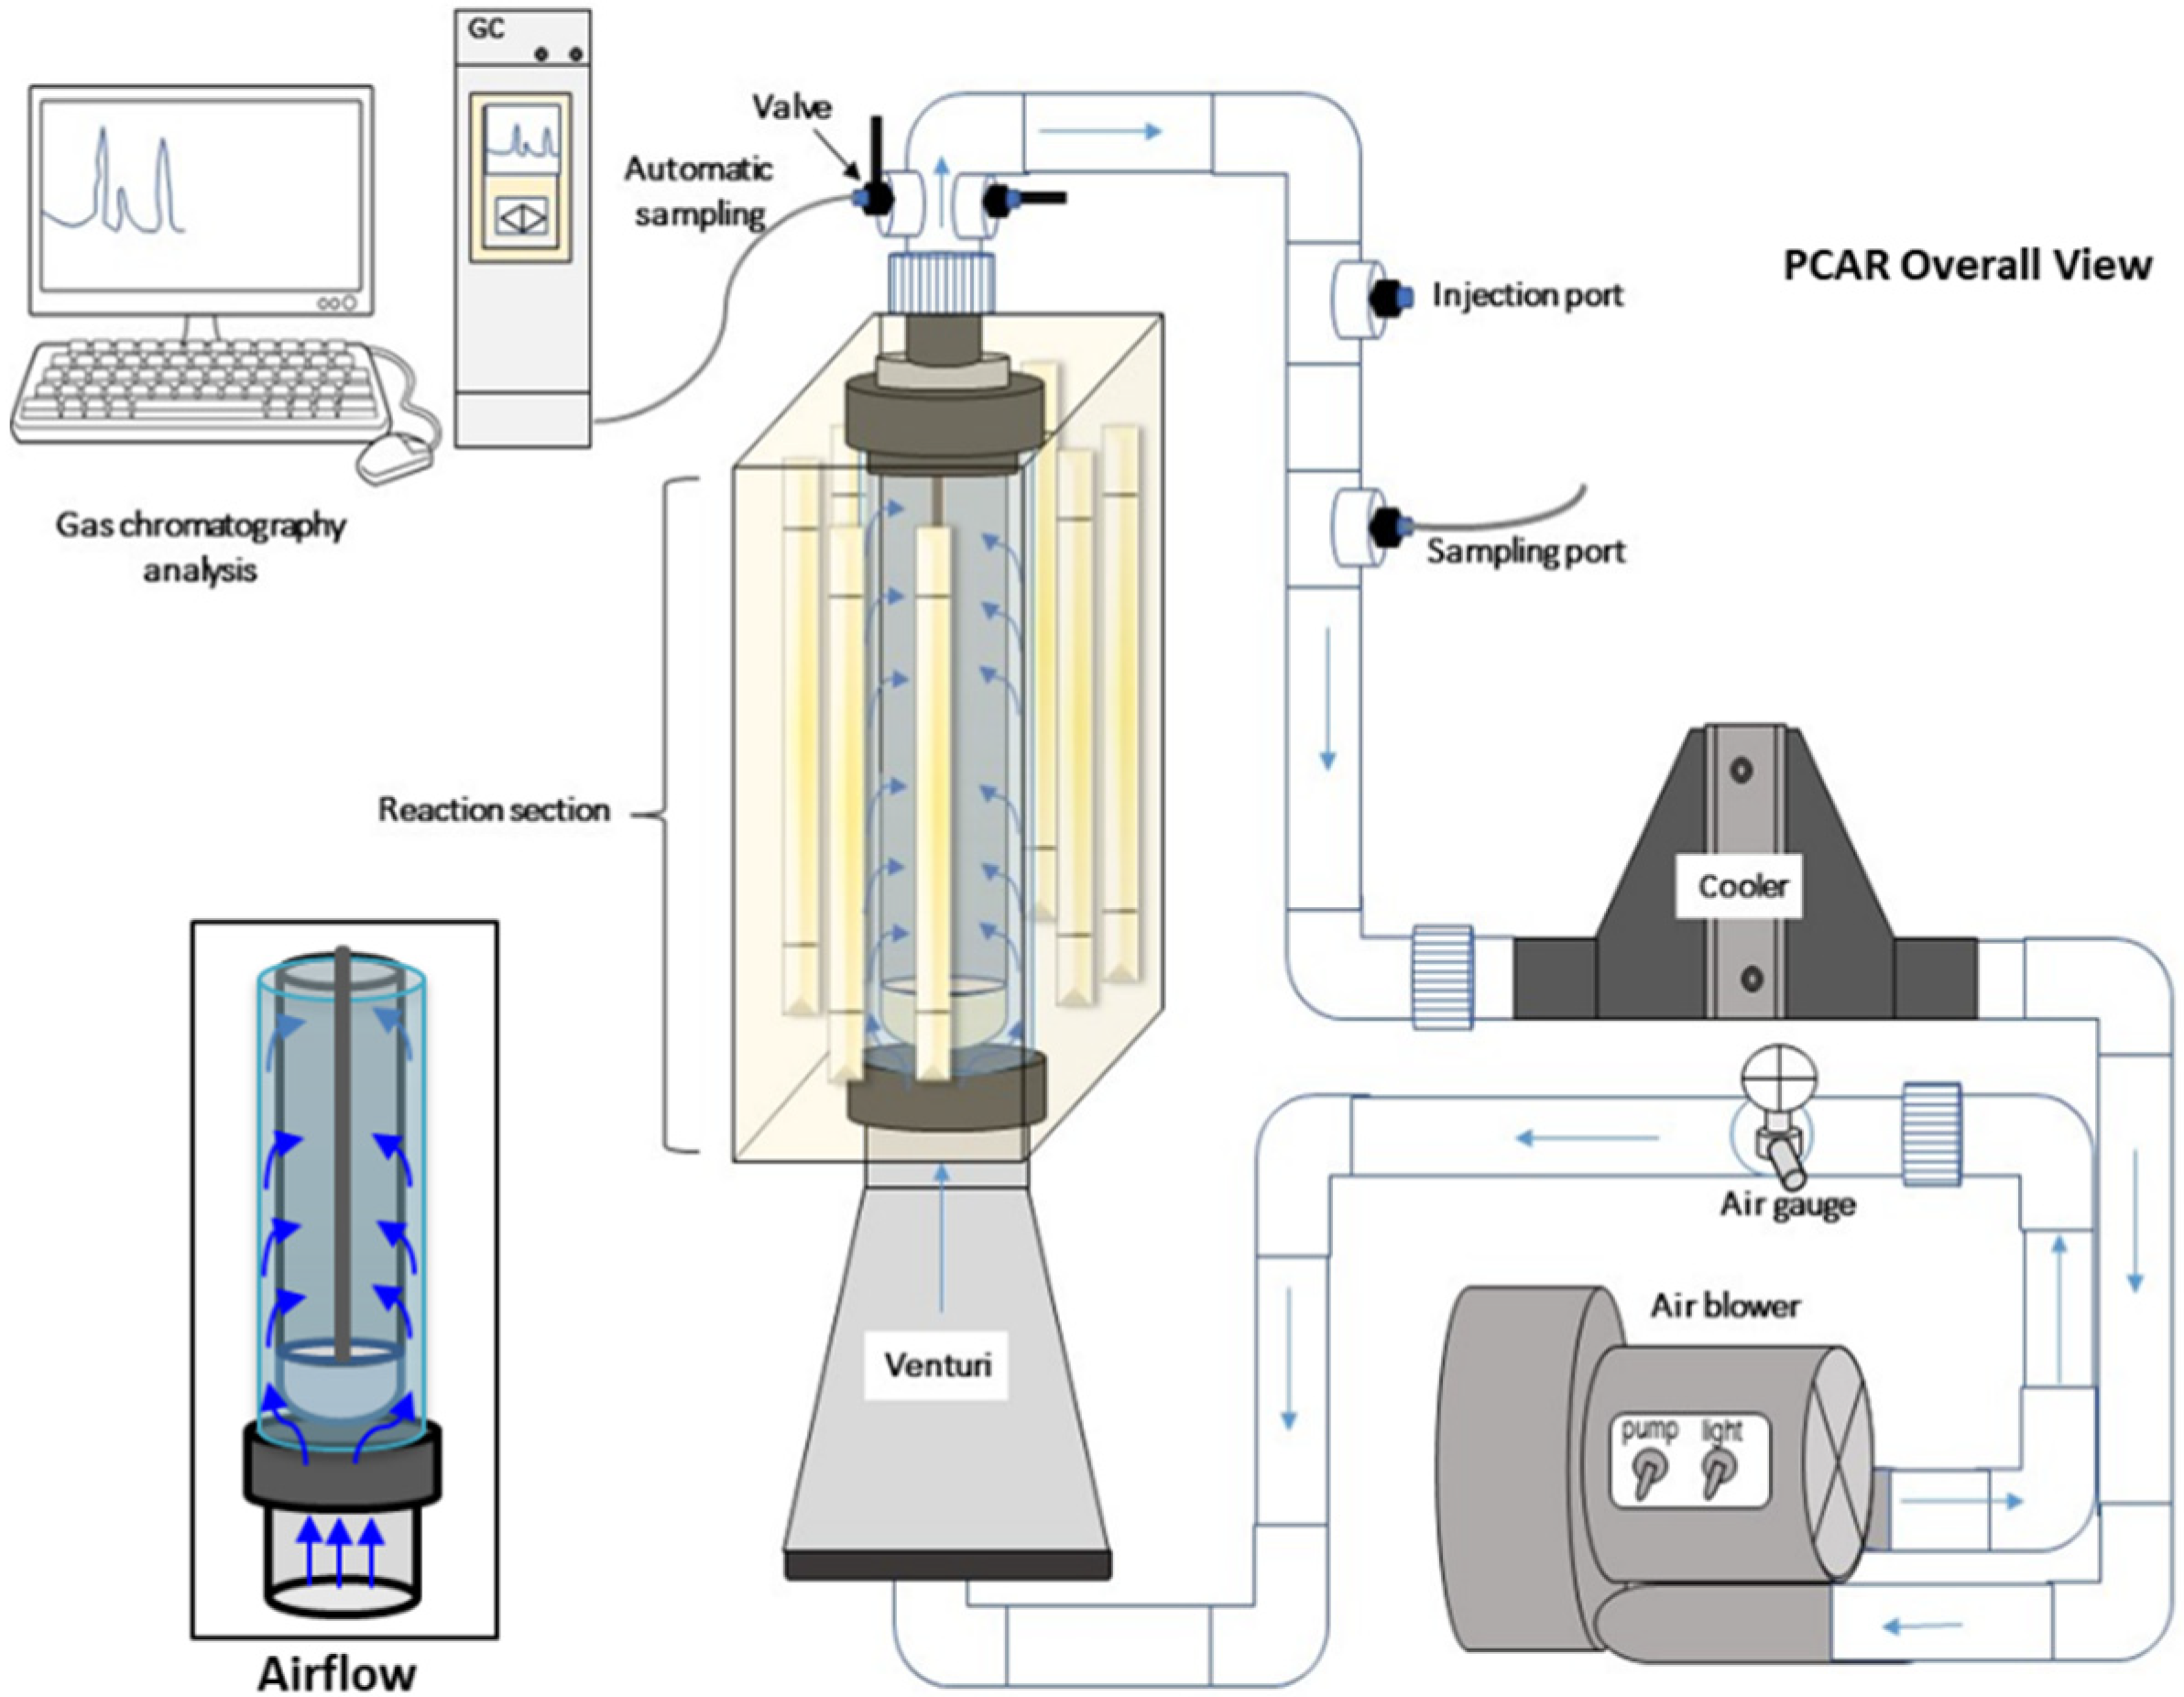
4.4. Photocatalytic Conversion of Methanol in the Photo-CREC-Air Reactor (PCAR)
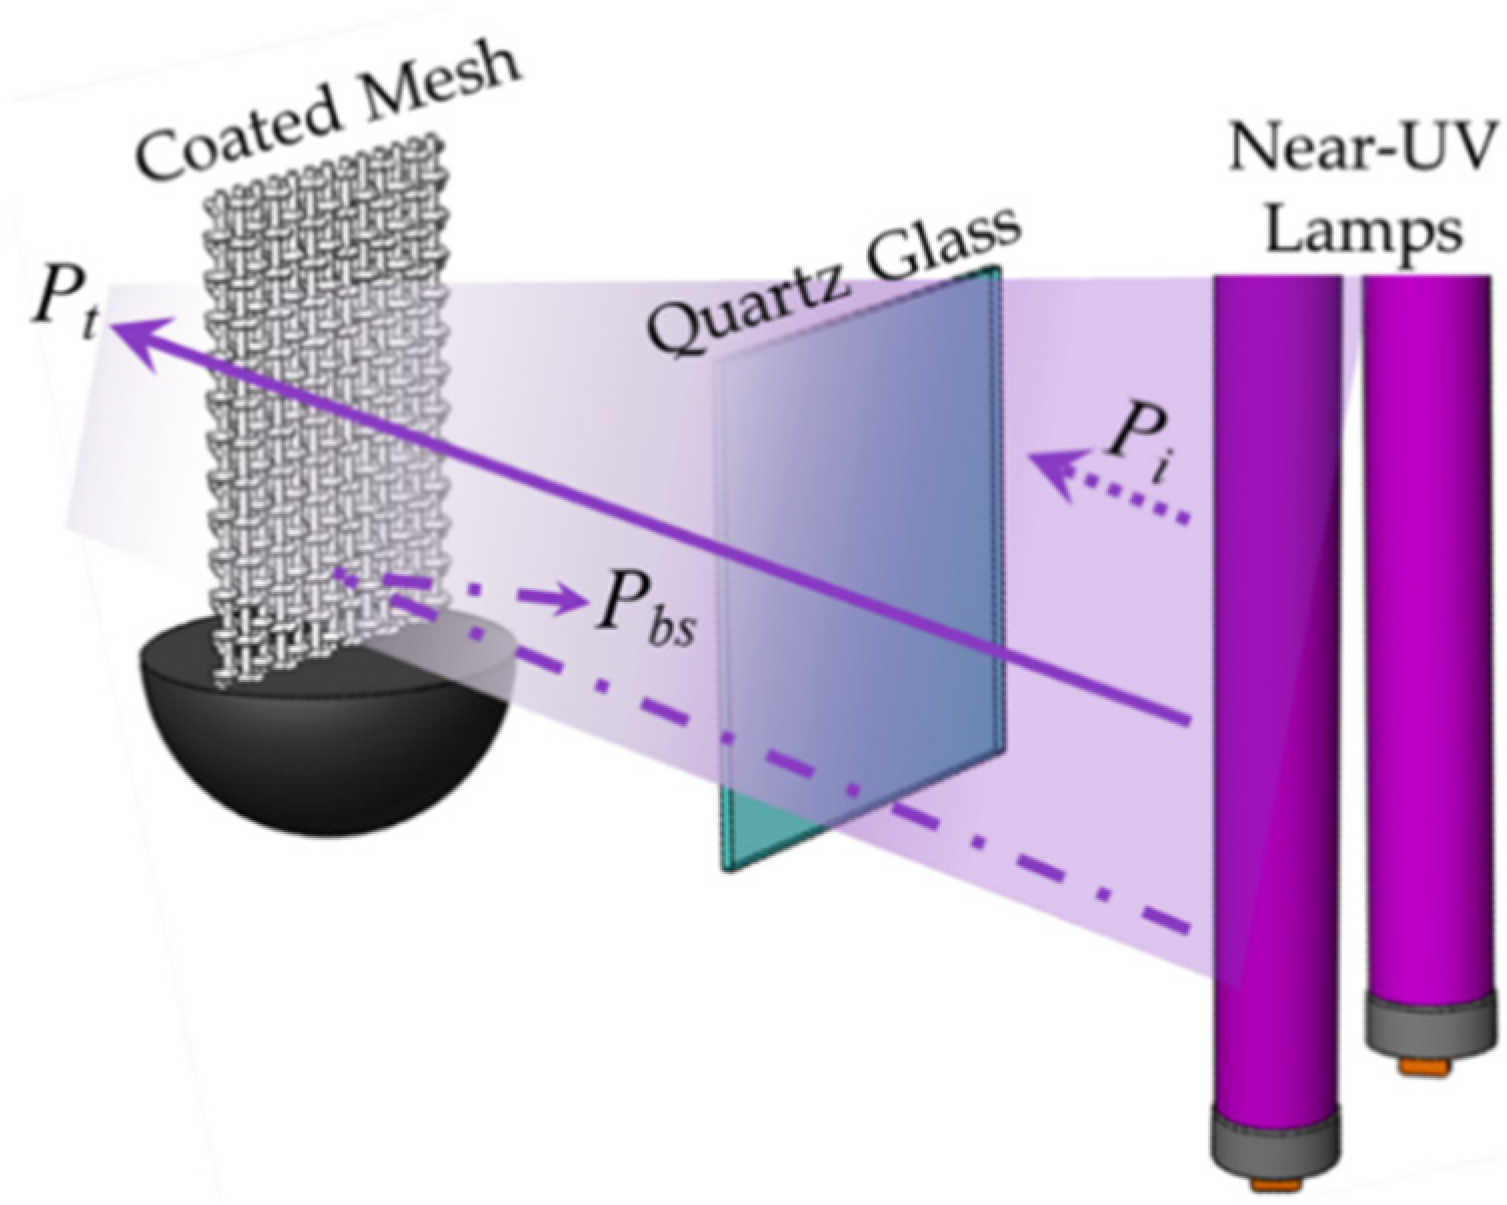
4.5. Radiation Measurements and Macroscopic Irradiation Energy Balances
4.6. Quantum Yield Efficiencies
5. Conclusions
- (a)
- It was shown that an air-assisted spray coating technique is effective to coat a N/Ag/TiO2 photocatalyst on a cylindrical stainless-steel woven wire mesh.
- (b)
- It was demonstrated that a coated N/Ag/TiO2 photocatalyst in a stainless-steel woven wire mesh in a Photo-CREC-Air unit is effective in decomposing methanol under both near-UV and visible light.
- (c)
- It was proven that a stainless-steel woven mesh immobilized N/Ag/TiO2 at 2 wt.% loading in the Photo-CREC-Air Reactor, provides a best photocatalytic activity with 60% methanol conversion and a best QY% of 35.08%, under the visible light during 180 min of irradiation time.
- (d)
- It was proven that in contrast, a stainless-steel woven wire mesh immobilized bare-TiO2 in a Photo-CREC-Air unit exhibits excellent photocatalytic activity under near-UV light showing 100% methanol (25–90 µmol/L) decomposition within 3 h and a greatest QY% of 117.9%. This photocatalyst is, however, essentially inactive under visible light.
- (e)
- It was shown that the band gap energy, the specific surface area, the external agglomerate specific surface and surface acidity, are all critical importance for determining N/Ag/TiO2 photocatalyst performance under visible light.
Supplementary Materials
Author Contributions
Funding
Acknowledgments
Conflicts of Interest
Nomenclature
| Symbols | ||
| Ag | silver | |
| C | concentration | mol L−1 |
| C0 | initial concentration | mol L−1 |
| Ct | concentration at t time | mol L−1 |
| CH3OH | methanol | |
| CO2 | carbon dioxide | |
| e− | electron | |
| Eav | average energy of photon | J photon−1 |
| Eg | energy band gap | eV |
| h+ | positive hole | |
| h | height | cm |
| H2O | water | |
| HCHO | formaldehyde | |
| HCOOH | formic acid | |
| N | nitrogen | |
| OH. | hydroxyl radical | |
| O2 | oxygen | |
| P | rate of photon | photon s−1 |
| Pi | rate of incident photons | photon s−1 |
| Pt | rate of transmitted photons | photon s−1 |
| Pbs | rate of back scattered photons | photon s−1 |
| Pabs | rate of absorbed photons | photon s−1 |
| Q | photon energy | µW2 cm−2 |
| r | reaction rate | |
| t | time | min |
| TiO2 | titanium dioxide | |
| z | axial coordinate | cm |
| Greek symbols | ||
| θ | angle | |
| v | frequency of incident photon | v(λ) = c/λ |
| c | speed of ligh | 2.99 × 10⁸ m s−1 |
| λ | wavelength | nm |
| planck’s constant | 6.63 × 10⁻³⁴ J s−1 | |
| Acronyms | ||
| BE | Binding Energy | |
| BET | Brunauer–Emmett–Teller | |
| Cb | Conduction Band | |
| CREC | Chemical Reactor Engineering Centre | |
| GC-FID | Gas Chromatograph-Flame Ionization Detector | |
| PCO | Photocatalytic Oxidation | |
| PL | Photoluminescence | |
| QY | Quantum Yield | |
| RH% | Relative Humidity % | |
| UV | Ultraviolet | |
| VIS | Visible | |
| Vb | Valence band | |
| SPR | Surface Plasmon Resonance | |
| SD | Standard Deviation | |
| STP | Standard Temperature and Pressure | |
| TPD | Temperature-Programmed Desorption | |
| XPS | X-ray Photoelectron Spectroscopy | |
| XRD | X-ray Diffraction | |
| Subscripts | ||
| abs | absorption | |
| ads | adsorption | |
| bs | back scattered | |
| i | incident | |
| irr | irradiation | |
| max | maximum | |
| min | minimum | |
| trans | transmitted | |
| ref | reflected | |
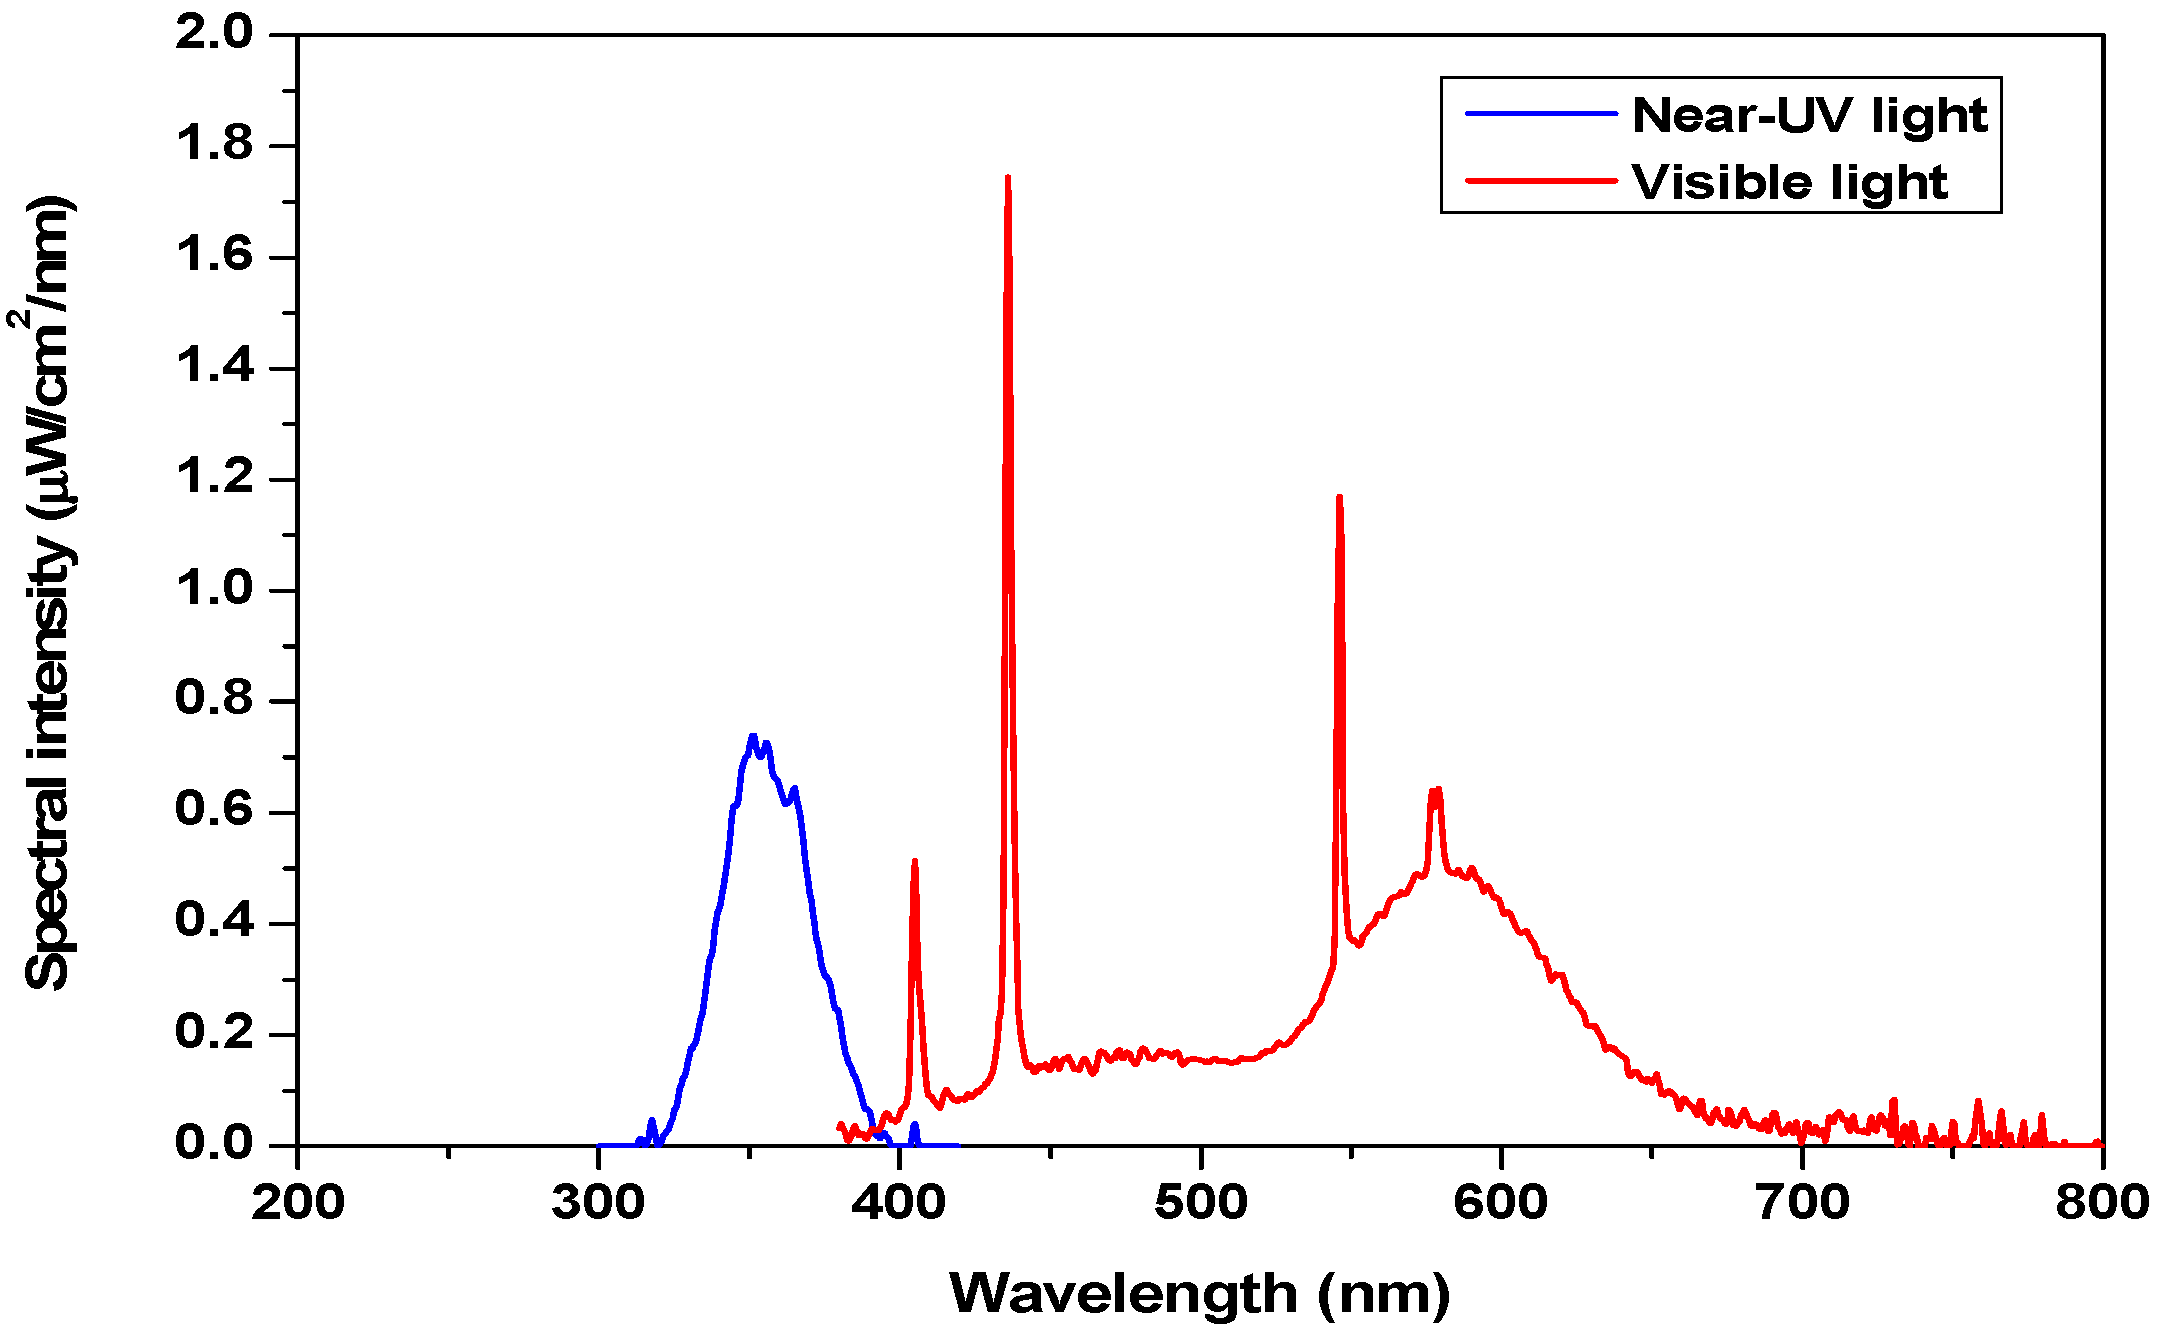
Appendix A. Near-Ultraviolet (UV) and Visible Light Spectra

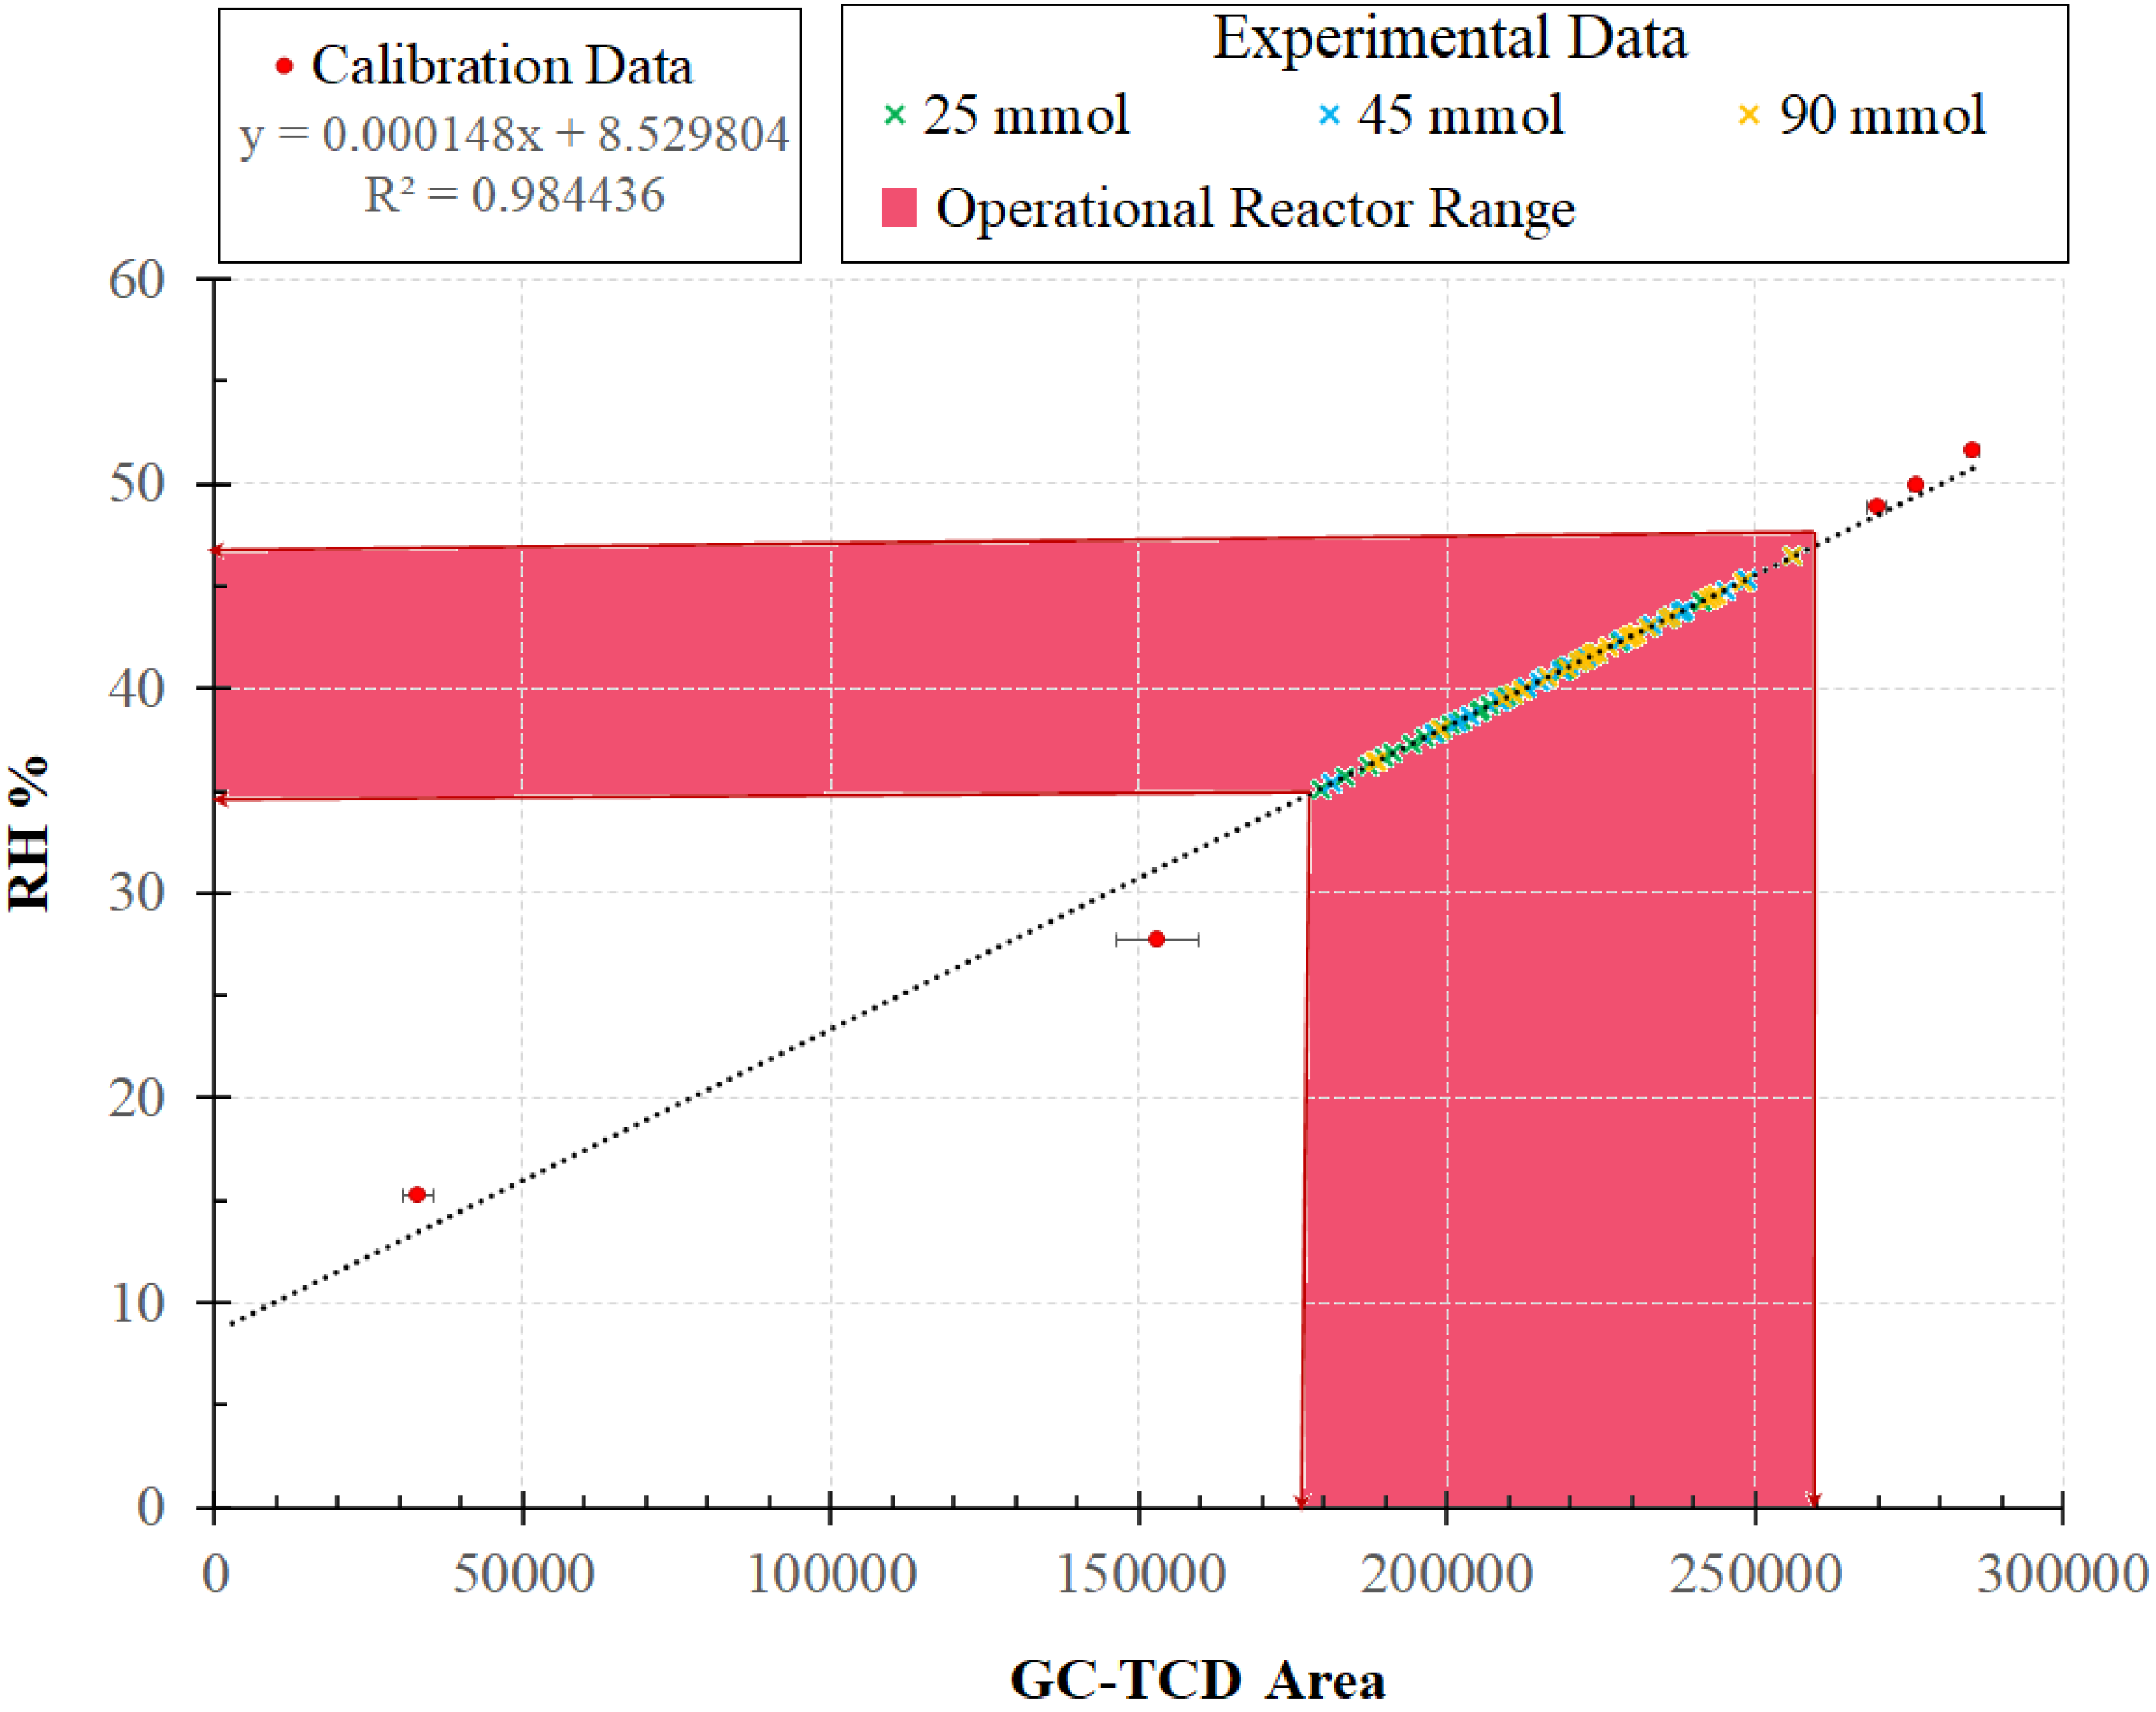
Appendix B. Relative Humidity Analysis in the Photo-CREC Air Reactor (PCAR)

Appendix C. Percentual Quantum Yield (QY%) Calculations
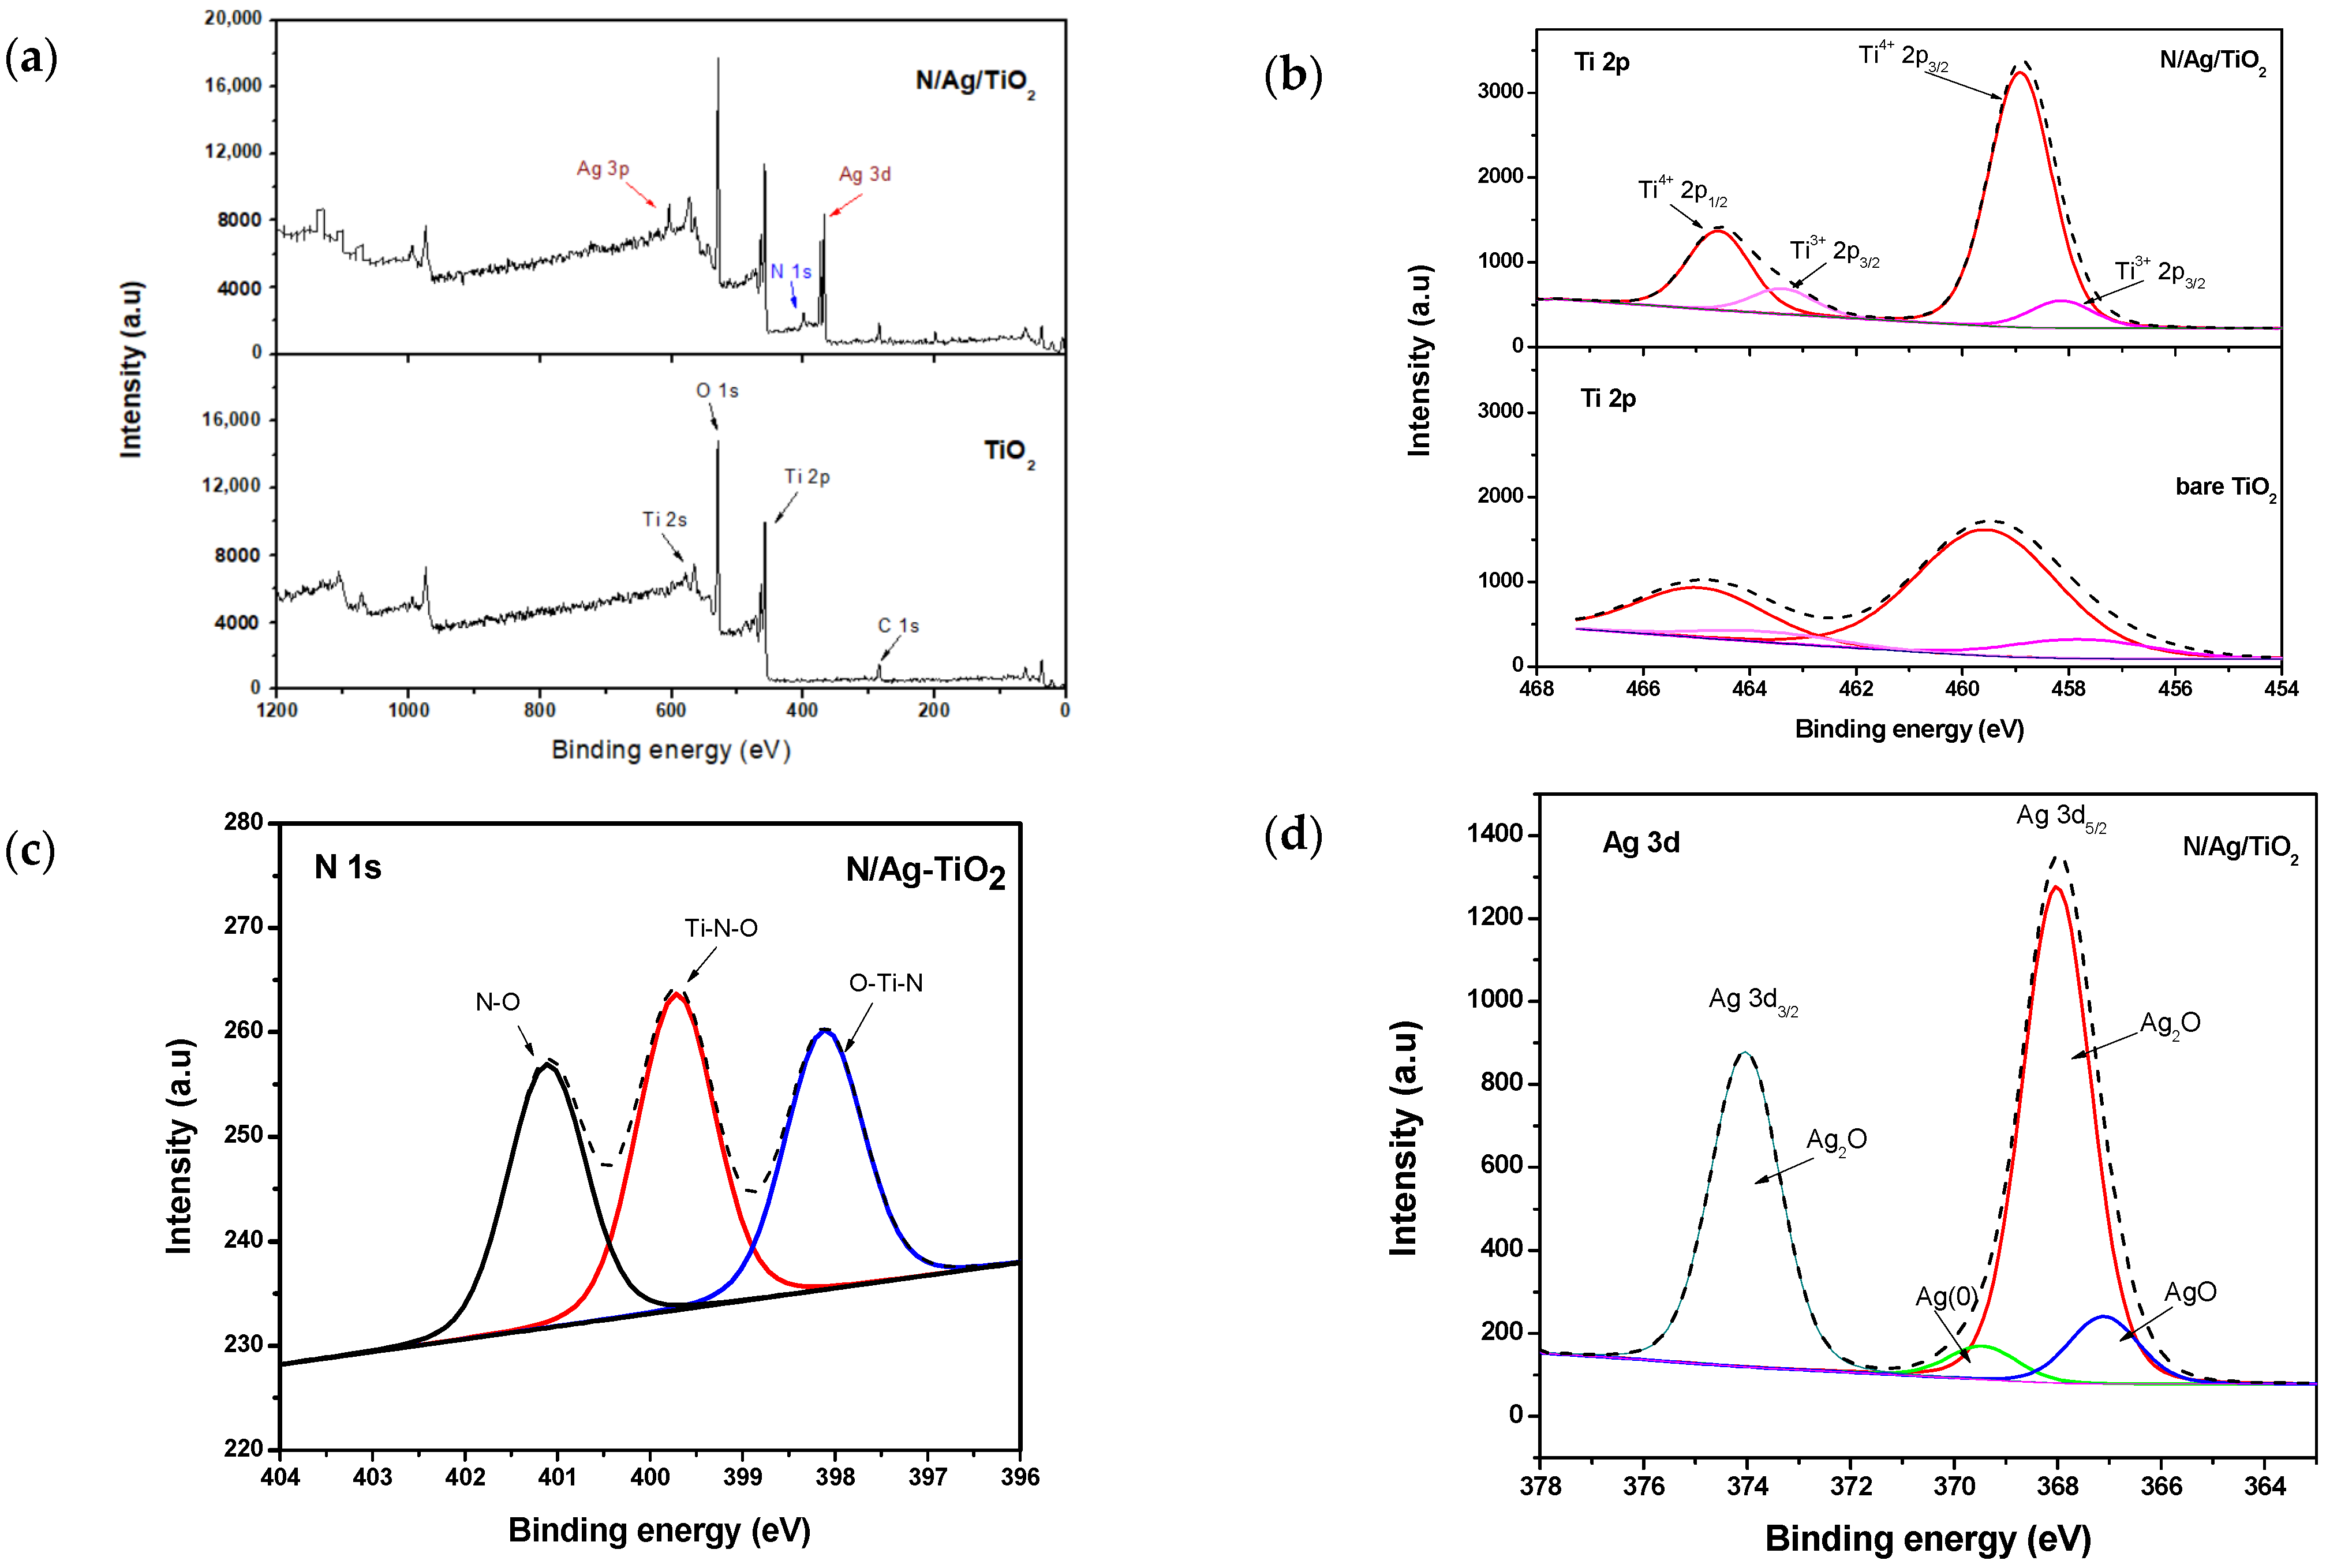
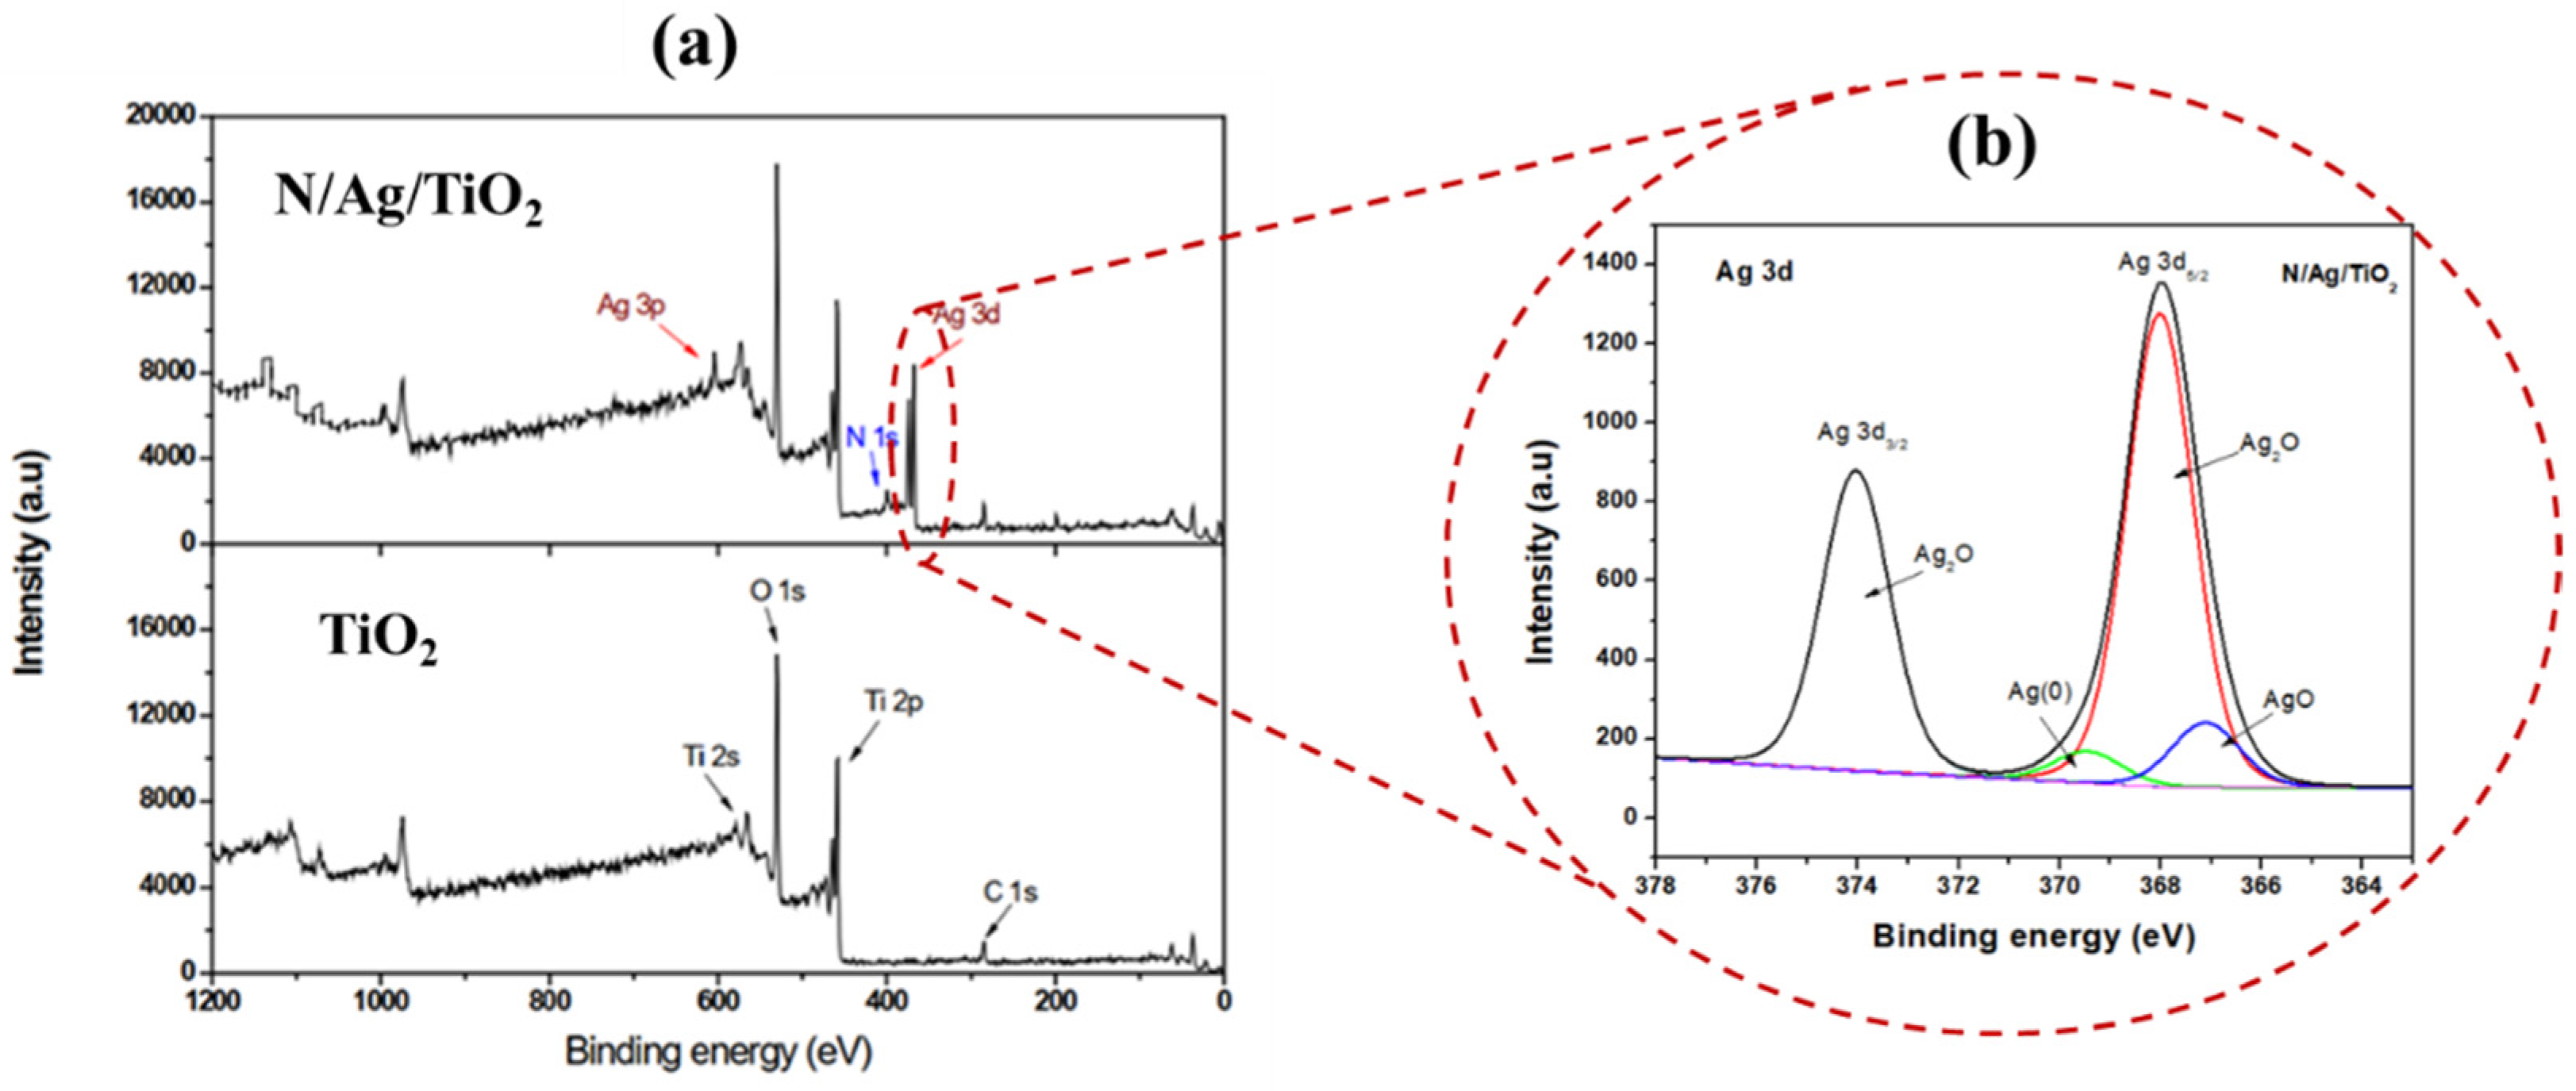
Appendix D. The X-ray Photoelectron Spectroscopy (XPS) Spectra of the N/Ag/TiO2 Photocatalysts

References
- Ozturk, B.; Yilmaz, D. Absorptive removal of volatile organic compounds from flue gas streams. Process Saf. Environ. Prot. 2006, 84, 391–398. [Google Scholar] [CrossRef]
- Zhang, Y.; Chai, X.-S.; Huang, L.; Chen, L.; Hu, H.-C.; Tian, Y.-X. Modeling and prediction of methanol air release from bleached chemi-thermo mechanical pulp board. RSC Adv. 2018. [Google Scholar] [CrossRef]
- Hauser, W.A.; Ng, S.K.C.; Brust, J.C.M. Alcohol, Seizures, and Epilepsy. Epilepsia 1988, 29, S66–S78. [Google Scholar] [CrossRef]
- Dasgupta, A.; Wahed, A. Testing for Ethyl Alcohol (Alcohol) and Other Volatiles. In Clinical Chemistry, Immunology and Laboratory Quality Control; Elsevier: Amsterdam, The Netherlands, 2014; pp. 317–335. [Google Scholar]
- Jahan, K.; Mahmood, D.; Fahim, M. Effects of methanol in blood pressure and heart rate in the rat. J. Pharm. Bioallied Sci. 2015, 7. [Google Scholar] [CrossRef] [PubMed]
- Hovda, K.E.; McMartin, K.; Jacobsen, D. Methanol and Formaldehyde Poisoning. In Critical Care Toxicology: Diagnosis and Management of the Critically Poisoned Patient; Brent, J., Burkhart, K., Dargan, P., Hatten, B., Megarbane, B., Palmer, R., White, J., Eds.; Springer International Publishing: Cham, Switzerland, 2017; pp. 1–18. ISBN 978-3-319-20790-2. [Google Scholar]
- Yan, T.; Long, J.; Shi, X.; Wang, D.; Li, Z.; Wang, X. Efficient Photocatalytic Degradation of Volatile Organic Compounds by Porous Indium Hydroxide Nanocrystals. Environ. Sci. Technol. 2010, 44, 1380–1385. [Google Scholar] [CrossRef] [PubMed]
- Zou, W.; Gao, B.; Ok, Y.S.; Dong, L. Integrated adsorption and photocatalytic degradation of volatile organic compounds (VOCs) using carbon-based nanocomposites: A critical review. Chemosphere 2019, 218, 845–859. [Google Scholar] [CrossRef]
- Escobedo, S.; de Lasa, H. Photocatalysis for Air Treatment Processes: Current Technologies and Future Applications for the Removal of Organic Pollutants and Viruses. Catalysts 2020, 10, 966. [Google Scholar] [CrossRef]
- Shin Koe, W.; Wen Lee, J.; Chan Chong, W.; Ling Pang, Y.; Ching Sim, L. An overview of photocatalytic degradation: Photocatalysts, mechanisms, and development of photocatalytic membrane. Environ. Sci. Pollut. Res. 2020, 27, 2522–2565. [Google Scholar] [CrossRef]
- Skocaj, M.; Filipic, M.; Petkovic, J.; Novak, S.; Novak, S.; Stefan, J. Titanium dioxide in our everyday life; is it safe? Radiol. Oncol. 2011, 45, 227–247. [Google Scholar] [CrossRef] [PubMed]
- Manangon-Perugachi, L.E.; Smeets, V.; Vivian, A.; Kainthla, I.; Eloy, P.; Aprile, C.; Debecker, D.P.; Gaigneaux, E.M. Mesoporous Methyl-Functionalized Titanosilicate Produced by Aerosol Process for the Catalytic Epoxidation of Olefins. Catalysts 2021, 11, 196. [Google Scholar] [CrossRef]
- Sirivallop, A.; Areerob, T.; Chiarakorn, S. Enhanced Visible Light Photocatalytic Activity of N and Ag Doped and Co-Doped TiO2 Synthesized by Using an In-Situ Solvothermal Method for Gas Phase Ammonia Removal. Catalysts 2020, 10, 251. [Google Scholar] [CrossRef]
- Miyauchi, M.; Ikezawa, A.; Tobimatsu, H.; Irie, H.; Hashimoto, K. Zeta potential and photocatalytic activity of nitrogen doped TiO2 thin films. Phys. Chem. Chem. Phys. 2004, 6, 865–870. [Google Scholar] [CrossRef]
- Lugo-Vega, C.S.; Moreira, J.; Serrano-Rosales, B.; de Lasa, H. Kinetics of the pollutant photocatalytic conversion in a Photo-CREC-Air Reactor. Chem. Eng. J. 2017, 317, 1069–1082. [Google Scholar] [CrossRef]
- Yu, J.; Liu, Z.; Zhang, H.; Huang, T.; Han, J.; Zhang, Y.; Chong, D. Synergistic effect of N- and F-codoping on the structure and photocatalytic performance of TiO2. J. Environ. Sci. 2015, 28. [Google Scholar] [CrossRef]
- Hassan, M.S. One Pot Synthesis of CoTiO3-TiO2 Composite Nanofibers and its Application in Dye Degradation. Int. J. Chemoinform. Chem. Eng. 2019, 8, 47–56. [Google Scholar] [CrossRef]
- Kočí, K.; Troppová, I.; Edelmannová, M.; Starostka, J.; Matějová, L.; Lang, J.; Reli, M.; Drobná, H.; Rokicińska, A.; Kuśtrowski, P.; et al. Photocatalytic decomposition of methanol over La/TiO2 materials. Environ. Sci. Pollut. Res. 2018, 25, 34818–34825. [Google Scholar] [CrossRef]
- De Lasa, H.; Serrano, B.; Salaices, M. Photocatalytic Reaction Engineering; Springer US: Boston, MA, USA, 2005; ISBN 978-1-4419-3627-1. [Google Scholar]
- Elmehasseb, I.; Kandil, S.; Elgendy, K. Advanced visible-light applications utilizing modified Zn-doped TiO2 nanoparticles via non-metal in situ dual doping for wastewater detoxification. Optik 2020, 213, 164654. [Google Scholar] [CrossRef]
- Gogoi, D.; Namdeo, A.; Golder, A.K.; Peela, N.R. Ag-doped TiO2 photocatalysts with effective charge transfer for highly efficient hydrogen production through water splitting. Int. J. Hydrog. Energy 2020, 45, 2729–2744. [Google Scholar] [CrossRef]
- Garcia-Hernandez, J.M.; Serrano-Rosales, B.; de Lasa, H. Energy Efficiencies in a Photo-CREC-Air Reactor: Conversion of Model Organic Pollutants in Air. Ind. Eng. Chem. Res. 2012, 51, 5715–5727. [Google Scholar] [CrossRef]
- Gomathi Devi, L.; Narasimha Murthy, B. Characterization of Mo Doped TiO2 and Its Enhanced Photo Catalytic Activity Under Visible Light. Catal. Lett. 2008, 125. [Google Scholar] [CrossRef]
- Chiodo, L.; García-Lastra, J.M.; Iacomino, A.; Ossicini, S.; Zhao, J.; Petek, H.; Rubio, A. Self-energy and excitonic effects in the electronic and optical properties of TiO2 crystalline phases. Phys. Rev. B 2010, 82, 12. [Google Scholar] [CrossRef]
- Deloid, G.; Cohen, J.M.; Darrah, T.; Derk, R.; Rojanasakul, L.; Pyrgiotakis, G.; Wohlleben, W.; Demokritou, P. ARTICLE Estimating the effective density of engineered nanomaterials for in vitro dosimetry. Nat. Commun. 2014, 5, 10. [Google Scholar] [CrossRef] [PubMed]
- Xing, J.; Li, Y.H.; Jiang, H.B.; Wang, Y.; Yang, H.G. The size and valence state effect of Pt on photocatalytic H2 evolution over platinized TiO2 photocatalyst. Int. J. Hydrog. Energy 2014, 39, 1237–1242. [Google Scholar] [CrossRef]
- Rusinque, B.; Escobedo, S.; de Lasa, H. Photoreduction of a Pd-Doped Mesoporous TiO2 Photocatalyst for Hydrogen Production under Visible Light. Catalysts 2020, 10, 74. [Google Scholar] [CrossRef]
- Rusinque, B.; Escobedo, S.; de Lasa, H. Photocatalytic Hydrogen Production Under Near-UV Using Pd-Doped Mesoporous TiO2 and Ethanol as Organic Scavenger. Catalysts 2019, 9, 33. [Google Scholar] [CrossRef]
- Pielaszek, J. X-ray Diffraction from Nanostructured Materials. In Nanostructured Materials; Kluwer Academic Publishers: Boston, MA, USA, 2005; pp. 127–143. [Google Scholar]
- Liu, Y.; Chen, X.; Li, J.; Burda, C. Photocatalytic degradation of azo dyes by nitrogen-doped TiO2 nanocatalysts. Chemosphere 2005, 61, 11–18. [Google Scholar] [CrossRef] [PubMed]
- Bokuniaeva, A.O.; Vorokh, A.S. Estimation of particle size using the Debye equation and the Scherrer formula for polyphasic TiO2 powder. J. Phys. Conf. Ser. 2019, 1410, 6. [Google Scholar] [CrossRef]
- Yang, S.; Huang, N.; Jin, Y.M.; Zhang, H.Q.; Su, Y.H.; Yang, H.G. Crystal shape engineering of anatase TiO2 and its biomedical applications. CrystEngComm 2015, 17, 13. [Google Scholar] [CrossRef]
- Agyeman, D.A.; Song, K.; Kang, S.H.; Jo, M.R.; Cho, E.; Kang, Y.-M. An improved catalytic effect of nitrogen-doped TiO2 nanofibers for rechargeable Li–O2 batteries; the role of oxidation states and vacancies on the surface. J. Mater. Chem. A 2015, 3. [Google Scholar] [CrossRef]
- Mogal, S.I.; Gandhi, V.G.; Mishra, M.; Tripathi, S.; Shripathi, T.; Joshi, P.A.; Shah, D.O. Single-Step Synthesis of Silver-Doped Titanium Dioxide: Influence of Silver on Structural, Textural, and Photocatalytic Properties. Ind. Eng. Chem. Res. 2014, 53, 5749–5758. [Google Scholar] [CrossRef]
- Wen, J.; Li, X.; Liu, W.; Fang, Y.; Xie, J.; Xu, Y. Photocatalysis fundamentals and surface modification of TiO2 nanomaterials. Chin. J. Catal. 2015, 36, 2049–2071. [Google Scholar] [CrossRef]
- Wang, Y.; Li, L.; Huang, X.; Li, Q.; Li, G. New insights into fluorinated TiO2 (brookite, anatase and rutile) nanoparticles as efficient photocatalytic redox catalysts. RSC Adv. 2015, 5, 34302–34313. [Google Scholar] [CrossRef]
- Pellegrino, F.; Pellutiè, L.; Sordello, F.; Minero, C.; Ortel, E.; Hodoroaba, V.-D.; Maurino, V. Influence of agglomeration and aggregation on the photocatalytic activity of TiO2 nanoparticles. Appl. Catal. B Environ. 2017, 216. [Google Scholar] [CrossRef]
- Chen, F.; Johnston, R.L. Plasmonic properties of silver nanoparticles on two substrates. Plasmonics 2009, 4, 147–152. [Google Scholar] [CrossRef]
- Liao, C.; Li, Y.; Tjong, S.C. Visible-light active titanium dioxide nanomaterials with bactericidal properties. Nanomaterials 2020, 10, 124. [Google Scholar] [CrossRef]
- Serra, A.; Manno, D.; Buccolieri, A.; Carbone, G.G.; Calcagnile, L. Photochromic properties in silver-doped titania nanoparticles. Mater. Res. Express 2019, 6. [Google Scholar] [CrossRef]
- Yang, Y.; Liu, E.; Dai, H.; Kang, L.; Wu, H. Photocatalytic activity of Ag-TiO2-graphene ternary nanocomposites and application in hydrogen evolution by water splitting. Int. J. Hydrog. Energy 2013, 39, 7664–7671. [Google Scholar] [CrossRef]
- Nie, J.; Schneider, J.; Sieland, F.; Bahnemann, D.W. New insights into the surface plasmon resonance (SPR) driven photocatalytic H2 production of Au–TiO2. RSC Adv. 2018, 2, 25881–25887. [Google Scholar] [CrossRef]
- Zhang, Z.; Wang, W.; Gao, E.; Sun, S.; Zhang, L. Photocatalysis Coupled with Thermal Effect Induced by SPR on Ag-Loaded Bi2WO6 with Enhanced Photocatalytic Activity. J. Phys. Chem. C 2012, 116, 25898–25903. [Google Scholar] [CrossRef]
- Bakar, S.A.; Ribeiro, C. Nitrogen-doped titanium dioxide: An overview of material design and dimensionality effect over modern applications. J. Photochem. Photobiol. C Photochem. Rev. 2016, 27, 1–29. [Google Scholar] [CrossRef]
- Batalović, K.; Bundaleski, N.; Radaković, J.; Abazović, N.; Mitrić, M.; Silva, R.A.; Savić, M.; Belošević-Čavor, J.; Rakočević, Z.; Rangel, C.M. Modification of N-doped TiO2 photocatalysts using noble metals (Pt, Pd)—A combined XPS and DFT study. Phys. Chem. Chem. Phys. 2017, 19, 7062–7071. [Google Scholar] [CrossRef]
- Bharti, B.; Kumar, S.; Lee, H.-N.; Kumar, R. Formation of oxygen vacancies and Ti3+ state in TiO2 thin film and enhanced optical properties by air plasma treatment. Sci. Rep. 2016, 6, 12. [Google Scholar] [CrossRef] [PubMed]
- Yang, X.H.; Fu, H.T.; Wang, X.C.; Yang, J.L.; Jiang, X.C.; Yu, A.B. Synthesis of silver-titanium dioxide nanocomposites for antimicrobial applications. J. Nanopart. Res. 2014, 2526, 13. [Google Scholar] [CrossRef]
- Dozzi, M.V.; Selli, E. Doping TiO2 with p-block elements: Effects on photocatalytic activity. J. Photochem. Photobiol. C Photochem. Rev. 2013, 14, 13–28. [Google Scholar] [CrossRef]
- Lynch, J.; Giannini, C.; Cooper, J.K.; Loiudice, A.; Sharp, I.D.; Buonsanti, R. Substitutional or Interstitial Site-Selective Nitrogen Doping in TiO2 Nanostructures. J. Phys. Chem. C 2015, 119, 29. [Google Scholar] [CrossRef]
- Kumar, S.G.; Devi, L.G. Review on Modified TiO2 Photocatalysis under UV/Visible Light: Selected Results and Related Mechanisms on Interfacial Charge Carrier Transfer Dynamics. J. Phys. Chem. A 2011, 115, 13211–13241. [Google Scholar] [CrossRef]
- Pisarek, M.; Krawczyk, M.; Hołdyński, M.; Lisowski, W. Plasma Nitriding of TiO2 Nanotubes: N-Doping In Situ Investigations Using XPS. ACS Omega 2020, 5. [Google Scholar] [CrossRef]
- Tao, X.U.; Mo, W.; Tong, W. Effects of N Doping on the Microstructures and Optical Properties of TiO2. J. Wuhan Univ. Technol. Sci. Ed. 2019, 34, 55–63. [Google Scholar] [CrossRef]
- Zielińska, A.; Kowalska, E.; Sobczak, J.W.; Łącka, I.; Gazda, M.; Ohtani, B.; Hupka, J.; Zaleska, A. Silver-doped TiO2 prepared by microemulsion method: Surface properties, bio- and photoactivity. Sep. Purif. Technol. 2010, 72, 309–318. [Google Scholar] [CrossRef]
- Seery, M.K.; George, R.; Floris, P.; Pillai, S.C. Silver doped titanium dioxide nanomaterials for enhanced visible light photocatalysis. J. Photochem. Photobiol. A Chem. 2007, 189. [Google Scholar] [CrossRef]
- Santos, L.M.; Machado, W.A.; França, M.D.; Borges, K.A.; Paniago, R.M.; Patrocinio, A.O.T.; Machado, A.E.H. Structural characterization of Ag-doped TiO2 with enhanced photocatalytic activity. RSC Adv. 2015, 5. [Google Scholar] [CrossRef]
- Lv, Q.; Ren, X.; Liu, L.; Guan, W.; Liu, A. Theoretical investigation of methanol oxidation on Pt and PtNi catalysts. Ionics 2019. [Google Scholar] [CrossRef]
- Lugo-Vega, C.S.; Serrano-Rosales, B.; de Lasa, H. Energy efficiency limits in Photo-CREC-Air photocatalytic reactors. Chem. Eng. Sci. 2016, 156. [Google Scholar] [CrossRef]
- Makuła, P.; Pacia, M.; Macyk, W. How To Correctly Determine the Band Gap Energy of Modified Semiconductor Photocatalysts Based on UV-Vis Spectra. J. Phys. Chem. Lett. 2018, 9, 6814–6817. [Google Scholar] [CrossRef]
- Lugo-Vega, C.S.; Serrano-Rosales, B.; de Lasa, H. Immobilized particle coating for optimum photon and TiO2 utilization in scaled air treatment photo reactors. Appl. Catal. B Environ. 2016, 198. [Google Scholar] [CrossRef]
- Escobedo Salas, S.; Serrano Rosales, B.; de Lasa, H. Quantum yield with platinum modified TiO2 photocatalyst for hydrogen production. Appl. Catal. B Environ. 2013, 140–141, 523–536. [Google Scholar] [CrossRef]
- Escobedo, S.; Rusinque, B.; de Lasa, H. Photochemical Thermodynamic Efficiency Factors (PTEFs) for Hydrogen Production Using Different TiO2 Photocatalysts. Ind. Eng. Chem. Res. 2019, 58. [Google Scholar] [CrossRef]
- Zhang, L.; Moralejo, C.; Anderson, W.A. A review of the influence of humidity on photocatalytic decomposition of gaseous pollutants on TiO2-based catalysts. Can. J. Chem. Eng. 2020, 98, 263–273. [Google Scholar] [CrossRef]
- Kim, J.S.; Leet, T.K. Effect of Humidity on the Photocatalytic Degradation of Trichloroethylene in Gas Phase over TiO2 Thin Films Treated by Different Conditions. Korean J. Chem. Eng. 2001, 18, 935–940. [Google Scholar] [CrossRef]
- Obee, T.N.; Brown, R.T. TiO2 Photocatalysis for Indoor Air Applications: Effects of Humidity and Trace Contaminant Levels on the Oxidation Rates of Formaldehyde, Toluene and 1,3-Butadiene. Environ. Sci. Technol. 1995, 29, 1223–1231. [Google Scholar] [CrossRef]
- Humidifiers: Air Moisture Eases Skin, Breathing Symptoms—Mayo Clinic. Available online: https://www.mayoclinic.org/diseases-conditions/common-cold/in-depth/humidifiers/art-20048021 (accessed on 25 March 2021).
- The Ideal Indoor Humidity Level for Your Home|HVAC.com®. Available online: https://www.hvac.com/faq/recommended-humidity-level-home/ (accessed on 25 March 2021).
- Albiter, E.; Valenzuela, M.A.; Alfaro, S.; Valverde-Aguilar, G.; Martínez-Pallares, F.M. Photocatalytic deposition of Ag nanoparticles on TiO2: Metal precursor effect on the structural and photoactivity properties. J. Saudi Chem. Soc. 2015, 19, 563–573. [Google Scholar] [CrossRef]
- Rolim, W.R.; Pieretti, J.C.; Renó, D.L.S.; Lima, B.A.; Nascimento, M.H.M.; Ambrosio, F.N.; Lombello, C.B.; Brocchi, M.; De Souza, A.C.S.; Seabra, A.B. Antimicrobial Activity and Cytotoxicity to Tumor Cells of Nitric Oxide Donor and Silver Nanoparticles Containing PVA/PEG Films for Topical Applications. ACS Appl. Mater. Interfaces 2019. [Google Scholar] [CrossRef]
- Fahmy, A.; El-Nasser, K.S.; Ali, I.O.; Salama, T.M.; Altmann, K.; Friedrich, J. Tuned interactions of silver nanoparticles with ZSM-5 zeolite by adhesion-promoting poly(acrylic acid) deposited by electrospray ionization (ESI). J. Adhes. Sci. Technol. 2017, 31, 2641–2656. [Google Scholar] [CrossRef]
- Yuan, R.; Zhou, B.; Hua, D.; Shi, C. Effect of metal ion-doping on characteristics and photocatalytic activity of TiO2 nanotubes for removal of humic acid from water. Front. Environ. Sci. Eng. 2015, 9, 850–860. [Google Scholar] [CrossRef]


| Samples | Crystal Phase (%) | Crystal Size (nm) a | Average Agglomerate Size (nm) b | ρp (g·cm−3) c | External Agglomerate Specific Surface (m2·g−1) d | SBET (m2·g−1) e | Vp (cm3·g−1) e | Dp (nm) e |
|---|---|---|---|---|---|---|---|---|
| TiO2 | 100% Anatase | 61.4 | 132.9 | 3.91 | 16.6 | 11.6 | 0.02 | 7.9 |
| N/Ag/TiO2 | 100% Anatase | 11.4 | 61.8 | 4.25 | 38.1 | 101.3 | 0.26 | 15.9 |
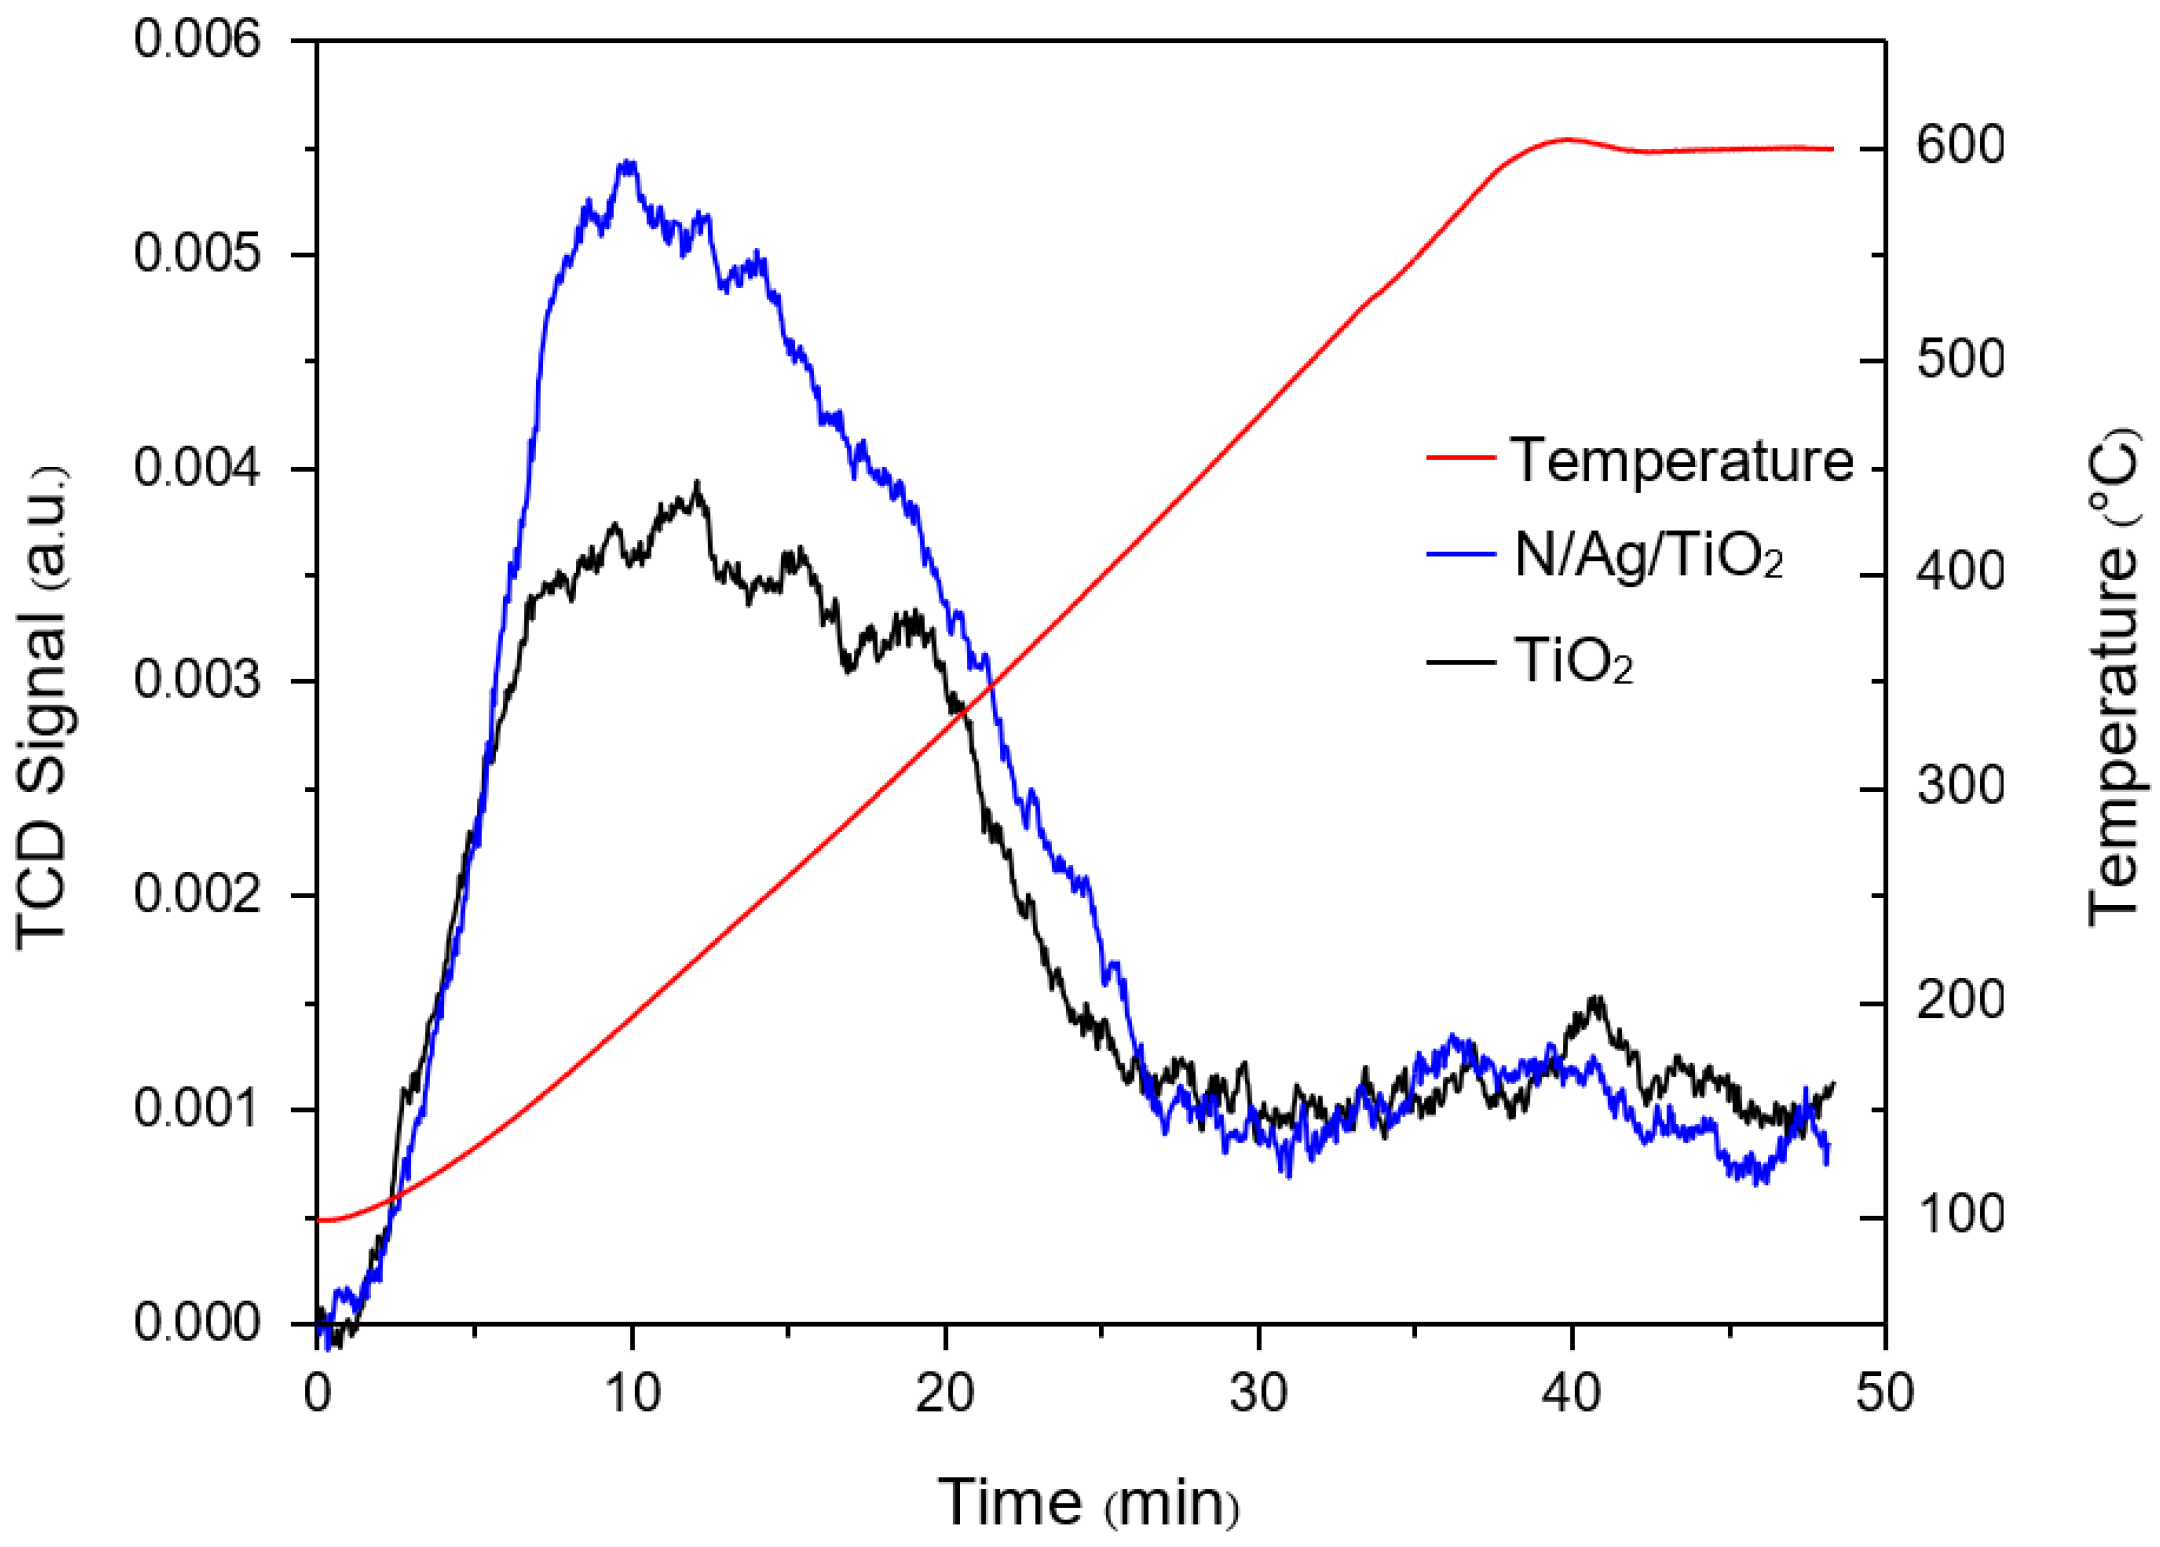
| Catalyst | Volumetric Change (cm3·min−1) (STP) | NH3 Uptake (cm3·g−1) (STP) | NH3 Uptake cm3/m2 |
|---|---|---|---|
| Bare-TiO2 | 0.043 ± 0.002 | 7.1 ± 0.3 | 0.61 |
| N/Ag/TiO2 | 0.064 ± 0.003 | 10.8 ± 0.5 | 0.11 |
| Ti Content | O Content | N Content | Ag Content | |||||||
|---|---|---|---|---|---|---|---|---|---|---|
| Samples | (at. %) | |||||||||
| Ti4+ | Ti3+ | Ti-OH (531.9 eV) | Ti-O-Ti (530.8 eV) | N-O (401.1 eV) | N-Ti-O (399.7 eV) | Ti-N-O (398.1 eV) | Ag(0) (369.8 eV) | Ag2O (368.4 eV) | AgO (367.8 eV) | |
| Bare-TiO2 | 94.24 | 5.76 | 20.09 | 79.91 | - | - | - | - | - | - |
| N/Ag/TiO2 | 86.41 | 13.59 | 11.0 | 89.0 | 29.04 | 36.99 | 33.97 | 5.36 | 83.93 | 10.71 |
| Light Source/ Photocatalyst | Pi (Photon s−1) | Pt (Photon s−1) | Pbs (Photon s−1) | Pa (Photon s−1) |
|---|---|---|---|---|
| Near-UV light | ||||
| Bare-TiO2 | 5.06 × 10¹⁸ | 9.91 × 10¹⁶ | 7.78 × 10¹⁷ | 4.18 × 10¹⁸ |
| N/Ag/TiO2 | 1.45 × 10¹⁷ | 4.60 × 10¹⁷ | 4.46 × 10¹⁸ | |
| Visible light | ||||
| Bare-TiO2 | 4.85 × 10¹⁸ | 2.50 × 10¹⁸ | 8.00 × 10¹⁷ | 1.55 × 10¹⁸ |
| N/Ag/TiO2 | 8.80 × 10¹⁷ | 1.65 × 10¹⁶ | 3.95 × 10¹⁸ | |
| Photocatalyst | Degradation Rate (%): Time (min) | Kinetic Rate Constant | ||||
|---|---|---|---|---|---|---|
| Near UV Light | Visible Light | Near UV Light | Visible Light | |||
| min−1 | R2 | min−1 | R2 | |||
| 0.5 wt.% bare-TiO2 | 100%: 150 min | inactive | 9.4 × 10⁻³ | 0.99 | - | - |
| 1.0 wt.% bare-TiO2 | 100%: 120 min | - | 1.3 × 10⁻² | 0.95 | - | - |
| 2.0 wt.% bare-TiO2 | 100%: 90 min | - | 2.2 × 10⁻² | 0.98 | - | - |
| 0.5 wt.% N/Ag/TiO2 | 60%: 180 min | 30%: 180 min | 3.5 × 10⁻³ | 0.98 | 1.6 × 10⁻³ | 0.92 |
| 1.0 wt.% N/Ag/TiO2 | 82%: 180 min | 40%: 180 min | 5.0 × 10⁻³ | 0.98 | 2.1 × 10⁻³ | 0.88 |
| 2.0 wt.% N/Ag/TiO2 | 100%: 160 min | 60%: 180 min | 6.4 × 10⁻³ | 0.96 | 3.3 × 10⁻³ | 0.98 |
| Photocatalysts | Maximum Quantum Yield Efficiencies (QYs%) | |
|---|---|---|
| Near-UV Light | Visible Light | |
| 0.5 wt.% bare-TiO2 | 53.3 | - |
| 1 wt.% bare-TiO2 | 79.3 | - |
| 2 wt.% bare-TiO2 | 117.9 | - |
| 0.5 wt.% N/Ag/TiO2 | 19.0 | 15.69 |
| 1 wt.% N/Ag/TiO2 | 25.3 | 20.54 |
| 2 wt.% N/Ag/TiO2 | 46.3 | 35.08 |
Publisher’s Note: MDPI stays neutral with regard to jurisdictional claims in published maps and institutional affiliations. |
© 2021 by the authors. Licensee MDPI, Basel, Switzerland. This article is an open access article distributed under the terms and conditions of the Creative Commons Attribution (CC BY) license (https://creativecommons.org/licenses/by/4.0/).
Share and Cite
Sirivallop, A.; Escobedo, S.; Areerob, T.; de Lasa, H.; Chiarakorn, S. Photocatalytic Conversion of Organic Pollutants in Air: Quantum Yields Using a Silver/Nitrogen/TiO2 Mesoporous Semiconductor under Visible Light. Catalysts 2021, 11, 529. https://doi.org/10.3390/catal11050529
Sirivallop A, Escobedo S, Areerob T, de Lasa H, Chiarakorn S. Photocatalytic Conversion of Organic Pollutants in Air: Quantum Yields Using a Silver/Nitrogen/TiO2 Mesoporous Semiconductor under Visible Light. Catalysts. 2021; 11(5):529. https://doi.org/10.3390/catal11050529
Chicago/Turabian StyleSirivallop, Adilah, Salvador Escobedo, Thanita Areerob, Hugo de Lasa, and Siriluk Chiarakorn. 2021. "Photocatalytic Conversion of Organic Pollutants in Air: Quantum Yields Using a Silver/Nitrogen/TiO2 Mesoporous Semiconductor under Visible Light" Catalysts 11, no. 5: 529. https://doi.org/10.3390/catal11050529
APA StyleSirivallop, A., Escobedo, S., Areerob, T., de Lasa, H., & Chiarakorn, S. (2021). Photocatalytic Conversion of Organic Pollutants in Air: Quantum Yields Using a Silver/Nitrogen/TiO2 Mesoporous Semiconductor under Visible Light. Catalysts, 11(5), 529. https://doi.org/10.3390/catal11050529