Article

Conversion of Oxygenates on H-ZSM-5 Zeolites—Effects of Feed Structure and Si/Al Ratio on the Product Quality

Faculty of Chemistry and Food Chemistry, Technische Universität Dresden, 01062 Dresden, Germany
*
Authors to whom correspondence should be addressed.
Catalysts 2021, 11(4), 432; https://doi.org/10.3390/catal11040432
Submission received: 28 February 2021 / Revised: 22 March 2021 / Accepted: 25 March 2021 / Published: 28 March 2021
(This article belongs to the Special Issue Catalysis on Zeolites and Zeolite-Like Materials)

Abstract

:
The conversion of different biogenic feedstocks to hydrocarbons is a major challenge when ensuring hydrocarbon and fuel supply in spite of the heterogeneity of this feed. Flexible adaptation to changing compositions is mandatory for the respective processes. In this study, different oxygenate model feeds, such as alcohols, aldehydes, carboxylic acids and esters, were converted at 500 °C and 5 barg H2 using H-ZSM-5 zeolite catalysts with various Si/Al ratios to identify the relationship between the feed structure and the final product distribution. As the main outcome, the product distribution becomes increasingly independent of the feed structure for Al-rich H-ZSM-5 catalyst samples at low Time on Stream (ToS). Some minor exceptions are the increased formation of aromatics during ToS for carbonyl oxygenates compared to primary alcohols and the dominance of initial deoxygenation products for Si-rich H-ZSM-5 samples. This is interpreted by a multi-stage reaction sequence, which involves the initial deoxygenation of the feed and the subsequent integration of the olefin intermediates into a reaction network. The results pave the way towards the achievement of a desired product distribution in the conversion of different oxygenates simply by the adaption of the Al content of H-ZSM-5.

Graphical Abstract

1. Introduction

With the discovery of zeolite H-ZSM-5 as an acid catalyst, more and more of its applications have been found in the field of catalytic conversion of hydrocarbons [1]. One important application is the conversion of methanol in the methanol-to-hydrocarbons (MTH) process [2]. A remarkable milestone in this development is a deeper mechanistic understanding of this build-up reaction through the introduction of the dual-cycle hydrocarbon pool (HCP) mechanism by Haw et al. and other groups [3,4,5]. Further experimental work by Goetze et al. [6] and Weckhuysen et al. [7] achieved a level of molecular observation of active species within the zeolite pores, which confirms the existence and interconversion of proposed olefinic and cyclic hydrocarbon species (see Figure 1). Furthermore, the dual-cycle mechanism, with its sophisticated explanation of different product distributions over an olefinic and aromatic pathway, also matches the ethanol to hydrocarbon reactions (ETH) [8]. Mechanistic as well as process technology studies described by White [9] reached a new level, culminating in the introduction of industrially relevant patents by ExxonMobil [10,11]. Comparison of the conversion of ethanol and methanol as small oxygenates has already revealed a discrepancy in terms of the proposed consecutive reactions of C1 and C2 fragments. Even recent publications do not explain the source of this discrepancy in detail, which promotes a controversial discussion [12]. Exemplarily, another view on the hydrocarbon interconversion mechanism describes a chain of competing reactions with different probabilities, which determine the final product distribution as a statistical measure [13,14].
The first investigations by Chang and Silvestri [15] as well as by Bandermann et al. [16] on the conversion of other oxygenates such as small ketones, aldehydes, carboxylic acids and esters showed a significantly different behavior in product formation and deactivation. With the exploration of oxygenates as alternative resources to gas, oil and coal, a gap has arisen between the mechanistic explanation of small oxygenates beyond methanol via the dual-cycle mechanism and the mechanistic understanding of the conversion of long-chained molecules with other functional groups than hydroxyl.
Figure 1. Schematic overview of methanol conversion and product formation on H-ZSM-5 with deoxygenation and first C-C-coupling and the following dual-cycle mechanism for hydrocarbon interconversion from olefinic and cyclic (aromatic) species [16,17,18,19].
Catalysts 11 00432 g001
This work provides an option to close this gap with a systematic investigation of the catalytic conversion of different oxygenates with variating hydrocarbon chain lengths and functional groups. The catalytic measurements on H-ZSM-5 catalysts with varying Si/Al ratios at similar reaction conditions facilitate a comparison between alcohol conversion and findings about other oxygenates. From the application perspective, this helps to flexibly choose suitable catalysts to ensure stable hydrocarbon product quality during the conversion of heterogeneous bio-feedstock.

2. Results and Discussion

2.1. Textural, Structural and Surface Acidity Properties

The MFI structure (mordenite framework inverted) and the degree of crystallinity of the synthesized H-ZSM-5 samples was verified by X-ray diffraction (Figure 2a) for long-range as well as infra-red spectroscopy (ATR-FT-IR) for short-range structure analysis.
Table 1 reveals similar and high short-range and, only in the case of Z-35, slightly decreased long-range crystallinity. The results of the nitrogen physisorption indicate a type I isotherm for a clean microporous material (Figure 2b) [20]. With increasing Si/Al ratio, a hysteresis loop appears at p/p0 = 0.1–0.2, attributed to a solid-state transformation effect of nitrogen at homogenous silica surfaces inside the H-ZSM-5 pore system. The sorted monolayer coverage rearranges, leading to additional packing of nitrogen molecules during secondary micro-pore filling [21].
The difference in the Al content variation was confirmed by ICP-OES and TPAD. Table 1 shows a match for the observed Si/Al ratio to the desired Si/Al ratio adjusted by the synthesis composition. The characteristic two maxima of ammonia desorption profiles at H-ZSM-5 could be observed for all investigated samples. The increase in the Al content leads to a simultaneous increase in the low-temperature peak (physisorbed ammonia) and the high-temperature peak (chemisorbed ammonia), as demonstrated in Figure 2c. With respect to thermogravimetry analysis, all samples show similar behavior, with slightly higher hydrophilic behavior in the Al-rich samples (Appendix B, Figure A2). As a result of the experiments and accompanying analyses, synthesis of H-ZSM-5 zeolite samples with comparable textural properties was successful (specific surface area: 395–435 m2/g, pore volume: 0.17–0.19 cm3/g). Adjustment of the Al content of the synthesis gel composition leads to the desired acidity of the final zeolite products after ion exchange.

2.2. Morphology Analysis by Scanning Electron Microscopy (SEM) and Laser Scattering (DLS)

An increasing Al content leads to deceleration of the speed of crystallization [22,23]. Although the crystallization time was adapted from 48 h with increasing Al content up to 100 h in the case of sample Z-35, the crystallinity observed by XRD and FT-IR is the lowest for this sample and also the morphology differs from the Si-rich sample Z-inf. SEM images in Figure 3 confirm typical pinacoid-shaped crystals of approx. 8–11 µm with agglomeration for Z-inf, which changes stepwise to smaller spherical particles of approx. 2–4 µm, which causes less intergrowth and agglomeration.
A parallel view on particle size distribution from laser scattering experiments in Figure 4 confirms the trend of smaller particles with increasing amounts of Al in the synthesis gel. For all samples, there are four distinguishable size fractions: ca. 2–4 µm, ca. 4–8 µm, ca. 8–11 µm and a very small amount ca. 100 µm. With increasing Al content, the fraction of 2–4 µm rises at the cost of bigger particles of 4–11 µm. Consequently, the D50 value drops stepwise from sample Z-inf to Z-35. In the case of sample Z-35 with the highest Al content, the fraction of 8–11 µm is visible but less dominant with respect to Z-80. Compared to SEM imaging, the four fractions are denoted as small individual crystals (2–4 µm), big individual crystals (4–8 µm), bigger agglomerates (8–11 µm) and big residual aggregates (100 µm).
In conclusion, Al-rich samples show slightly smaller spherical crystals with less agglomeration, as reported by Shirazi et al. [24]. The dominant size fractions of all samples are very similar, i.e., morphology changes with Al content are not major reasons for changes in catalytic properties, which are the focus of the current work.

2.3. Catalytic Conversion of Alcohols with Different Chain Lengths

The first step to evaluate the effect of Al-based catalytic active sites systematically is a catalytic test of a silicalite-1 (Z-inf). The sample only contains silanol groups and structural defects in the framework. These surface and solid-state centers act as adsorption sites. The consequences of this “silicate activity” associated with these adsorption sites are represented in Figure 5a by the Si/Al = inf catalyst system. It allows the evaluation of the catalytic performance by product carbon yields of fractions C1–C7 as a function of the chain length of the primary alcohol. For comparing the results of an empty reactor conversion of n-propanol, see Appendix B, Figure A1. At this point, four observations stand out.
(1) The blue bars in Figure 5 represent the initial products resulting from the primary alcohol dehydration. A direct dehydration describes the formation of an olefin with the same chain length as the originally reacted primary alcohol by the elimination of water without any observable intermediates. Thus, for example, the direct dehydration of ethanol directly leads to an increased carbon yield of C2 (respectively, C3 for C3-OH, C4 for C4-OH, and so on). However, for the special case of methanol dehydration, a carbene-type intermediate could not be observed for methanol [14]. Recent results conclude a bimolecular Koch-type carbonylation [11,25], even without Brønsted acid sites. Moreover, for all experiments with alcohols, full conversion was observed at 500 °C. Even a reaction of alcohols without catalyst leads to 83% conversion by dehydration in the case of propanol (Appendix B, Figure A1).
(2) The value of the blue bars in Figure 5 decreases continuously from C2-OH to C7-OH. From this, it can be deduced that the initial dehydration products are further converted during subsequent reactions. The activation threshold of these follow-up reactions depends on the chain length of the initial dehydration product. The main reason for the difference is the lower stability of primary carbenium ions, as they would result from the protonation of ethylene, compared to secondary and tertiary carbenium ions, as they would result from the protonation of C3+ olefins.
(3) The reaction types of these follow-up reactions after dehydration are different build-up and breakdown reactions, which may be considered as a chain [11,12,13]. It can be assumed that at a certain number of reaction events, the chain reaches a statistically equal distribution since a product of one reaction can act as an educt for the other reaction. As already reported, olefinic molecules, e.g., from dehydration of the primary alcohols, tend to form a hydrocarbon pool located at different adsorption sites in the MFI-type zeolite [26]. Therefore, they are able to feed the olefin-consuming and afterwards olefin-providing mechanism.
(4) In addition to the network of build-up and breakdown reactions within a hydrocarbon pool, Figure 5 displays concrete direct breakdown reactions. Looking at the product distribution detected during the conversion of C6-OH and C7-OH, an increased carbon yield can be observed for C3 (pink bars), respectively, C3 and C4 (yellow bars).
By increasing the Al content of the catalyst system, the product distribution from the conversion of different primary alcohols becomes similar (Figure 5a–d). The correlation between the Al content and the alignment of the product distribution can be interpreted as follows: the above-mentioned “silicate activity” consists of several distinguishable reactions. After dehydration, the initial hydrocarbon deoxygenation product has a low tendency to be converted by any follow-up reactions. With the increase in the Al content of the catalyst sample, the number of adsorption sites in the solid-state surface rises, which increases the probability of re-adsorption processes, i.e., an already converted molecule can be converted again at another location in the catalyst pore system. Thus, although the particle morphology slightly tends towards smaller crystals with increasing Al content, the number of intermediate steps between the initial adsorption at the entrance of the catalyst bed and the final desorption at the exit increases. An intermediate step within this reaction chain represents an interaction from one hydrocarbon molecule inside the pore system with a catalytically active site. However, after increasing the number of intermediate steps, the probability increases that the most thermodynamically favorable reactions will dominate the product distribution at the end of the catalyst bed. At each adsorption site inside the pore system, there is a new chance that the reaction on a hydrocarbon adsorbate will result in an equilibrated and not an initial product, e.g., from dehydration (blue bars in Figure 5a). Furthermore, in accordance with Schulz [27], it is assumed that the predominant proportion of reactions will act on hydrocarbon adsorbates on the surface and in the pores of the MFI-type zeolites and not in the gas phase. This results from a size limitation effect, which leads to an increased formation of small C3 + C4 products, as shown in Figure 5 [28,29,30,31]. As a direct consequence, there is an independence of the original feed chain length.

2.4. Catalytic Conversion of Feeds Containing Different Oxygenated Functional Groups

Figure 6 shows the product distribution during experimental series 2. In this series, five feeds with different oxygenated functional groups but the same amount of carbon atoms in the main chain were investigated. Three carbonyl oxygenates (octanoic acid = C7-COOH, octanal = C7-CHO, ethyloctanoate = C7-COOC2) were compared to two primary alcohols (1-heptanol = C7-OH, equimolar solution of 1-heptanol and ethanol = C7-OH_C2-OH).
For all catalytic test experiments with different oxygenates, full conversion was observed at 500 °C. Even without a catalyst, the conversion of ethyloctanoate leads to 55% conversion to ethylene and octanoic acid (see Appendix B, Figure A1). The first observation in Figure 6a–d is a related product distribution with a few exceptions, for all converted feeds and used catalysts. Moreover, the product distributions with Al-rich H-ZSM-5 catalyst (Si/Al = 35) of Figure 5d and Figure 6d are remarkably similar. Due to this observation, it is justifiable to extend the above-mentioned statements on the alignment of the product distributions with increasing Al content to the conversion of oxygenates with other functional groups.
The similarity of the product distributions regardless of different zeolite crystal sizes and of the converted feed of experimental series 2 shown in Figure 6a is related to their C7 main chain, which rapidly cracks into C3 and C4 products. Since the initial hydrocarbon deoxygenation products for terminal oxygenates with a C7 main chain are the same (C3 and C4), the product distributions also become similar. The reason is the promotion of subsequent reactions after deoxygenation with increasing Al content. As soon as olefins are the product of the initial deoxygenation reaction (dehydration, decarbonylation, decarboxylation), subsequent interconversion reactions at Al-rich H-ZSM-5 mainly determine the final product distribution.
However, one observation can be made for feeds containing a C2 component beside the C7 main chain, such as C7-COOC2 (green bars, Figure 6) and C7-OH + C2-OH (red bars). For these feeds, Figure 6a shows an increased carbon yield for C2 products and a reduced carbon yield for C3 and C4 products. This is related to the reduced reactivity of ethane and ethylene compared to propylene and bigger olefins, as reported by Plessow et al. [12]. However, again, by increasing the Al content of the catalyst, these differences disappear (Figure 6a–d).
One key observation from experimental series 2 is an increasing product fraction of C3 + C4 with increasing Al content of the catalyst (Figure 6a–d). Meanwhile, also, the molar C3/C4 ratio of the product distribution increases (Table 2). A thermal cleavage of a C7 chain should result in a C3/C4 ratio of 1:1. However, since a significantly higher C3/C4 ratio is already observed for the silicalite-1 (Table 2, Z-inf), a positive effect of the MFI-type pore geometry on the formation of C3 can already be concluded. In addition, a contribution of the catalytic cracking via Brønsted acid sites and subsequent interconversion reactions beyond the thermal cracking seems reasonable. Furthermore, the intensified effect of limiting pore sizes for the Al-rich zeolite catalyst is a result of an increased number of inner-pore conversion events due to the increasing number of Al-based adsorption sites [14,26].

2.5. Catalytic Conversion of Feeds Based on Substance Groups

In addition to the above-mentioned increase in the number of adsorption sites and thus the number of intermediated steps, increasing the Al content also causes a change in the electronic structure for different catalytic active sites on the catalyst surface. This change is caused by the rules of the next-nearest neighbor principle, as reported for zeolite Y [32]. Therefore, the activation threshold of possible reactions within the hydrocarbon pool theory might differ from adsorption site to adsorption site inside the pore system. Additionally, by increasing the Al density in the pore system, the probability increases that more than one Al is present in one pore and thus the probability of multi-center reactions increases [14,33,34]. From former work by Cumming and Wojciechowsky [13] for cracking reactions the hydride shift reaction, the cyclization or the carbonium ion mechanism are predominantly bimolecular processes. They should therefore occur with increased probability due to the action of a Brønsted acid site on a neighboring hydrocarbon adsorbate.
This change in reactivity and reaction diversity depending on Al content is clearly shown in Figure 7, in which the results of experimental series 1 and 2 are grouped according to the carbon yield of the substance groups olefins, paraffins and aromatics. As shown in Figure 7a,d, the carbon yield of olefins decreases by increasing Al content, but the carbon yields of paraffins (Figure 7b,e) and aromatics (Figure 7c,f) increase, apparently coupled. With the rising Al content of the catalyst, the probability of a multi-center reaction changes: the paraffin-providing reactions, such as hydride shift and carbonium ion mechanism, and the aromatic-providing reactions, such as cyclization with subsequent dehydrogenation, become more dominant. Moreover, this gives new explanation to similar observations for methanol and ethanol conversion to paraffins and aromatics on H-ZSM-5 with different Si/Al ratios, as reported in [35,36,37]. Since a high olefin carbon yield is already observable for silicalite-1 (Z-inf, Figure 7a,d), it can be assumed that olefin-providing deoxygenation reactions take place even without any Al sites.
In conclusion, for alcohols with chain lengths of C1–C7, as well as the considered oxygenates, the conversion mechanism is related to the already known processes within the hydrocarbon pool in methanol and ethanol conversion [27,35]. At 500 °C, initial deoxygenation leads to an olefin backbone, which depends on the deoxygenation mechanism. By increasing the Al content of the catalyst, this olefin-providing backbone is supplemented by build-up, cracking, as well as paraffin- and aromatic-providing interconversion reactions. With respect to reports about the comparable conversion of different oxygenated hydrocarbons [16], such a general trend has not yet been reported.

2.6. Dependency on Time on Stream

All statements so far apply to an equilibrated initial activity at Time on Stream (ToS) = 0.5 h. The dependency on the ToS of the carbon yield of olefins, paraffins, aromatics and the aggregated C1–C4 products is shown in Table 3 for the Z-35 catalyst system. For this purpose, 1-heptanol (representing primary alcohols) and octanal (representing carbonyl oxygenates) were compared. Starting with ToS = 3.5 h, an activity plateau is reached that is evident for all substance groups shown in Table 3. Looking at this activity plateau, the carbon yields of olefins are almost identical for 1-heptanol and octanal, but for paraffins, aromatics and the C1–C4 products, significant differences are observable. The difference between the first (ToS = 0.5 h) and last value (ToS = 5.5 h) of the aggregated C1–C4 products is approx. 3% for 1-heptanol and approx. 14% for octanal. Remarkably, the same values can be seen for the difference between the first (ToS = 0.5 h) and the last value (ToS = 5.5 h) for the aromatics (1-heptanol: approx. 2%, octanal: approx. 14%). This confirms that the formation of C6 + C7 aromatics removes the hydrocarbon adsorbate from the catalyst system as inert products, as assumed above. The ratio of paraffin-providing and aromatic-providing reactions changes, but the carbon yield of olefins from deoxygenation remains unchanged with ToS. This can be explained by the probability of a multi-center reaction, which decides whether an olefin or non-olefin is formed.
However, for a given Al content, the contribution of paraffin-providing and aromatic-providing reactions mainly depends on the functional group of the feed. The direct dehydration of 1-heptanol almost immediately leads to the formation of a C7 olefin with rapid cracking to C3 and C4 products. The decarbonylation of octanal requires an electron shift into the carbonyl group for the formation of CO. Possible reactions are the aldol reactions, as known from fast coking in methanol conversion [38] and Lebedev process [39], or an 1,6-intramolecular hydride shift that could facilitate cyclization and subsequent aromatization of the C7 main chain of the converted octanal. By increasing the probability of aromatic-providing reactions via an aldol process in the case of C7-CHO conversion, the probability of paraffin-providing reactions is reduced beyond the coupled aromatic and paraffin formation from hydride transfer between initially formed olefins [35]. Furthermore, fast aromatization leads to reduced formation of small olefins C3 + C4 from cracking, which reduces the overall amount of C1–C4 products during the conversion of C7-CHO compared to C7-OH.

3. Materials and Methods

3.1. Chemicals

The chemicals used for this investigation include sodium trisilicate (Na2Si3O7, Si as SiO2 ≥ 60% and Na as Na2O ≥ 18%, Fluka Honeywell, Charlotte, North Carolina, USA), sodium aluminate (NaAlO2 technical, Al as Al2O3 50–56% and Na as Na2O 37–45%, Sigma-Aldrich, St. Louis, Missouri, USA), tetrapropylammonium bromide (TPABr, C12H28BrN > 98.0%, TCI, Tokio, Japan), sulfuric acid (H2SO4 95–97%, VWR International, Radnor, Pennsylvania, USA), ammonium nitrate (NH4NO3 99%, Grüssing GmbH, Filsum, Germany), hydrofluoric acid (HF 40%, Merck Millipore, Burlington, Massachusetts, USA), nitric acid (HNO3 69%, Supra-quality, Carl Roth GmbH & Co. KG, Karlsruhe, Germany), hydrochloric acid (HCl 37%, VWR International) and boric acid (H3BO3 99.9995%, Alfa Aesar, Haverhill, Massachusetts, USA). Feed for catalytic tests consists of methanol (CH3OH 99.9%, TCI), ethanol (C2H5OH abs., Sigma-Aldrich), n-propanol (C3H7OH 99.7%, Sigma-Aldrich), n-butanol (C4H9OH 99.8%, Sigma-Aldrich), n-pentanol (C5H11OH > 99%, Sigma-Aldrich), n-hexanol (C6H13OH > 99%, Sigma-Aldrich), n-heptanol (C7H15OH > 98%, Sigma-Aldrich), ethyl octanoate (C7H15COOC2H5 > 98%, Sigma-Aldrich), octanal (C7H15CHO 99%, Sigma-Aldrich), octanoic acid/caprylic acid (C7H15COOH > 98%, Sigma-Aldrich).

3.2. Hydrothermal Synthesis of ZSM-5 and Preparation of H-ZSM-5

Table 4 shows the chemicals used and their amounts for the synthesis of ZSM-5 with different Si/Al ratios. At first, in a beaker, 1 L deionized water was tempered at 35 °C. Afterwards, TPABr was added consecutively and tempered under vigorous stirring until complete dissolution. The designated amount of mortared Si and Al precursors (disodium trisilicate and sodium aluminate) was added in portion to the transparent TPABr/water solution under vigorous stirring. Subsequently, the resulting white suspension was stirred for an additional period of 10 min. For 30 min, the pH value of this suspension was adjusted to 10.0 by dropwise addition of 50 wt.-% sulfuric acid. Instantaneously, the prepared primary synthesis gel was transferred into a PTFE-coated autoclave (polytetrafluorethylene), heated to 150 °C using a stainless-steel oven and tempered under autogenous pressure from 48 h up to 100 h (with increasing Al content). Afterwards, the oven was cooled down to 50 °C within 2 h. The resulting as-synthesized product was washed with water and ethanol until no foam formation was observable anymore, dried overnight and calcined at 550 °C for 48 h in synthetic air. The calcined sample underwent three times ammonium ion exchange at 78 °C for 3 h as well as the consecutive calcination at 450 °C for 6 h in synthetic air to generate the H form of the catalyst sample. The prepared ZSM-5 samples were designated as Z-inf, Z-250, Z-80 and Z-35 in accordance with the decrease in Si/Al ratio from infinite to 35 (Table 1 and Table 4).

3.3. Powder X-ray Diffraction (XRD)

ZSM-5 phase identification and product crystallinity estimation were accomplished by powder X-ray diffraction using the X-ray powder diffractometer STADI P from Stoe. (Cu-Kα, 100 K, 15 min, 5–55° 2θ). After calcination, the samples were saturated in a humid environment according to ASTM D5758-01 [40]. The sampling was conducted by adsorption of solid-state material through a drop of silicon oil attached to a nylon loop. The ZSM-5 phase identification was carried out by reference diffractogram comparison applying a calculated ZSM-5 diffraction pattern [41] deposited at the “Database of Zeolite Structures” [42]. Estimation of crystallinity degree from XRD was performed according to ASTM D5758-01, method A and B (see Table 1, as well as Table A2).

3.4. Attenuated Total Reflection Fourier-Transform Infrared Spectroscopy (ATR-FT-IR)

ZSM-5 Fourier-transform infrared measurements were performed to investigate the short-range order of the zeolites produced. For this purpose, the dried ZSM-5 samples were pressed on the sample holder of the ATR-FT-IR spectrometer Vertex 70 from Bruker with a KBr beam splitter, a diamond as ATR crystal and a globar as a radiation source. For each sample, 32 scans between 350 cm−1 and 1600 cm−1 were accumulated with a resolution of 1 cm−1. For each measurement, a separate background was recorded. Crystallinity was calculated by the ratio of absorbance at 450 cm−1 and 550 cm−1 in accordance with Shukla et al. [43].

3.5. Temperature-Programmed Ammonia Desorption (TPAD)

The surface acidity of H-ZSM-5 zeolite samples was investigated using a TPDRO 1100 Series from Thermo Fisher Scientific (Waltham, Massachusetts, USA). The premeasurement preparation consisted of drying the calcined sample for 20 min in a muffle furnace. Then, 250 mg of the dried sample was calcined at 550 °C for 6 h using argon and cooled down to 100 °C. The ammonia loading was performed at 100 °C for 10 min, with consecutive conditioning at 100 °C with helium for 3 h. The measurement was performed, increasing the temperature from 100 °C to 550 °C or 750 °C with 10 K/min. The deconvolution of the TPAD profile was accomplished by applying asymmetric Gaussian distributions. The area was estimated by intern calibration of the device. The ammonia desorption profile of H-ZSM-5 consisted of an l-peak (“low-temperature peak”) and an h-peak (“high-temperature peak”). The signal maximum of the l-peak was approximately 270 °C and the signal maximum of the h-peak was approximately 490 °C. The h-peak was closely related to the chemisorption of NH3 on the Brønsted acid sites and partly also the Lewis acid sites of the aluminosilicate material. The l-peak, on the other hand, was primarily caused by the adsorption of NH3 by weaker physisorption interactions. These included the interactions between NH3 and (1) silanol groups [44,45], (2) Na+-ions [44,46], (3) non-zeolitic material [44], (4) extra framework aluminum [47] and (5) already chemisorbed NH3 [48]. The total acidity was given by the specific amount of adsorbed ammonia (mmol NH3/g) and calculated by calibration of the signal area of the TPAD profile. Finally, the amount of desorbed ammonia and the surface acidity were determined (Table 1). For further details, see Table A3.

3.6. Thermogravimetric Analysis

Coke quantification of the catalyst sample after catalytic testing was performed by thermogravimetric analysis. The premeasurement preparation steps consisted of a sampling of 20–40 mg at room temperature, starting with the coked catalyst sample removed at room temperature from the catalytic device. Measurement was performed using a TG50 from Mettler Toledo (Columbus, Ohio, USA) in an alumina crucible by heating to 850 °C with 10 K/min using synthetic air. The amount of coke residues on the used catalyst was estimated by the mass loss between 420 and 670 °C. A similar program under nitrogen flow was used for thermogravimetric analysis of thermal resistance of the samples.

3.7. Physisorption of Nitrogen

The textural properties of H-ZSM-5 samples were investigated using a Carlo Erba Instruments (Egelsbach, Germany) Sorptomatic 1990 or a Thermo Fisher Scientific Surfer. Starting with the calcined sample, the additional premeasurement preparation steps consisted of drying at 250 °C for 20 min in a muffle furnace, sampling of 150–250 mg, calcination at 250 °C under a vacuum of 7.4–4.4 mbar for 8 h and finally cooling down to 77 K with liquid nitrogen. By application of the BET (by Brunauer, Emmett and Teller) and BJH methods (by Barrett, Joyner and Halenda), textural properties of the H-ZSM-5 samples were estimated (see Table 1) [49,50].

3.8. Inductively Coupled Plasma Optical Emission Spectroscopy (ICP-OES)

Elemental analysis of the synthesized H-ZSM-5 samples was accomplished by inductively coupled plasma optical emission spectroscopy using a Perkin Elmer Instruments (Walham, Massachusatts, MA, USA) Optima 2000 DV detecting the sodium signal (589.592 nm), aluminum signal (237.313 nm) and silicon signal (212.412 nm). Starting with the calcined sample, the additional premeasurement preparation steps consisted of drying at 120 °C, sampling of 20–30 mg, dissolution with 2.0 mL 40 wt.-% hydrofluoric acid, complexation of fluoride with 20.0 mL saturated boric acid and filling up the solution with ultrapure water to 100.0 mL. Subsequently, the sample solution was diluted in a 1 to 50 ratio with nitric acid, targeting a 0.1-M nitric acid measurement solution. The Si and Al content of the H-ZSM-5 sample were determined by calibration against standard samples (see Table 1).

3.9. Morphology Analysis by Scanning Electron Microscopy (SEM) and Dynamic Laser Light Scattering (DLS)

The morphology analysis of synthesized H-ZSM-5 samples by means of scanning electron microscopy (SEM) was performed with a SU8020 SEM (Hitachi, Chiyoda, Japan) equipped with a triple detector system for secondary and backscattered electrons (Ua = 2 kV). To acquire electron images, the samples were fixed directly on a double-sided adhesive carbon pad that was placed on an aluminum sample holder. In order to avoid any charge-up and chemical alteration during the measurements, the sample’s surface was coated with gold in an automatic rotary pump coating system (Quorum Q150R ES). In addition, dynamic laser light scattering (DLS) was used to determine particle size distribution with a Bettersizer S3 Plus by 3P Instruments. Wet dispersion procedure was performed with 2000 rpm stirring and 200 W (26 kHz) ultrasonic for 2 min. Data acquisition and processing were in accordance with ISO 13320:2009 with calculation of particle size distribution from scattering data by Mie theory [51].

3.10. Catalytic Test Devices and Procedure

The catalytic tests were performed using a plug flow tube reactor (inner diameter 10 mm) connected to an electric oven, gas supply and a liquid pump. The reactor was filled with 500 mg of dried, calcined and fractionated (315–400 µm) catalyst sample between two layers of quartz glass wool. The reactor was heated using nitrogen at 500 °C for 60 min. The excess pressure inside the reactor was adjusted to 5 bar using hydrogen. After starting the feed pump, the reaction was equilibrated for 20 min. In turns of every 30 min, a gas and a liquid phase were abstracted. The gas phase was measured immediately using an HP 6890 Series GC System from Hewlett-Packard (Palo Alto, California, CA, USA) (HP-1 (100 m)) by a shortened DHA method (detailed hydrocarbon analysis). A qualitative check for CO and CO2 was possible using gas chromatography and mass spectrometry (GC/MS) with a Clarus 680 GC and a Clarus SQ 8 S MS from PerkinElmer Instruments (Walham, Massachusatts, MA, USA) by means of the same DHA method. For this reason, hydrogen atmosphere was used as carrier gas, which was necessary to efficiently detect these small gases and which did not influence the catalytic results in this case, as already reported by Rao et al. [52]. The liquid phase was stored at 10 °C and measured after the reaction using the same gas chromatograph (GC/FID) by means of an extended DHA method (based on ASTM D6730-01 [53]). The calculation used is explained below. Since the oxygenated feeds differed in the wt.-% of carbon, all catalytic results were presented as carbon yield, which gives the yield normalized to the amount of hydrocarbon CnHm in the oxygenate feed after initial deoxygenation.

3.11. Analysis and Evaluation of Catalytic Test Reactions

The catalytic testing of the zeolite samples at standard parameters (Table A1) provided the gas chromatographic analysis of the gaseous, organic and aqueous phase as a function of the reaction time (ToS), the mass flow of feed ( m ˙ f e e d ) and the mass flow of aqueous ( m ˙ g a s ) and organic phase ( m ˙ o r g a n i c ). Coke analysis of the catalyst samples after the reaction was performed using thermogravimetric analysis and revealed no significant amount of coke that had to be taken into account during this calculation.
The application of the DHA method for the separation of the products in the individual phases provided the area fractions of hydrocarbons and oxygenates but did not provide any information on the area fraction of H2O, CO and CO2, since these products cannot be detected by a flame ionization detector [54]. In order to be able to conclude the mass balance of the reaction, the proportions of these products were determined indirectly by calculation. The calculation was based on the assumption that the deoxygenation of the oxygenates treated here takes place exclusively via decarbonylation and/or dehydration [55], decarboxylation [56,57,58] being excluded by definition as a possible reaction path. The product yield ( A p r o d u c t , T o S ) was calculated for a defined reaction period (ToS) from the mass flow of a product in relation to the mass flow of the feed supplied. The feed conversion (x) was calculated analogously for a defined reaction period (ToS) taking into account the possible presence of the feed in all three product phases (aqueous, organic, gaseous).
A p r o d u c t , T o S = m ˙ p r o d u c t , T o S m ˙ f e e d ,   x = ( p h a s e 3 ( n ˙ f e e d , p h a s e , o u t ) n ˙ f e e d , i n ) n ˙ f e e d , i n
The mass flow ( m ˙ p r o d u c t , T o S ) and, indirectly, the flow rate of the amount of substance ( n ˙ p r o d u c t , T o S ) of a product were calculated from the mass fraction of the product related to the mass flow of the analysed phase ( w p r o d u c t , T o S ). Since the gas phase contained water and CO in non-analyzable amounts, the mass fraction of a product in the gas phase could only be based on the mass flow of analyzable products in the gas phase (hydrocarbons in gaseous phase) ( m ˙ H C   i n   g a s ).
m ˙ p r o d u c t , T o S = w p r o d u c t , g a s , T o S m ˙ H C   i n   g a s + w p r o d u c t ,   o r g a n i c , T o S m ˙ o r g a n i c
The mass fraction of a product ( w p r o d u c t , T o S ) was obtained by dividing the area of the peak ( F p r o d u c t , T o S ) and the resulting total area of all peaks of the chromatogram.
w p r o d u c t , p h a s e , T o S = F p r o d u c t , p h a s e , T o S / R F p r o d u c t i = 0 n ( F i , p h a s e , T o S / R F i )
The feed types converted in this work differed in the presence and type of the functional group. The above deoxygenation assumption has different effects on the calculation of the mass flow of CO and H2O depending on the feed type. These two quantities have a direct effect on the calculation of the mass flow of analyzable products in the gas phase ( m ˙ H C   i n   g a s ) and thus, according to (1), also to the product yield ( A p r o d u c t , T o S ).
Feed type I: “Non-oxygenates (pure hydrocarbons)”. Since no water or CO can be produced from the feed, the following applies:
m ˙ H C   i n   g a s = m ˙ g a s = m ˙ f e e d m ˙ o r g a n i c
Feed type II: “Alcohol oxygenates (primary alcohols)”. Deoxygenation for this type of feed takes place exclusively via dehydration. The mass flow of formed water thus corresponds to the mass flow of converted feed, which can be determined by gas chromatographic calibration of the mass flow of the feed used in the aqueous and gaseous product phase.
n ˙ f e e d , o u t = calibration ( F f e e d , G a s + F f e e d , a q u e o u s )
m ˙ a q u e o u s = ( n ˙ f e e d , i n n ˙ f e e d , o u t ) M H 2 O
m ˙ H C   i n   g a s = m ˙ g a s = m ˙ f e e d m ˙ o r g a n i c m ˙ a q u e o u s
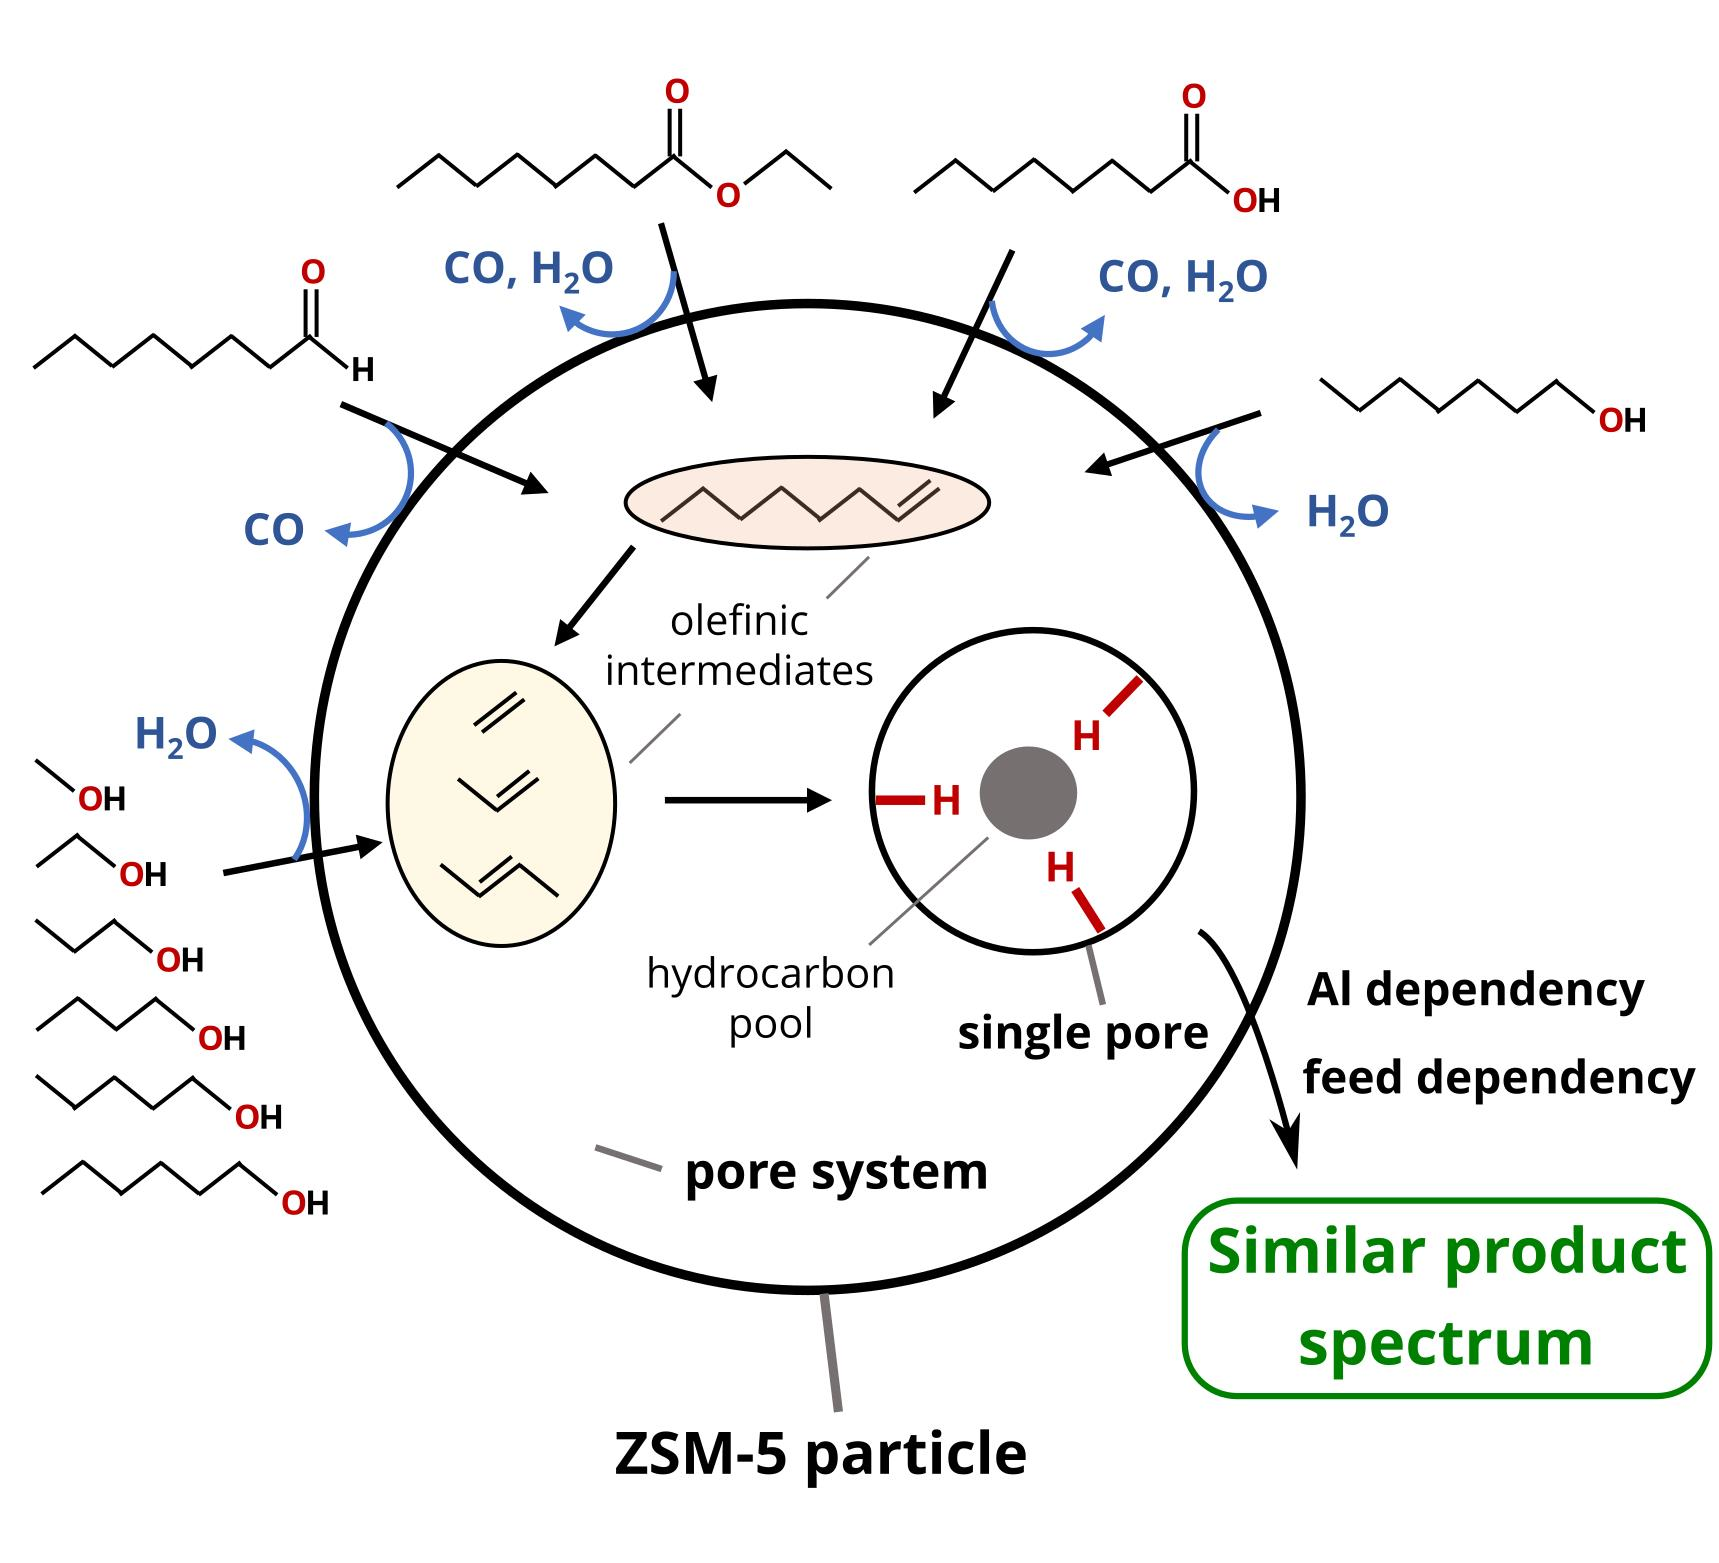
Feed type III: “Carbonyl oxygenates (carboxylic acid, aldehyde, ketone, ester)”. Deoxygenation of the carbonyl oxygenates takes place via decarbonylation and dehydration, whereby these two reactions, by definition, take place in a 1:1 ratio. By summing up the mass flow of all oxygenated products in the organic product phase, a mass flow rate of “converted oxygen” is defined. This mass flow rate is compared to the mass flow rate of oxygen supplied by the feed. The difference provides the mass flow of CO and water.
n ˙ C O = n ˙ H 2 O = ( n ˙ O   i n   f e e d n ˙ O   i n   o r g a n i c   p r o d u c t   p h a s e ) 2
m ˙ a q u e o u s = n ˙ H 2 O M H 2 O ,   m C O = n ˙ C O   M C O
m ˙ g a s = m ˙ f e e d m ˙ o r g a n i c m ˙ a q u e o u s
m ˙ H C   i n   g a s = m ˙ g a s m ˙ C O

3.12. Experimental Series

For the catalytic tests, several different oxygenate feeds and four prepared H-ZSM-5 catalyst samples were used. The investigation of these feeds can be divided into two experimental series.
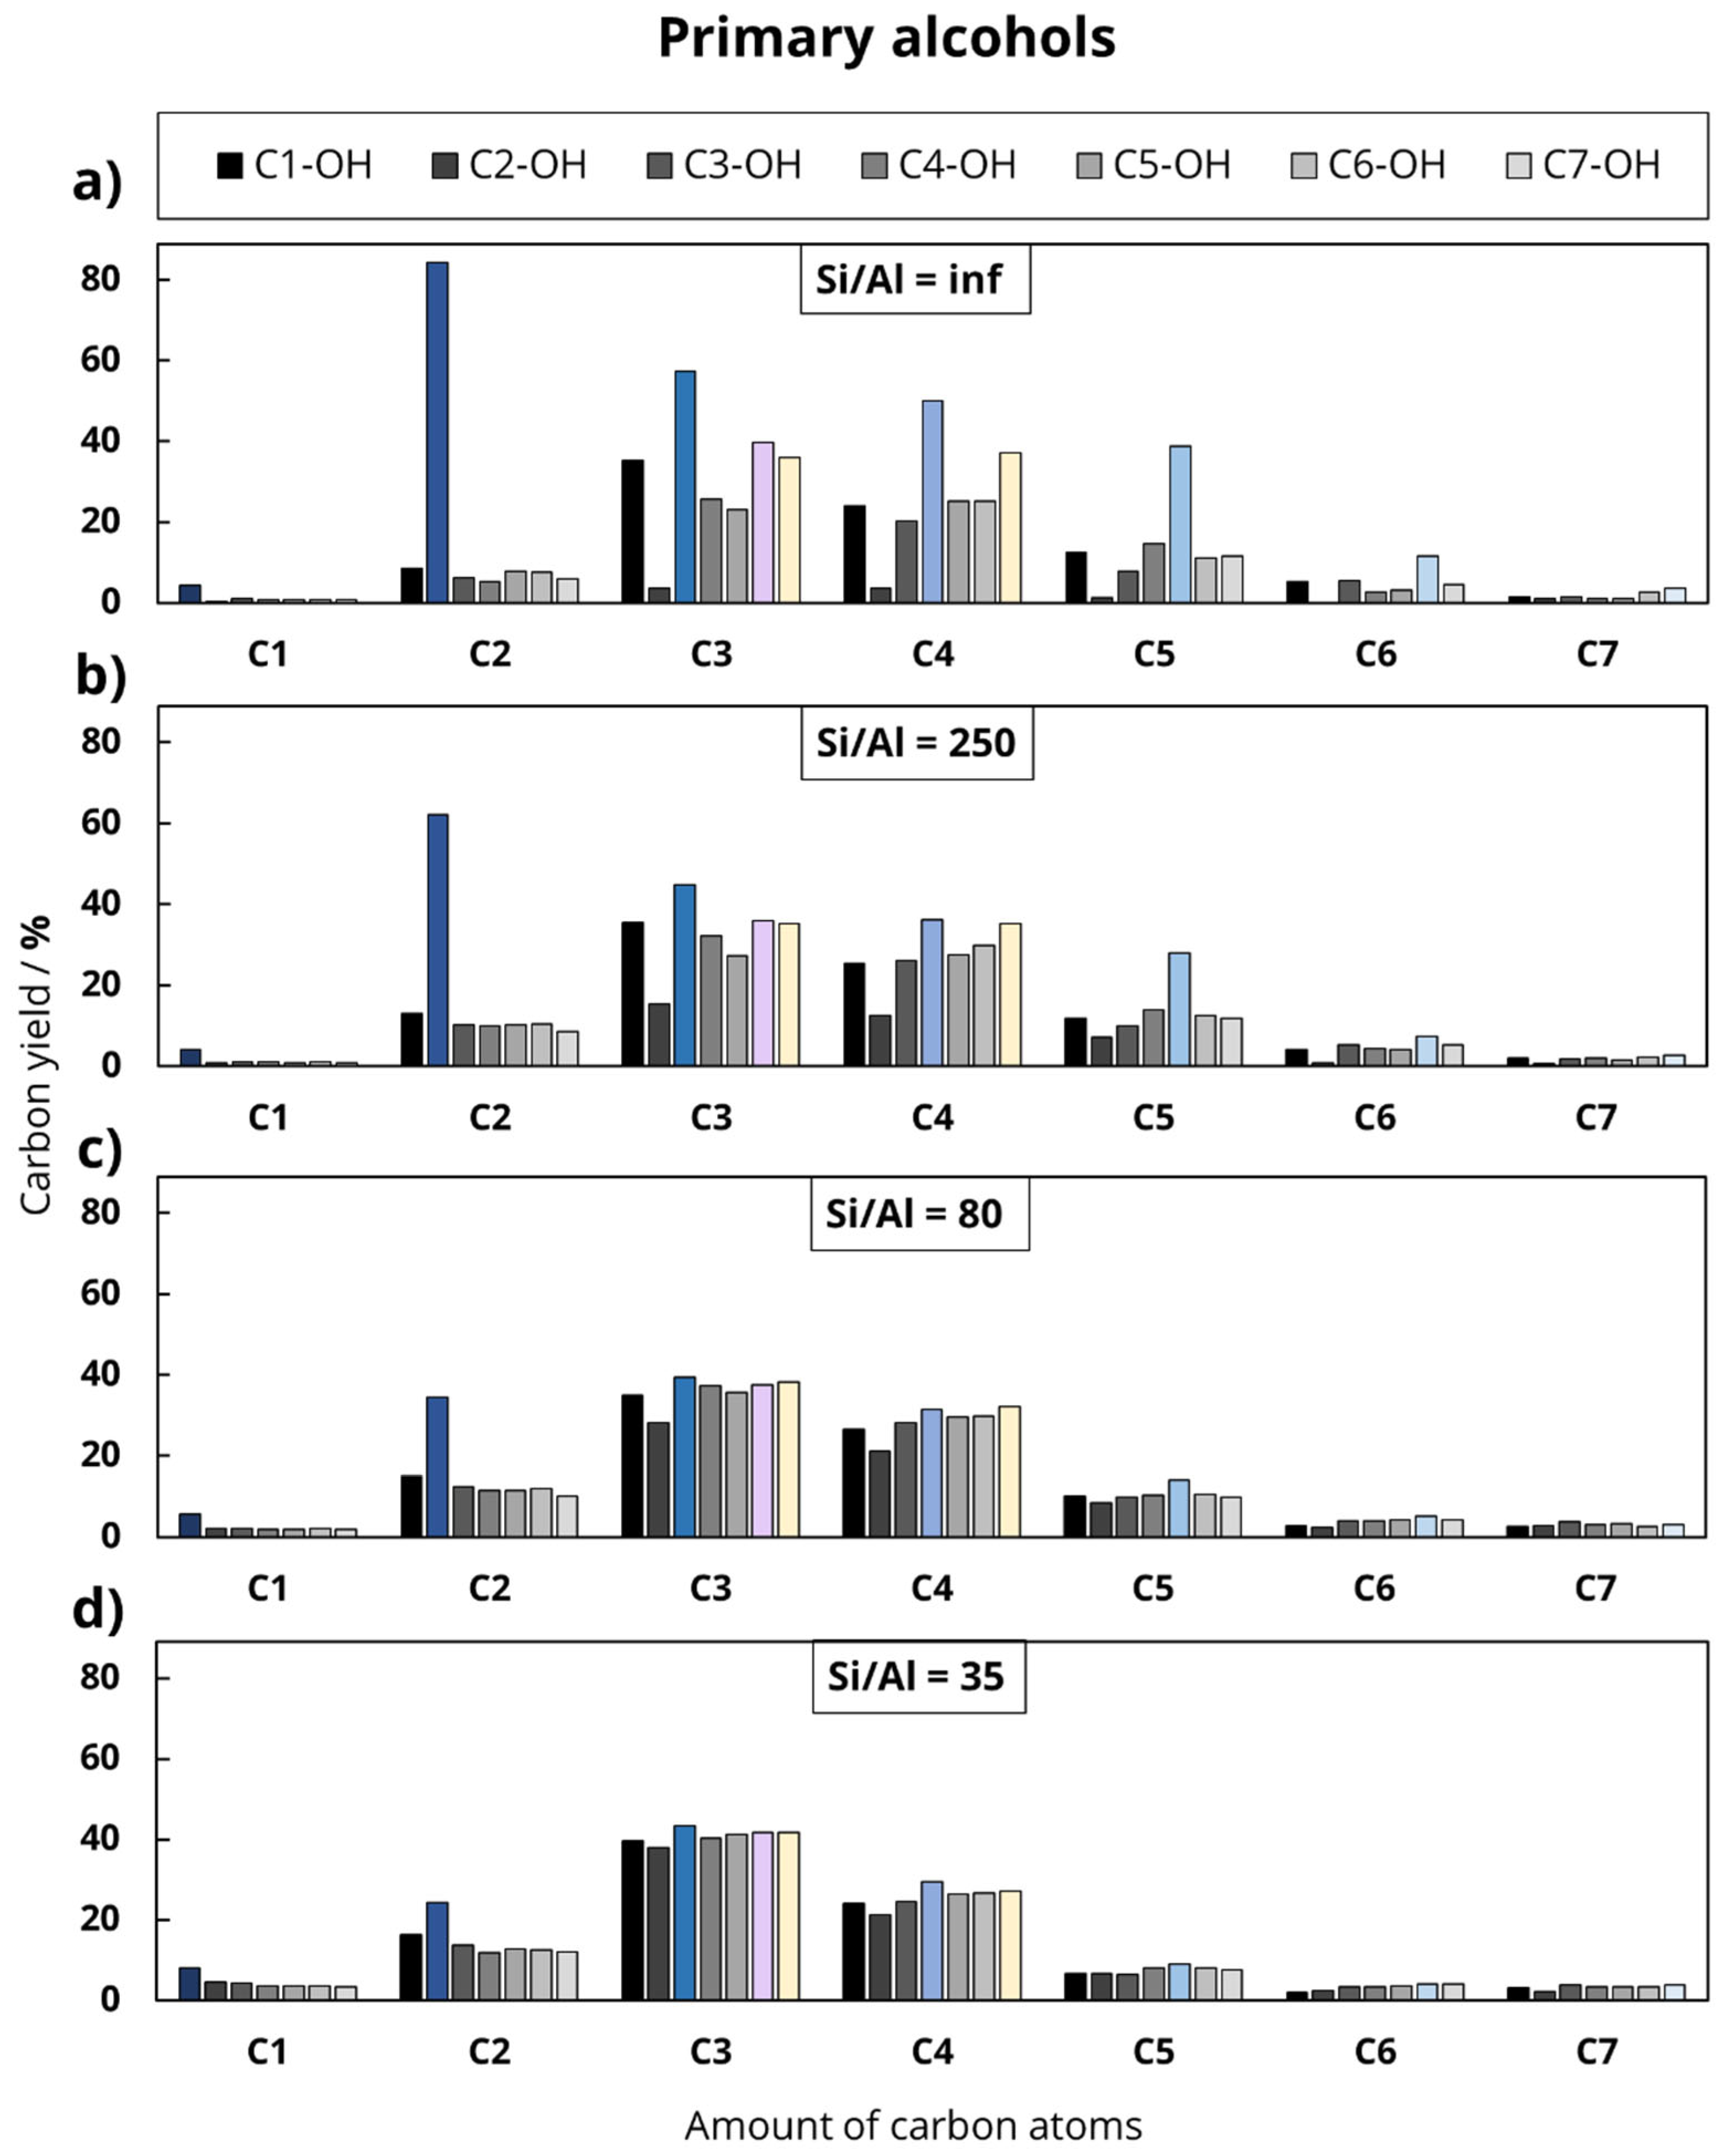
In the first experimental series, seven primary alcohols were investigated, which differed in the length of the hydrocarbon chain, starting with methanol (C1-OH) up to 1-heptanol (C7-OH).
In the second experimental series, the length of the main hydrocarbon chain remained unchanged, while the functional group varied (octanoic acid, octanal, ethyllaurate, 1-heptanol, equimolar solution of 1-heptanol and ethanol). This division was chosen to investigate the influence of the chain length and the deoxygenation mechanism on the product distribution during the catalytic conversion of oxygenates at 500 °C. In addition to the feed variation, the Al content of the used H-ZSM-5 zeolites was varied to investigate the influence of Al-based catalytic active sites.

4. Conclusions

Conversion of heterogeneous biogenic feedstock and flexible adaption of processes to variations in feed composition are major challenges in the use of bio-resources in the petrochemical industry. In this work, H-ZSM-5 zeolites with different Si/Al ratios were prepared and investigated concerning their catalytic activity in the conversion of different oxygenate feeds. The experimental series 1 dealt with the variation in the hydrocarbon chain length of primary alcohols and series 2 with the variation in the functional group at a constant chain length. In conclusion, for all oxygenates, after deoxygenation, an initial olefin distribution forms, which is typical for the respective carbon chain length and type of functional group. This olefinic backbone is converted in a subsequent reaction network, as described in the hydrocarbon pool concept for alcohol conversion. For Si-rich H-ZSM-5 samples, there are increased selectivities for the initial products of deoxygenation. In particular, aldehydes show increased formation tendency of aromatics and coke from preferred aldol reactions. By increasing the Al content and reducing the particle sizes of investigated H-ZSM-5, the observed initial product distribution at ToS = 0.5 h is very similar, independent of the converted feed for all alcohols and different oxygenates used, which facilitates a flexible response to changing feed compositions. In addition to the apparent approximation of the product distributions with increasing Al content, a change in reactivity and reaction diversity leads to the well-known decrease in the olefin yield and an increase in the paraffin and aromatic carbon yield.
The specific novelty of the findings is the systematic extension of the subsequent deoxygenation, olefin-providing and olefin-consuming concepts from alcohol conversion processes, denoted as hydrocarbon pool, to other feeds with oxygenated functional groups in biomass conversion. This reveals options to deal with heterogeneous bio-feedstock by use of H-ZSM-5 with an adapted Al content in fuel and hydrocarbon production.

Author Contributions

Conceptualization, T.G., M.S. and W.R.; Data curation, M.S.; Formal analysis, T.G., M.S., M.S.M. and W.R.; Funding acquisition, M.S. and J.J.W.; Investigation, T.G., M.S., S.B., T.S. and M.S.M.; Methodology, T.G.; Project administration, J.J.W.; Resources, O.B. and J.J.W.; Software, T.G.; Supervision, O.B. and J.J.W.; Validation, T.G. and M.S.; Visualization, T.G. and M.S.; Writing—original draft, T.G. and M.S.; Writing—review and editing, M.S., O.B. and W.R. All authors have read and agreed to the published version of the manuscript.

Funding

This research was funded by the German Federal Ministry for Education and Research (BMBF) for financial funding of this research within the directive Client-II “International Partnerships for Sustainable Innovation” by FONA3 (funding code: 033R188A).

Institutional Review Board Statement

Not applicable.

Informed Consent Statement

Not applicable.

Data Availability Statement

The data presented in this study are available on request from the corresponding author.

Acknowledgments

The authors thank the Group of Michael Ruck (TU Dresden), especially Thomas Doert, for access to the infrastructure related to SEM imaging. Special acknowledgement goes to Mathias Hauck, Clemens Jonscher and Andres Robert Carrasco-Saavedra for additional material characterization. The authors acknowledge Open Access Funding by the Publication Fund of the TU Dresden.

Conflicts of Interest

The authors declare no conflict of interest.

Appendix A. Additional Measurement Conditions and Parameters

Table A1. Standard reaction parameters of catalytic experiments.
Reaction ParameterValue
Temperature500 °C
H2 pressure5 barg
Flow H210 L/h
Flow Feed2 mL/h
Catalyst mass500 mg
Catalyst load 12.7–3.8 h−1
Time on Stream4 h to 6 h
1 Depending on the feed density.
Table A2. Measurement conditions on the STADI P X-ray powder diffractometer for the radiographic examination of aluminosilicate powder samples for the identification and quantification of crystalline phases.
ParameterValue
Radiation sourceCu-Kα
DetectorS2 CCD
Temperature, duration100 K, 15 min
Region5–55° 2θ
Step size0.06° 2θ
Table A3. Measurement conditions on Thermo Fisher Scientific TPDRO 1100 Series for characterizing the acidic properties of the prepared H‑ZSM‑5 zeolite samples.
Process stepValue
CalcinationArgon 20 mL/min, 550 °C, 6 h
CoolingArgon 20 mL/min, at 100 °C
NH3 adsorptionNH3 20 mL/min, at 100 °C, 10 min
FlushingHelium 20 mL/min, at 100 °C, 3 h
NH3 desorptionHelium 20 mL/min, 100–550 or 750 °C at 10 K/min
Calibration factor7.353·10−7 mmol (mV s)−1

Appendix B. Additional Results

Figure A1. Comparison of empty reactor test results after 0.5 h ToS for the conversion of n-propanol (C3-OH) and ethyloctanoate (C7-COOC2); grey bars: almost exclusive formation of propene (C3) from dehydration of C3-OH at 83% conversion; black bars: almost exclusive formation of octanoic acid and ethylene at 55% conversion.
Catalysts 11 00432 g0a1
Figure A2. Additional material characterization: (a) ATR-FT-IR transmission spectra of the prepared H ZSM-5 zeolite samples; special focus on transmission at 450 cm−1 and 550 cm−1 to determine crystallinity by Shukla and Pandya [43]; (b) thermogravimetric analysis between 35 °C and 850 °C in nitrogen flow of H-ZSM-5, slightly higher hydrophilicity for Al-rich material at similar thermal stability.
Catalysts 11 00432 g0a2

References

  1. Vogt, E.T.C.; Weckhuysen, B.M. Fluid catalytic cracking: Recent developments on the grand old lady of zeolite catalysis. Chem. Soc. Rev. 2015, 44, 7342–7370. [Google Scholar] [CrossRef] [PubMed] [Green Version]
  2. Derouane, E.G.; Nagy, J.B.; Dejaifve, P.; van Hooff, J.H.C.; Spekman, B.P.; Védrine, J.C.; Naccache, C. Elucidation of the Mechanism of Conversion of Methanol and Ethanol to Hydrocarbons on a New Type of Synthetic Zeolite. J. Catal. 1978, 53, 40–55. [Google Scholar] [CrossRef] [Green Version]
  3. Kolboe, S.; Dahl, I.M. Methanol conversion to hydrocarbons. Use of isotopes for mechanism studies. In Studies in Surface Science and Catalysis—Catalysis by Microporous Materials, 1st ed.; Beyer, H.K., Karge, H.G., Kiricsi, I., Nagy, J.B., Eds.; Elsevier Science B.V.: Szombathely, Hungary, 1995; Volume 94, pp. 427–434. [Google Scholar] [CrossRef]
  4. Xu, T.; Haw, J.F. TCyclopentenyl Carbenium Ion Formation in Acidic Zeolites: An in Situ NMR Study of Cyclic Precursors. J. Am. Chem. Soc. 1994, 116, 7753–7759. [Google Scholar] [CrossRef]
  5. Haw, J.F.; Song, W.; Marcus, D.M.; Nicholas, J.B. The Mechanism of Methanol to Hydrocarbons Catalysis. Acc. Chem. Res. 2003, 36, 317–326. [Google Scholar] [CrossRef] [PubMed]
  6. Goetze, J.; Meirer, F.; Yarulina, I.; Gascon, J.; Kapteijn, F.; Ruiz-Martínez, J. Insights into the Activity and Deactivation of the Methanol-to-Olefins Process over Different Small-Pore Zeolites As Studied with Operando UV-vis Spectroscopy. ACS Catal. 2017, 7, 4033–4046. [Google Scholar] [CrossRef] [PubMed] [Green Version]
  7. Chowdhury, A.D.; Paioni, A.L.; Houben, K.; Whiting, G.T.; Baldus, M.; Weckhuysen, B.M. Bridging the Gap between the Direct and Hydrocarbon Pool Mechanisms of the Methanol-to-Hydrocarbons Process. Angew. Chem. Int. Ed. 2018, 57, 8095–8099. [Google Scholar] [CrossRef] [PubMed]
  8. Johansson, R.; Hruby, S.L.; Rass-Hansen, J.; Christensen, C.H. The Hydrocarbon Pool in Ethanol-to-Gasoline over HZSM-5 Catalysts. Catal. Lett. 2009, 127, 1–6. [Google Scholar] [CrossRef]
  9. White, J.L. Methanol-to-hydrocarbon chemistry: The carbon pool (r)evolution. Catal. Sci. Technol. 2011, 1, 1630–1635. [Google Scholar] [CrossRef]
  10. Xu, T.; White, J.L. Catalyst Pretreatment in an Oxygenate to Olefins Reaction System. ExxonMobil US6734330B1, 11 May 2004. [Google Scholar]
  11. Xu, T.; White, J.L. Catalyst Pretreatment in an Oxygenate to Olefins Reaction System. ExxonMobil US6743747B1, 1 June 2004. [Google Scholar]
  12. Amsler, J.; Plessow, P.N.; Studt, F. Effect of Impurities on the Initiation of the Methanol-to-Olefins Process: Kinetic Modeling Based on Ab Initio Rate Constants. Catal. Lett. 2021. [Google Scholar] [CrossRef]
  13. Cumming, K.A.; Wojciechowski, B.W. Hydrogen Transfer, Coke Formation, and Catalyst Decay and Their Role in the Chain Mechanism of Catalytic Cracking. Catal. Rev. 1996, 38, 101–157. [Google Scholar] [CrossRef]
  14. Seifert, M.; Marschall, M.S.; Gille, T.; Jonscher, C.; Royla, P.; Busse, O.; Reschetilowski, W.; Weigand, J.J. Ethanol to Aromatics on Modified H-ZSM-5 Part II: An Unexpected Low Coking. Chem. Asian J. 2020, 15, 3878–3885. [Google Scholar] [CrossRef]
  15. Chang, C.D.; Silvestri, A.J. The conversion of methanol and other O-compounds to hydrocarbons over zeolite catalysts. J. Catal. 1977, 47, 249–259. [Google Scholar] [CrossRef]
  16. Fuhse, J.; Bandermann, F. Conversion of organic oxygen compounds and their mixtures on H-ZSM-5. Chem. Eng. Technol. 1987, 10, 323–329. [Google Scholar] [CrossRef]
  17. Wang, S.; Chen, Y.; Qin, Z.; Zhao, T.S.; Fan, S.; Dong, M.; Li, J.; Fan, W.; Wang, J. T Origin and evolution of the initial hydrocarbon pool intermediates in the transition period for the conversion of methanol to olefins over H-ZSM-5 zeolite. J. Catal. 2019, 369, 382–395. [Google Scholar] [CrossRef]
  18. Lesthaeghe, D.; van Speybroeck, V.; Marin, G.B.; Waroquier, M. Understanding the Failure of Direct C-C Coupling in the Zeolite-Catalyzed Methanol-to-Olefin Process. Angew. Chem. Int. Ed. 2006, 45, 1714–1719. [Google Scholar] [CrossRef]
  19. Song, W.; Haw, J.F.; Nicholas, J.B.; Heneghan, C.S. Methylbenzenes Are the Organic Reaction Centers for Methanol-to-Olefin Catalysis on HSAPO-34. J. Am. Chem. Soc. 2000, 122, 10726–10727. [Google Scholar] [CrossRef]
  20. Thommes, M.; Kaneko, K.; Neimark, A.V.; Olivier, J.P.; Rodriguez-Reinoso, F.; Rouquerol, J.; Sing, K.S.W. Physisorption of gases, with special reference to the evaluation of surface area and pore size distribution. Pure Appl. Chem. 2015, 87, 1051–1069. [Google Scholar] [CrossRef] [Green Version]
  21. Sing, K.S.W. Physisorption of nitrogen by porous materials. J. Porous Mater. 1995, 2, 5–8. [Google Scholar] [CrossRef]
  22. Chang, C.D.; Bell, A.T. Studies on the mechanism of ZSM-5 formation. Catal. Lett. 1991, 8, 305–316. [Google Scholar] [CrossRef]
  23. Cundy, C.S.; Cox, P.A. The Hydrothermal Synthesis of Zeolites: History and Development from the Earliest Days to the Present Time. Chem. Rev. 2003, 103, 663–701. [Google Scholar] [CrossRef]
  24. Shirazi, L.; Jamshidi, E.; Ghasemi, M.R. The effect of Si/Al ratio of ZSM-5 zeolite on its morphology, acidity and crystal size. Cryst. Res. Technol. 2008, 43, 1300–1306. [Google Scholar] [CrossRef]
  25. Plessow, P.N.; Smith, A.; Tischer, S.; Studt, F. Identification of the Reaction Sequence of the MTO Initiation Mechanism Using Ab Initio-Based Kinetics. J. Am. Chem. Soc. 2019, 141, 5908–5915. [Google Scholar] [CrossRef]
  26. Bjørgen, M.; Svelle, S.; Joensen, F.; Nerlov, J.; Kolboe, S.; Bonino, F.; Palumbo, L.; Bordiga, S.; Olsbye, U. Conversion of methanol to hydrocarbons over zeolite H-ZSM-5: On the origin of the olefinic species. J. Catal. 2007, 249, 195–207. [Google Scholar] [CrossRef]
  27. Schulz, H. About the Mechanism of Methanol Conversion on Zeolites. Catal. Lett. 2018, 148, 1263–1280. [Google Scholar] [CrossRef]
  28. Weitkamp, J.; Ernst, S.; Dauns, H.; Gallei, E. Formselektive Katalyse in Zeolithen. Chem. Ing. Tech. 1986, 58, 623–632. [Google Scholar] [CrossRef]
  29. Bhawe, Y.; Moliner-Marin, M.; Lunn, J.D.; Liu, Y.; Malek, A.; Davis, M. Effect of Cage Size on the Selective Conversion of Methanol to Light Olefins. ACS Catal. 2012, 2, 2490–2495. [Google Scholar] [CrossRef]
  30. Olsbye, U.; Svelle, S.; Bjørgen, M.; Beato, P.; Janssens, T.V.W.; Joensen, F.; Bordiga, S.; Lillerud, K.P. Conversion of Methanol to Hydrocarbons: How Zeolite Cavity and Pore Size Controls Product Selectivity. Angew. Chem. Int. Ed. 2012, 51, 5810–5831. [Google Scholar] [CrossRef]
  31. Ferri, P.; Li, C.; Millán, R.; Martínez-Triguero, J.; Moliner, M.; Boronat, M.; Corma, A. Impact of Zeolite Framework Composition and Flexibility on Methanol-To-Olefins Selectivity: Confinement or Diffusion? Angew. Chem. Int. Ed. 2020, 59, 19708–19715. [Google Scholar] [CrossRef] [PubMed]
  32. Mo, Z.S.; Li, Q.; Qin, Y.C.; Duan, L.H.; Zhang, X.T.; Song, L.J. A DFT study of the effect of NNN Al atom on strength of Brönsted acid sites of HY zeolite. Mol. Simul. 2016, 42, 986–992. [Google Scholar] [CrossRef]
  33. Bernauer, M.; Tabor, E.; Pashkova, V.; Kauchý, D.; Sobalík, Z.; Wichterlová, B.; Dedecek, J. Proton proximity—New key parameter controlling adsorption, desorption and activity in propene oligomerization over H-ZSM-5 zeolites. J. Catal. 2016, 344, 157–172. [Google Scholar] [CrossRef]
  34. Seifert, M.; Marschall, M.S.; Gille, T.; Jonscher, C.; Busse, O.; Paasch, S.; Brunner, E.; Reschetilowski, W.; Weigand, J.J. Ethanol to Aromatics on Modified H-ZSM-5 Part I: Interdependent Dealumination Actions. ChemCatChem 2020, 12, 6301–6310. [Google Scholar] [CrossRef]
  35. Madeira, F.F.; Gnep, N.S.; Magnoux, P.; Vezin, H.; Maury, S.; Cadran, N. Mechanistic insights on the ethanol transformation into hydrocarbons over HZSM-5 zeolite. Chem. Eng. J. 2010, 161, 403–408. [Google Scholar] [CrossRef]
  36. Sousa, Z.S.B.; Veloso, C.O.; Henriques, C.A.; da Silva, V.T. Ethanol conversion into olefins and aromatics over HZSM-5 zeolite:Influence of reaction conditions and surface reaction studies. J. Mol. Catal. A Chem. 2016, 422, 266–274. [Google Scholar] [CrossRef]
  37. Choudhary, V.R.; Nayak, V.S. Conversion of alcohols to aromatics on H-ZSM-5: Influence of SiAl ratio and degree of cation exchange on product distribution. Zeolites 1985, 5, 325–328. [Google Scholar] [CrossRef]
  38. Hwang, A.; Bhan, A. Deactivation of Zeolites and Zeotypes in Methanol-to-Hydrocarbons Catalysis: Mechanisms and Circumvention. Acc. Chem. Res. 2019, 52, 2647–2656. [Google Scholar] [CrossRef]
  39. Ezinkwo, G.O.; Tretyakov, V.P.; Aliyu, A.; Ilolov, A.M. Fundamental Issues of Catalytic Conversion of Bio-Ethanol into Butadiene. ChemBioEng Rev. 2014, 1, 194–203. [Google Scholar] [CrossRef]
  40. ASTM, D 5758—01: Standard Test Method for Determination of Relative Crystallinity of Zeolite ZSM-5 by X-Ray Diffraction. ASTM Int. 2015, 5, 3–5.
  41. Van Koningsveld, H.; van Bekkum, H.; Jansen, J.C. On the location and disorder of the tetrapropylammonium (TPA) ion in zeolite ZSM-5 with improved framework accuracy. Acta Cryst. 1987, B43, 127–132. [Google Scholar] [CrossRef] [Green Version]
  42. MFI Structure—Database of Zeolite Structures. Available online: http://europe.iza-structure.org/IZA-SC/pow_pat.php?STC=MFI&ID=MFI_0 (accessed on 26 February 2021).
  43. Shukla, D.B.; Pandya, V.P. Estimation of crystalline phase in ZSM-5 zeolites by infrared spectroscopy. J. Chem. Technol. Biotechnol. 1989, 44, 147–154. [Google Scholar] [CrossRef]
  44. Topsøe, N.Y.; Pedersen, K.; Derouane, E.G. Infrared and temperature-programmed desorption study of the acidic properties of ZSM-5-type zeolites. J. Catal. 1981, 70, 41–52. [Google Scholar] [CrossRef]
  45. Hidalgo, C.V.; Itoh, H.; Hattori, T.; Niwa, M.; Murakami, Y. Measurement of the acidity of various zeolites by temperature-programmed desorption of ammonia. J. Catal. 1984, 85, 362–369. [Google Scholar] [CrossRef]
  46. Reschetilowski, W.; Unger, B.; Wendlandt, K.P. Study of the Ammonia-Zeolite Interaction in Modified ZSM-5 by Temperature-programmed Desorption of Ammonia. J. Chem. Soc. Faraday Trans. 1 Phys. Chem. Condens. Phases 1989, 85, 2941–2944. [Google Scholar] [CrossRef]
  47. Schnabel, K.H.; Peuker, C.; Parlitz, B.; Löffler, E.; Kürschner, U.; Kriegsmann, H. IR-spektroskopische Untersuchungen zur Adsorption von NH3 und H2O an Na- und H-ZSM-5. Z. Phys. Chem. 1987, 268, 225–234. [Google Scholar] [CrossRef]
  48. Lónyi, F.; Valyon, J. On the interpretation of the NH3-TPD patterns of H-ZSM-5 and H-mordenite. Micropor. Mesopor. Mater. 2001, 47, 293–301. [Google Scholar] [CrossRef]
  49. Brunauer, S.; Emmett, P.H.; Teller, E. Adsorption of Gases in Multimolecular Layers. J. Am. Chem. Soc. 1938, 60, 309–319. [Google Scholar] [CrossRef]
  50. Barrett, E.P.; Joyner, L.G.; Halenda, P.P. Study of pore size distribution by capillary absorption method. J. Am. Chem. Soc. 1951, 73, 373–380. [Google Scholar] [CrossRef]
  51. ISO 13320: Particle Size Analysis—Laser Diffraction Methods; International Organization for Standardization: Geneva, Switzerland, 2019.
  52. Mohan, V.; Raghavendra, C.; Pramod, C.V.; Raju, B.D.; Rao, K.S.R. Ni/H-ZSM-5 as a promising catalyst for vapour phase hydrogenation of levulinic acid at atmospheric pressure. RSC Adv. 2014, 4, 9660–9668. [Google Scholar] [CrossRef]
  53. ASTM D6730–19: Standard Test Method for Determination of Individual Components in Spark Ignition Engine Fuels by 100-Metre Capillary (with Pre-column) High-Resolution Gas Chromatography. ASTM Int. 2019, 01, 1–3.
  54. Scanlon, J.T.; Willis, D.E. T Calculation of Flame Ionization Detector Relative Response Factors Using the Effective Carbon Number Concept. J. Chromatogr. Sci. 1985, 23, 333–340. [Google Scholar] [CrossRef]
  55. Boda, L.; Onyestyák, G.; Solt, H.; Lónyi, F.; Valyon, J.; Thernesz, A. Catalytic hydroconversion of tricaprylin and caprylic acid as model reaction for biofuel production from triglycerides. Appl. Catal A Gen. 2010, 374, 158–169. [Google Scholar] [CrossRef]
  56. Pham, T.N.; Sooknoi, T.; Crossley, S.P.; Resasco, D.E. Ketonization of Carboxylic Acids: Mechanisms, Catalysts, and Implications for Biomass Conversion. ACS Catal. 2013, 3, 2456–2473. [Google Scholar] [CrossRef]
  57. Maier, W.F.; Roth, W.; Thies, I.; Schleyer, P.V.R. Hydrogenolysis, IV. Gas phase decarboxylation of carboxylic acids. Chem. Ber. 1982, 115, 808–812. [Google Scholar] [CrossRef]
  58. Rozmyslowicz, B.; Mäki-Arvela, P.; Tokarev, A.; Leino, A.R.; Eränen, K.; Murzin, D.Y. Influence of Hydrogen in Catalytic Deoxygenation of Fatty Acids and Their Derivatives over Pd/C. Ind. Eng. Chem. Res. 2012, 51, 8922–8927. [Google Scholar] [CrossRef]
Figure 2. (a) Powder X-ray diffraction patterns, (b) N2 physisorption isotherms, (c) temperature-programmed ammonia desorption (TPAD) profiles of the prepared H-ZSM-5 zeolite samples.
Catalysts 11 00432 g002
Figure 3. Comparison of morphologies of prepared H‑ZSM-5 zeolite samples by SEM imaging at magnification x 5000: (ad) samples Z-inf, Z-250, Z-80, Z-35; from Si-rich (Z-inf) to Al-rich samples (Z-35) typical coffin-shaped zeolites of approx. 10 µm switch to smaller spheres of approx. 4 µm.
Catalysts 11 00432 g003
Figure 4. Comparison of particle size distribution of H‑ZSM-5 zeolite samples by dynamic laser scattering: (ad) samples Z-inf, Z-250, Z-80, Z-35; similar distribution, but from Si-rich (Z-inf) to Al-rich samples (Z-35) shift in main particle fraction towards smaller sizes, also visible within D50.
Catalysts 11 00432 g004
Figure 5. Comparison of catalytic results of prepared H‑ZSM-5 zeolite samples with various Si/Al ratios (ad) in the conversion of primary alcohols C1-OH to C7-OH; blue bars = increased carbon yield for products corresponding to direct dehydration of primary alcohols (increased C2 for C2-OH, increased C3 for C3-OH, etc.); pink bars = increased carbon yield for direct cleavage of C6 product after dehydration of C6-OH into C3 + C3; yellow bars = increased carbon yield for direct cleavage of C7 product into C3 + C4 after dehydration of C7-OH.
Catalysts 11 00432 g005
Figure 6. Comparison of catalytic results of prepared H-ZSM-5 zeolite samples with various Si/Al ratios (ad) in the conversion of oxygenates with different functional groups; green and orange bars: relatively increased carbon yield for C2 products and decreased carbon yield for C3 and C4 products for feeds containing a C2 chain (C7-COOC2 = ethyloctanoate, C7-OH_C2-OH = equimolar solution of 1-heptanol and ethanol).
Catalysts 11 00432 g006
Figure 7. Comparison of catalytic results of prepared H-ZSM-5 zeolite samples with various Si/Al ratios at the conversion of different feeds based on substance group: (ac) comparison of carbon yields in alcohol conversion in experimental series 1 and (df) comparison of oxygenates with different functional groups in experimental series 2.
Catalysts 11 00432 g007
Table 1. Textural and acidity properties of the prepared H-ZSM-5 zeolite samples.
SampleTexture
SBET 1VPore 1Dcrys. A 2Dcrys. B 2Dcrys. IR 3
(m2/g)(cm3/g)(%)(%)(% (ratio))
Z-inf3950.17100100100 (0.62)
Z-2504210.19939798 (0.60)
Z-804230.189598100 (0.61)
Z-354210.187484100 (0.62)
SampleAcidity
Si/Al 4Totall-Peakh-Peak
(-)(mmol NH3/g) 5(mmol NH3/g) 5(mmol NH3/g) 5
Z-inf 0.060.02 (36%)0.04 (64%)
Z-2502780.220.07 (33%)0.15 (67%)
Z-80770.490.19 (39%)0.30 (61%)
Z-35341.100.44 (40%)0.66 (60%)
1 N2 physisorption; analysis of adsorption isotherm with the point of complete micro-pore filling. 2 Powder X-ray diffraction; analysis of reflexes at 21–26° 2 θ according to ASTM D5758-01, sample with the highest value set to 100%. 3 ATR-FT-IR; analysis of the ratio of absorbance at 450 cm−1 and 550 cm−1, standardized to 100% for the sample with the highest value; for spectra, see Appendix B, Figure A2. 4 ICP-OES; analysis of Si and Al content of samples after digestion. 5 TPAD; temperature-programmed ammonia desorption - calculation of specific amount of NH3 adsorbed on the solid-state surface, separated into a low(l)- and high(h)-temperature peak.
Table 2. C3/C4 carbon yield ratio as dependent on Al content of the H-ZSM-5 samples in the conversion of oxygenates with different functional groups compared to primary alcohols.
Catalyst SampleC7-CHOC7-COOHC7-COOC2C7-OHC7-OH + C2-OH
Z-inf1.61.41.41.31.3
Z-2501.61.51.51.31.4
Z-801.71.61.61.61.6
Z-352.01.91.92.02.1
Table 3. Comparison of catalytic data of prepared H-ZSM-5 samples during the conversion of different feeds based on substance group (carbon yield) with dependence on Time on Stream.
FeedSubstance Group/Time on Stream/Z-35
0.5 h1.5 h2.5 h3.5 h4.5 h5.5 h
Olefins
C7-OH25.924.324.925.026.426.7
C7-CHO26.425.823.022.824.624.4
Paraffins
C7-OH63.964.563.362.861.561.6
C7-CHO56.251.647.145.444.542.9
Aromatics
C7-OH6.47.37.78.28.58.4
C7-CHO8.913.420.121.821.122.7
C1–C4 products
C7-OH84.283.783.583.082.281.4
C7-CHO78.072.865.864.564.563.8
Table 4. Process parameters of hydrothermal synthesis of ZSM-5 zeolite samples.
SampleTPABr 1Na2Si3O7NaAlO2H2SO4H2OSD 2
m (g)m (g)m (g)V (mL)V (mL)(h)
(c (mol/L))(c (mol/L))(c (mmol/L))(Vol.%)
Z-inf60.00 (0.23)100.00 (0.41)0.00 (0.00)30.6 (3.0)100040
Z-25060.00 (0.23)100.00 (0.41)0.40 (4.88)30.7 (3.0)100040
Z-8060.00 (0.23)100.00 (0.41)1.27 (15.49)28.0 (2.7)100048
Z-3560.00 (0.23)100.00 (0.41)2.90 (35.38)30.6 (3.0)1000100
1 TPABr = organic template tetrapropyl ammonium bromide. 2 SD = Synthesis duration for respective zeolite samples.
Publisher’s Note: MDPI stays neutral with regard to jurisdictional claims in published maps and institutional affiliations.

