Article

Advanced Synthesis and Characterization of Vanadia/Titania Catalysts through a Molecular Approach

by
Eleni Tella
1,
Antonios Trimpalis
2,
Athanasios Tsevis
3,
Christos Kordulis
1,3,4,
Alexis Lycourghiotis
1,
Soghomon Boghosian
2,3,4 and
Kyriakos Bourikas
3,*
1
Department of Chemistry, University of Patras, GR-26504 Patras, Greece
2
Department of Chemical Engineering, University of Patras, GR-26504 Patras, Greece
3
School of Science and Technology, Hellenic Open University, Tsamadou 13-15, GR-26222 Patras, Greece
4
Foundation for Research and Technology, Institute of Chemical Engineering Science (FORTH/ICE-HT), Stadiou Str., Platani, P.O. Box 1414, GR-26500 Patras, Greece
*
Author to whom correspondence should be addressed.
Catalysts 2021, 11(3), 322; https://doi.org/10.3390/catal11030322
Submission received: 29 January 2021 / Revised: 18 February 2021 / Accepted: 25 February 2021 / Published: 2 March 2021

Abstract

:
Vanadia/titania catalysts were synthesized by the equilibrium deposition filtration (EDF) method, which is a synthesis route that follows a molecular-level approach. The type of interfacial deposition as well as the interfacial speciation of the deposited oxo-V(V) species were determined by means of a model that takes into account experimental “proton-ion” curves and “adsorption edges”. It is shown that at pH ≥ 9.5, the deposition proceeds exclusively through the formation of mono-substituted inner sphere monomeric species in an “umbrella”-like Ti–OV(OH)2O configuration, whilst with lowering of the pH, a second species, namely the disubstituted inner sphere quadrameric species in a (Ti-O)2V4O10 configuration possessing two mono-oxo V=O and two di-oxo V(=O)2 terminations gradually prevails, which is in co-existence with the monomeric species. Raman spectroscopy is used for verifying the solution speciation, which is different compared to the interfacial speciation of the deposited oxo-V(V) species. Furthermore, in situ Raman spectroscopy was used to verify the model-predicted interfacial speciation of the deposited oxo-V(V) species and to monitor the temperature-dependent evolution up to 430 °C. Hence, a controlled formation of a specific vanadia species on a titania surface is enabled, which, depending on the synthesis conditions, can result in specific catalyst characteristics and thus possibly different catalytic behavior for a specific reaction.

1. Introduction

Supported vanadium oxide catalysts are among the most widely studied functional materials for several catalytic applications [1]. More specifically, vanadia supported on titania catalysts is a very important material for many industrial processes, including those of environmental interest. It is worth mentioning dehydrogenation reactions [2,3,4,5], oxidation processes [6,7,8,9,10,11], water treatment through photocatalysis [12,13], and electrocatalysis [14]. However, the technology in which these catalysts are widely used is the selective catalytic reduction (SCR) of NOx, using mainly NH3 as a reductant. It is a well-established technology for the after-treatment control of the emissions of NOx formed during combustion in both mobile sources (e.g., diesel engines) and stationary sources (e.g., power plants) [15,16,17,18]. Moreover, in the last few years, a new challenging trend is the use of these catalysts for the abatement of multi-pollutants, including NOx, in the flue gas pollution control technology [19,20].
Although the VOx/TiO2 catalytic system has been studied extensively in the past [21,22,23], the research effort to improve the efficiency of the SCR process over these catalysts is still of great topical interest, since the legislation becomes increasingly stricter, requiring emission control of NOx due to their very negative impact on the environment through to smog formation, acid rain formation, and depletion of the ozone layer. Moreover, their use for both stationary and mobile sources with different characteristics and requirements has kept the scientific research interest for these catalysts at a very high level, despite their long history [21,22,24]. The research effort is directed to the development of catalysts with high SCR efficiency, broad operation temperature window, superb durability, hydrothermal stability, and high resistance against SO2/alkali/heavy metals [21,22]. To achieve these goals as well as fully elucidate the SCR mechanism, the scientific community strives for structure–reactivity relationships by focusing on the study of the structural properties of the active sites [25,26,27,28,29], tries to find the optimum surface density of vanadium [30], synthesizes binary systems concerning either the active phase (VOx) or the support (TiO2) [18,31,32,33,34], dopes the support [35], synthesizes metal vanadates [36], and tries to find the optimum thermal treatment of the catalysts [37] etc.
It is generally agreed that a very crucial factor in the SCR process (as well as in the other above-mentioned catalytic processes) is the identification of the vanadia active site, which, despite the extensive research, is still under debate. In order to reach this target, one has to begin from the first stage of the whole process, namely the catalysts synthesis. Two main routes are followed toward this direction: the use of model systems that provide full catalytic functionality but exhibit reduced chemical complexity [25,26,27,28,38,39] and the preparation of tailor-made catalysts using advanced synthesis methods [3,4]. The present study belongs to the second context. The superior efficiency of vanadia/titania catalysts prepared by advanced synthesis methods compared to the conventional ones has been reported repeatedly in the literature [18,21,34,40]. Moreover, excellent reviews and book chapters have been published on this subject, showing how the more sophisticated synthesis methods of supported catalysts can help us rationalize their synthesis, improve their efficiency, and control the formation of their active sites [41,42,43,44,45,46,47,48]. In this context, in the last years, we have developed supported transition metal catalysts through a molecular approach, using the equilibrium deposition filtration method (EDF), in order to fully control the impregnation step and specify the transition metal ionic species deposited on the support surface [49,50,51,52,53]. The present study is concerned with an effort to follow the formation of the vanadia site from the first to the final step of the catalyst synthesis procedure using the EDF method. To this end, the interfacial deposition process of the vanadates on titania (taking place in the impregnation step) is modeled based on experimental results, and the model results are verified by Raman spectroscopy, which is known as a powerful tool for elucidating the structural information of supported metal oxides and has been used extensively for studying vanadia SCR catalysts at the molecular level [54,55,56,57,58,59,60,61,62,63].
Hence, in the present work, first, the speciation of the oxo-V(V) species in the precursor impregnation solutions is determined in conditions relevant to the follow up impregnation step by means of a model taking into account pertinent experimental information, and the precursor solution speciation is verified by Raman spectroscopy. Secondly (and more importantly), the type of interfacial deposition of oxo-V(V) species at the interface between TiO2(P25) and the precursor electrolyte solution is investigated and a prediction of the interfacial speciation of deposited oxo-V(V) species is reached based on experimental results previously reported [64]. Then, in situ Raman spectroscopy is used for verifying the interfacial speciation of the as-prepared by the EDF method wet ΗKVXOYZ/TiO2 pastes and for monitoring the temperature-dependent evolution of the V(V) species at temperatures up to 430 °C.

2. Results and Discussion

2.1. Solution Speciation of Vanadates

Aqueous solutions of vanadium contain a variety of vanadium species (vanadates), such as monomers, quadramers, quintamers, decamers, etc., depending on the conditions. Figure 1 shows the schematic representation of the structures of some representative vanadates.
Using Visual MINTEQ [65], the solution speciation of V(V) was determined under conditions identical to those of the deposition experiments (adsorption edges). Table 1 gives the equations of the mass action law of the main species of vanadium used by the aforementioned computer program.
The concentration [S] (mol/L) of each species, compiled in Table 1, is calculated by reading the table horizontally and using the general Equation (1).
[ S ] = 10 log K k [ C k ] n k
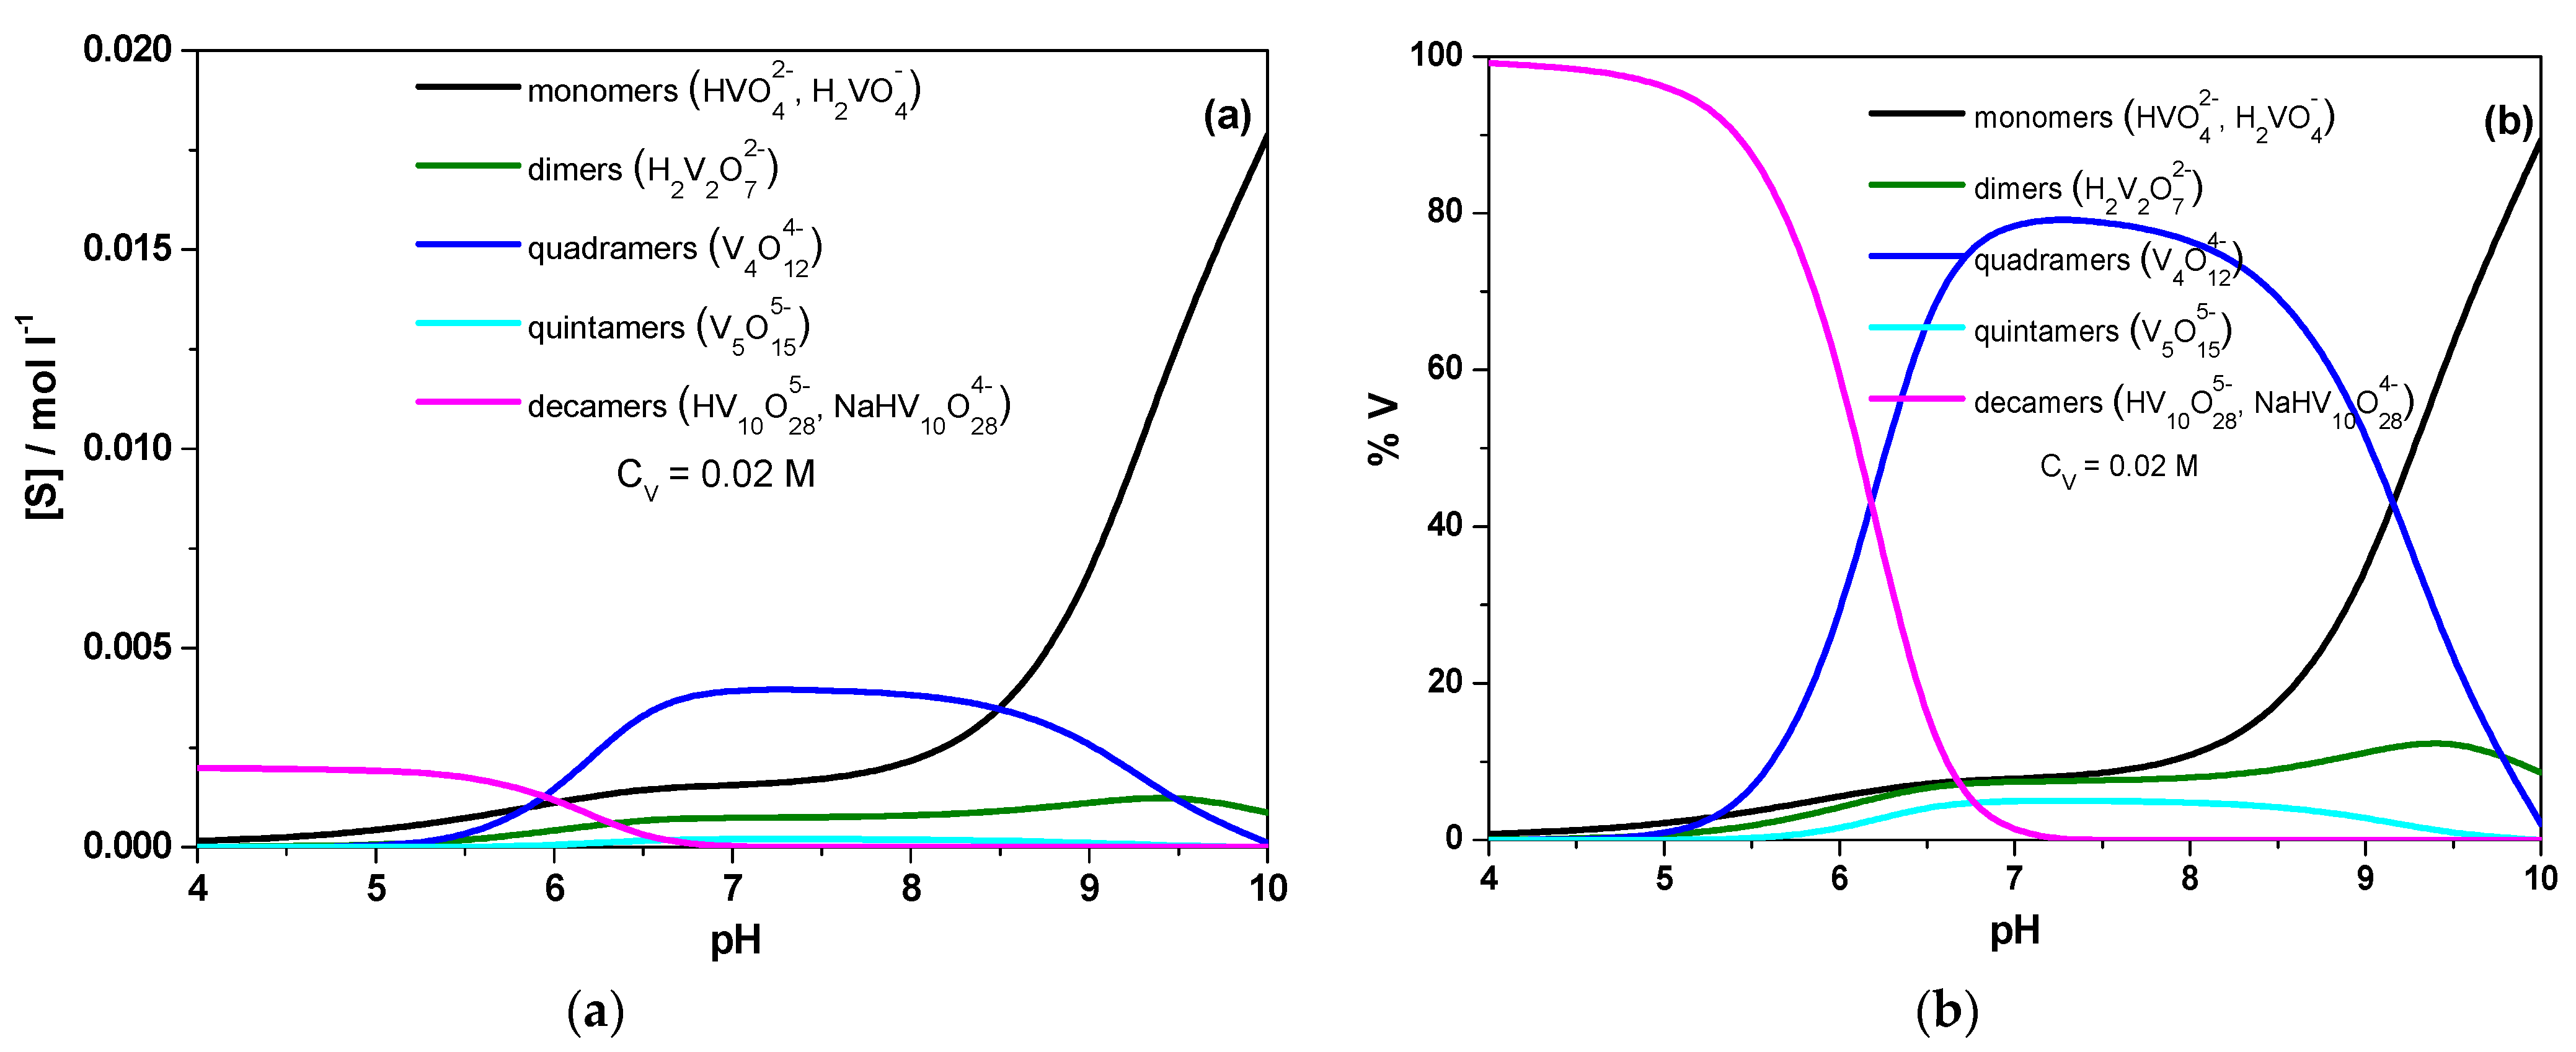
Ck is the concentration of a solution component (HVO42−, H+, Na+, H2O) illustrated in the first series of the table. The value of the exponent, nk, for each component is given in Table 1. To calculate the concentrations of all V(V) oxo-species, at each value of the solution parameters, we entered in the computer program (Visual MINTEQ) the values of pH (4–10), the total concentration of V(V) (2 × 10⁻² M, 3 × 10⁻³ M and 6 × 10⁻³ M), as well as the ionic strength of the solution (I = 0.1 N). The program solved the equations in Table 1 by incorporating the values of the constants of the species (logK) from the literature as well as the mass balance equations for each component shown in Table 1. The results are presented in Figure 2a,b as a double diagram. In the left diagram, the variation of the concentration ([S] (mol/L)) of the main vanadium species with the pH is presented, whereas the right one presents the distribution of total vanadium among the different species in the solution. The two diagrams are equivalent. Corresponding diagrams for two lower total V(V) concentrations are given in the Supplementary Materials (Figure S1).
Figure S1 shows that vanadium is present almost exclusively in the form of monomers at low total V concentrations (0.003 M and 0.006 M) and high pH values (>9). At such high pH values, quadramers also have a significant presence at high total V concentrations (i.e., 0.02 M) (Figure 2). On the contrary, at low pH values (<5) and in the whole V concentration range studied, vanadium is mainly present in the form of the decamers (Figure 2 and Figure S1). The speciation is more complicated at the intermediate pH range (5–9). Vanadium is mainly distributed among the monomers, the dimers, and the quadramers, with much less contribution of the quintamers. As the total V concentration increases, the concentration of the quadramers increase at the expense of that of the monomers and dimers (Figure 2 and Figure S1).

2.2. Kinetic Results

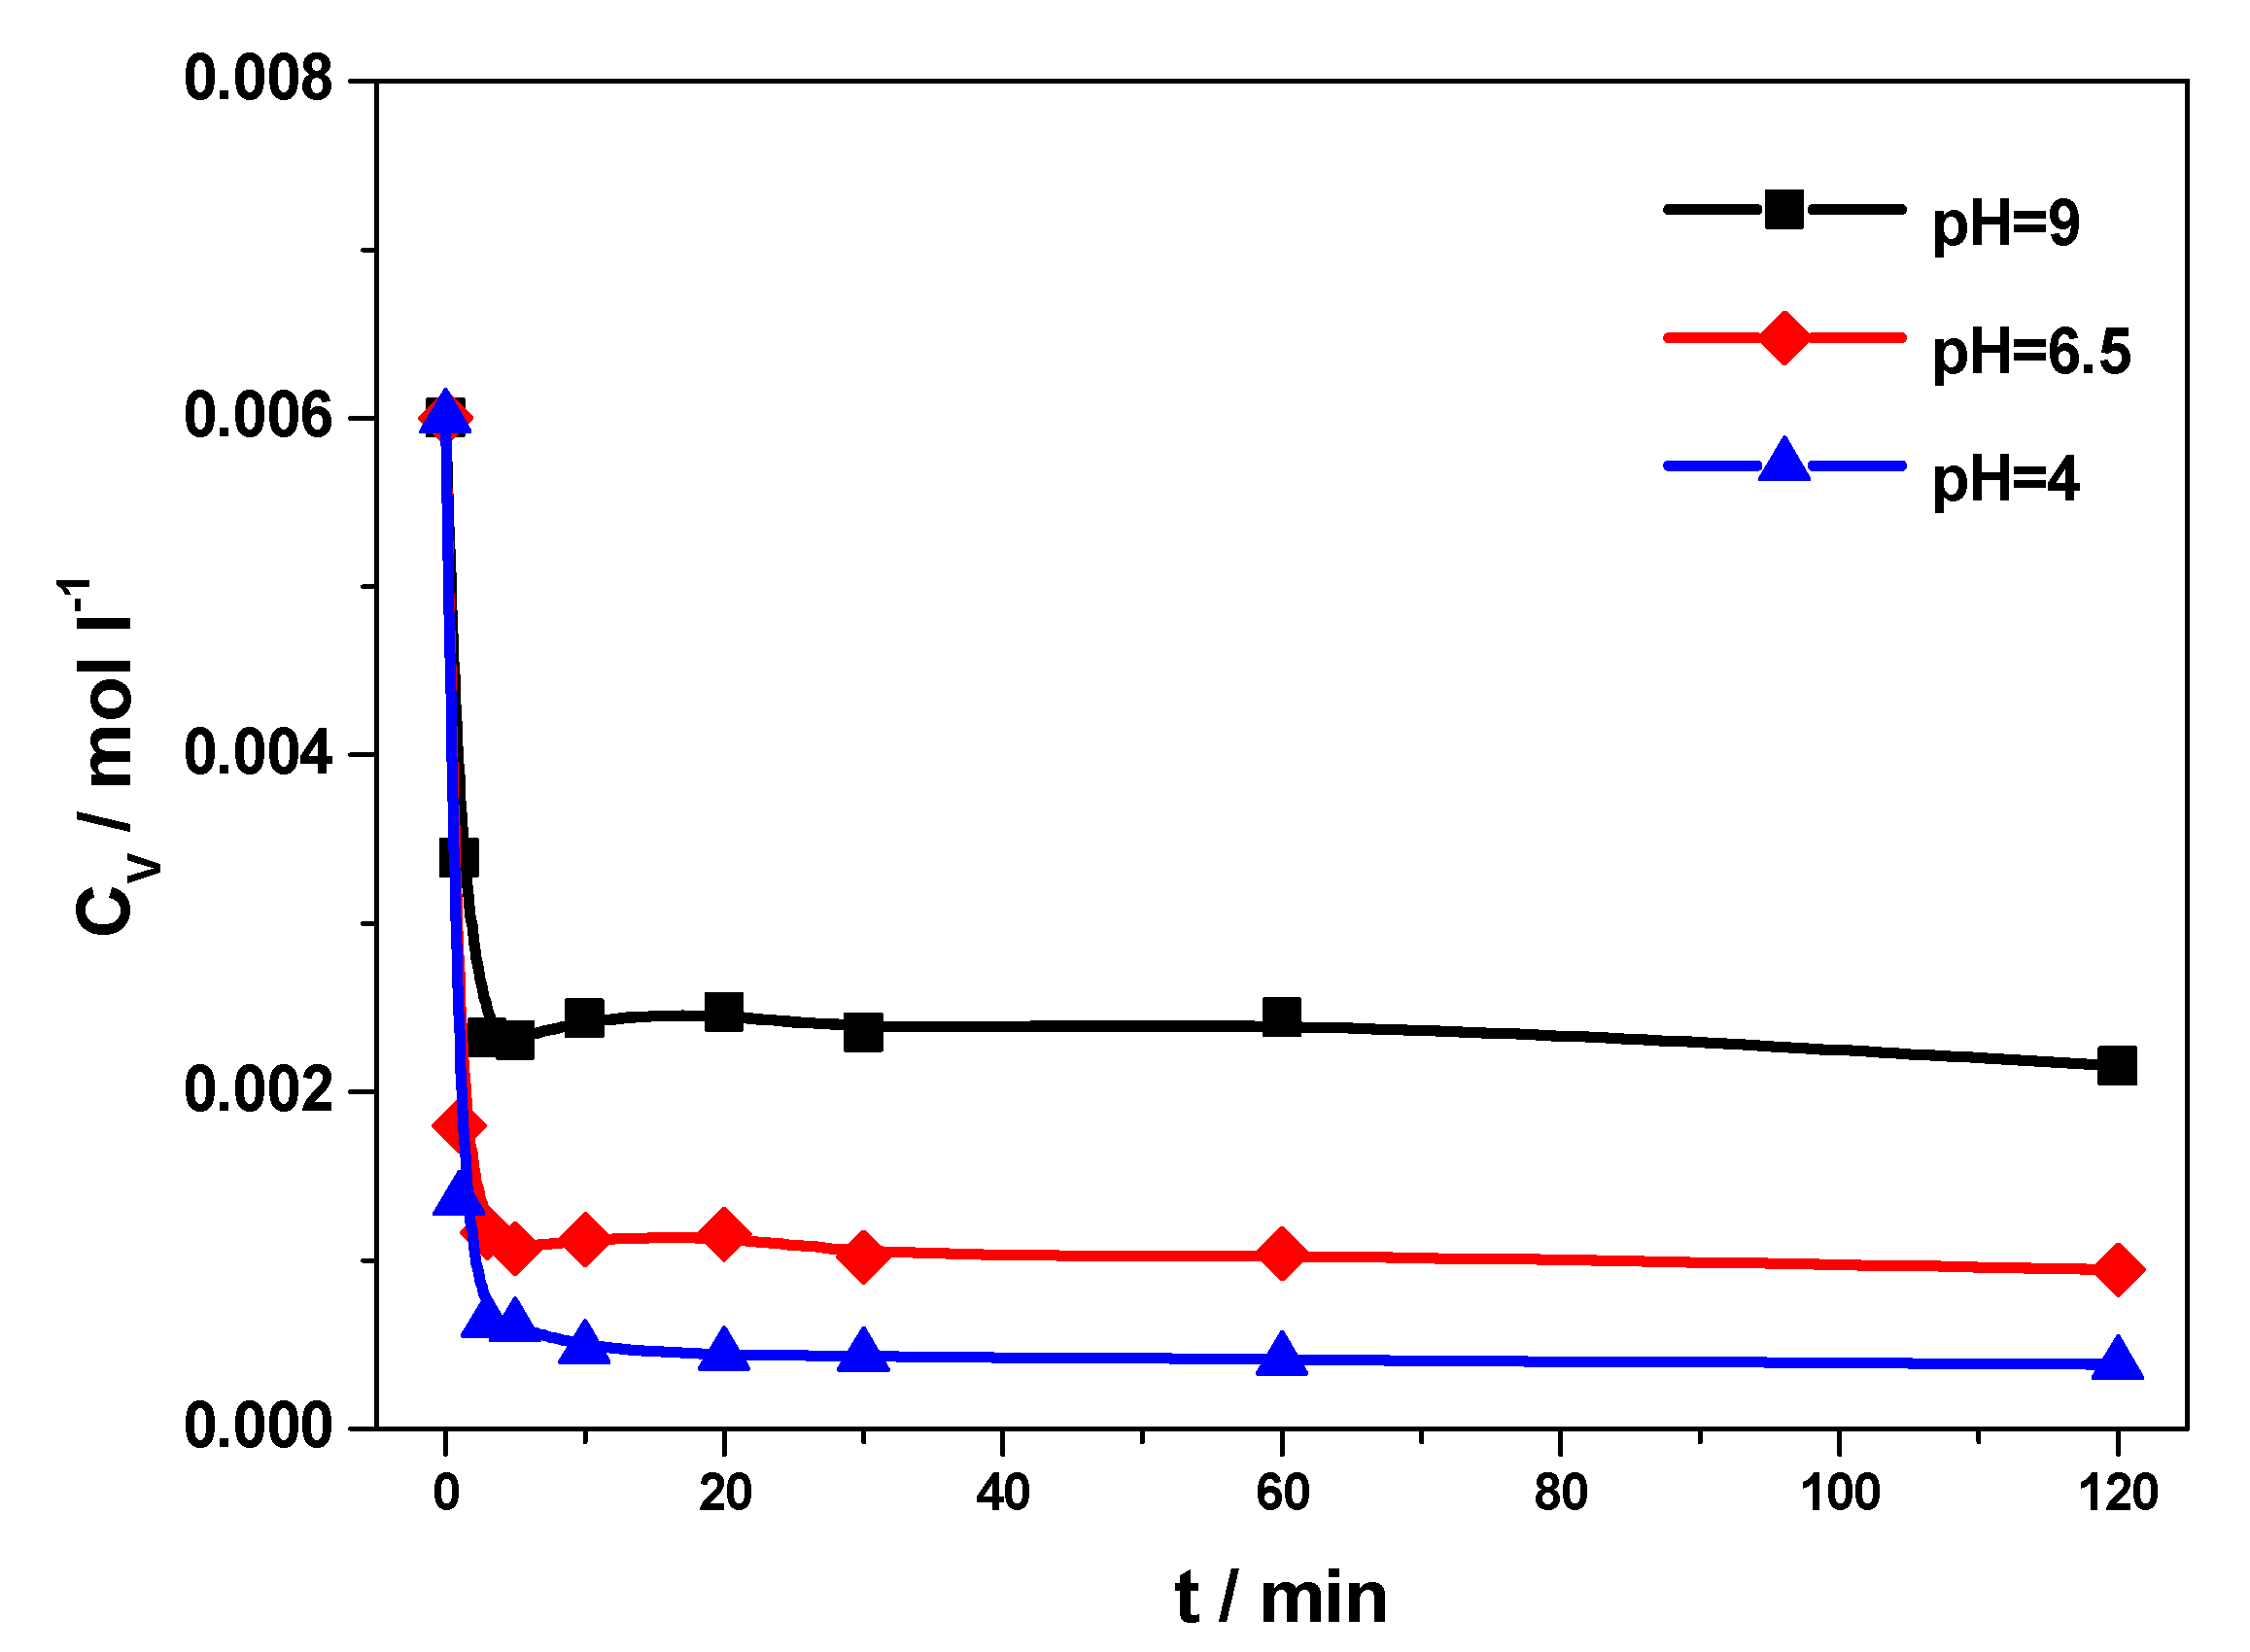
The results of the kinetic experiments are shown in Figure 3. We can conclude that regardless of pH, either at pH where the surface is positively charged (4.0), at pH where it is negatively charged (9.0), or at pH that is almost neutral (6.5), a very fast adsorption process takes place which is accomplished within the first 5 min. The above show a very strong chemical affinity between titanium oxide and vanadates.

2.3. Modeling the Deposition of Vanadates on Titania Surface

The modeling of the deposition of vanadates on the titania surface was based on a picture for the “titania/electrolyte solution” interface obtained from a previous work [66]. More specifically, the modeling adopted the values of the surface ionization constants of titania and the parameters of the “titania/electrolyte solution” interface in the absence of the vanadates. These can be found in Table A1. Upon modeling, the adjustable parameters of the simulation were the type of the adsorption or reaction processes involved in the deposition, the formation constants of the deposited V(V) oxo-species, and the charge distribution of these species at the various planes of the interface [66]. The full set of the equations adopted in the modeling can be found in Table A1.
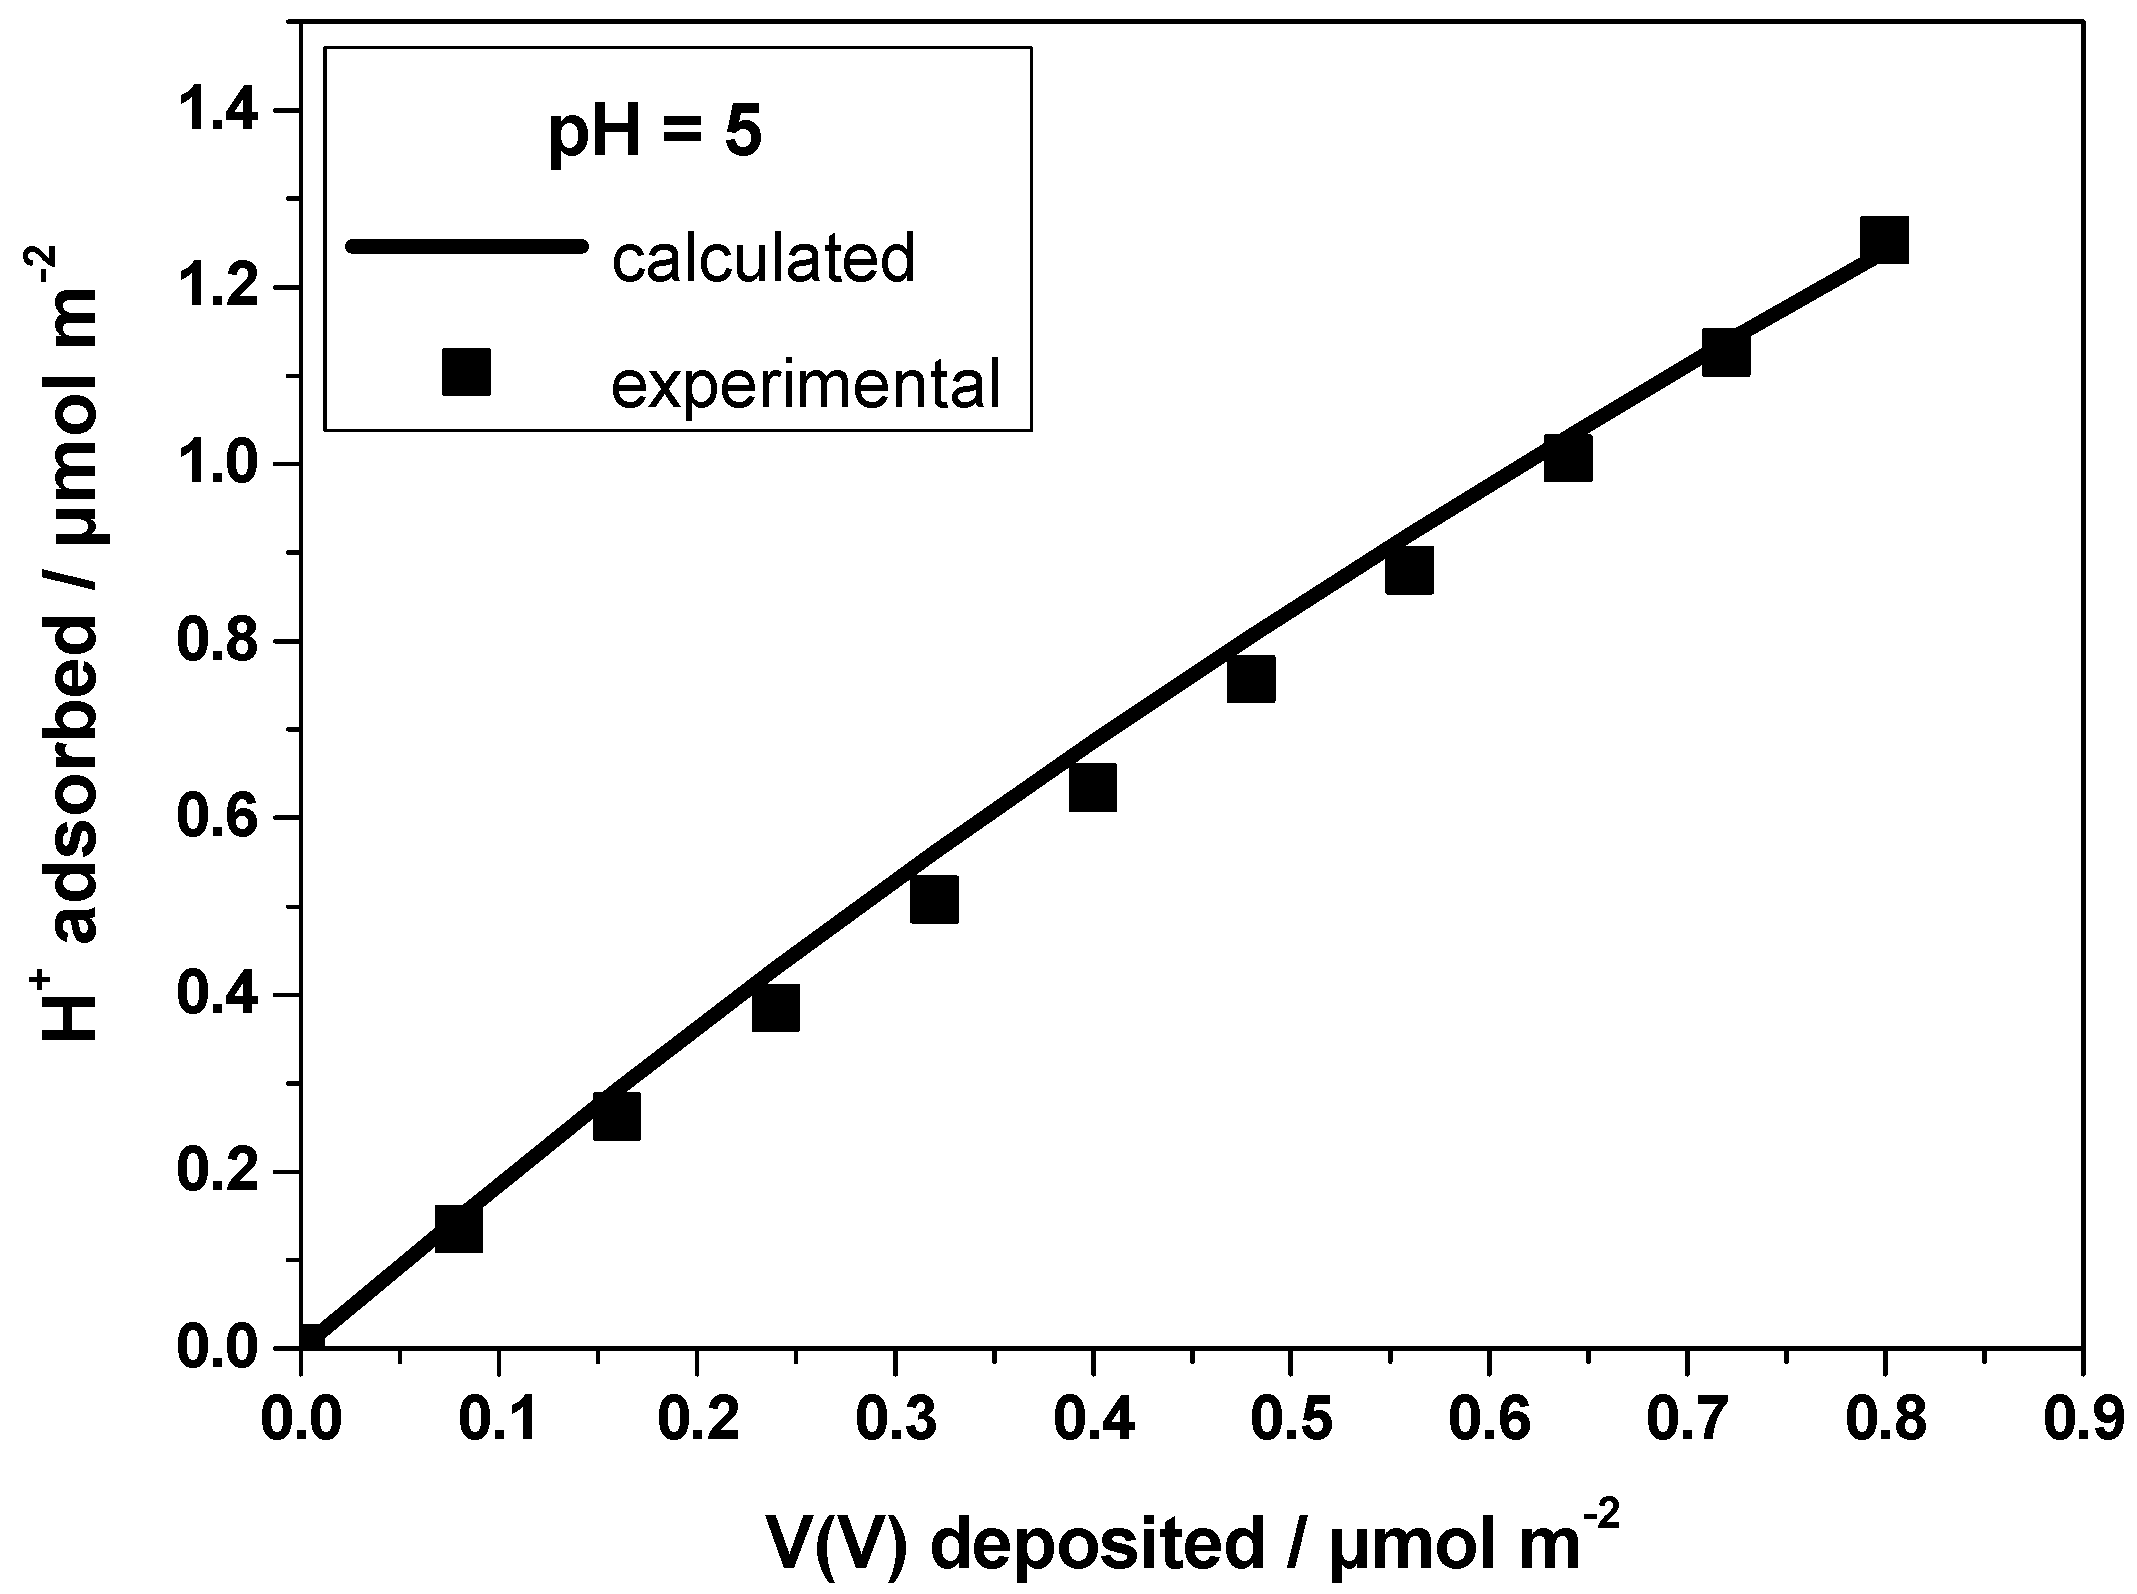
The first step of the modeling process was the simulation of the “proton-ion” data. The “proton-ion” curves are linear plots of the “amount of the H+ ions adsorbed versus the amount of the V deposited” at constant pH and under conditions favoring complete deposition of the V(V) oxo-species at the titania surface. The last can be achieved by working at too low V concentrations and a very high solid/solution ratio [41,49,64]. A successful fitting of these curves is only possible if the right deposition mechanism is adopted in the simulation [49,50,51,52,53]. This is the case in Figure 4. Similar fits have been achieved for all pH values (see Figure S2 in the Supplementary Materials).
The very good fitting of the “proton-ion” curves allowed the elucidation of the deposition mechanism of vanadates on titania surface, at too low V concentrations. This mechanism is described by Equilibria (2) and (3), which involve only vanadium monomers, since only these species are present in solutions of too low concentrations.
TiO 0.35 + 2 H + + H 2 VO 4 K T 1 TiOV ( OH ) 2 O + 0.65 + H 2 O
2 TiO 0.35 + 4 H + + H 2 VO 4 K T 2 ( TiO ) 2 V ( OH ) 2 + 2.3 + 2 H 2 O
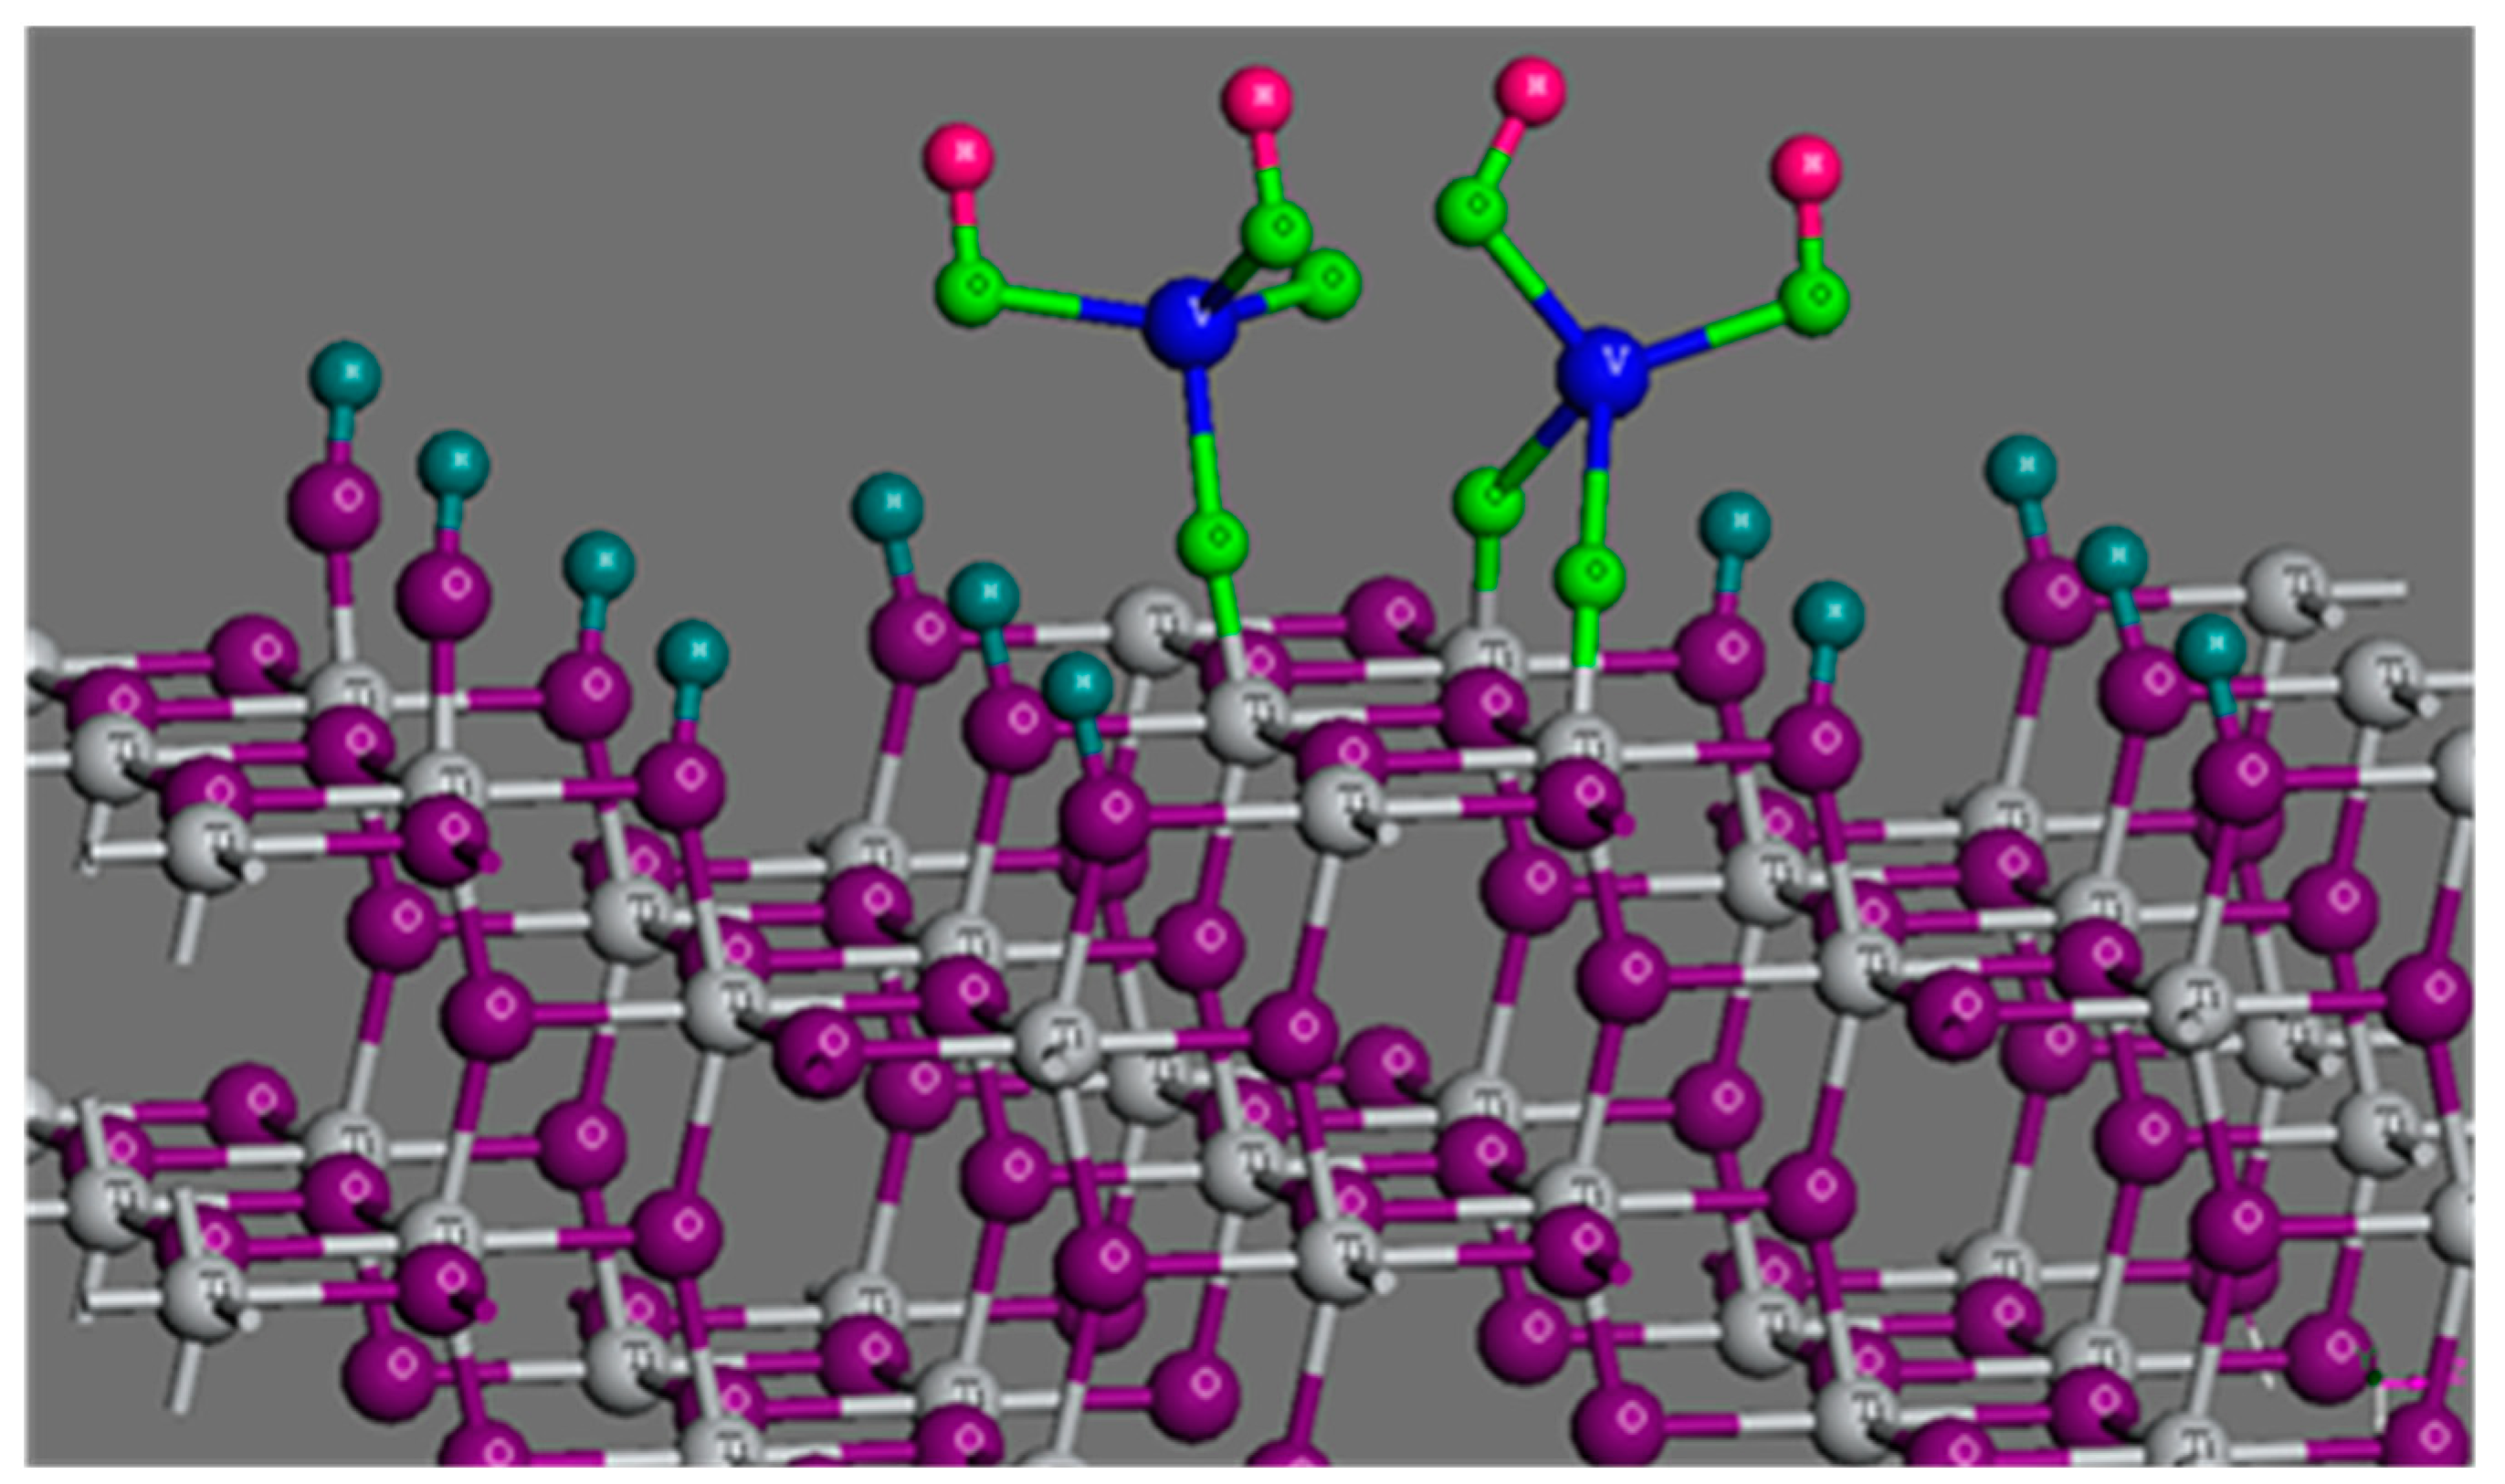
According to these equilibria, the monomers H2VO4 are deposited on the terminal hydroxyls of titania, forming mono-substituted and disubstituted inner sphere complexes. A schematic representation of the structures of the deposited species is illustrated in Figure 5. The anatase (1 0 0) crystal termination, one of the two majority crystal faces of anatase, has been chosen to exemplify these structures. Similar pictures may be obtained by considering the other majority crystal termination of the anatase (1 0 1).
The second step of the modeling process comes from a logical question raised at this point. This is whether the deposition process may be described exclusively by Equilibria (2) and (3) even at high V solution concentrations. In order to answer this question, we tried to simulate the adsorption edges, which cover a broad range of pH and V concentrations. The model curves failed to fit the experimental data. Thus, we forced to take into account all the vanadates present in the impregnation solutions (Figure 2). The best fit of the model curves to the experimental data is presented in Figure 6.
This fit was achieved by considering Equilibrium (4), in addition to (2) and (3), which were adopted previously for the deposition of the monomers.
2 TiO 0.35 + 4 H + + V 4 O 12 4 K T 3 ( TiO ) 2 V 4 O 10 0.7 + 2 H 2 O
According to this equilibrium, the deposition of vanadates on the titania surface takes place via the formation of a disubstituted inner sphere complex between two terminal hydroxyls of the titania surface and one quadramer ion. The structure of this complex on the anatase (1 0 1) crystal termination, one of the two majority crystal faces of anatase, is illustrated in Figure 7. A similar picture may be obtained by considering the other majority crystal termination of the anatase (1 0 0). It should be mentioned that according to the simulation results, the contribution of the other vanadates in the deposition of V on the titania surface is negligible. A last observation concerning the deposition is that according to Figure 6, vanadates are strongly adsorbed on the titania surface even at pH values where the surface is negatively charged. It is noteworthy that up to pH = 8, there is no pH dependency of the extent of deposition and such a lack of dependency is extended up to pH = 10 at a high total V concentration. This is in full agreement with the kinetic results, which pointed out a strong chemical affinity between titanium oxide and vanadates. This strong interaction leads to vanadia/titania catalysts with high dispersion of the vanadia phase and stable bi-dimensional vanadia structures. The latter will be also verified below by a detailed Raman spectroscopy study.

2.4. Determination of the Interfacial Speciation of Vanadates Adsorbed on Titania Surface

The successful fitting of the model curves to the experimental data by means of the deposition model (Figure 4 and Figure 6) allowed the calculation of the values of the formation constants, KT1, KT2, and KT3, of the deposited monomers and quadramers (see Equilibria (2)–(4) and Table A1). This allows us to calculate the interfacial speciation for any value of the main impregnation parameters, namely for any value of pH and V(V) solution concentration. Thus, the knowledge of the interfacial speciation is the key for depositing not only the desired amount of the total V on the titania surface but, in addition, the desired relative amounts of the V(V) oxo-species. Therefore, it is a very effective tool for obtaining a thorough control of the impregnation step and performing the catalyst synthesis on the basis of a molecular approach. In order to render this speciation more useful from the standpoint of catalyst synthesis, we have expressed it as the percentage of the V(V) deposited as a certain V(V) oxo-species. In Figure 8, the interfacial speciation of V(V) on titania, over the entire pH range studied, is illustrated as an example.
It can be previewed that at very high pH values (>10), vanadium is deposited on the titania surface exclusively as monomers. Amongst the two monomers, the mono-substituted inner sphere complex TiOV(OH)2O is by far the prevailing species. As the pH decreases, the contribution of quadramers on the deposition of V(V) on titania becomes more and more significant. At a pH value ≈8.5, half of the deposited V is in the form of monomers, while the other half is in the form of quadramers. At pH values lower than 6, quadramers are the prevailing species containing ≈70% of the deposited vanadium. A comparison of Figure 8 with Figure 2f shows that the titania surface exhibits a preference for adsorbing monomers. In the intermediate pH region (6–8), Figure 2f shows that V is mainly in the form of quadramers in the solution. However, Figure 8 shows that at the same pH region, a significant portion of the deposited V is in the form of monomers. Moreover, at low pH values (<6), Figure 2f shows that the predominant species in the solution are the decamers, whereas at the interface (Figure 8), V can be found mainly in the form of quadramers and monomers. The absence of decamers at the interface (although predominant in the solution) will be further examined and verified by laser Raman Spectroscopy. It should be mentioned that the preferential adsorption of monomeric species on titania in a wide pH range has also been observed in the deposition of other oxo-anions of transition metals, such as tungstates [53], molybdates [49], and chromates [50].

2.5. Raman Spectroscopy

2.5.1. Solution Speciation of Vanadates

As discussed above, the oxovanadate species possibly formed in aqueous solutions include ΗVO42−, H2VO4, H2V2O72−, V4O124−, V5O155−, HV10O285−, and NaΗV10O284−. Considering the above species with their respective formation constants, the solution speciation of the oxo-V(V) species was determined for various initial concentrations of V(V), C V ( V ) total , in the pH range 10–4 (vide ante, Section 2.1, Figure 2). Figure 2e,f shows the pertinent results for C V ( V ) total = 0.02   M , which is of direct relevance to the conditions used for the equilibrium deposition of the vanadate species for preparing the samples studied by Raman spectroscopy. Briefly, the model results show that for pH = 10, the monomeric tetrahedral vanadate in protonated ΗVO42− and/or H2VO4 (Figure 1a) form is almost exclusively present, whilst for pH = 9, a significant portion of vanadium occurs in the form of the tetrameric V4O124− species (Figure 1b) with di-oxo O=V=O termination configuration and fourfold coordination for each V atom. Species V4O124− prevails in the pH region 9–6.5, whereas for pH ≤ 6, the decavanadate polymeric species HV10O285− and NaΗV10O284− gradually prevail and become predominant for pH = 5–4. The V10O286− anion consists of corner sharing VO5 and VO6 units and possesses eight terminal O atoms in mono-oxo V=O termination configurations. Two of the VO6 units do not contain terminal O atoms (Figure 1c).
The tetrahedral ( T d ) VO43− ion has four vibrational modes that span the following irreducible representation:
Γ v i b = A 1 ( ν 1 ) + E ( ν 2 ) + 2 F 2 ( ν 3 + ν 4 ) .
Only the F2 modes are IR allowed, whereas all modes are active in the Raman spectrum. Based on the usual weak-couplings approximation, modes ν 1 and ν 3 are stretchings and modes ν 2 and ν 4 are bendings. Typical wavenumbers for the free ion in aqueous solutions are reported as follows [67]: ν 1 ( A 1 )   826 cm−1, ν 2 ( E ) 336 cm−1, ν 3 ( F 2 )   804 cm−1, and ν 4 ( F 2 ) 336 cm−1. However, protonation and interionic interactions are expected to perturb the bond strengths and shift the observed modes.
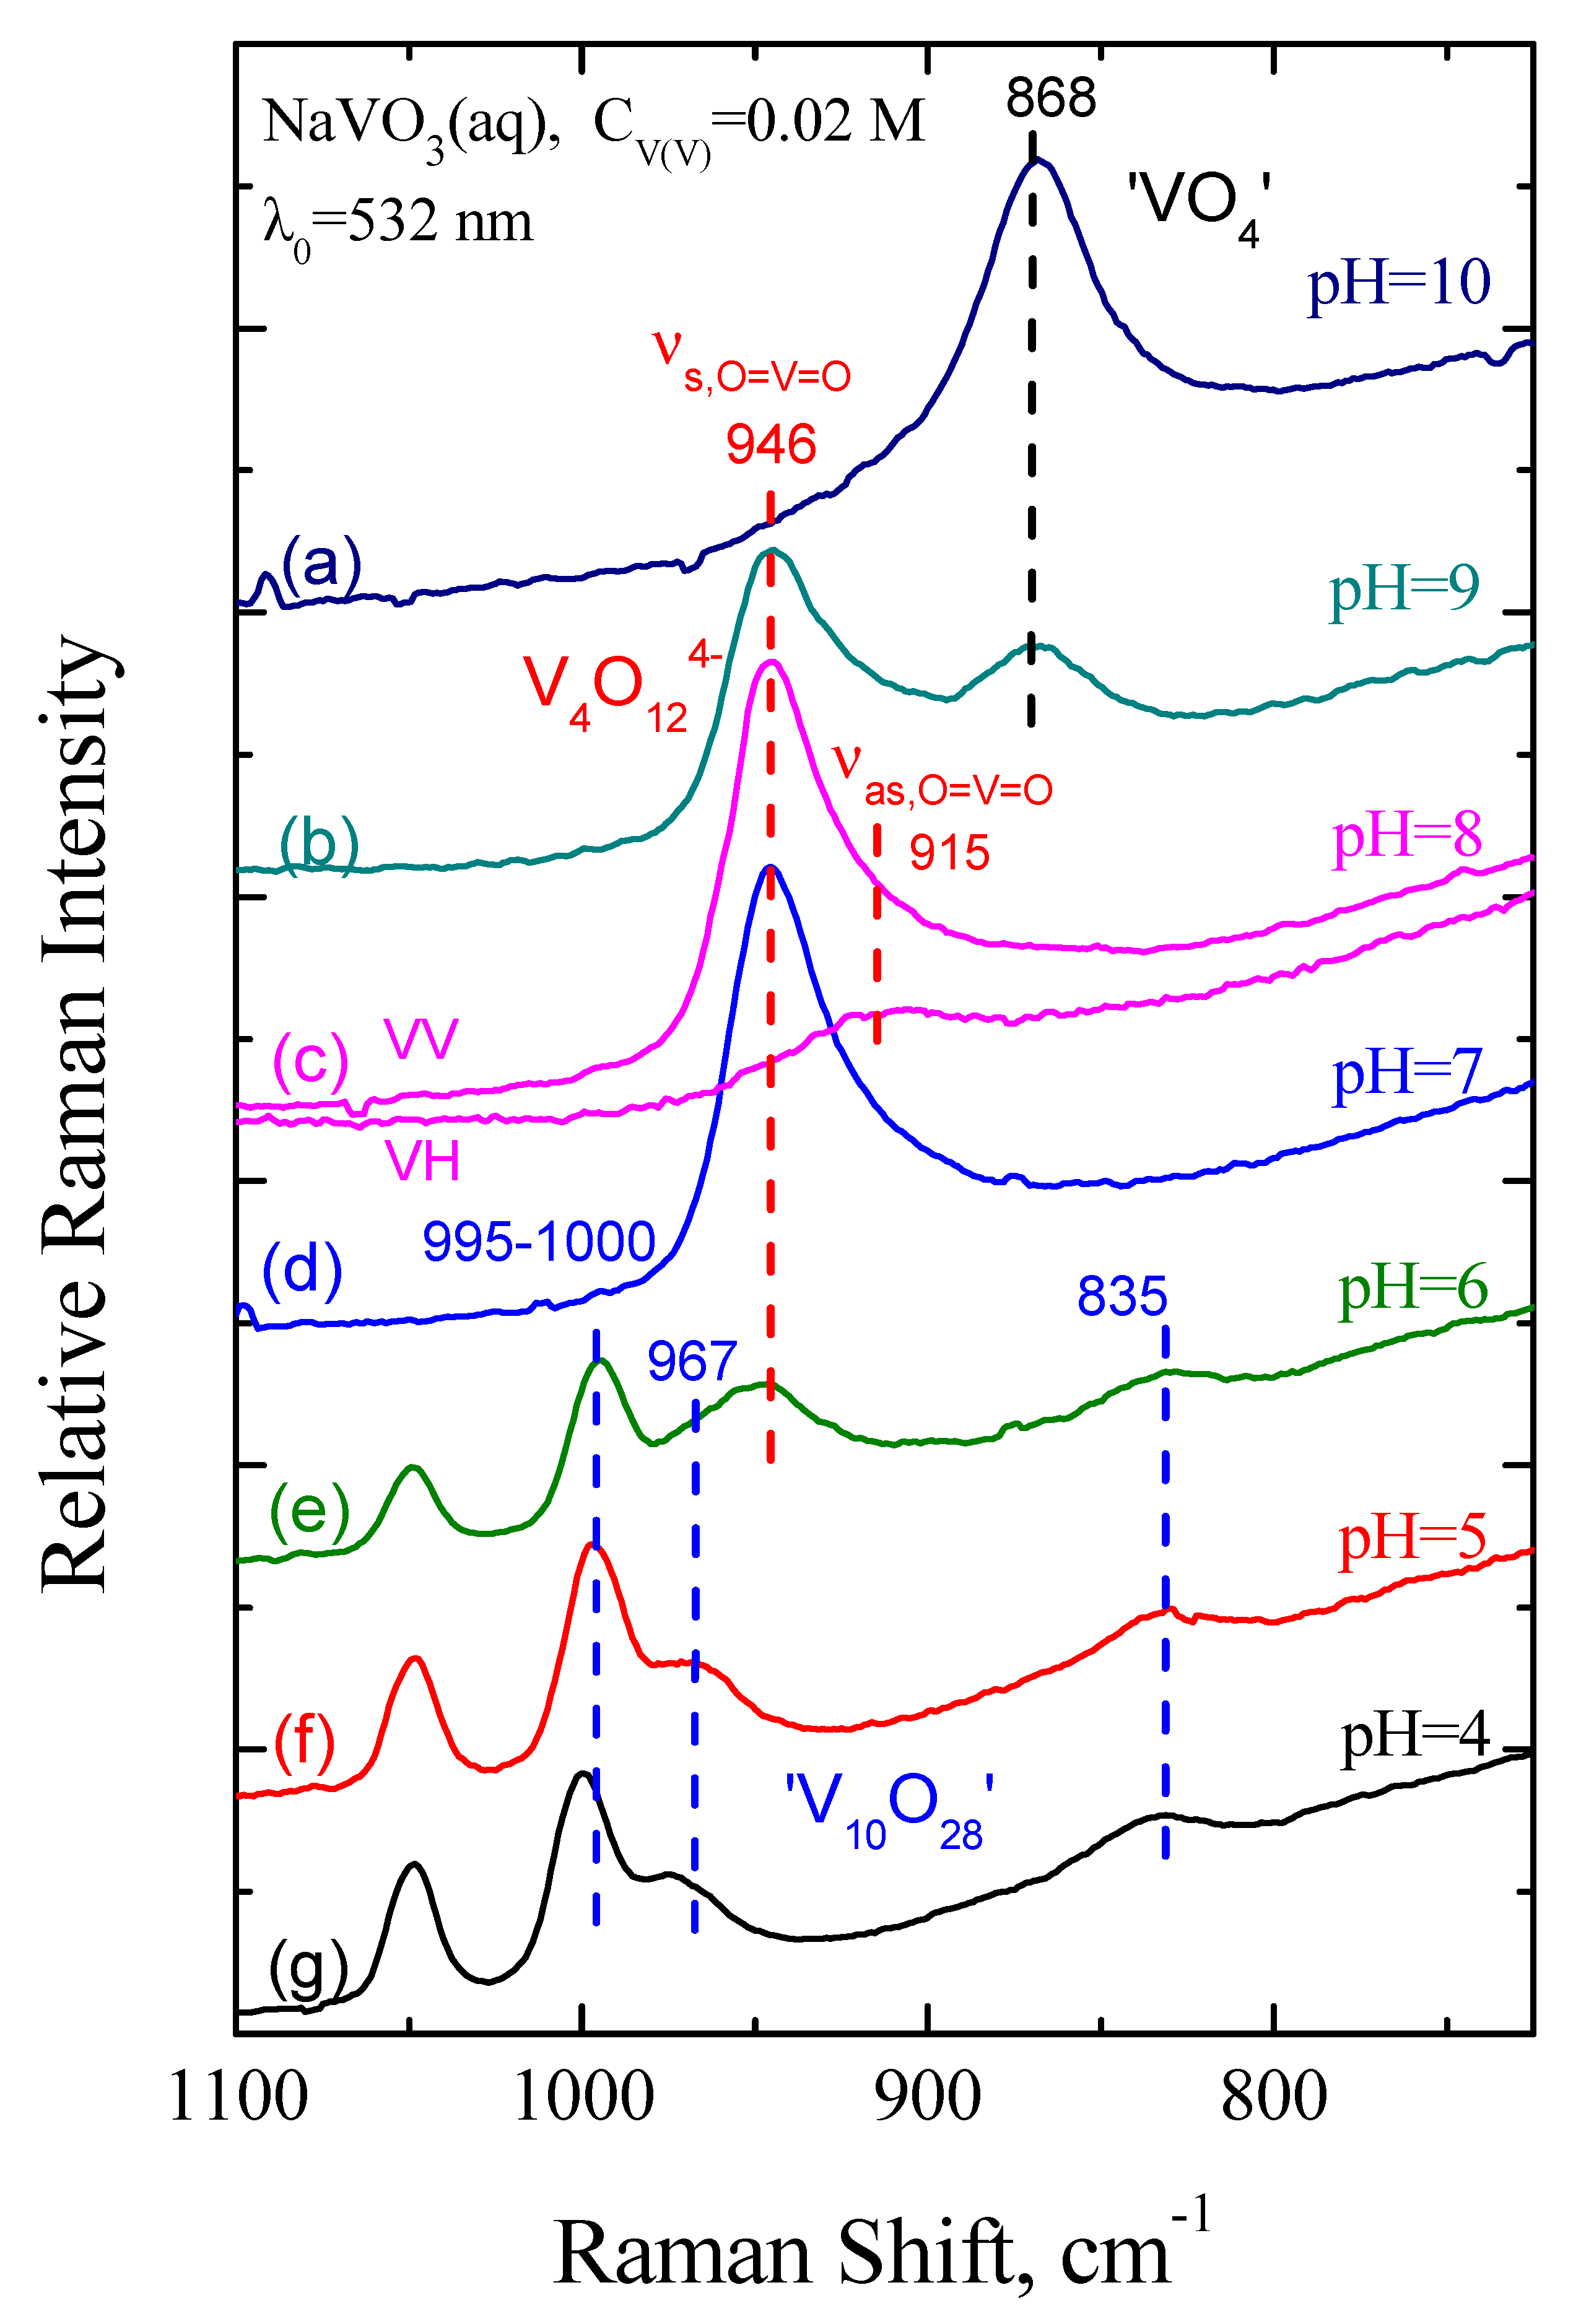
Figure 9 shows the Raman spectra obtained for the V(V) precursor solutions with initial concentration C V ( V ) total = 0.02   M and pH in the range 10–4. The spectra can be fully interpreted by following the solution speciation previewed by the model (Figure 2e,f) and the pertinent literature. Hence, at pH = 10, the displayed stretching region exhibits a broad band centered at 868 cm−1 (possessing also a low wavenumber weak component) that represents the symmetric stretching of the monomeric VO4 units of the ΗVO42− (HOVO32−) and Η2VO4 [(HO)2VO2] species. The blue shift of the 868 cm−1 compared to the indicative 826 cm−1 value reported for the free VO43− ion is attributed to strengthening of the terminal V-O bonds resulting from the distancing of the protonated O atoms of the V-OH terminations. The respective antisymmetric mode is obscured under the low frequency wing of the 868 cm−1 band. At pH = 9 (spectrum Figure 9b), the 868 cm−1 band due to VO4 is diminished, and a band at 946 cm−1 assigned to the V4O124− ion emerges and prevails, as suggested also by the speciation previewed by the theoretical model (Figure 2e,f). In particular, Figure 2f that shows the model predicted speciation expressed in terms of %V is more appropriate for following the relative intensities of the bands in the Raman spectra shown in Figure 9 because it reflects the relative number of V-O vibrators (scatterers) contributing to the intensity of each observed Raman band. The structure of the V4O124− tetramer ion is characterized by the di-oxo O=V=O termination configuration and tetrahedral coordination for each V atom, which is similar to the respective structural characteristics of the metavanadate chain, (VO3)nn−. The observed 946 cm−1 band position agrees with the 936 cm−1 observed for molten NaVO3 [64] and is assigned to the symmetric stretching,   ν s , of the di-oxo V(=O)2 unit. The antisymmetric counterpart mode, ν a s , is obscured by the low-frequency wing of the symmetric mode, thereby resulting in an asymmetric shape for the 946 cm−1 band, which is much clearer at pH = 8 (Figure 9c), where the additional display of the Raman spectrum obtained with the VH configuration allows the exclusive presence of the ν a s mode at ≈915 cm−1. The behavior is similar to the Raman spectra obtained for molten NaVO3 [68].
At pH = 8 and 7, in accordance with the model-predicted speciation of Figure 2f, the Raman spectra in Figure 9c,d show the exclusive presence of species V4O124−, represented by the ν s / ν a s convolution. At pH = 6 (Figure 9e), the 946 cm−1 band intensity is lowered abruptly due to the decrease of V4O124− presence and the prevalence of ‘V10O28′ (i.e., species HV10O285− and NaHV10O284−) represented by three bands at 995–1000 cm−1, ≈967 and ≈835 cm−1 [69]. The 967 cm−1 band’s presence is less prominent at pH = 6 due to the overlap with the remainder of the 946 cm−1 band. A slight blue shift of the main 995 cm−1 band on going from pH = 6 to pH = 4 is justifiable due to perturbations caused by protons and Na+ ions.
Hence, the model predictions for the speciation of V(V) species in the precursor solutions is fully justified by the Raman spectra obtained for the aqueous NaVO3 solutions with initial concentration of C V ( V ) total = 0.02   M and pH in the range 10–4.

2.5.2. Raman Spectra of Wet ΗKVXOYZ/TiO2 Pastes. Verification of the Interfacial Speciation of Vanadates by In Situ Raman Spectroscopy

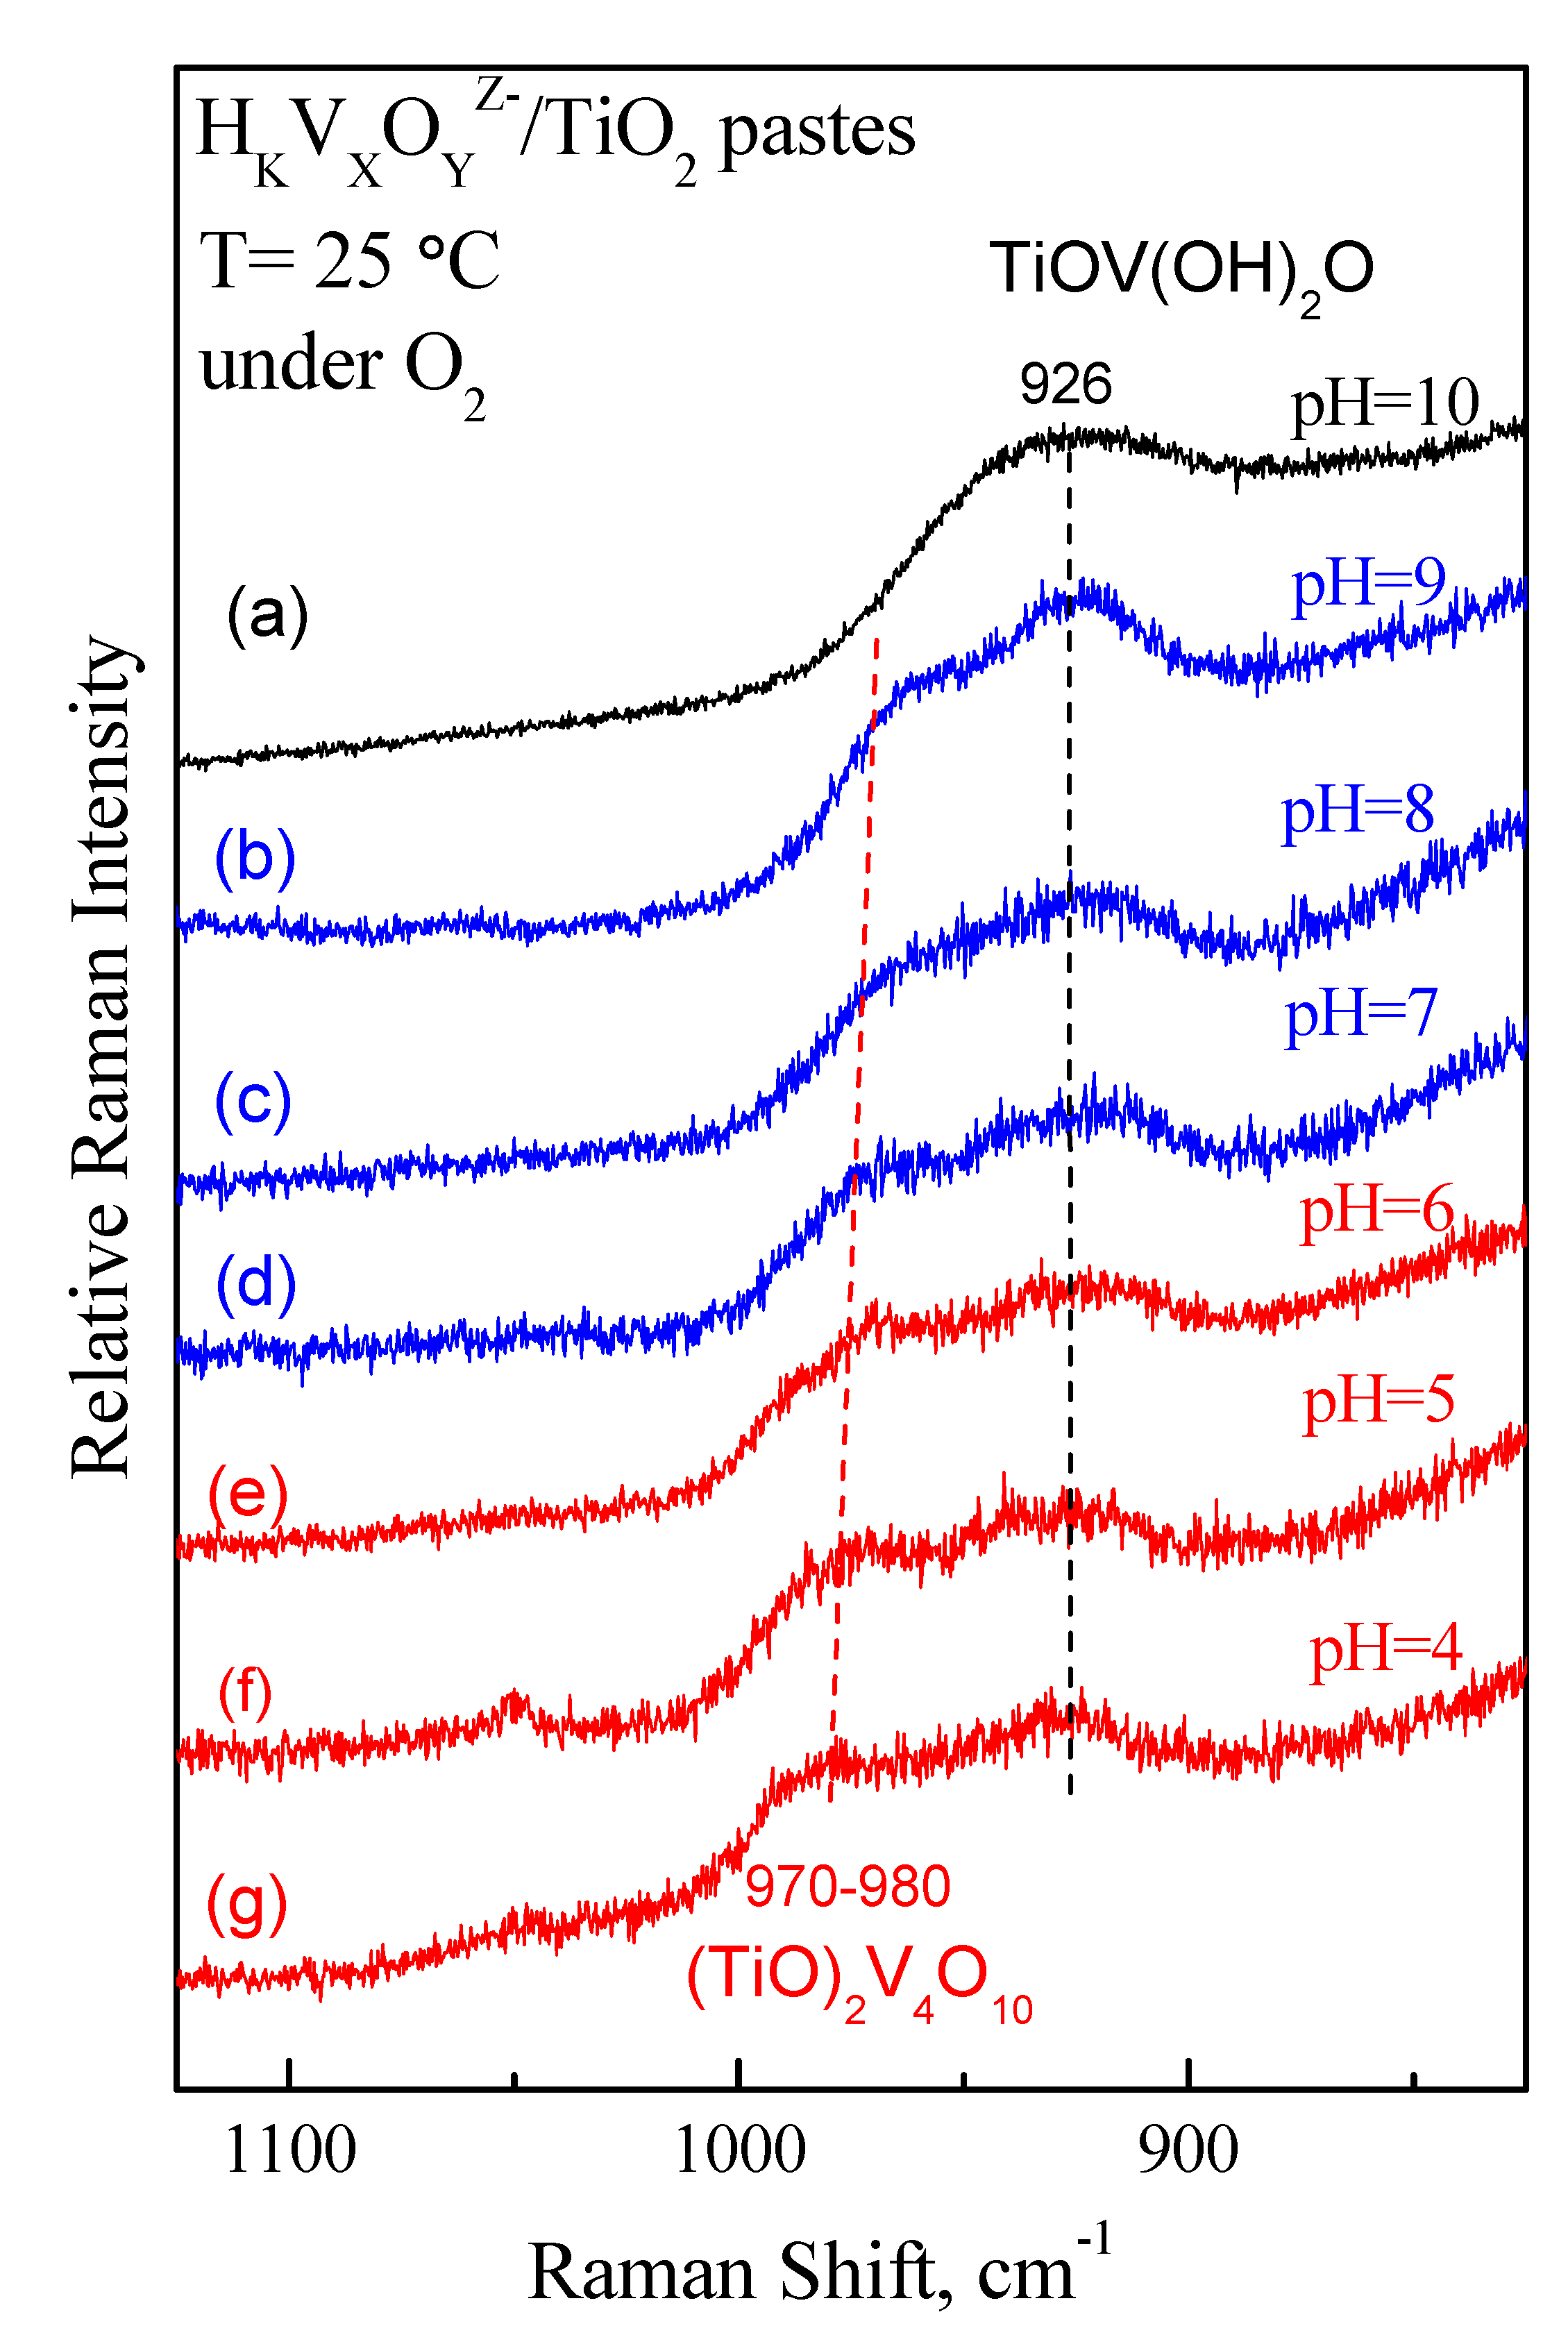
Recording of the Raman spectra for the wet ΗKVXOYZ−/TiO2 pastes took place right after the equilibrium deposition and filtration (i.e., before the drying and calcination procedures) at 25 °C under flowing O2(g) using the in situ optical Raman cell described in Section 3.6 (Materials and Methods section). Figure 10 shows the pertinent spectra of the wet pastes obtained after equilibrium deposition of oxo-V(V) species on TiO2(P25) from precursor solutions with initial concentration of C V ( V ) total = 0.02   M at pH values of 10, 9, 8, 7, 6, 5, and 4 and subsequent filtration. It should be pointed out that the Raman spectra of the ΗKVXOYZ−/TiO2 wet pastes will be discussed with reference to the oxo-V(V) species deposited at the interface, and the species identification will be compared to the interfacial speciation of the oxo-V(V) species calculated based on the above described model (Figure 8).
Figure 10 is confined in the V–O stretching region. Strong bands due to the TiO2(P25) carrier prevail below 825 cm−1. At pH = 10 (spectrum Figure 10a), one single broad band is seen at 926 cm−1 and is assigned to the symmetric stretching VO4 vibration of the mono- and disubstituted inner sphere H2VO4 deposited complexes illustrated in Figure 5. The theoretical model for the interfacial speciation (Figure 8) predicts the exclusive presence of Η2VO4 species for pH = 10 and particularly the large prevalence of the monosubstituted Ti–O–V(OH)2O configuration. The tetrahedral VO4 symmetry is disturbed and lowered due to the distancing of the anchored O atoms that tend to shorten the terminal V–O and V–O(H) bonds, thereby justifying the 926 cm−1 band position, compared to the 828 cm−1 value for the free VO43− ion and to the 868 cm−1 value for the protonated ΗVO42− and Η2VO4 ions in the precursor solutions (Figure 9a). In addition, a distribution of bond strengths amongst the terminal sites is caused due to the protonation of some of the O atoms, thereby accounting for the broadness of the 926 cm−1 band.
In the Raman spectrum obtained for the ΗKVXOYZ−/TiO2 paste prepared at pH = 9 (Figure 10b), a new broad band emerges at ≈970 cm−1, which according to the model predicted interfacial speciation (Figure 8) is assigned to the disubstituted inner sphere complex Ti2O2V4O10 (Figure 7). The corresponding band for the precursor V4O124− ion in the respective precursor solution was 946 cm−1 (Figure 9b–d). The ≈970 cm−1 band (Figure 10b) gradually gains intensity on going from pH = 9 to pH = 7 at the expense of the 926 cm−1, and no further changes can be discerned in the Raman spectra obtained for the pastes prepared at pH = 6–4, which is in full agreement with the theoretically predicted interfacial speciation (Figure 8). Now, the ≈970 cm−1 band (tending to undergo a blue shift with the decreasing pH of the synthesis procedure) appears to have several components in agreement with the structural configuration of the disubstituted inner sphere complex shown in Figure 7, in which terminal mono-oxo VO as well as terminal di-oxo VO2 sites exist, thereby justifying the band broadness. The mono-oxo sites contribute to the high wavenumber side of the band, whilst the di-oxo sites create a peak mass at the low wavenumber side of the 970–980 cm−1 band.
It is noteworthy that both the theoretically predicted and the experimentally verified solution speciation (Figure 2e,f and Figure 9) show either a significant presence (at pH = 6) or a prevalence (at pH = 5–4) of polymeric decavanadate species (i.e., HV10O285− and NaHV10O284−) in the precursor solutions. However, neither the theoretically predicted interfacial speciation nor the Raman spectra of the wet ΗKVXOYZ−/TiO2 pastes show evidence for such species deposition in the respective pH region. Hence, the interfacial speciation of the deposited species is largely different to the respective solution speciation of the precursor species. The apparent selectivity of the surface for “rejecting” the decavanadate ions can be due to a number of reasons: (a) the negatively charged surface repels the polymeric decavanadate anions that possess a high negative charge; (b) the stereochemical obstruction for the large decavanadate ions approach; (c) the preference for the deposition of species by means of coordinative bonds as opposed to electrostatic retainment of the polymeric species. This behavior is indicative of the EDF method’s ability for designing the configurational characteristics of the deposited vanadate species at the molecular level.

2.5.3. Temperature-Dependent Evolution of the Molecular Structure of Vanadates Deposited on Titania

Figure 11 shows the temperature-dependent evolution of in situ Raman spectra obtained from 25 to 430 °C for two representative ΗKVXOYZ−/TiO2 pastes, namely the ones prepared at the two extrema of the pH range used for the synthesis, i.e., at pH = 10 (Figure 11a) and pH = 4 (Figure 11b).
The temperature evolution of the Raman spectra shows that from the initial (at 25 °C) prevalent configurations (i.e., the monomeric monosubstituted umbrella-like Ti–O–V(OH)2O species exclusively present on ΗKVXOYZ/TiO2 | pH = 10 and the tetrameric disubstituted (Ti-O)2V4O10 in co-existence with Ti–O–V(OH)2O on ΗKVXOYZ/TiO2 | pH = 4 ) until the final (VOx)n configurations prevailing in the calcined samples (blue traces in Figure 11a,b), a gradual transformation resulting in a number of intermediate structural modifications takes place. Initially, up to the typical temperature limit of drying (i.e., 120 °C), H2O molecules are detached by a combination of hydroxyls and hydrogen atoms, thereby creating vacant bonding sites on the carrier and “opportunities” for a surface diffusion, spillover, and subsequent anchoring. Hence, the 926 cm−1 band is gradually diminished in both samples, and its main component undergoes a blue shift due to strengthening of the V–O bond in view of the deprotonation of the Ti–O–V(OH)2O species that initially transforms to Ti–O–V(OH)O2 and subsequently to Ti–O–VO3. At intermediate temperatures (120 < T ≤ 250 °C), the Raman spectra are suggestive of a di-oxo O=V=O termination configuration for the prevailing species (symmetric ν s , O = V = O at 955–970 cm−1), whilst at higher temperatures (T > 250 °C), the emergence of the characteristic V=O bond above 1000 cm−1 takes place for both samples (Figure 11a,b). Gradual transformations due to progressive anchoring and association to neighboring sites with increasing temperature occur also for the disubstituted (Ti–O)2V4O10 species on ΗKVXOYZ/TiO2 | pH = 4 (Figure 11b), resulting in lowering of the 980 cm−1 and gradual emergence of the 1020 cm−1 V=O band. The V–O–V bridges existing within the deposited quadramer contribute to the two-dimensional growth of the resulting (VOx)n domains.
The coverages for the finally obtained samples after calcination for 4 h at 480 °C under static air correspond to 5.8 V/nm2 for the sample prepared at pH = 10 and to 7.9 V/nm2 for the counterpart sample prepared at pH = 4. Interestingly, a broad peak mass centered at ≈930 cm−1 is seen for the sample with the highest V surface density, which is assigned as documented earlier [56,70,71,72,73] to V–O–V functionalities, suggestive of polyvanadate species formation at high surface densities.
Notably, the bands due to the V=O terminal bonds in the in situ Raman spectra obtained at 430 °C (Figure 11a,b) are not distinctly discerned, contrary to those reported earlier [56,73], and moreover, their ≈1004 and 1020 cm−1 wavenumbers deviate from the 1026–1031 cm−1 usual expected range for terminal mono-oxo V=O sites on titania, thereby showing evidence for a perturbation of the V=O site that results in V=O bond elongation. Indeed, one should take into account that the prepared catalysts are doped with sodium, since the precursor used was NaVO3 and the ionic strength of the precursor solutions was adjusted by NaNO3 solutions. Hence, as shown by Bulushev et al. [74], alkali atoms through an electrostatic (-O)xV=Oδ⋅⋅⋅Naδ+ interaction cause an elongation of the V=O bond, by that means accounting for the downward shift and broadening of the V=O band [75]. Periodic density functional theory (DFT) calculations [76] combined also with experimental evidence [77] have shed additional light on the effect of alkali on the perturbation of the V=O bond in supported vanadium oxide catalysts.

3. Materials and Methods

3.1. Substances

Titania (Degussa P25) containing 80% w/w anatase and 20% w/w rutile was used as the support in all cases. Its surface composition is ≈90% anatase and only ≈10% rutile. More details about its textural analysis can be found in ref. [49]. NaNO3 dissolved in triply distilled water and NaVO3 were used for the preparation, respectively, of the inert electrolyte and impregnation solutions necessary for the kinetic experiments and the synthesis of the wet vanadia/titania samples for the Raman spectroscopy measurements.

3.2. Proton-ion Titrations and Adsorption Experiments

Proton-ion titrations and adsorption experiments data used for the quantitative modeling were drawn from ref. [64], where full experimental details about these experiments can be found.

3.3. Kinetic Experiments

First, 40 mL of 0.1 N NaNO3 inert electrolyte solution and 2 g of TiO2 were placed in a double-walled Pyrex thermostable container with a Perspex lid, which is properly shaped so that there are places for the combined pH measuring electrode, the automatic titration micro-pipeline, and the supply nozzle N2, with which an inert atmosphere is achieved. Then, the suspension was allowed to equilibrate for about 2 h under continuous stirring and N2 flow, while the temperature was kept constant at 25 ± 0.1 ℃ throughout the experiment. After 2 h, the pH measuring electrode was placed in the suspension for continuous recording. Then, the appropriate amount of 0.1 M HNO3 standard solution was added so that the initial pH of the suspension was adjusted to 4. This was followed by equilibration of the suspension for about 30 min, and then, the necessary ml of 10−2 M vanadium solution was added so that its final concentration in the suspension is equal to 6 × 10⁻³ M. Immediately, titration was started by adding small amounts of standardized HNO3 solution (0.1 M), in order to keep the pH of the suspension constant at 4 and sampling for the next 2 h. The above procedure was performed for two more initial suspension pH values, equal to 6.5 and 9. In these cases, a standard 0.1 M NaOH solution was initially added, in order to adjust the initial suspension pH to 6.5 and 9, respectively. The titration was done with the help of an automatic micropipette (Radiometer Copenhagen ABU901 Autoburette), which was equipped with a suitable computer program. In order to determine the amount of vanadium remaining in the suspensions and therefore that deposited on the surface of titania, spectrophotometric analysis of the vanadium in the samples taken was performed.

3.4. Simulations

The simulations of the proton-ion titration curves and the adsorption edges were carried out using Visual MINTEQ, which is a computer code for the calculation of chemical equilibria in aqueous media [65]. The simulations were achieved by fitting to the experimental data the corresponding calculated curves, taking into account the mass and the charge balance equations as well as the equilibrium equations for each species being at the various planes (or layers) of the interface developed between the titania surface and the impregnation solution containing the vanadates (see Appendix A).

3.5. Synthesis of Vanadia/Titania Samples

The equilibrium deposition filtration (EDF) method was used to prepare the samples [41]. TiO2 (Degussa P25) was used as support, while the precursor of the active phase was NaVO3. The ionic strength of the solutions, containing the precursor at the desired concentration (CV = 2.0 × 10⁻² M), was adjusted with 0.1 M NaNO3. In various thermostatic vessels (varying in the pH of the suspension), the oxo-vanadium species were deposited on the TiO2 surface at seven different pH values (10, 9, 8, 7, 6, 5, and 4), until each system reaches equilibrium. The pH adjustment/control was done automatically with an autoburette Radiometer Copenhagen ABU901. The filtration procedure was followed to obtain the wet HKVXOYZ−/TiO2 samples.

3.6. Raman Spectroscopy

3.6.1. Raman Spectra of Precursor Solutions

Raman spectra of the precursor solutions with initial V(V) concentration equal to C V ( V ) = 2.0 × 10 2   M and pH in the range 4–10 (i.e., pH = 10, 9, 8, 7, 6, 5, and 4) were recorded at room temperature using the linearly polarized 532 nm line of a diode-pumped CW laser (excelsior, Specra-Physics) operated at 50 mW. The scattered light was collected at 90° (horizontal scattering plane), passed through an edge filter for rejecting the elastic scattering, and analyzed by an iHR–320 JY(Horriba) monochromator equipped with a thermoelectrically −60 °C cooled CCD detector interfaced with Labspec software. The polarized (VV: vertical polarization of incident laser–vertical analysis of scattered light) as well as the depolarized (VH: vertical polarization of incident laser–horizontal analysis of scattered light) configurations of scattering geometry were employed utilizing a set of Glan and Glan-Thompson polarizers (Hale) with extinction coefficients better than 10−6 and 10−7, respectively. Hence, bands pertaining to totally symmetric vibrations could be discerned due to their exclusive presence under the VV configuration. Notably, this could not be achieved in the Raman spectra of wet pastes, owing to the amorphous nature of the pertinent deposited species that results in scrambling of the polarization.

3.6.2. In situ Raman Spectra of Wet ΗKVXOYZ−/TiO2 Pastes and Calcined Samples

Figure 12 shows the homemade optical cell assembly used for studying the temperature evolution of the Raman spectra obtained for the ΗKVXOYZ−/TiO2 wet pastes. The pastes were puttied in the cavity of a “U”-shaped quartz holder, which is mounted in the vertical position on the optical cell sample holder by means of a gold wire. The incident laser beam is directly focused on the puttied paste (suspended within the U-shaped quartz holder), and hence, with adequate arrangement of the optical geometry, there is no direct illumination of quartz and the sampling is containerless. Moreover, there are no quartz bands within the V–O stretching region displayed, the nearest weak quartz band being at ≈805 cm−1 [78]. Temperature-dependent snapshots of in situ Raman spectra under flowing (15 cm3/min) O2(g) were recorded by gradual increase of the temperature in the 25–430 °C range. For recording the Raman spectra of calcined powderous samples, 90–100 mg of sample were pressed in the form of a wafer disc, which was mounted on the sample holder. A cylindrical focusing lens was used for illuminating the samples with the incident laser beam (typically 10–15 mW on the sample), which was slightly defocused for reducing the irradiance. The cyan 491.5 nm line of an air-cooled DPSS (Diode Pumped Solid State) Cobolt laser was used as the excitation source. The scattered light was collected at 90° on a horizontal scattering plane, analyzed with a 0.85 m Spex 1403 double spectrometer, and detected by a −20 °C cooled RCA photomultiplier tube interfaced with a Labspec acquisition software.

4. Conclusions

The type of deposition and the speciation of oxo-V(V) species at the titania/electrolyte precursor solution interface was determined by means of a computer code and verified by Raman spectroscopy. Moreover, a prediction of the interfacial speciation of the deposited oxo-V(V) species on titania was achieved based on a deposition mechanism that fits very well the relevant experimental results. In situ Raman spectroscopy was used to verify the interfacial speciation of the wet ΗKVXOYZ/TiO2 pastes as prepared by the EDF method and to monitor the temperature-dependent evolution of the Raman spectra at temperatures up to 430 °C. It was shown that it is possible to design at the molecular level the synthesis of vanadia/titania catalysts, adopting the EDF method and following the formation of the vanadia site from the first (i.e., impregnation) to the final (i.e., calcination) step of the catalyst synthesis procedure. Hence, a controlled formation of specific vanadia species on titania surface is enabled, which, depending on the synthesis conditions, can result in specific catalyst characteristics and thus possibly different catalytic behavior for a specific reaction.
Particularly, it was found that the deposition of vanadates on titania surface takes place via the formation of two main species: (i) a mono-substituted inner sphere complex between one terminal hydroxyl of the titania surface and a monomeric species (Ti–OV(OH)2O) and (ii) a disubstituted inner sphere complex between two terminal hydroxyls of the titania surface and one quadramer ((Ti–O)2V4O10). At very high pH values (>10), vanadium is deposited on titania exclusively in the form of the monomer species. As pH decreases, the contribution of quadramers on the deposition of V(V) on titania becomes gradually more significant. At a pH value of ≈8.5, half of the deposited V is in the form of monomers, the other half being in the form of quadramers. At pH values lower than 6, quadramers are the prevailing deposited vanadia species, although the predominant species in the solution are the decavanadate anions.
Tuning the structure of the vanadia species deposited on titania can enhance the catalytic performance of such materials [79]. Our findings show that a very strong interaction is developed between V(V) and titania from the first to the final step of the catalyst synthesis, which stabilizes bi-dimensional vanadia structures, thus ensuring high dispersion of the vanadia phase. The latter is expected to be associated with the excellent performance of such catalysts.

Supplementary Materials

The following are available online at https://www.mdpi.com/2073-4344/11/3/322/s1, Figure S1: (left) Variation of the concentration, [S] (mol/L), of the main vanadium species with the pH, for two different total V concentrations and (right) the distribution of total vanadium among the different species in the solution (I = 0.1 M NaNO3), Figure S2: Amount of the H+ ions adsorbed vs. the amount of the deposited V(V) for various pH values. Points represent experimental data and solid lines correspond to calculated curves on the basis of the deposition mechanism finally adopted in the simulation.

Author Contributions

Conceptualization, C.K., A.L., S.B. and K.B.; methodology, E.T., A.T. (Antonios Trimpalis) and A.T. (Athanasios Tsevis); software, E.T.; validation, A.T. (Antonios Trimpalis) and A.T. (Athanasios Tsevis); formal analysis, A.T. (Antonios Trimpalis) and A.T. (Athanasios Tsevis); investigation, E.T., A.T. (Antonios Trimpalis) and A.T. (Athanasios Tsevis); data curation, E.T., A.T. (Antonios Trimpalis) and A.T. (Athanasios Tsevis); writing—original draft preparation, K.B. and S.B.; writing—review and editing, C.K. and A.L.; visualization, C.K., A.L., S.B. and K.B.; supervision, S.B. and K.B. All authors have read and agreed to the published version of the manuscript.

Funding

This research received no external funding.

Data Availability Statement

Data is contained within the article or Supplementary Materials.

Conflicts of Interest

The authors declare no conflict of interest.

Appendix A

Table A1 contains all the species for the HKVXOYZ−/NaNO3/TiO2 system, namely the surface (hydr)oxo groups of titania, the ion pairs of these groups with the ions of the indifferent electrolyte (Na+, NO3), and the deposited vanadium species. The formation of each surface species is defined in terms of components (columns), being components in solution, surface components (surface groups), and electrostatic components (exp(−FΨi/RT), with i = 0, 1, and 2, standing for the corresponding planes of the interface [64]). The concentration [S] (mol L−1) of a surface species can be calculated by reading the table horizontally and using Equation (1). All logK values are based on intrinsic constants, adjusted for activity corrections in the case of I ≠ 0. The activity coefficients were estimated with the Davies equation (constant = 0.2).
Table A1. Surface speciation for the deposition of vanadates on titania surface.
Surface SpeciesDissolved ComponentsSurface ComponentElectrostatic ComponentsIntrinsic Formation Constant
(logK)
H+Na+NO3HVO42−TiO0.35−Ti2O0.57− e F Ψ 0 / R T e F Ψ 1 / R T e F Ψ 2 / R T
Ti2O0.57−000001000-
TiO0.35−000010000-
Ti2OH0.43+100001100logK1 = 7.8
TiOH0.65+100010100logK2 = 4.6
Ti2O0.57−-Na+01000100.70.3logKNa = −1.7
TiO0.35−-Na+01001000.70.3logKNa = −1.7
Ti2OH0.43+-NO31010011−0.7−0.3logK1 + logKNO3 = 5.6
TiOH0.65+-NO31010101−0.7−0.3logK2 + logKNO3 = 2.4
TiOV(OH)2O 0.65+1001010.8−1.80logKT1 = 30.3 ± 0.5
(TiO)2V(OH)2 2.3+2001101.5−1.50logKT2 = 45.3 ± 0.5
(TiO)2V4O10 0.7−180075510−2−4logKT3 = 88 ± 0.5
SumΣ1Σ2Σ3Σ4Σ5Σ6Σ7Σ8Σ9-
Σ1 = H+(t) − OH(t)
Σ2 = Na+(t)
Σ3 = NO3(t)
Σ4 = HVO42−(t)
Σ5 = ρANS,1
Σ6 = ρANS,2
Σ7 = ρA/F (σ0 − ΣzjFNS,j)
Σ8 = ρA/F σ1
Σ9 = ρA/F σ2
σ0 = C10 − Ψ1)
σ1 = C21 − Ψ2) − C10 − Ψ1)
σ 2 = C 2 ( Ψ 2 Ψ 1 ) ± 1 2 8000 ε 0 ε r R T i C i ( e z i F Ψ 2 / R T 1 )
The parameters in the summation terms (A1)–(A12) are as follows: ρ, the solid concentration (SC, kg L−1); A, the specific surface area (SSA, m2 kg−1); F, the Faraday constant (C mol−1); σ0, σ1, and σ2, the charges (C m−2) in the 0-, 1-, and 2-planes, respectively; zj, the charge of the surface reference groups Ti2O0.57− and TiOH0.35−; NS,j, the site densities (mol m−2) of the corresponding surface groups; Ψ0, Ψ1, and Ψ2, the electrostatic potential (V) of the 0-, 1-, and 2-planes, respectively; C1, the capacitance (C V−1 m−2) of the layer between the 0- and 1-plane; C2, the capacitance (C V−1 m−2) of the layer between the 1- and 2-plane; ε0, the absolute dielectric constant (C V−1 m−1); εr, the relative dielectric constant; R, the gas constant (J mol−1 K−1); T, the absolute temperature (K); Ci, the concentrations of the dissolved electrolyte solution species with valence zi. Values of the above-mentioned parameters can be found in Tables 3 (model A) and 4 of ref. [66].

References

  1. Guerrero-Pérez, M.O. Supported, bulk and bulk-supported vanadium oxide catalysts: A short review with an historical perspective. Catal. Today 2017, 285, 226–233. [Google Scholar] [CrossRef]
  2. Kaichev, V.V.; Chesalov, Υ.Α.; Saraev, Α.Α.; Tsapina, Α.Μ. A Mechanistic Study of Dehydrogenation of Propane over Vanadia−Titania Catalysts. J. Phys. Chem. C 2019, 123, 19668–19680. [Google Scholar] [CrossRef]
  3. Kazerooni, H.; Darian, J.T.; Mortazavi, Y.; Khadadadi, A.A.; Asadi, R. Titania-Supported Vanadium Oxide Synthesis by Atomic Layer Deposition and Its Application for Low-Temperature Oxidative Dehydrogenation of Propane. Catal. Lett. 2020, 150, 2807–2822. [Google Scholar] [CrossRef]
  4. Kraemer, S.; Rondinone, A.J.; Tsai, Y.-T.; Schwartz, V.; Overbury, S.H.; Idrobo, J.-C.; Wu, Z. Oxidative dehydrogenation of isobutane over vanadia catalysts supported by titania nanoshapes. Catal. Today 2016, 263, 84–90. [Google Scholar] [CrossRef] [Green Version]
  5. Zhang, W.; Innocenti, G.; Ferbinteanu, M.; Ramos-Fernandez, E.V.; Sepulveda-Escribano, A.; Wu, H.; Cavani, F.; Rothenberg, G.; Shiju, N.R. Understanding the oxidative dehydrogenation of ethyl lactate to ethyl pyruvate over vanadia/titania. Catal. Sci. Technol. 2018, 8, 3737–3747. [Google Scholar] [CrossRef] [Green Version]
  6. Yun, D.; Herrera, J.E. A novel methodology for in situ redox active site titration of TiO2-supported vanadia during ethanol partial oxidation catalysis. J. Catal. 2017, 350, 72–85. [Google Scholar] [CrossRef]
  7. Koivikko, N.; Laitinen, T.; Mouammine, A.; Ojala, S.; Keiski, R.L. Catalytic Activity Studies of Vanadia/Silica–Titania Catalysts in SVOC Partial Oxidation to Formaldehyde: Focus on the Catalyst Composition. Catalysts 2018, 8, 56. [Google Scholar] [CrossRef] [Green Version]
  8. Liu, Ζ.; Zhang, R.; Wang, S.; Li, N.; Sima, R.; Liu, G.; Wu, P.; Zeng, G.; Li, S.; Sun, Y. Highly Efficient and Stable Vanadia−Titania−Sulfate Catalysts for Methanol Oxidation to Methyl Formate: Synthesis and Mechanistic Study. J. Phys. Chem. C 2016, 120, 6591–6600. [Google Scholar] [CrossRef]
  9. Zhang, W.; Innocenti, G.; Oulego, P.; Gitis, V.; Wu, H.; Ensing, B.; Cavani, F.; Rothenberg, G.; Shiju, N.R. Highly Selective Oxidation of Ethyl Lactate to Ethyl Pyruvate Catalyzed by Mesoporous Vanadia−Titania. ACS Catal. 2018, 8, 2365–2374. [Google Scholar] [CrossRef] [Green Version]
  10. Andrushkevich, T.V.; Kaichev, V.V.; Chesalov, Y.A.; Saraev, A.A.; Buktiyarov, V.I. Selective oxidation of ethanol over vanadia-based catalysts: The influence of support material and reaction mechanism. Catal. Today 2017, 279, 95–106. [Google Scholar] [CrossRef]
  11. Ferretti, F.; Ribeiro, A.P.C.; Alegria, E.C.B.A.; Ferraria, A.M.; Kopylovich, M.N.; Guedes da Silva, M.F.C.; Marchetti, F.; Pombeiro, A.J.L. Synergistic catalytic action of vanadia–titania composites towards the microwave-assisted benzoin oxidation. Dalton Trans. 2019, 48, 3198–3203. [Google Scholar] [CrossRef]
  12. Sethi, D.; Jada, N.; Tiwari, A.; Ramasamy, S.; Dash, T.; Pandey, S. Photocatalytic destruction of Escherichia coli in water by V2O5/TiO2. J. Photochem. Photobiol. B 2015, 144, 68–74. [Google Scholar] [CrossRef]
  13. Lin, K.-S.; Lin, Y.-G.; Cheng, H.-W.; Haung, Y.-H. Preparation and characterization of V-Loaded titania nanotubes for adsorption/photocatalysis of basic dye and environmental hormone contaminated wastewaters. Catal. Today 2018, 307, 119–130. [Google Scholar] [CrossRef]
  14. Chang, J.-H.; Wang, Y.-L.; Dong, C.-D.; Shen, S.-Y. Electrocatalytic Degradation of Azo Dye by Vanadium-Doped TiO2 Nanocatalyst. Catalysts 2020, 10, 482. [Google Scholar] [CrossRef]
  15. Guan, B.; Zhan, R.; Lin, H.; Huang, Z. Review of state of the art technologies of selective catalytic reduction of NOx from diesel engine exhaust. Appl. Therm. Eng. 2014, 66, 395–414. [Google Scholar] [CrossRef]
  16. Forzatti, P. Present status and perspectives in de-NOx SCR catalysis. Appl. Catal. A 2001, 222, 221–236. [Google Scholar] [CrossRef]
  17. Han, L.; Cai, S.; Gao, M.; Hasegawa, J.; Wang, P.; Zhang, J.; Shi, L.; Zhang, D. Selective Catalytic Reduction of NOx with NH3 by Using Novel Catalysts: State of the Art and Future Prospects. Chem. Rev. 2019, 119, 10916–10976. [Google Scholar] [CrossRef]
  18. Lai, J.-K.; Wachs, I.E. A Perspective on the Selective Catalytic Reduction (SCR) of NO with NH3 by Supported V2O5−WO3/TiO2 Catalysts. ACS Catal. 2018, 8, 6537–6551. [Google Scholar] [CrossRef]
  19. Gan, L.; Li, K.; Niu, H.; Peng, Y.; Chen, J.; Huang, Y.; Li, J. Simultaneous removal of NOx and chlorobenzene on V2O5/TiO2 granular catalyst: Kinetic study and performance prediction. Front. Environ. Sci. Eng. 2021, 15, 70. [Google Scholar] [CrossRef]
  20. Gallastegi-Villa, M.; Aranzabal, A.; Boukha, Z.; González-Marcos, J.A.; González-Velasco, J.R.; Martínez-Huerta, M.V.; Banares, M.A. Role of surface vanadium oxide coverage support on titania for the simultaneous removal of o-dichlorobenzene and NOx from waste incinerator flue gas. Catal. Today 2015, 254, 2–11. [Google Scholar] [CrossRef]
  21. Xu, J.; Chen, G.; Guo, F.; Xie, J. Development of wide-temperature vanadium-based catalysts for selective catalytic reducing of NOx with ammonia: Review. Chem. Eng. J. 2018, 353, 507–518. [Google Scholar] [CrossRef]
  22. Zhang, J.; Li, X.; Chen, P.; Zhu, B. Research Status and Prospect on Vanadium-Based Catalysts for NH3-SCR Denitration. Materials 2018, 11, 1632. [Google Scholar] [CrossRef] [Green Version]
  23. Weckhuysen, B.M.; Keller, D.E. Chemistry, spectroscopy and the role of supported vanadium oxides in heterogeneous catalysis. Catal. Today 2003, 78, 25–46. [Google Scholar] [CrossRef] [Green Version]
  24. Kompio, P.G.W.A.; Brückner, A.; Hipler, F.; Manoylova, O.; Auer, G.; Mestl, G.; Grünert, W. V2O5-WO3/TiO2 catalysts under thermal stress: Responses of structure and catalytic behavior in the selective catalytic reduction of NO by NH3. Appl. Catal. B 2017, 217, 365–377. [Google Scholar] [CrossRef]
  25. Arnarson, L.; Falsig, H.; Rasmussen, S.B.; Lauritsen, J.V.; Moses, P.G. A complete reaction mechanism for standard and fast selective catalytic reduction of nitrogen oxides on low coverage VOx/TiO2(001) catalysts. J. Catal. 2017, 346, 188–197. [Google Scholar] [CrossRef]
  26. Arnarson, L.; Rasmussen, S.B.; Falsig, H.; Lauritsen, J.V.; Moses, P.G. Coexistence of Square Pyramidal Structures of Oxo Vanadium (+5) and (+4) Species Over Low-Coverage VOX/TiO2 (101) and (001) Anatase Catalysts. J. Phys. Chem. C 2015, 119, 23445–23452. [Google Scholar] [CrossRef]
  27. Koust, S.; Arnarson, L.; Moses, P.G.; Li, Z.; Beinik, I.; Lauritsen, J.V.; Wendt, S. Facile embedding of single vanadium atoms at the anatase TiO2(101) surface. Phys. Chem. Chem. Phys. 2017, 19, 9424–9431. [Google Scholar] [CrossRef] [PubMed]
  28. Li, W.-Z.; Gao, F.; Li, Y.; Walter, E.D.; Liu, J.; Peden, C.H.F.; Wang, Y. Nanocrystalline Anatase Titania-Supported Vanadia Catalysts: Facet-Dependent Structure of Vanadia. J. Phys. Chem. C 2015, 119, 15094–15102. [Google Scholar] [CrossRef]
  29. Marberger, A.; Ferri, D.; Elsener, M.; Krocher, O. The Significance of Lewis Acid Sites for the Selective Catalytic Reduction of Nitric Oxide on Vanadium-Based Catalysts. Angew. Chem. Int. Ed. 2016, 55, 11989–11994. [Google Scholar] [CrossRef]
  30. Kwon, D.W.; Park, K.H.; Hong, S.C. Influence of VOx surface density and vanadyl species on the selective catalytic reduction of NO by NH3 over VOx/TiO2 for superior catalytic activity. Appl. Catal. A 2015, 499, 1–12. [Google Scholar] [CrossRef]
  31. Murkute, A.D.; Vanderwiel, D. Active Sites Evaluation of Vanadia Based Powdered and Extruded SCR Catalysts Prepared on Commercial Titania. Catal. Lett. 2015, 145, 1224–1236. [Google Scholar] [CrossRef]
  32. Marberger, A.; Ferri, D.; Rentsch, D.; Krumeich, F.; Elsener, M.; Kröcher, O. Effect of SiO2 on co-impregnated V2O5/WO3/TiO2 catalysts for the selective catalytic reduction of NO with NH3. Catal. Today 2019, 320, 123–132. [Google Scholar] [CrossRef]
  33. Liu, X.; Chen, H.; Wu, X.; Cao, L.; Jiang, P.; Yu, Q.; Ma, Y. Effects of SiO2 modification on the hydrothermal stability of the V2O5/WO3–TiO2 NH3-SCR catalyst: TiO2 structure and vanadia species. Catal. Sci. Technol. 2019, 9, 3711–3720. [Google Scholar] [CrossRef]
  34. Shutilov, R.A.; Shutilov, A.A.; Zenkovets, G.A. Nanocrystalline V2O5,WO3/(CeO2-TiO2) and V2O5,WO3/(Y2O3-TiO2) catalysts with enhance thermal stability and activity in the reduction of NO with NH3 into N2. Mater. Today Proc. 2017, 4, 11490–11494. [Google Scholar] [CrossRef]
  35. Zhang, S.; Liu, S.; Hu, W.; Zhu, X.; Qu, R.; Wu, W.; Zheng, C.; Gao, X. New insight into alkali resistance and low temperature activation on vanadia-titania catalysts for selective catalytic reduction of NO. Appl. Surf. Sci. 2019, 466, 99–109. [Google Scholar] [CrossRef]
  36. Marberger, A.; Ferri, D.; Elsener, M.; Sagar, A.; Artner, C.; Schermanz, K.; Kröcher, O. Relationship between structures and activities of supported metal vanadates for the selective catalytic reduction of NO by NH3. Appl. Catal. B 2017, 218, 731–742. [Google Scholar] [CrossRef]
  37. Marberger, A.; Elsener, M.; Nuguid, R.J.G.; Ferri, D.; Kröcher, O. Thermal activation and aging of a V2O5/WO3-TiO2 catalyst for the selective catalytic reduction of NO with NH3. Appl. Catal. A 2019, 573, 64–72. [Google Scholar] [CrossRef]
  38. Hess, C.; Waleska, P.; Ratzka, M.; Janssens, T.V.W.; Rasmussen, S.B.; Beato, P. Hierarchical Vanadia Model Catalysts for Ammonia Selective Catalytic Reduction. Top. Catal. 2017, 60, 1631–1640. [Google Scholar] [CrossRef]
  39. Shen, J.; Hess, C. High Surface Area VOx/TiO2/SBA-15 Model Catalysts for Ammonia SCR Prepared by Atomic Layer Deposition. Catalysts 2020, 10, 1386. [Google Scholar] [CrossRef]
  40. He, Y.; Ford, M.E.; Zhu, M.; Liu, Q.; Tumuluri, U.; Wu, Z.; Wachs, I.E. Influence of catalyst synthesis method on selective catalytic reduction (SCR) of NO by NH3 with V2O5-WO3/TiO2 catalysts. Appl. Catal. B 2016, 193, 141–150. [Google Scholar] [CrossRef] [Green Version]
  41. Bourikas, K.; Kordulis, C.; Lycourghiotis, A. The role of the liquid—Solid interface in the preparation of supported catalysts. Catal. Rev. Sci. Eng. 2006, 48, 363–444. [Google Scholar] [CrossRef]
  42. Bourikas, K.; Kordulis, C.; Lycourghiotis, A. Titanium Dioxide (Anatase and Rutile): Surface Chemistry, Liquid−Solid Interface Chemistry, and Scientific Synthesis of Supported Catalysts. Chem. Rev. 2014, 114, 9754–9823. [Google Scholar] [CrossRef]
  43. Munnik, P.; de Jongh, P.E.; de Jong, K.P. Recent Developments in the Synthesis of Supported Catalysts. Chem. Rev. 2015, 115, 6687–6718. [Google Scholar] [CrossRef]
  44. Carrier, X.; Royer, S.; Marceau, E. Synthesis of metal oxide catalysts. In Metal Oxides in Heterogeneous Catalysis; Védrine, J.C., Ed.; Elsevier: Amsterdam, The Netherlands, 2018; pp. 43–103. [Google Scholar] [CrossRef]
  45. Carrier, X.; Marceau, E.; Che, M. Physical techniques and catalyst preparation: Determining the interactions of transition-metal complexes with oxide surfaces. Pure Appl. Chem. 2006, 78, 1039–1055. [Google Scholar] [CrossRef] [Green Version]
  46. de Jong, K.P. Synthesis of Solid Catalysts; Wiley: New York, NY, USA, 2008. [Google Scholar] [CrossRef] [Green Version]
  47. Mehrabadi, B.A.T.; Eskandari, S.; Khan, U.; White, R.D.; Regalbuto, J.R. A Review of Preparation Methods for Supported Metal Catalysts. Adv. Catal. 2017, 61, 1–35. [Google Scholar] [CrossRef]
  48. Marceau, E.; Bonneviot, L.; Dzwigaj, S.; Lambert, J.-F.; Louis, C.; Carrier, X. Interfacial Coordination Chemistry for Catalyst Preparation. J. Catal. 2021, in press. [Google Scholar] [CrossRef]
  49. Panagiotou, G.D.; Petsi, T.; Bourikas, K.; Kalampounias, A.G.; Boghosian, S.; Kordulis, C.; Lycourghiotis, A. Interfacial Impregnation Chemistry in the Synthesis of Molybdenum Catalysts supported on Titania. J. Phys. Chem. C 2010, 114, 11868–11879. [Google Scholar] [CrossRef]
  50. Petsi, T.; Panagiotou, G.D.; Bourikas, K.; Kordulis, C.; Voyiatzis, G.A.; Lycourghiotis, A. Interfacial Impregnation Chemistry in the Synthesis of Chromium Catalysts Supported on Titania. ChemCatChem 2011, 3, 1072–1082. [Google Scholar] [CrossRef]
  51. Bourikas, K.; Stavropoulos, J.; Garoufalis, C.S.; Kordulis, C.; Petsi, T.; Lycourghiotis, A. Interfacial Impregnation Chemistry in the Synthesis of Nickel Catalysts Supported on Titania. Chem. Eur. J. 2011, 17, 1201–1213. [Google Scholar] [CrossRef] [PubMed]
  52. Petsi, T.; Panagiotou, G.D.; Garoufalis, C.S.; Kordulis, C.; Stathi, P.; Deligiannakis, Y.; Lycourghiotis, A.; Bourikas, K. Interfacial Impregnation Chemistry in the Synthesis of Cobalt Catalysts Supported on Titania. Chem. Eur. J. 2009, 15, 13090–13104. [Google Scholar] [CrossRef]
  53. Panagiotou, G.D.; Petsi, T.; Bourikas, K.; Kordulis, C.; Lycourghiotis, A. The Interfacial Chemistry of the Impregnation Step Involved in the Preparation of Tungsten (VI) Supported Titania Catalysts. J. Catal. 2009, 262, 266–279. [Google Scholar] [CrossRef]
  54. Rasmussen, S.B.; Abrams, B.L. Fundamental chemistry of V-SCR catalysts at elevated temperatures. Catal. Today 2017, 297, 60–63. [Google Scholar] [CrossRef]
  55. Fan, F.; Feng, Z.; Li, C. UV Raman spectroscopic studies on active sites and synthesis mechanisms of transition metal-containing microporous and mesoporous materials. Acc. Chem. Res. 2010, 43, 378–387. [Google Scholar] [CrossRef]
  56. Giakoumelou, I.; Fountzoula, C.; Kordulis, C.; Boghosian, S. Molecular structure and catalytic activity of V2O5/TiO2 catalysts for the SCR of NO by NH3: In situ Raman spectra in the presence of O2, NH3, NO, H2, H2O and SO2. J. Catal. 2006, 239, 1–12. [Google Scholar] [CrossRef]
  57. Kryukova, G.N.; Zenkovets, G.A.; Mestl, G.; Schlögl, R. Structural study of titanium-doped vanadia and vanadium-doped titania catalysts. React. Kinet. Catal. Lett. 2003, 80, 161–169. [Google Scholar] [CrossRef]
  58. Wachs, I.E. Catalysis science of supported vanadium oxide catalysts. Dalton Trans. 2013, 42, 11762–11769. [Google Scholar] [CrossRef]
  59. Martinez-Huerta, M.V.; Fierro, J.L.G.; Banaraes, M.A. Monitoring the states of vanadium oxide during the transformation of TiO2 anatase-to-rutile under reactive environments: H2 reduction and oxidative dehydrogentation of ethane. Catal. Commun. 2009, 11, 15–19. [Google Scholar] [CrossRef]
  60. Tribalis, A.; Panagiotou, G.D.; Tsilomelekis, G.; Kalampounias, A.G.; Bourikas, K.; Kordulis, C.; Boghosian, S.; Lycourghiotis, A. Temperature -dependent evolution of the molecular configuration of oxo-tungsten(VI) species deposited on the surface of titania. J. Phys. Chem. C 2014, 118, 11319–11332. [Google Scholar] [CrossRef]
  61. Tsilomelekis, G.; Panagiotou, G.D.; Stathi, P.; Kalampounias, A.G.; Bourikas, K.; Kordulis, C.; Deligiannakis, Y.; Boghosian, S.; Lycourghiotis, A. Molybdena deposited on titania by equilibrium deposition filtration: Structural evolution of oxo-molybdenum(V)) sites with temperature. Phys. Chem. Chem. Phys. 2016, 18, 23980–23989. [Google Scholar] [CrossRef]
  62. Andriopoulou, C.; Boghosian, S. Tuning the configuration of dispersed oxometallic sites in supported transition metal oxide catalysts: A temperature dependent Raman study. Catal. Today 2019, 336, 74–83. [Google Scholar] [CrossRef]
  63. Andriopoulou, C.; Boghosian, S. Molecular structure and termination configuration of Oxo-Re(VII) catalyst sites supported on Titania. Catal. Today 2020, 355, 665–677. [Google Scholar] [CrossRef]
  64. Tella, E.; Panagiotou, G.D.; Petsi, T.; Bourikas, K.; Kordulis, C.; Lycourghiotis, A. The mechanism of retention of vanadium oxo-species at the “titanium oxide/aqueous solution” interface. Global NEST J. 2010, 12, 231–238. [Google Scholar] [CrossRef]
  65. Gustafsson, J.P. Visual MINTEQ, version 2.40; Department of Land and Water Resources Engineering, Royal Institute of Technology: Stockholm, Sweden, 2005. [Google Scholar]
  66. Panagiotou, G.D.; Petsi, T.; Bourikas, K.; Garoufalis, C.S.; Tsevis, A.; Spanos, N.; Kordulis, C.; Lycourghiotis, A. Mapping the surface (hydr)oxo–groups of titanium oxide and its interface with an aqueous solution: The state of the art and a new approach. Adv. Colloid Interface Sci. 2008, 142, 20–42. [Google Scholar] [CrossRef] [PubMed]
  67. Nakamoto, K. Infrared and Raman Spectra of Inorganic and Coordination Compounds, 6th ed.; Wiley-Interscience: New York, NY, USA, 2009. [Google Scholar]
  68. Boghosian, S. Vibrational Modes and Structure of Vanadium (V) Complexes in M2SO4-V2O5 (M= K, Cs) Molten Salt Mixtures. J. Chem. Soc. Faraday Trans. 1998, 94, 3463–3469. [Google Scholar] [CrossRef]
  69. Aureliano, M.; Ohlin, C.A.; Vieira, M.O.; Marques, M.P.M.; Casey, W.H.; Batista de Carvalho, L.A.E. Characterization of decavanadate and decaniobate solutions by Raman spectroscopy. Dalton Trans. 2016, 45, 7391–7399. [Google Scholar] [CrossRef] [Green Version]
  70. Busca, G. Differentiation of mono-oxo and polyoxo and of monomeric and polymeric vanadate, molybdate and tungstate species in metal oxide catalysts by IR and Raman spectroscopy. J. Raman Spectrosc. 2002, 33, 348–358. [Google Scholar] [CrossRef]
  71. Went, G.T.; Oyama, S.T.; Bell, A.T. Laser Raman spectroscopy of supported vanadium oxide catalysts. J. Phys. Chem. 1990, 94, 4240–4246. [Google Scholar] [CrossRef]
  72. Wachs, I.E.; Weckhuysen, B.M. Structure and reactivity of surface vanadium oxide species on oxide supports. Appl. Catal. A 1997, 157, 67–90. [Google Scholar] [CrossRef] [Green Version]
  73. Christodoulakis, A.; Machli, M.; Lemonidou, A.A.; Boghosian, S. Molecular structure and reactivity of vanadia-based catalysts for propane oxidative dehydrogenation studied by in situ Raman spectroscopy and catalytic activity measurements. J. Catal. 2004, 222, 293–306. [Google Scholar] [CrossRef]
  74. Bulushev, D.; Rainone, F.; Kiwi-Minsker, L.; Renken, A. Influence of potassium doping on the formation of vanadia species in V/Ti oxide catalysts. Langmuir 2001, 17, 5276–5282. [Google Scholar] [CrossRef] [Green Version]
  75. Due-Hansen, J.; Boghosian, S.; Kustov, A.; Fristrup, P.; Tsilomelekis, G.; Ståhl, K.; Christensen, C.H.; Fehrmann, R. Vanadia-based SCR catalysts supported on tungstated and sulfated zirconia: Influence of doping with potassium. J. Catal. 2007, 251, 459–473. [Google Scholar] [CrossRef]
  76. Calatayud, M.; Minot, C. Effect of alkali doping on a V2O5/TiO2 catalyst from periodic DFT calculations. J. Phys. Chem. C 2007, 111, 6411–6417. [Google Scholar] [CrossRef]
  77. Lewandowska, A.E.; Calatayud, M.; Lozano-Diz, E.; Minot, C.; Banares, M.A. Combining theoretical description with experimental in situ studies on the effect of alkali additives on the structure and reactivity of vanadium oxide supported catalysts. Catal. Today 2008, 139, 209–213. [Google Scholar] [CrossRef]
  78. Tsilomelekis, G.; Boghosian, S. An operando Raman study of molecular structure and reactivity of molybdenum(VI) oxide supported on anatase for the oxidative dehydrogenation of ethane. Phys. Chem. Chem. Phys. 2012, 14, 2216–2228. [Google Scholar] [CrossRef]
  79. Lian, Z.; Li, Y.; Shan, W.; He, H. Recent Progress on Improving Low-Temperature Activity of Vanadia-Based Catalysts for the Selective Catalytic Reduction of NOx with Ammonia. Catalysts 2020, 10, 1421. [Google Scholar] [CrossRef]
Figure 1. Structure of (a) the monomer H2VO4, (b) the quadramer (V4O124−), and (c) the decamer (HV10O285− or NaHV10O284−) vanadates.
Catalysts 11 00322 g001
Figure 2. (a) Variation of the concentration, [S] (mol/L), of the main vanadium species with the pH, and (b) the distribution of total vanadium among the different species in the solution (CV = 0.02 M, I = 0.1 M NaNO3).
Catalysts 11 00322 g002
Figure 3. Kinetic curves of deposition of V on the titania surface at three different pH values of the impregnation solution and total V concentration equal to 6 × 10⁻³ M.
Catalysts 11 00322 g003
Figure 4. Amount of the H+ ions adsorbed vs. the amount of the deposited V(V) for various pH values. Points represent experimental data and solid lines correspond to calculated curves on the basis of the deposition mechanism finally adopted in the simulation.
Catalysts 11 00322 g004
Figure 5. Local structures of the deposited V monomers on the (1 0 0) crystal termination of anatase.
Catalysts 11 00322 g005
Figure 6. Adsorption edges of V(V) on titania, at three different V concentrations (points represent experimental data, whereas solid lines correspond to calculated (model) curves).
Catalysts 11 00322 g006
Figure 7. Local structure of the deposited V quadramers on the (1 0 1) crystal termination of anatase.
Catalysts 11 00322 g007
Figure 8. Variation of the percentage of V deposited as a specific species with the pH of the impregnating solution. The various deposited V(V) oxo-species are indicated.
Catalysts 11 00322 g008
Figure 9. Raman spectra of NaVO3 solutions with initial concentration CV(V), total = 2.0 × 10⁻² M and ionic strength Ι = 0.1 Μ ΝaΝΟ3. ‘VO4’ denotes species ΗVO42− and Η2VO4; ‘V10O28’ denotes species ΗV10O285− and NaΗV10O284− (laser wavelength, λ 0 = 532 nm; laser power, 50 mW).
Catalysts 11 00322 g009
Figure 10. In situ Raman spectra obtained under flowing O2(g) for the wet pastes ΗKVXOYZ/TiO2 prepared by the equilibrium deposition filtration (EDF) method. The indicated pH values pertain to the respective impregnating solutions with C V ( V ) total = 0.02   M (laser wavelength, λ0 = 491.5 nm; laser power: 15 mW; spectral slit width: 7 cm−1). (a) pH = 10; (b) pH = 9; (c) pH = 8; (d) pH = 7; (e) pH = 6; (f) pH = 5; (g) pH = 4.
Catalysts 11 00322 g010
Figure 11. Temperature evolution snapshots of in situ Raman spectra obtained under flowing O2(g) for the wet pastes ΗKVXOYZ/TiO2 prepared by the EDF method at (a) pH=10; (b) pH=4 at temperatures as indicated by each spectrum (laser wavelength, λ0 = 491.5 nm; laser power: 15 mW; spectral slit width: 7 cm−1). The first overtone of the ν 4 ( B 1 g ) anatase mode at ≈792 cm−1 is denoted by 2 ν 4 ( B 1 g ) .
Catalysts 11 00322 g011
Figure 12. Optical cell for in situ Raman measurements.
Catalysts 11 00322 g012
Table 1. The main V(V) oxo-species present in solution in the pH range 4–10, the solution components of the formation reactions, the exponential values for these components, and the values of the corresponding formation constants.
Vanadium SpeciesSolution ComponentslogΚ
- H V O 4 2 H +     N a + H 2 O
H 2 VO 4 11008.75
H 2 V 2 O 7 2 220−119.8
V 4 O 12 4 440−442.6
HV 10 O 28 5 10150−12141.5
NaHV 10 O 28 4 10151−12143.68
Publisher’s Note: MDPI stays neutral with regard to jurisdictional claims in published maps and institutional affiliations.