Abstract
The hydrogen production from ammonia decomposition on commercial 5 wt.% Ru/C (C: activated carbon) catalyst with different cesium (Cs) loadings at lower temperatures of 325–400 °C in the fixed-bed reactor was experimentally investigated. Based on the parameters used in this work, the results showed that the ammonia conversion at 350 °C is increased with the increasing Cs/Ru molar ratio, and it reaches its maximum value at the Cs/Ru molar ratio of 4.5. After that, it is rapidly decreased with a further increase of Cs/Ru molar ratio, and it is even smaller than that of the pure Ru/C case at the Cs/Ru molar ratio of 6. The Cs promotion at the lower Cs/Ru molar ratios may be due to the so-called “hot ring promotion”. The possible mechanisms for Cs effects on the ammonia conversion at higher Cs/Ru molar ratio are discussed. At optimum Cs loading, the results showed that all the ammonia conversions at 400 °C are near 100% for the GHSV (gas hourly space velocity) from 48,257 to 241,287 mL/(h·gcat).
1. Introduction
Ammonia is considered as a promising energy carrier and is expected to play a sustainable role in future energy scenarios [1]. Ammonia provides a vast potential for the storage and transportation of renewable energy and is viewed as a green fuel for vehicular applications, since ammonia can be converted to hydrogen for the uses in the fuel cells, internal combustion engines, or gas turbines [2,3]. So far, a high proportion of the world’s hydrogen comes from the reforming of fossil fuels [4]. There are major techniques for hydrogen production from fossil fuels: steam reforming, partial oxidation, autothermal reforming, and dry reforming [4,5,6,7,8,9,10,11]. However, the undesirable by-products of COx (x = 1, 2) are also generated during the fuel reforming process. The CO at low concentration could degrade the electrodes of the proton-exchange membrane fuel cell [12,13]. The CO2 is the major greenhouse gas. The research attention has been focused on eliminating or reducing CO2 emission during the reforming process [14,15,16]. Hydrogen production from NH3 has received attention because there is no COx generation [17]. For the on-site hydrogen supplier, it is desired that the temperature is as low as possible for less input energy required and safety concern.
The effects of active catalyst (Ru, Rh, Pt, Pd, Ni, Fe) and support (CNTs, AC, Al2O3, MgO, ZrO2, TiO2) on the ammonia decomposition for the production hydrogen were studied by Yin et al. [18]. It was shown that the Ru catalyst is the most active catalyst, Ni has the best catalytic activity among non-noble catalysts, and CNTs are an excellent support for the catalyst. A ruthenium-impregnated anodic aluminum catalyst for use in microreactors for the hydrogen production from ammonia was studied by Ganley et al. [19], and they found that the ammonia conversion of 99% was obtained at 600 °C for the inlet flow rate of 145 cm3. The effect of the carbon support on the catalytic ammonia decomposition over Ru/carbon catalysts was studied by Li et al. [20]. They found that the catalytic activity is ranked as Ru/GC (graphitic carbon) > Ru/CNTS (carbon nanotubes) > Ru/CB-S (carbon black).
Ammonia decomposition by using Ru-carbon catalyst in a membrane reactor with Pd membrane walls for the hydrogen separation was studied by Carcia-Garcia et al. [21]. They found that ammonia conversion of 100% is reached at a low temperature of 640K. Ammonia decomposition in a membrane reactor consisting of a Ru/γ-Al2O3/α-Al2O3 catalytic and a silica separation layer was proposed by Li et al. [22]. Their results showed that with H2 extraction, the NH3 conversion increased from 68.8 to 74.4% due to the H2 permeation through the membrane. Ammonia decomposition over the carbon-based ruthenium catalyst promoted with barium or cesium was studied by Raróg-Pilecka et al. [23]. They found that the reaction rates over Cs–Ru/carbon are higher than those over Ba–Ru/carbon for temperature range of 370–400 °C.
The NH3 decomposition kinetics on supported Ru clusters was studied by Zheng et al. [24]. They found that the decomposition rate over Ru nanoparticles showed a strong dependency on mean crystallite size and the optimum appeared at dRu = 2.2 nm. Promoted Ru on high-surface area graphite for miniaturized hydrogen production from ammonia was investigated by Sorensen et al. [25]. Their results showed that the catalytic activities were determined for different promoters and promoter levels on graphite-supported ruthenium catalysts. Monolithic microfibrous Ni catalyst co-modified with ceria and alumina for hydrogen production via ammonia decomposition was studied by Liu et al. [26]. They showed that roughly 20 W power output hydrogen (≈220 mL/min) could be achieved with >99% ammonia conversion in a bed volume of 0.9 mL at 650 °C.
The ammonia decomposition over a Ni-Pt/Al2O3 catalyst was studied experimentally by Chellappa et al. [27]. Their results showed that a first-order rate expression provides an adequate fit of the experimental data over the range of 520–690 °C. A miniature NH3 cracker based on Ni-CeO2/Al2O3 catalyst for fuel cell supplies was studied by Wang et al. [28]. They showed that ammonia conversion of >99.9% was obtained at 600 °C and an 1100 sccm feed gas rate. Ni on alumina-coated cordierite monoliths for H2 production from ammonia is investigated by Plana et al. [29]. Their results showed that a complete conversion of pure NH3 was achieved at a temperature as low as 600 °C. Zhang et al. [30] used nano-sized Ni/Al2O3 catalyst promoted with La. They showed that the NH3 conversion is about 96.9% at 550 °C and GHSV (gas hourly space velocity) of 30,000 mL/(gcat·h).
Analysis of ammonia decomposition reactor for fuel cells was studied by Alagharu et al. [31]. It was shown that the reactor has a sharp temperature decrease due to endothermic reaction. The numerical study on the hydrogen production from ammonia decomposition using Ni-Pt/Al2O3 as catalyst in a packed-bed reactor was performed by Chein et al. [32]. It was found that the inlet NH3 volumetric flow rate is an important factor that determines the reaction temperature and decomposition efficiency in addition to the catalyst type and weight. Low-temperature H2 production from ammonia using ruthenium-based catalysts was investigated by Hill et al. [33]. It was shown that the high conductivity of graphitized carbon nanotubes allows for greater electronic modification of the ruthenium nanoparticles by cesium located in close proximity.
A metal-organic framework templated approach for designing ruthenium–cesium catalysts for hydrogen generation was investigated by Hu et al. [34]. Their results showed that the cesium promoter acts as an electronic modifier of Ru and also as a molecular spacer enhancing the stability under reaction conditions. Ammonia decomposition enhancement by Cs-promoted Fe/Al2O3 catalysts was studied by Parker et al. [35]. It was shown that at all loadings of Cs investigated, the activity of the Fe/Al2O3 catalysts was enhanced, with the optimum Cs:Fe being ca. 1. The highly efficient ammonia decomposition using novel high-entropy alloy catalysts made of earth-abundant elements was reported by Xie et al. [36]. It was revealed that the much enhanced dispersion of Ru nanoparticles, high density of surface base sites, and strong interaction between Ru nanoparticles and c-MgO all benefit the highly efficient Ru/c-MgO catalysts.
Other recent articles for the ammonia decomposition using the Ru-based catalysts were reported [37,38,39,40,41,42]. Since Ni was shown as the best catalytic activity among non-noble catalysts for NH3 decomposition [18], the recent articles were reported [43,44,45,46]. A review on ammonia decomposition catalysts, support, and promoter for on-site hydrogen generation was given by Yin et al. [47]. A review on catalysts for NH3 decomposition was provided by Schuth et al. [48]. A recent review on the low-temperature ammonia decomposition catalysts for hydrogen generation was given by Mukherjee et al. [49]. A review on the reactor technology options for distributed hydrogen generation via ammonia decomposition was provided by Chiuta et al. [50].
The optimal condition for the ammonia decomposition was found at a Cs/Ru weight ratio of 3, where the Ru/C was prepared from RuCl3 or Ru(NO)(NO3)3 and carbon powder [51]. The effect of Cs loading on the performance of ammonia decomposition in the fixed-bed reactor was re-examined, where the commercial 5 wt.% Ru/C catalyst was used in this work. The Cs promotion mechanism at a lower Cs/Ru molar ratio and the possible mechanisms for Cs effects on the ammonia conversion at higher Cs/Ru molar ratio were discussed.
2. Results and Discussion
To examine the distributions of promoter Cs and catalyst Ru on the carbon support during the blending processes of mixing the Cs with Ru/C, the scanning electron microscopy (SEM) was used to observe the surface structure of catalyst particles and to facilitate the maps analyses of elements through the energy-dispersive spectroscopy (EDS). The SEM image and maps of elements for the overall molar ratio Cs/Ru = 4 are shown in Figure 1a–d. Here, the overall molar ratio of Cs/Ru = 4, for instance, means that 38.6 mg of dry CsNO3 powder and 100 mg of dry 5 wt.% Ru/C powder in this work were taken to mix with water during the blending process so that the overall molar ratio of Cs to Ru is 4. After the blending processes between the promoter Cs and Ru/C, 64.16% of the particle sizes are found between 18.5 and 74 μm. The average size of Ru-Cs/C particles is 42.30 μm. The SEM image given in Figure 1a shows that a wavy surface structure of Ru-Cs/C particles with the slope of surface texture at about 53° can be seen. The width and height of this image are about 42 and 34 μm, respectively, which is smaller than the average size of particles. The map of element C through EDS in Figure 1b basically matches the surface texture in Figure 1a. The bright spots in the maps of elements Ru and Cs in Figure 1c,d, respectively, are uniformly distributed in the whole picture. This indicates that the uniformities of both Ru and Cs particles on the carbon support are good.
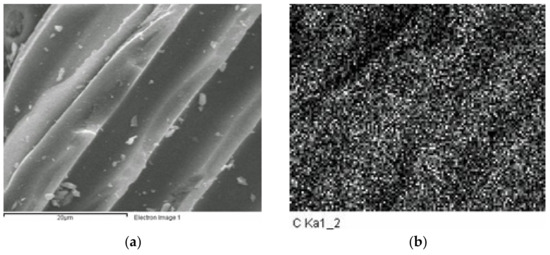
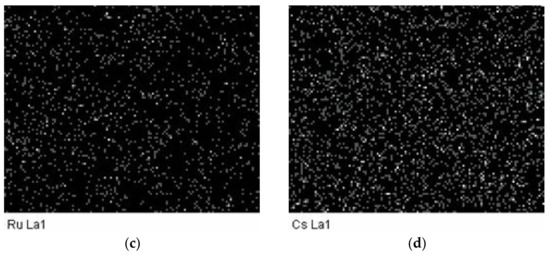
Figure 1.
The SEM image and maps of elements for the overall molar ratio of Cs/Ru = 4, (a) SEM image, (b) map of element C, (c) map of element Ru, and (d) map of element Cs.
The SEM image and maps of elements for the overall molar ratio of Cs/Ru = 6 are shown in Figure 2a–d. The SEM image given in Figure 2a shows an uneven and wavy surface structure of Ru-Cs/C particles with a near horizontal surface texture. The bright spots for the map of element C in Figure 2b reflect the surface texture characteristics in Figure 2a. Both the uniformities of bright spots for the maps of elements Ru and Cs in Figure 2c,d, respectively, are good throughout the whole pictures. This indicates that the Cs particles could be uniformly distributed on the carbon support during the blending processes for mixing the promoter Cs with the catalyst Ru/C, even at a higher molar ratio of Cs/Ru = 6.
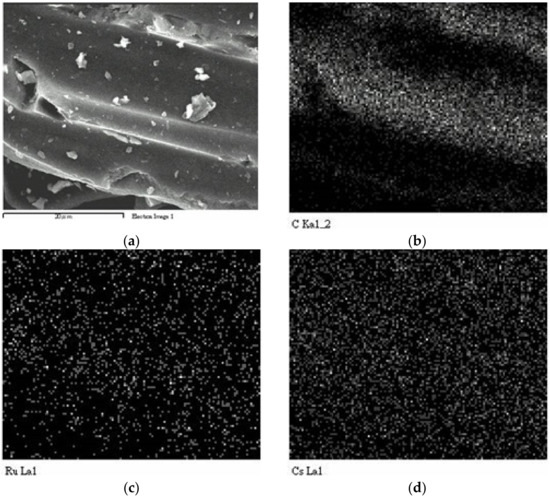
Figure 2.
The SEM image and maps of elements for the overall molar ratio of Cs/Ru = 6, (a) SEM image, (b) map of element C, (c) map of element Ru, and (d) map of element Cs.
The maps of elements for the overall molar ratios Cs/Ru of 0, 2, 4, and 6 cases are obtained. The percentage of atom numbers for each element of C, Ru, and Cs in each SEM picture is shown in Table 1. It is shown that when the overall molar ratios of Cs/Ru are 2, 4, and 6, the actual molar ratios of Cs/Ru found in the SEM pictures with a unit area of only 1430 μm2 are 2.07, 4.21, and 6.15, respectively. This indicates that the molar ratio of Cs/Ru at the micro-scale matches closely with the overall molar ratio of Cs/Ru at the macro scale. This shows that even at the micro-scale, the molar ratio of Cs/Ru is still maintained at nearly the same as the overall molar ratio during the blending processes in this work.

Table 1.
The percentage of atom numbers for each element of C, Ru, and Cs in SEM pictures.
The EDS (energy-dispersive X-ray spectroscopy) spectrum was used for the elemental composition analysis of samples for Ru-Cs/C particles, and it is shown in Figure 3 for Cs/Ru = 4 and Cs/Ru = 6. There are some other impurities such as Na, Cu, and O in the catalyst except for the elements of C, Ru, and Cs. The impurities most likely come from the commercial products of 5 wt.% Ru/C catalyst and CsNO3 powder during their preparations, since our blending processes are simple, as shown in Section 3.1. The impurity elements also may enter into the carbon crystallite and make the carbon signal become less visible, as shown later in Figure 5.
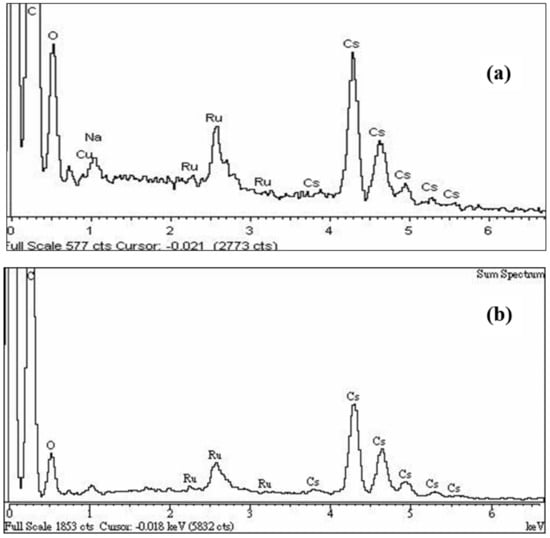
Figure 3.
The EDS (energy-dispersive X-ray spectroscopy) spectrum of Ru-Cs/C particles for (a) Cs/Ru = 4 and (b) Cs/Ru = 6.
The chemical reaction for ammonia decomposition is the following:
The ammonia conversion is defined as:
where and are the ammonia consumption rate (mol/min) and the inlet flow rate, respectively.
When the reactor is filled with Ru-Cs/C catalyst, the effects of overall molar ratio Cs/Ru on the ammonia conversion at the temperature of 350 °C under ammonia inlet flow rates of 6 and 12 mL/min are shown in Figure 4. The results show that the ammonia conversion increases with the increasing of overall molar ratio of Cs/Ru until the maximum value is reached at the overall molar ratio of Cs/Ru = 4.5. This holds for both ammonia inlet flow rates of 6 and 12 mL/min. The conversion for pure Ru/C is about 48% for the inlet flow rate of 6 mL/min, and the maximum conversion is about 77% at Cs/Ru = 4.5, which is 60% larger than that of the pure Ru/C case. When the molar ratio Cs/Ru is larger than 4.5, the results show that the ammonia conversion decreases more quickly with the increasing of overall molar ratio Cs/Ru. It was found that the ammonia conversion at Cs/Ru = 6 is smaller than that of the pure Ru/C case for both flow rates. This indicates that adding too much promoter Cs on the Ru/C catalyst does not result in any benefit to the ammonia conversion.
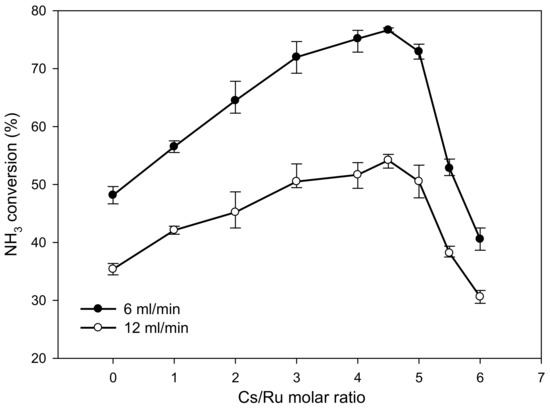
Figure 4.
The variation of overall molar ratio Cs/Ru on the ammonia conversion using Ru/C catalyst at temperature of 350 °C and Ru loading of 1.39 mg.
There are some factors that affect the performance of ammonia decomposition for the Ru/C catalyst. One beneficial factor for the performance is that the N2 dissociating barrier is reduced by the promoter of the Cs atoms, surrounding around the Ru crystallite and adsorbed on the carbon substrate [52]. Some other factors are the transport resistance for NH3 gas diffuse to the Ru surface, the resistance for the electronic conducting from the N2 dissociating site to the carbon surface, and new compound formation. For low Ru loading of the 5 wt.% Ru/C catalyst, the Ru crystallites are well dispersed on the carbon surface.
When the Cs/Ru loading is lower, the mechanism for the improvement of NH3 conversion is basically the same as that for ammonia synthesis. This is so-called “hot ring promotion” (electronic) [52,53], where the Ru crystallite is surrounded by the Cs atoms that form a single layer of ring structure. Since the N2 dissociating barrier is the rate-limiting step [54], the promotion occurs at contact points between the Ru crystallites and Cs atoms [52]; that is, the electronics produced from the N2 dissociating sites are easier to reach the carbon substrate.
When the Cs/Ru loading is higher, the Cs atoms surrounding the Ru crystallite are increasing. The transport resistance becomes pronounced due to the reduction of contact area between Ru and NH3 gas, and the reaction sites are reduced. Since we did not find the new compound formation from Figure 3 and Figure 5 for molar ratio of Cs/Ru = 6, the decreasing of ammonia conversion for molar ratio Cs/Ru > 4.5 may be attributable to remarkable increasing of the transport resistance and the electronic conducting resistance as well as the reduction of reaction sites. The picture that that the Cs atoms form a single layer of ring structure at the carbon substrate for the low Cs/Ru loading may be needed to modify for the high Cs/Ru loading. This suggests that the information about the detail structure between the Cs atoms on Ru crystallite and carbon substrate is needed to well realize the mechanism at a higher molar ratio of Cs/Ru.
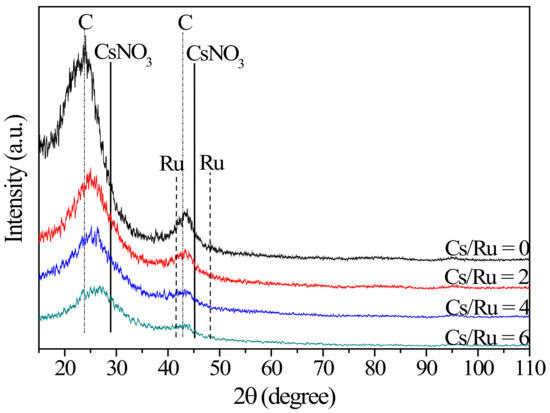
Figure 5.
The XRD patterns for Ru/C catalysts promoted with different overall molar ratios of Cs/Ru at a reaction temperature of 350 °C.
To further understand the role of Cs in the ammonia decomposition reaction, the X-ray diffraction (XRD) study was performed to examine the phase formation after the Ru-Cs/C catalyst had been used for the ammonia decomposition. The XRD patterns for Ru/C catalyst promoted with different molar ratios of Cs/Ru are shown in Figure 5. For the pure Ru/C catalyst (Cs/Ru = 0), there are two big peaks (2θ ≈ 23°, 42°) that are attributable to carbon particles, and there is no visible peak for Ru particles. As indicated by Li et al. [20], this is due to the fact that the Ru particles are highly dispersed on the carbon supports with sizes of about 2–5 nm.
The XRD pattern with a Cs loading of Cs/Ru = 2 is basically similar to that of pure Ru/C catalyst. This indicates that no new compound formation occurs between Cs/Ru and C elements. There are also only two big peaks; there is no additional visible peak attributable to CsNO3. This may be due to the fact that the Cs particles are also highly dispersed on the carbon support, as shown in the EDS maps in Figure 1 and Figure 2. However, the XRD intensity becomes lower when the Cs loading is higher and the two peaks due to the carbon element become more blunt. As shown in Figure 3, there are some other impurities such as Na and Cu in the catalyst. The impurity elements also may enter into the carbon crystallite and make the carbon signal become less visible.
The variations of the ammonia conversions with reaction temperatures in a fixed-bed reactor for 5 wt.% Ru/C catalyst with an overall molar ratio of Cs/Ru = 4.5 for inlet flow rates of 6 and 12 mL/min are shown in Figure 6. The total loading of Ru-Cs/C catalyst is 0.107 g, where Ru/C is 74.6 mg and CsNO3 is 32.4 mg, and the Ru loading is 3.73 mg. The corresponding values of GHSV (gas hourly space velocity) for inlet flow rates of 6 and 12 mL/min are 96,515 and 193,029 mL/(h·gcat), respectively. The results show that the temperature has a significant effect on the ammonia conversion. The higher the temperature that is provided, the higher the ammonia conversion would result. The ammonia conversion is nearly 100% at the temperature of 400 °C for both inlet ammonia flow rates of 6 and 12 mL/min, but it is quickly decreased with the decreasing of temperature. At a temperature of 350 °C, the ammonia conversion is still high as 92.7% for inlet flow rates of 6 mL/min, and it is 76.8% at flow rates of 12 mL/min. At the temperature of 325 °C, the ammonia conversions for the inlet flow rates of 6 and 12 mL/min are 74.6% and 44.2%, respectively. This indicates that the decreasing rate of ammonia conversion with the decreasing of temperature is higher for the higher inlet flow rate.
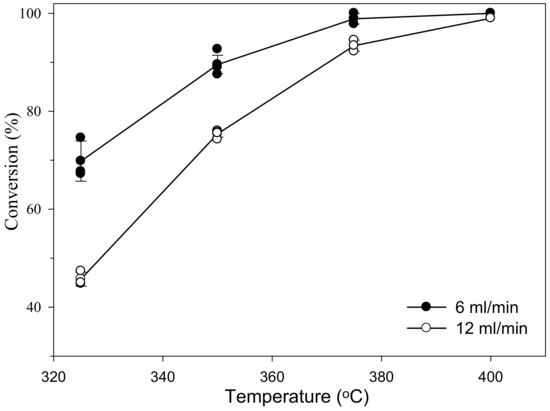
Figure 6.
The variation of the ammonia conversion with temperature for Ru/C catalysts promoted with a Cs/Ru molar ratio of 4.5 and Ru loading of 3.73 mg.
The effects of GHSV on the ammonia conversions for the temperature of 350 °C and 400 °C are plotted in Figure 7 with an overall molar ratio of Cs/Ru = 4.5. The different value of GHSV was obtained by changing the ammonia inlet flow rate from 3 to 15 mL/min, while the fixed catalyst load was kept (Ru loading = 3.73 mg, the total loading of Ru-Cs/C is 0.107 g). The results indicate that the ammonia conversions at 400 °C are all near 100% for GHSV from 48,257 to 241,287 mL/(h·gcat); that is, almost all the ammonia converts to hydrogen. However, when the reaction temperature is reduced to 350 °C, the ammonia conversion is decreased with the increasing of GHSV. This indicates that the GHSV has an important effect on ammonia decomposition performance at 350 °C. The main reason for the decrease of ammonia conversion at 350 °C is attributed to a shorter residence time when the value of GHSV is increased, and shorter residence time implies a shorter reaction time of the ammonia decomposition.
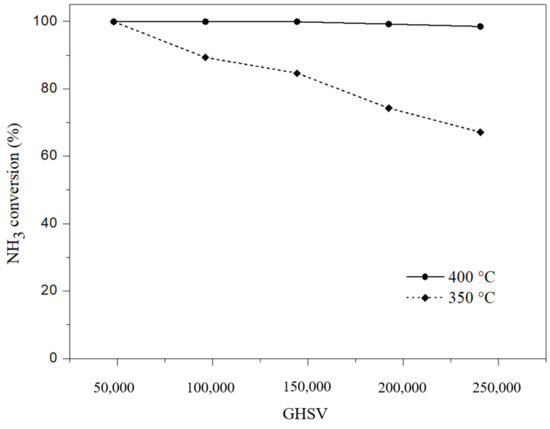
Figure 7.
The variation of the ammonia conversion with gas hourly space velocity (GHSV) (mL h−1·gcat−1) for Ru/C catalysts promoted with Cs/Ru molar ratio of 4.5 and Ru loading of 3.73 mg.
The H2 production rate, which is expressed by symbol r in units of m molH2/(min·gRu), in the ln scale as a function of temperature (1/T) for the inlet flow rate of 9 and 15 mL/min are given in Figure 8. This plot is used to estimate the activation energy, E, by using Arrhenius equation. The H2 production rate can be expressed as,
where Ru is the universal gas constant (= 8.314 kJ kmol−1 K−1). The coefficient A is generally the function of temperature as well as H2 and NH3 concentrations. The data of H2 production rates are approximated by two straight lines. The slope of each straight line is equal to –E/Ru. The estimated activation energies for the inlet flow rates of 9 and 15 mL/min are about 28 and 46 kJ/mole, respectively. The comparison of activation energy between different Ru-based catalysts is given in Table 2. The activation energies for Ru/CNT catalysts using Cs as a promoter are at the range 49.5–61.9 kJ/mol, while they are about 28–72 kJ/mol for Ru/C catalysts.
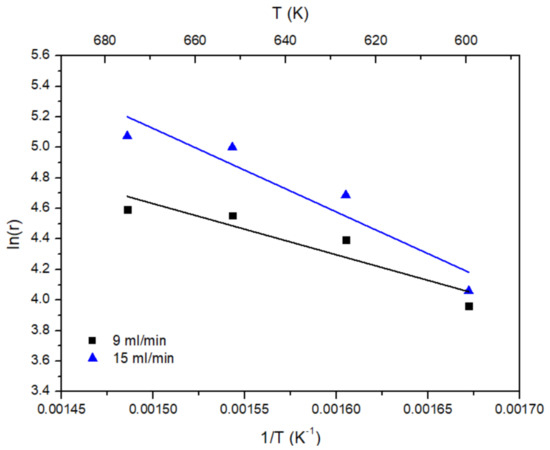
Figure 8.
The variation of the H2 production rate (in ln scale) with the temperature.
Table 2.
The comparison of activation energy between different Ru-based catalysts.
3. Materials and Methods
3.1. Catalyst Preparation
(1) The Ru/C catalyst was used in this study and different molar ratios of Cs/Ru were prepared. The 5 wt.% Ru/C (activated carbon) catalyst, purchased from the Alfa Aeser company and 99.99% purified cesium nitrate (CsNO3) powder (promoter), purchased from the Aldrich company were used for the catalyst preparation. For each preparation, about 0.1 g more of dry Ru/C was first placed in the petri dish (diameter = 60 mm, depth = 15 mm).
(2) Then, the catalyst material Ru/C obtained in Step (1) above was dried in 100 °C air for 15 min. After that, 0.1 g of this dried Ru/C catalyst is placed in a dry container to be cooled down to the room temperature for use in the next step.
(3) To obtain a specific molar ratio of Cs/Ru, the required quantity of CsNO3 powders could be calculated and measured, and then, the CsNO3 powders were loaded into a 2 mL transparent centrifuge tube. After adding 0.5 mL deionized water into each tube, the CsNO3 aqueous solution was stirred uniformly for 3 min until all the powders were mixed well with the water.
(4) We placed a measured amount of Ru/C catalyst into the glass container filled with previously prepared promoter solution (CsNO3 aqueous solution) and then heated the glass container with an 80 °C constant temperature heater. While during the heating process, a complete mixing between the catalyst and the promoter solution was ensured by mechanical stirring.
(5) After 5–10 min of heating, the catalyst with promoter showed a semi-dried condition and then was spread out on the bottom of the glass container that was placed in a 90 °C oven for a 12 h further drying operation.
3.2. Fixed-Bed Reactor
The cross-section of the tubular fixed-bed reactor is shown in Figure 9. The material used for the reactor is the stainless steel 316, and the inner and outer diameters of reactor are 1/8 inch and 1/4 inch, respectively. The tube is filled with Ru-Cs/C catalyst particles with a height of h. The value of h for the total loading of Ru-Cs/C catalyst is 0.107 g (74.6 mg of Ru/C and 32.4 mg of CsNO3), and the height is about 3.1 cm. The catalyst particles are fixed in space by glass wool placed on the top and bottom of the catalyst bed. The height b of glass wool is about 0.8–1 cm. The up-flow of ammonia gas through the reactor is arranged.
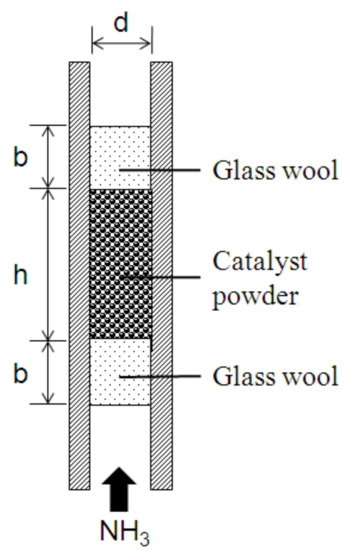
Figure 9.
The cross-section of the tubular fixed-bed reactor.
3.3. Experimental Setup and Performance Measurement System
A schematic diagram of the experimental setup for the ammonia decomposition performance measurement system in a fixed-bed reactor is shown in Figure 10. The inlet flow rate to the reactor can be set by a flow rate controller, which is made by a PROTEC Instrument (PC-510 series) in Taiwan. The reactor is heated by placing it inside of a tubular furnace with R-type electrical heating wires, where furnace was made in Taiwan. The height of the furnace is 30 cm, and its inner and outer diameters are 5 and 18 cm, respectively. The temperature of the furnace is controlled by using a two-point PID (Proportion Integral Differential) controller. The temperature in this paper refers to the temperature inside of the furnace. A sharp temperature decrease in the entrance region of catalyst bed may occur due to the endothermic reaction of ammonia decomposition [31].
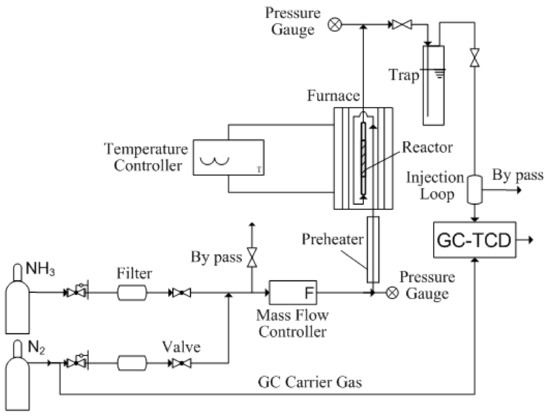
Figure 10.
A schematic diagram of the experimental setup for the ammonia decomposition performance measurement system in a fixed-bed reactor.
The reaction products in the reactor, including H2, N2, and some residue NH3, enter the trap filled with 1 M H2SO4 solution. The residue NH3 gas has to be removed in the trap to avoid the corrosion on the GC-TCD system, which was purchased from China Chromatography CO., Taiwan, R.O.C. The GC-TCD with a packed column using nitrogen as the carrier gas is used to detect the H2 concentration in the gases. When the gases enter the injection loop system of GC-TCD after the trap, the amount of sampling gases taken by the GC is 0.5 mL. In the bypass pipe exit of the loop system, a bubble meter is used to measure the flow rate (ml/min) that is leaving the trap.
Once we know the gas flow rate (ml/min) and H2 concentration, the H2 production rate (mol/min) can be obtained by using the ideal gas equation. The ammonia consumption rate (mol/min) at the reactor exit also can be obtained from the ammonia decomposition reaction equation: 2NH3 → 3H2 + N2, where 3 moles of H2 production will consume 2 moles of NH3. After the ammonia gas inlet flow rate (mL/min) is measured and converted to the unit of mol/min, the ammonia conversion can be calculated from Equation (2).
4. Conclusions
An experimental study was performed to evaluate the effects of different promoter Cs loadings on the hydrogen production from ammonia decomposition using commercial 5 wt.% Ru/C (activated carbon) as catalyst in a fixed-bed reactor. Based on the parameters used in this work, the conclusions are as follows.
(1) The ammonia conversion at 350 °C increases with the increase of molar ratio of Cs/Ru until the maximum value is reached at the molar ratio of Cs/Ru = 4.5. After that, it decreases quickly with the increase of molar ratio Cs/Ru. At Cs/Ru molar ratio of 6, the ammonia conversion is even smaller than that of the pure Ru/C case. This indicates that adding too much promoter Cs on the Ru/C catalyst does not result in any benefit.
The Cs promotion at lower Cs/Ru molar ratio may be attributable the “hot ring promotion” [53], where the Cs atoms form a single layer of ring structure surrounding the Ru crystallite and the N2 dissociating barrier is assumed as the rate-limiting step. For a higher Cs/Ru molar ratio (Cs/Ru > 4.5), the transport resistance becomes pronounced due to the reduction of contact area between Ru and NH3 gas. The possible mechanism for the decreasing of ammonia conversion with the increase of Cs loading may be attributable to a remarkable increasing of the transport resistance and the electronic conducting resistance, and the reduction of reaction sites, since we did not find a new compound formation.
(2) At the optimum molar ratio of Cs/Ru = 4.5 for the catalyst, it was shown that the temperature has a significant effect on the ammonia conversion. The decreasing rate of ammonia conversion with the decreasing of temperature is higher for the higher inlet flow rate.
(3) At a molar ratio of Cs/Ru = 4.5, all the ammonia conversions at 400 °C are near 100% for GHSV from 48,257 to 241,287 mL/(h·gcat). However, the ammonia conversion at 350 °C is quickly decreased with the increasing of GHSV.
Author Contributions
Conceptualization, Y.-C.C.; experiment performed by Y.-L.C.; methodology, C.-F.J. (major) and Y.-C.C.; validation, Y.-L.C., C.-F.J. and Y.-C.C.; data curation and analysis, Y.-L.C., C.-F.J. and Y.-C.C.; paper written and revised by Y.-C.C.; supervision, C.-F.J.; All authors have read and agreed to the published version of the manuscript.
Funding
This work was founded by the Ministry of Science and Technology, Taiwan, R.O.C., under grant of NSC 99-2221-E-239 -026 and MOST 110-2622-8-239 -001 -TE5.
Acknowledgments
We acknowledged the help from our colleague of Chien-Chon Chen in Department of Energy Engineering, National United University for the analysis and interpretation of the SEM images, EDS intensity spectrum pattern, and the X-ray diffraction.
Conflicts of Interest
The authors declare no conflict of interest.
References
- Xue, M.; Wang, Q.; Lin, B.L.; Tsunemi, K. Assessment of Ammonia as an Energy Carrier from the Perspective of Carbon and Nitrogen Footprints. ACS Sustain. Chem. Eng. 2019, 7, 12494–12500. [Google Scholar] [CrossRef]
- Giddey, S.; Badwal, S.P.S.; Munnings, C.; Dolan, M. Ammonia as a Renewable Energy Transportation Media. ACS Sustain. Chem. Eng. 2017, 5, 10231–10239. [Google Scholar] [CrossRef]
- Zamfirescu, C.; Dincer, I. Ammonia as a Green Fuel and Hydrogen Source for Vehicular Applications. Fuel Process. Technol. 2009, 90, 729–737. [Google Scholar] [CrossRef]
- Nikolaidis, P.; Poullikkas, A. A Comparative Overview of Hydrogen Production Processes. Renew. Sust. Energy Rev. 2017, 67, 597–611. [Google Scholar] [CrossRef]
- Chen, L.; Qi, Z.; Zhang, S.; Su, J.; Somorjai, G.A. Catalytic Hydrogen Production from Methane: A Review on Recent Progress and Prospect. Catalysts 2020, 10, 858. [Google Scholar] [CrossRef]
- Park, H.G.; Han, S.Y.; Jun, K.W.; Woo, Y.; Park, M.J.; Kim, S.K. Bench-scale Steam Reforming of Methane for Hydrogen Production. Catalysts 2019, 9, 615. [Google Scholar] [CrossRef]
- Chen, W.H.; Lin, S.C. Characterization of Catalytic Partial Oxidation of Methane with Carbon Dioxide Utilization and Excess Enthalpy Recovery. Appl. Energy 2016, 162, 1141–1152. [Google Scholar] [CrossRef]
- Fasolini, A.; Ruggieri, S.; Femoni, C.; Basile, F. Highly Active Catalysts Based on the Rh4(CO)12 Cluster Supported on Ce0.5Zr0.5 and Zr Oxides for Low-Temperature Methane Steam Reforming. Catalysts 2019, 9, 800. [Google Scholar] [CrossRef]
- Karadeniz, H.; Karakaya, C.; Tischer, S.; Deutschmann, O. Numerical Simulation of Methane and Propane Reforming over a Porous Rh/Al2O3 Catalyst in Stagnation-flows: Impact of Internal and External Mass Transfer Limitations on Species Profiles. Catalysts 2020, 10, 915. [Google Scholar] [CrossRef]
- Holladay, J.D.; Hu, J.; King, D.L.; Wang, Y. An Overview of Hydrogen Production Technologies. Catal. Today 2009, 139, 244–260. [Google Scholar] [CrossRef]
- Chen, W.H.; Cheng, T.C.; Hung, C.I. Numerical Predictions on Thermal Characteristic and Performance of Methanol Steam Reforming with Microwave-assisted Heating. Int. J. Hydrog. Energy 2011, 36, 8279–8291. [Google Scholar] [CrossRef]
- Baschuk, J.J.; Li, X. Carbon Monoxide Poisoning of Proton Exchange Membrane Fuel Cells. Int. J. Energy Res. 2001, 25, 695–713. [Google Scholar] [CrossRef]
- Valdés-López, V.F.; Mason, T.; Shearing, P.R.; Brett, D.J.L. Carbon Monoxide Poisoning and Mitigation Strategies for Polymer Electrolyte Membrane Fuel Cells—A Review. Prog. Energy Combus. Sci. 2020, 79, 100842. [Google Scholar] [CrossRef]
- Soltani, R.; Rosen, M.; Dincer, I. Assessment of CO2 Capture Options from Various Points in Steam Methane Reforming for Hydrogen Production. Int. J. Hydrog. Energy 2014, 39, 20266–20275. [Google Scholar] [CrossRef]
- Huang, W.J.; Yu, C.T.; Sheu, W.J.; Chen, Y.C. The Effect of Non-uniform Temperature on the Sorption-enhanced Steam Methane Reforming in a Tubular Fixed-bed Reactor. Int. J. Hydrog. Energy 2020. [Google Scholar] [CrossRef]
- Chen, W.H.; Chen, C.Y. Water Gas Shift Reaction for Hydrogen Production and Carbon Dioxide Capture: A Review. Appl. Energy 2020, 258, 114078. [Google Scholar] [CrossRef]
- Choudhary, T.V.; Svadinaragana, C.; Goodman, D.W. Catalytic Ammonia Decomposition: COx-free Hydrogen Production for Fuel Cell Applications. Catal. Lett. 2001, 72, 197–201. [Google Scholar] [CrossRef]
- Yin, S.F.; Zhang, Q.H.; Xu, B.Q.; Zhu, W.X.; Ng, C.F.; Au, C.T. Investigation on the Catalysis of COx-free Hydrogen Generation from Ammonia. J. Catal. 2004, 224, 384–396. [Google Scholar] [CrossRef]
- Ganley, J.C.; Seebauer, E.G.; Masel, R.I. Development of a Micro-reactor for the Production of Hydrogen from Ammonia. J. Power Sources 2004, 137, 53–61. [Google Scholar] [CrossRef]
- Li, L.; Zhu, Z.H.; Yan, Z.F.; Lu, G.Q.; Rintoul, L. Catalytic Ammonia Decomposition Over Ru-carbon Catalysts: The Importance of the Structure of Carbon Support. Appl. Catal. A Gen. 2007, 320, 166–172. [Google Scholar] [CrossRef]
- Carcia-Garcia, F.R.; Ma, Y.H.; Rodriguez-Ramos, I.; Guerrero-Ruiz, A. High Purity Hydrogen Production by Low Temperature Catalytic Ammonia Decomposition in a Multifunctional Membrane Reactor. Catal. Commun. 2008, 9, 482–486. [Google Scholar] [CrossRef]
- Li, G.; Kanezashi, M.; Lee, H.R.; Maeda, M.; Yoshioka, T.; Tsuru, T. Preparation of a Novel Bimodal Catalytic Membrane Reactor and Its Application to Ammonia Decomposition for COx-free Hydrogen Production. Int. J. Hydrog. Energy 2012, 37, 12105–12113. [Google Scholar] [CrossRef]
- Rarog, W.; Szmigiel, D.; Kowalczyk, Z.; Jodzis, S.; Zielinski, J. Ammonia Decomposition over the Carbon-based Ruthenium Catalyst Promoted with Barium or Cesium. J. Catal. 2003, 218, 465–469. [Google Scholar] [CrossRef]
- Zheng, W.; Zhang, J.; Xu, H.; Li, W. NH3 Decomposition Kinetics on Supported Ru Clusters: Morphology and Particle Size Effect. Catal. Lett. 2007, 119, 311–318. [Google Scholar] [CrossRef]
- Sorensen, R.Z.; Klerke, A.; Quaade, U.; Jensen, S.; Hansen, O.; Christensen, C.H. Promoted Ru on High-surface Area Graphite for Efficient Miniaturized Production of Hydrogen from Ammonia. Catal. Lett. 2006, 112, 77–81. [Google Scholar] [CrossRef]
- Liu, Y.; Wang, H.; Li, J.; Lu, Y.; Wu, H.; Xue, Q.; Chen, L. Monolithic Microfibrous Nickel Catalyst Co-modified with Ceria and Alumina for Miniature Hydrogen Production via Ammonia Decomposition. Appl. Catal. A Gen. 2007, 328, 77–82. [Google Scholar] [CrossRef]
- Chellappa, A.S.; Fischer, C.M.; Thomson, W.J. Ammonia Decomposition Kinetics over Ni-Pt/Al2O3 for PEM Fuel Cell Applications. Appl. Catal. A 2002, 227, 231–240. [Google Scholar] [CrossRef]
- Wang, M.; Li, J.; Chen, L.; Lu, Y. Miniature NH3 Cracker Based on Microfibrous Entrapped Ni-CeO2/Al2O3 Catalyst Monolith for Portable Fuel Cell Power Supplies. Int. J. Hydrog. Energy 2009, 34, 1710–1716. [Google Scholar] [CrossRef]
- Plana, C.; Armenise, S.; Monzón, A.; García-Bordejé, E. Ni on Alumina-coated Cordierite Monoliths for in situ Generation of CO-free H2 from Ammonia. J. Catal. 2010, 275, 228–235. [Google Scholar] [CrossRef]
- Zhang, J.; Xu, H.; Jin, X.; Ge, O.; Li, W. Characterizations and Activities of the Nano-sized Ni/Al2O3 and Ni/La–Al2O3 Catalysts for NH3 Decomposition. Appl. Catal. A Gen. 2005, 290, 87–96. [Google Scholar] [CrossRef]
- Alagharu, V.; Palanki, S.; West, K.N. Analysis of Ammonia Decomposition Reactor to Generate Hydrogen for Fuel Cell Applications. J. Power Sources 2010, 195, 829–833. [Google Scholar] [CrossRef]
- Chein, R.Y.; Chen, Y.C.; Chang, C.S.; Chung, J.N. Numerical Modeling of Hydrogen Production from Ammonia Decomposition for Fuel Cell Applications. Int. J. Hydrog. Energy 2010, 35, 589–597. [Google Scholar] [CrossRef]
- Hill, A.K.; Torrente-Murciano, L. Low Temperature H2 Production from Ammonia Using Ruthenium-based Catalysts: Synergetic Effect of Promoter and Support. Appl. Catal. B. Environ. 2015, 172, 129–135. [Google Scholar] [CrossRef]
- Hu, Z.; Mahin, J.; Torrente-Murciano, L. A MOF-templated Approach for Designing Ruthenium-cesium Catalysts for Hydrogen Generation from Ammonia. Int. J. Hydrog. Energy 2019, 44, 30108–30118. [Google Scholar] [CrossRef]
- Parker, L.A.; Carter, J.H.; Dummer, N.F.; Richards, N.; Morgan, D.J.; Golunski, S.E.; Hutchings, G.J. Ammonia Decomposition Enhancement by Cs-promoted Fe/Al2O3 Catalysts. Catal. Lett. 2020, 150, 3369–3376. [Google Scholar] [CrossRef]
- Xie, P.; Yao, Y.; Huang, Z.; Liu, Z.; Zhang, J.; Li, T.; Wang, G.; Shahbazian-Yassar, R.; Hu, L.; Wang, C. Highly Efficient Decomposition of Ammonia Using High-entropy Alloy Catalysts. Nat. Commu. 2019, 10, 4011. [Google Scholar] [CrossRef]
- Li, G.; Kanezashi, M.; Tsuru, T. Catalytic Ammonia Decomposition Over High-performance Ru/graphene Nanocomposites for Efficient COx-free Hydrogen Production. Catalysts 2017, 7, 23. [Google Scholar] [CrossRef]
- Ju, X.; Liu, L.; Yu, P.; Guo, J.; Zhang, X.; He, T.; Wu, G.; Chen, P. Mesoporous Ru/MgO Prepared by a Deposition-precipitation Method as Highly Active Catalyst for Producing COx-free Hydrogen from Ammonia Decomposition. Appl. Catal. B Environ. 2017, 211, 167–175. [Google Scholar] [CrossRef]
- Wang, Z.; Cai, Z.; Wei, Z. Highly Active Ruthenium Catalyst Supported on Barium Hexaaluminate for Ammonia Decomposition to COx-free Hydrogen. ACS Sustain. Chem. Eng. 2019, 7, 8226–8235. [Google Scholar] [CrossRef]
- Hu, Z.; Mahin, J.; Datta, S.; Bell, T.E.; Torrente-Murciano, L. Ru-based Catalysts for H2 Production from Ammonia: Effect of 1D Support. Top. Catal. 2019, 62, 1169–1177. [Google Scholar] [CrossRef]
- Hu, X.C.; Fu, X.P.; Wang, W.W.; Wang, X.; Wu, K.; Si, R.; Ma, C.; Jia, C.J.; Yan, C.H. Ceria-supported Ruthenium Clusters Transforming from Isolated Single Atoms for Hydrogen Production via Decomposition of Ammonia. Appl. Catal. B Environ. 2020, 268, 118424. [Google Scholar] [CrossRef]
- Pinzón, M.; Romero, A.; Consuegra, A.D.L.; Osa, A.R.D.L.; Sánchez, P. Hydrogen Production by Ammonia Decomposition over Ruthenium Supported on SiC Catalyst. J. Indus. Eng. Chem. 2021, 94, 326–335. [Google Scholar] [CrossRef]
- Im, Y.; Muroyama, H.; Matsui, T.; Eguchi, K. Ammonia Decomposition over Nickel Catalysts Supported on Alkaline Earth Metal Aluminate for H2 Production. Int. J. Hydrog. Energy 2020, 45, 26979–26988. [Google Scholar] [CrossRef]
- Chen, Y.Y.; Chang, Y.C.; Hung, W.Y.; Lin, H.P.; Shih, H.Y.; Xie, W.A.; Li, S.N.; Hsu, C.H. Green Synthesis of Porous Ni-silicate Catalyst for Hydrogen Generation via Ammonia Decomposition. Int. J. Energy Res. 2020, 44, 9748–9756. [Google Scholar] [CrossRef]
- Yu, Y.; Gan, Y.M.; Huang, C.; Lu, Z.H.; Wang, X.; Zhang, R.; Feng, G. Ni/La2O3 and Ni/MgO-La2O3 Catalysts for the Decomposition of NH3 into Hydrogen. Int. J. Hydrog. Energy 2020, 45, 16528–16539. [Google Scholar] [CrossRef]
- Gu, Y.; Ma, Y.; Long, Z.; Zhao, S.; Wang, Y.; Zhang, W. One-pot Synthesis of Supported Ni@Al2O3 Catalysts with Uniform Small-sized Ni for Hydrogen Generation via Ammonia Decomposition. Int. J. Hydrog. Energy 2021, 46, 4045–4054. [Google Scholar] [CrossRef]
- Yin, S.F.; Xu, B.Q.; Zhou, X.P.; Au, C.T. A Mini-review on Ammonia Decomposition Catalysts for On-site Generation of Hydrogen for Fuel Cell Applications. Appl. Catal. A Gen. 2004, 277, 1–9. [Google Scholar] [CrossRef]
- Schuth, F.; Palkovits, R.; Schlogl, R.; Su, D.S. Review: Ammonia as a Possible Element in an Energy Infrastructure: Catalysts for Ammonia Decomposition. Energy Environ. Sci. 2012, 5, 6278–6289. [Google Scholar] [CrossRef]
- Chiuta, S.; Everson, R.C.; Neomagus, H.W.J.P.; Gryp, P.V.D.; Bessarabov, D.G. Reactor Technology Options for Distributed Hydrogen Generation via Ammonia Decomposition: A Review. Int. J. Hydrog. Energy 2013, 38, 14968–14991. [Google Scholar] [CrossRef]
- Mukherjee, S.; Devaguptapu, S.V.; Sviripa, A.; Lund, C.R.F.; Wu, G. Review Low-temperature Ammonia Decomposition Catalysts for Hydrogen Generation. Appl. Catal. B Environ. 2018, 226, 162–181. [Google Scholar] [CrossRef]
- Huang, D.C.; Jiang, C.H.; Liu, F.J.; Cheng, Y.C.; Chen, Y.C.; Hsueh, K.L. Preparation of Ru-Cs Catalyst and Its Application in Hydrogen Production by Ammonia Decomposition, Int. J. Hydrog. Energy 2013, 38, 3233–3240. [Google Scholar] [CrossRef]
- Kowalczyk, Z.; Krukowski, M.; Raróg-Pilecka, W.; Szmigiel, D.; Zielinski, J. Carbon-based Ruthenium Catalyst for Ammonia Synthesis: Role of the Barium and Caesium Promoters and Carbon Support. Appl. Catal. A Gen. 2003, 248, 67–73. [Google Scholar] [CrossRef]
- Tennison, S.R. Catalytic Ammonia Synthesis: Fundamentals and Practice; Jennings, J.R., Ed.; Chapter 9; Plenum Press: New York, NY, USA, 1991. [Google Scholar]
- Ertl, G. Catalytic Ammonia Synthesis: Fundamentals and Practice; Jennings, J.R., Ed.; Chapter 3; Plenum Press: New York, NY, USA, 1991. [Google Scholar]


Publisher’s Note: MDPI stays neutral with regard to jurisdictional claims in published maps and institutional affiliations. |
© 2021 by the authors. Licensee MDPI, Basel, Switzerland. This article is an open access article distributed under the terms and conditions of the Creative Commons Attribution (CC BY) license (http://creativecommons.org/licenses/by/4.0/).