
Microporous Volumes from Nitrogen Adsorption at 77 K: When to Use a Different Standard Isotherm?


Abstract
:
1. Introduction
2. Results and Discussion
3. Materials and Methods
4. Conclusions
Supplementary Materials
Author Contributions
Funding
Conflicts of Interest
References
- Gregg, S.J.; Sing, K.S.W. Adsorption, Surface Area and Porosity, 2nd ed.; Academic Press: Cambridge, MA, USA, 1982. [Google Scholar]
- Rouquerol, F.; Rouquerol, J.; Sing, K.S.W.; Llewellyn, P.; Maurin, G. Adsorption by Powders and Porous Solids Principles, Methodology and Applications, 2nd ed.; Elsevier B.V.: Amsterdam, The Netherlands, 2014. [Google Scholar]
- Marsh, H.; Rodríguez-Reinoso, F. Chapter 4—Characterization of Activated Carbon. In Activated Carbon; Marsh, H., Rodríguez-Reinoso, F., Eds.; Elsevier Science Ltd.: Oxford, UK, 2006; pp. 143–242. ISBN 978-0-08-044463-5. [Google Scholar]
- Sing, K.S.W. Reporting physisorption data for gas/solid systems with special reference to the determination of surface area and porosity (Recommendations 1984). Pure Appl. Chem. 1985, 57, 603–619. [Google Scholar] [CrossRef]
- Rouquerol, J.; Avnir, D.; Fairbridge, C.W.; Everett, D.H.; Haynes, J.H.; Pernicone, N.; Ramsay, J.D.F.; Sing, K.S.W.; Unger, K.K. Recomendations for the characterization of porous solids. Pure Appl. Chem. 1994, 66, 1739–1758. [Google Scholar] [CrossRef]
- Thommes, M.; Kaneko, K.; Neimark, A.V.; Olivier, J.P.; Rodriguez-Reinoso, F.; Rouquerol, J.; Sing, K.S.W. Physisorption of gases, with special reference to the evaluation of surface area and pore size distribution (IUPAC Technical Report). Pure Appl. Chem. 2015, 87, 1051–1069. [Google Scholar] [CrossRef] [Green Version]
- Silvestre-Albero, J.; Silvestre-Albero, A.; Rodríguez-Reinoso, F.; Thommes, M. Physical characterization of activated carbons with narrow microporosity by nitrogen (77.4K), carbon dioxide (273K) and argon (87.3K) adsorption in combination with immersion calorimetry. Carbon 2012, 50, 3128–3133. [Google Scholar] [CrossRef]
- Kulprathipanja, S. Zeolites in Industrial Separation and Catalysis; Wiley-Vch: Weinheim, Germany, 2010. [Google Scholar]
- McKinlay, A.C.; Morris, R.E.; Horcajada, P.; Férey, G.; Gref, R.; Couvreur, P.; Serre, C. BioMOFs: Metal–Organic Frameworks for Biological and Medical Applications. Angew. Chem. Int. Ed. 2010, 49, 6260–6266. [Google Scholar] [CrossRef]
- Ongari, D.; Boyd, P.G.; Barthel, S.; Witman, M.; Haranczyk, M.; Smit, B. Accurate Characterization of the Pore Volume in Microporous Crystalline Materials. Langmuir 2017, 33, 14529–14538. [Google Scholar] [CrossRef]
- Galarneau, A.; Villemot, F.; Rodriguez, J.; Fajula, F.; Coasne, B. Validity of the t-plot Method to Assess Microporosity in Hierarchical Micro/Mesoporous Materials. Langmuir 2014, 30, 13266–13274. [Google Scholar] [CrossRef] [PubMed]
- Villemot, F.; Galarneau, A.; Coasne, B. Adsorption-based characterization of hierarchical metal–organic frameworks. Adsorption 2014, 20, 349–357. [Google Scholar] [CrossRef]
- Villarroel-Rocha, J.; Barrera, D.; Blanco, A.A.G.; Jalil, M.E.R.; Sapag, K. Importance of the alpha(s)-plot Method in the Characterization of Nanoporous Materials. Adsorpt. Sci. Technol. 2013, 31, 165–183. [Google Scholar] [CrossRef] [Green Version]
- Harkins, W.D.; Jura, G. Surfaces of Solids. XIII. A Vapor Adsorption Method for the Determination of the Area of a Solid without the Assumption of a Molecular Area, and the Areas Occupied by Nitrogen and Other Molecules on the Surface of a Solid. J. Am. Chem. Soc. 1944, 66, 1366–1373. [Google Scholar] [CrossRef]
- Lippens, B.C.; de Boer, J.H. Studies on pore systems in catalysts III. Pore-size distribution curves in aluminum oxide systems. J. Catal. 1964, 3, 44–49. [Google Scholar] [CrossRef]
- Lippens, B.C.; de Boer, J.H. Studies on pore systems in catalysts: V. The t method. J. Catal. 1965, 4, 319–323. [Google Scholar] [CrossRef]
- Carrott, P.J.M.; Ribeiro Carrott, M.M.L.; Cansado, I.P.P. Reference data for the adsorption of dichloromethane on carbon materials. Carbon 2001, 39, 465–472. [Google Scholar] [CrossRef]
- Carrott, P.J.M.; Sing, K.S.W. Multilayer adsorption of nitogen and alkanes by non-porous carbons and silicas. Pure Appl. Chem. 1989, 61, 1835–1840. [Google Scholar] [CrossRef]
- Pires, J.; De Carvalho, M.B.; Carvalho, A.P. Aluminum-pillared clays: Decomposition of the intercalating species and textural properties. Zeolites 1997, 19, 107–113. [Google Scholar] [CrossRef]
- Gardner, L.; Kruk, M.; Jaroniec, M. Reference Data for Argon Adsorption on Graphitized and Nongraphitized Carbon Blacks. J. Phys. Chem. B 2001, 105, 12516–12523. [Google Scholar] [CrossRef]
- Bhambhani, M.R.; Cutting, P.A.; Sing, K.S.W.; Turk, D.H. Analysis of nitrogen adsorption isotherms on porous and nonporous silicas by the BET and αs methods. J. Colloid Interface Sci. 1972, 38, 109–117. [Google Scholar] [CrossRef]
- Trindade, A.F.; Gois, P.M.P.; Afonso, C.A.M. Recyclable Stereoselective Catalysts. Chem. Rev. 2009, 109, 418–514. [Google Scholar] [CrossRef] [PubMed]
- Barbaro, P.; Liguori, F. Heterogenized Homogeneous Catalysts for Fine Chemicals Production; Springer: Dordrecht, The Netherlands, 2010. [Google Scholar]
- de Boer, J.H.; Lippens, B.C.; Linsen, B.G.; Broekhoff, J.C.P.; van den Heuvel, A.; Osinga, T.J. The t-curve of multimolecular N2-adsorption. J. Colloid Interface Sci. 1966, 21, 405–414. [Google Scholar] [CrossRef]
- Rodriguez-Reinoso, F.; Martin-Martinez, J.M.; Prado-Burguete, C.; McEnaney, B. A standard adsorption isotherm for the characterization of activated carbons. J. Phys. Chem. 1987, 91, 515–516. [Google Scholar] [CrossRef]
- Cardoso, B.; Pires, J.; Carvalho, A.P.; Carvalho, M.B.; Kuźniarska-Biernacka, I.; Silva, A.R.; Freire, C.; de Castro, B. Catalytic Properties of a MnIII-Salen Complex Immobilised in a Pillared Clay by Simultaneous Pillaring/Encapsulation Procedures. Eur. J. Inorg. Chem. 2005, 2005, 837–844. [Google Scholar] [CrossRef]
- Pereira, C.; Biernacki, K.; Rebelo, S.L.H.; Magalh?es, A.L.; Carvalho, A.P.; Pires, J.; Freire, C. Designing heterogeneous oxovanadium and copper acetylacetonate catalysts: Effect of covalent immobilisation in epoxidation and aziridination reactions. J. Mol. Catal. A Chem. 2009, 312, 53–64. [Google Scholar] [CrossRef]
- Pires, J.; Carvalho, A.; Pinto, M.; Rocha, J. Characterization of Y zeolites dealuminated by solid-state reaction with ammonium hexafluorosilicate. J. Porous Mater. 2006, 13, 107–114. [Google Scholar] [CrossRef]
- Pinto, M.L.; Fernandes, A.C.; Antunes, F.; Pires, J.; Rocha, J. Storage and delivery of nitric oxide by microporous titanosilicate ETS-10 and Al and Ga substituted analogues. Microporous Mesoporous Mater. 2016, 229, 83–89. [Google Scholar] [CrossRef]
- Granadeiro, C.M.; Silva, P.; Saini, V.K.; Paz, F.A.A.; Pires, J.; Cunha-Silva, L.; Balula, S.S. Novel heterogeneous catalysts based on lanthanopolyoxometalates supported on MIL-101(Cr). Catal. Today 2013, 218–219, 35–42. [Google Scholar] [CrossRef]
- Pinto, M.L.; Dias, S.; Pires, J. Composite MOF foams: The example of UiO-66/polyurethane. ACS Appl. Mater. Interfaces 2013, 5, 2360–2363. [Google Scholar] [CrossRef]
- Schoonheydt, R.A.; Pinnavaia, T.; Lagaly, G.; Gangas, N. Pillared clays and pillared layered solids—Technical Report. PURE Appl. Chem. 1999, 71, 2367–2371. [Google Scholar] [CrossRef]
- Kuźniarska-Biernacka, I.; Pereira, C.; Carvalho, A.P.; Pires, J.; Freire, C. Epoxidation of olefins catalyzed by manganese (III) salen complexes grafted to porous heterostructured clays. Appl. Clay Sci. 2011, 53, 195–203. [Google Scholar] [CrossRef]
- Database of Zeolite Structures. Available online: https://europe.iza-structure.org/IZA-SC/framework.php?STC=FAU (accessed on 27 September 2021).
- Gola, A.; Rebours, B.; Milazzo, E.; Lynch, J.; Benazzi, E.; Lacombe, S.; Delevoye, L.; Fernandez, C. Effect of leaching agent in the dealumination of stabilized Y zeolites. Microporous Mesoporous Mater. 2000, 40, 73–83. [Google Scholar] [CrossRef]
- Database of Zeolite Structures. Available online: https://europe.iza-structure.org/IZA-SC/framework.php?STC=MOR (accessed on 15 November 2021).
- Ferey, G.; Mellot-Draznieks, C.; Serre, C.; Millange, F.; Dutour, J.; Surble, S.; Margiolaki, I. A chromium terephthalate-based solid with unusually large pore volumes and surface area. Science 2005, 309, 2040–2042. [Google Scholar] [CrossRef]
- Cavka, J.H.; Jakobsen, S.; Olsbye, U.; Guillou, N.; Lamberti, C.; Bordiga, S.; Lillerud, K.P. A New Zirconium Inorganic Building Brick Forming Metal Organic Frameworks with Exceptional Stability. J. Am. Chem. Soc. 2008, 130, 13850–13851. [Google Scholar] [CrossRef] [PubMed]
- Chui, S.S.Y.; Lo, S.M.F.; Charmant, J.P.H.; Orpen, A.G.; Williams, I.D. A chemically functionalizable nanoporous material [Cu-3(TMA)2(H2O)3]n. Science 1999, 283, 1148–1150. [Google Scholar] [CrossRef] [PubMed]
- Vishnyakov, A.; Ravikovitch, P.I.; Neimark, A.V.; Bulow, M. Nanopore structure and sorption properties of Cu-BTC metal-organic framework. Abstr. Pap. Am. Chem. Soc. 2003, 3, 713–718. [Google Scholar] [CrossRef]
- Loiseau, T.; Serre, C.; Huguenard, C.; Fink, G.; Taulelle, F.; Henry, M.; Bataille, T.; Férey, G. A Rationale for the Large Breathing of the Porous Aluminum Terephthalate (MIL-53) Upon Hydration. Chem. A Eur. J. 2004, 10, 1373–1382. [Google Scholar] [CrossRef]
- Moreira, M.A.; Santos, J.C.; Ferreira, A.F.P.; Müller, U.; Trukhan, N.; Loureiro, J.M.; Rodrigues, A.E. Selective Liquid Phase Adsorption and Separation of ortho-Xylene with the Microporous MIL-53(Al). Sep. Sci. Technol. 2011, 46, 1995–2003. [Google Scholar] [CrossRef]
- Sarkisov, L.; Harrison, A. Computational structure characterisation tools in application to ordered and disordered porous materials. Mol. Simul. 2011, 37, 1248–1257. [Google Scholar] [CrossRef]
- Costa, F.; Fonseca, A.M.; Neves, I.C.; Carvalho, A.P.; Pires, J. Immobilization of hybride tungsten complex in microporous structures. In Materials Science Forum; Trans Tech Publications Ltd.: Freienbach, Switzerland, 2006; Volumes 514–516, ISBN 9780878494026. [Google Scholar]
- Silva, A.R.; Guimarães, V.; Carneiro, L.; Nunes, N.; Borges, S.; Pires, J.; Martins, Â.; Carvalho, A.P. Copper(II) aza-bis(oxazoline) complex immobilized onto ITQ-2 and MCM-22 based materials as heterogeneous catalysts for the cyclopropanation of styrene. Microporous Mesoporous Mater. 2013, 179, 231–241. [Google Scholar] [CrossRef] [Green Version]
- Bolm, C. Vanadium-catalyzed asymmetric oxidations. Coord. Chem. Rev. 2003, 237, 245–256. [Google Scholar] [CrossRef]

| Standard Material | → | Microporous Volume (cm3 g−1) | ∆max (%) (a) | ∆max for t (%) (b) | |||
|---|---|---|---|---|---|---|---|
| Universal t-Curve | Carbon | Hydroxylated Silica | Char | ||||
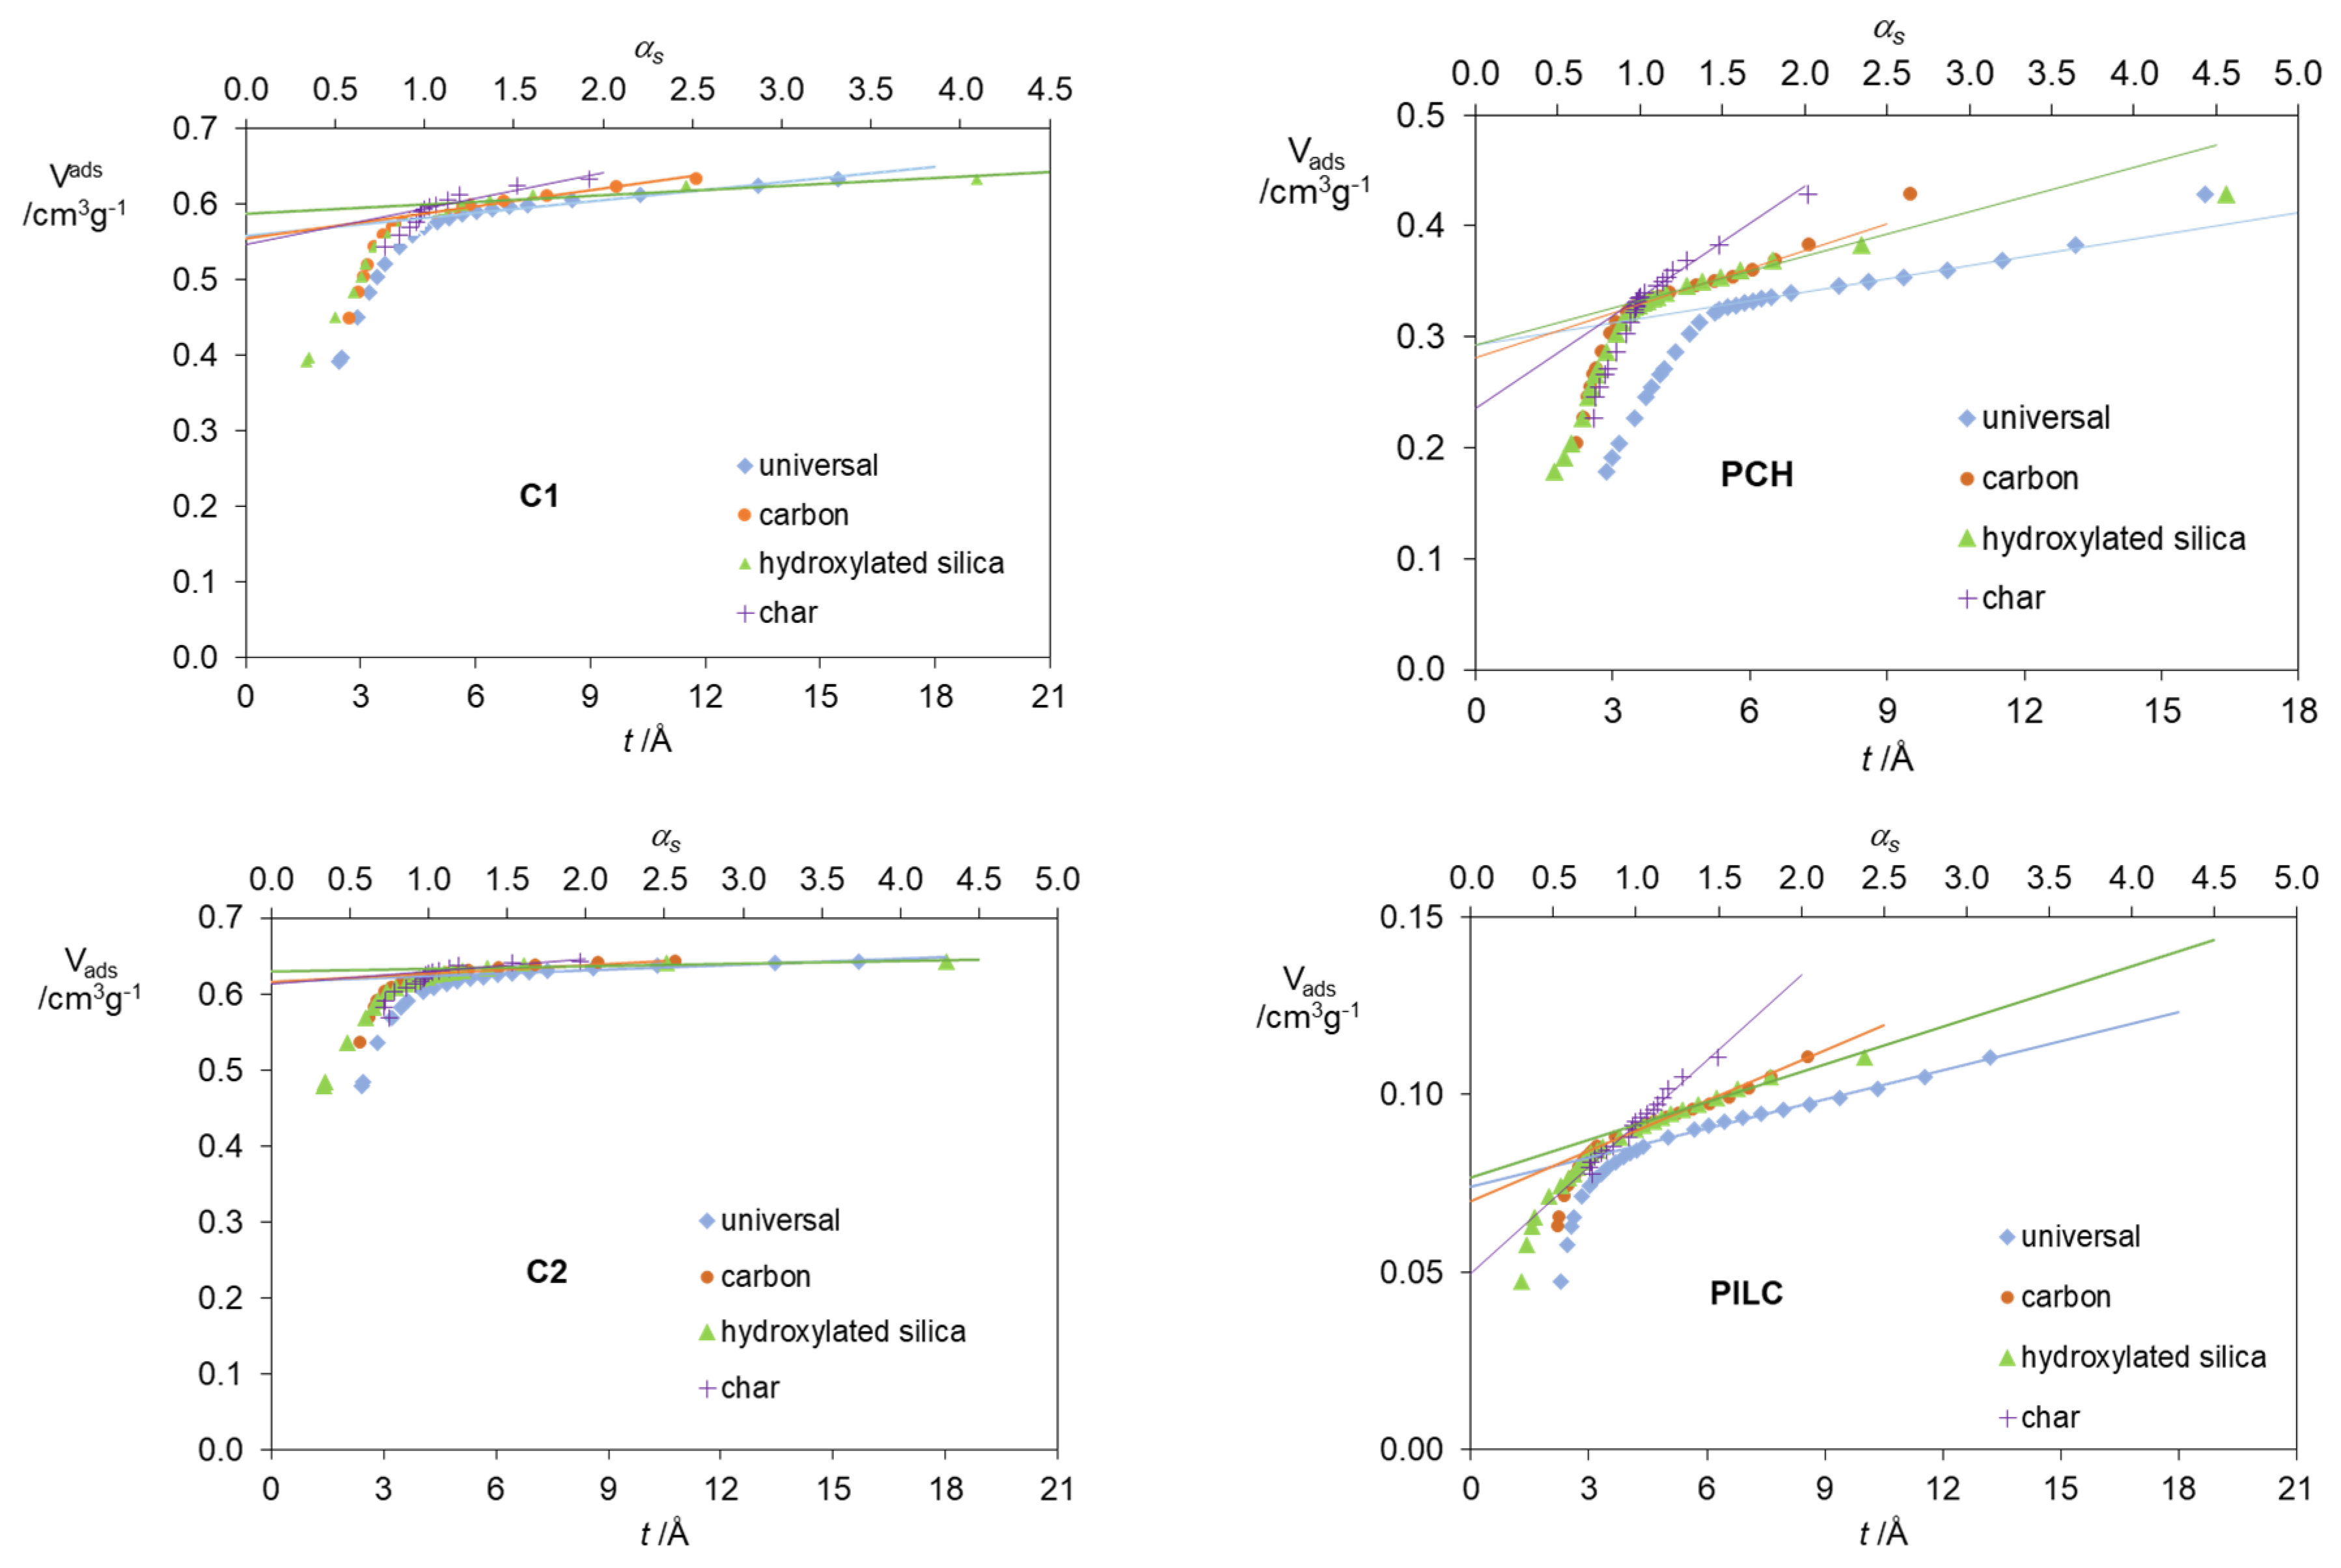
| Carbon materials | C1 | 0.615 | 0.615 | 0.630 | 0.613 | 2.7 | 0.3 |
| C2 | 0.559 | 0.554 | 0.538 | 0.547 | 1.7 | 2.1 | |
| C3 | 0.455 | 0.466 | 0.574 | 0.558 | 22.6 | 26.2 | |
| Clay materials | PCH | 0.292 | 0.281 | 0.293 | 0.235 | 19.8 | 19.5 |
| PILC | 0.074 | 0.07 | 0.077 | 0.05 | 35.1 | 32.4 | |
| Clay | 0.007 | 0.006 | 0.004 | - | - | - | |
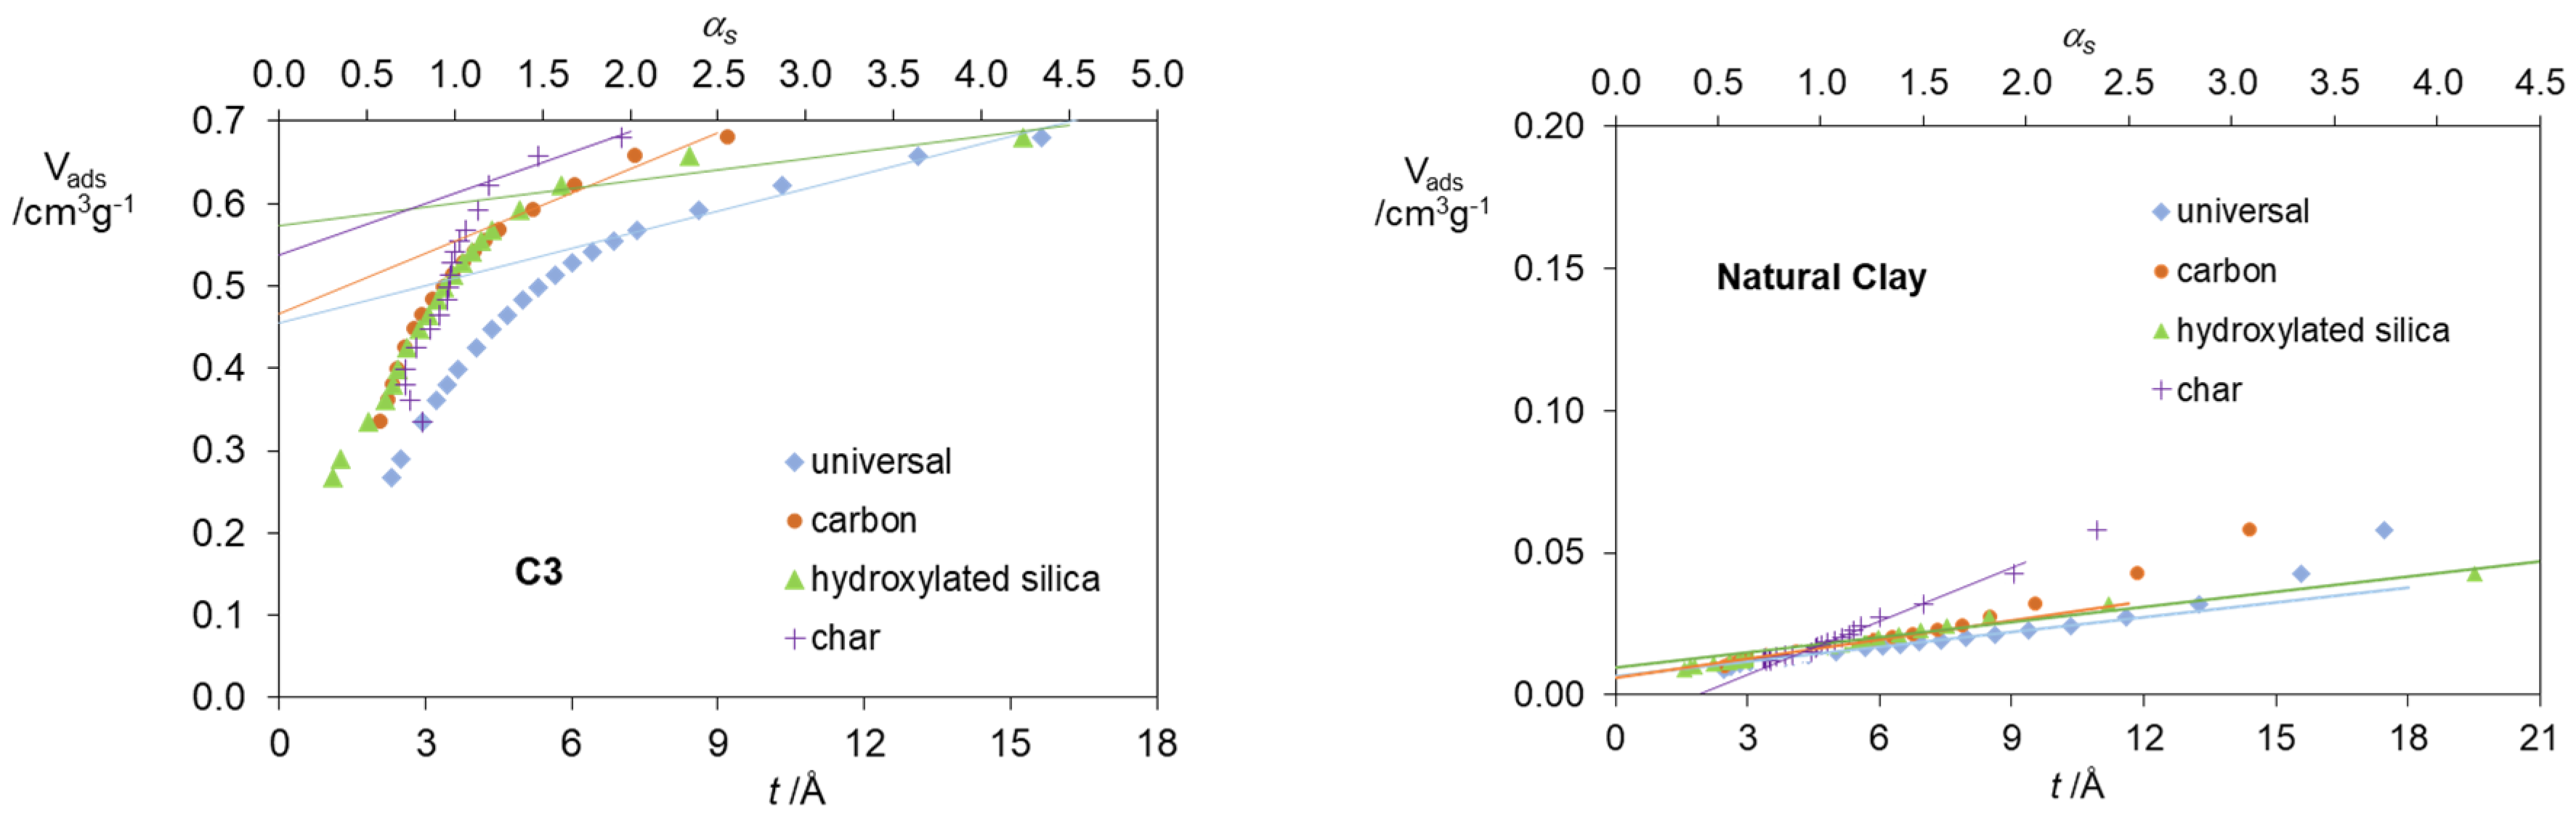
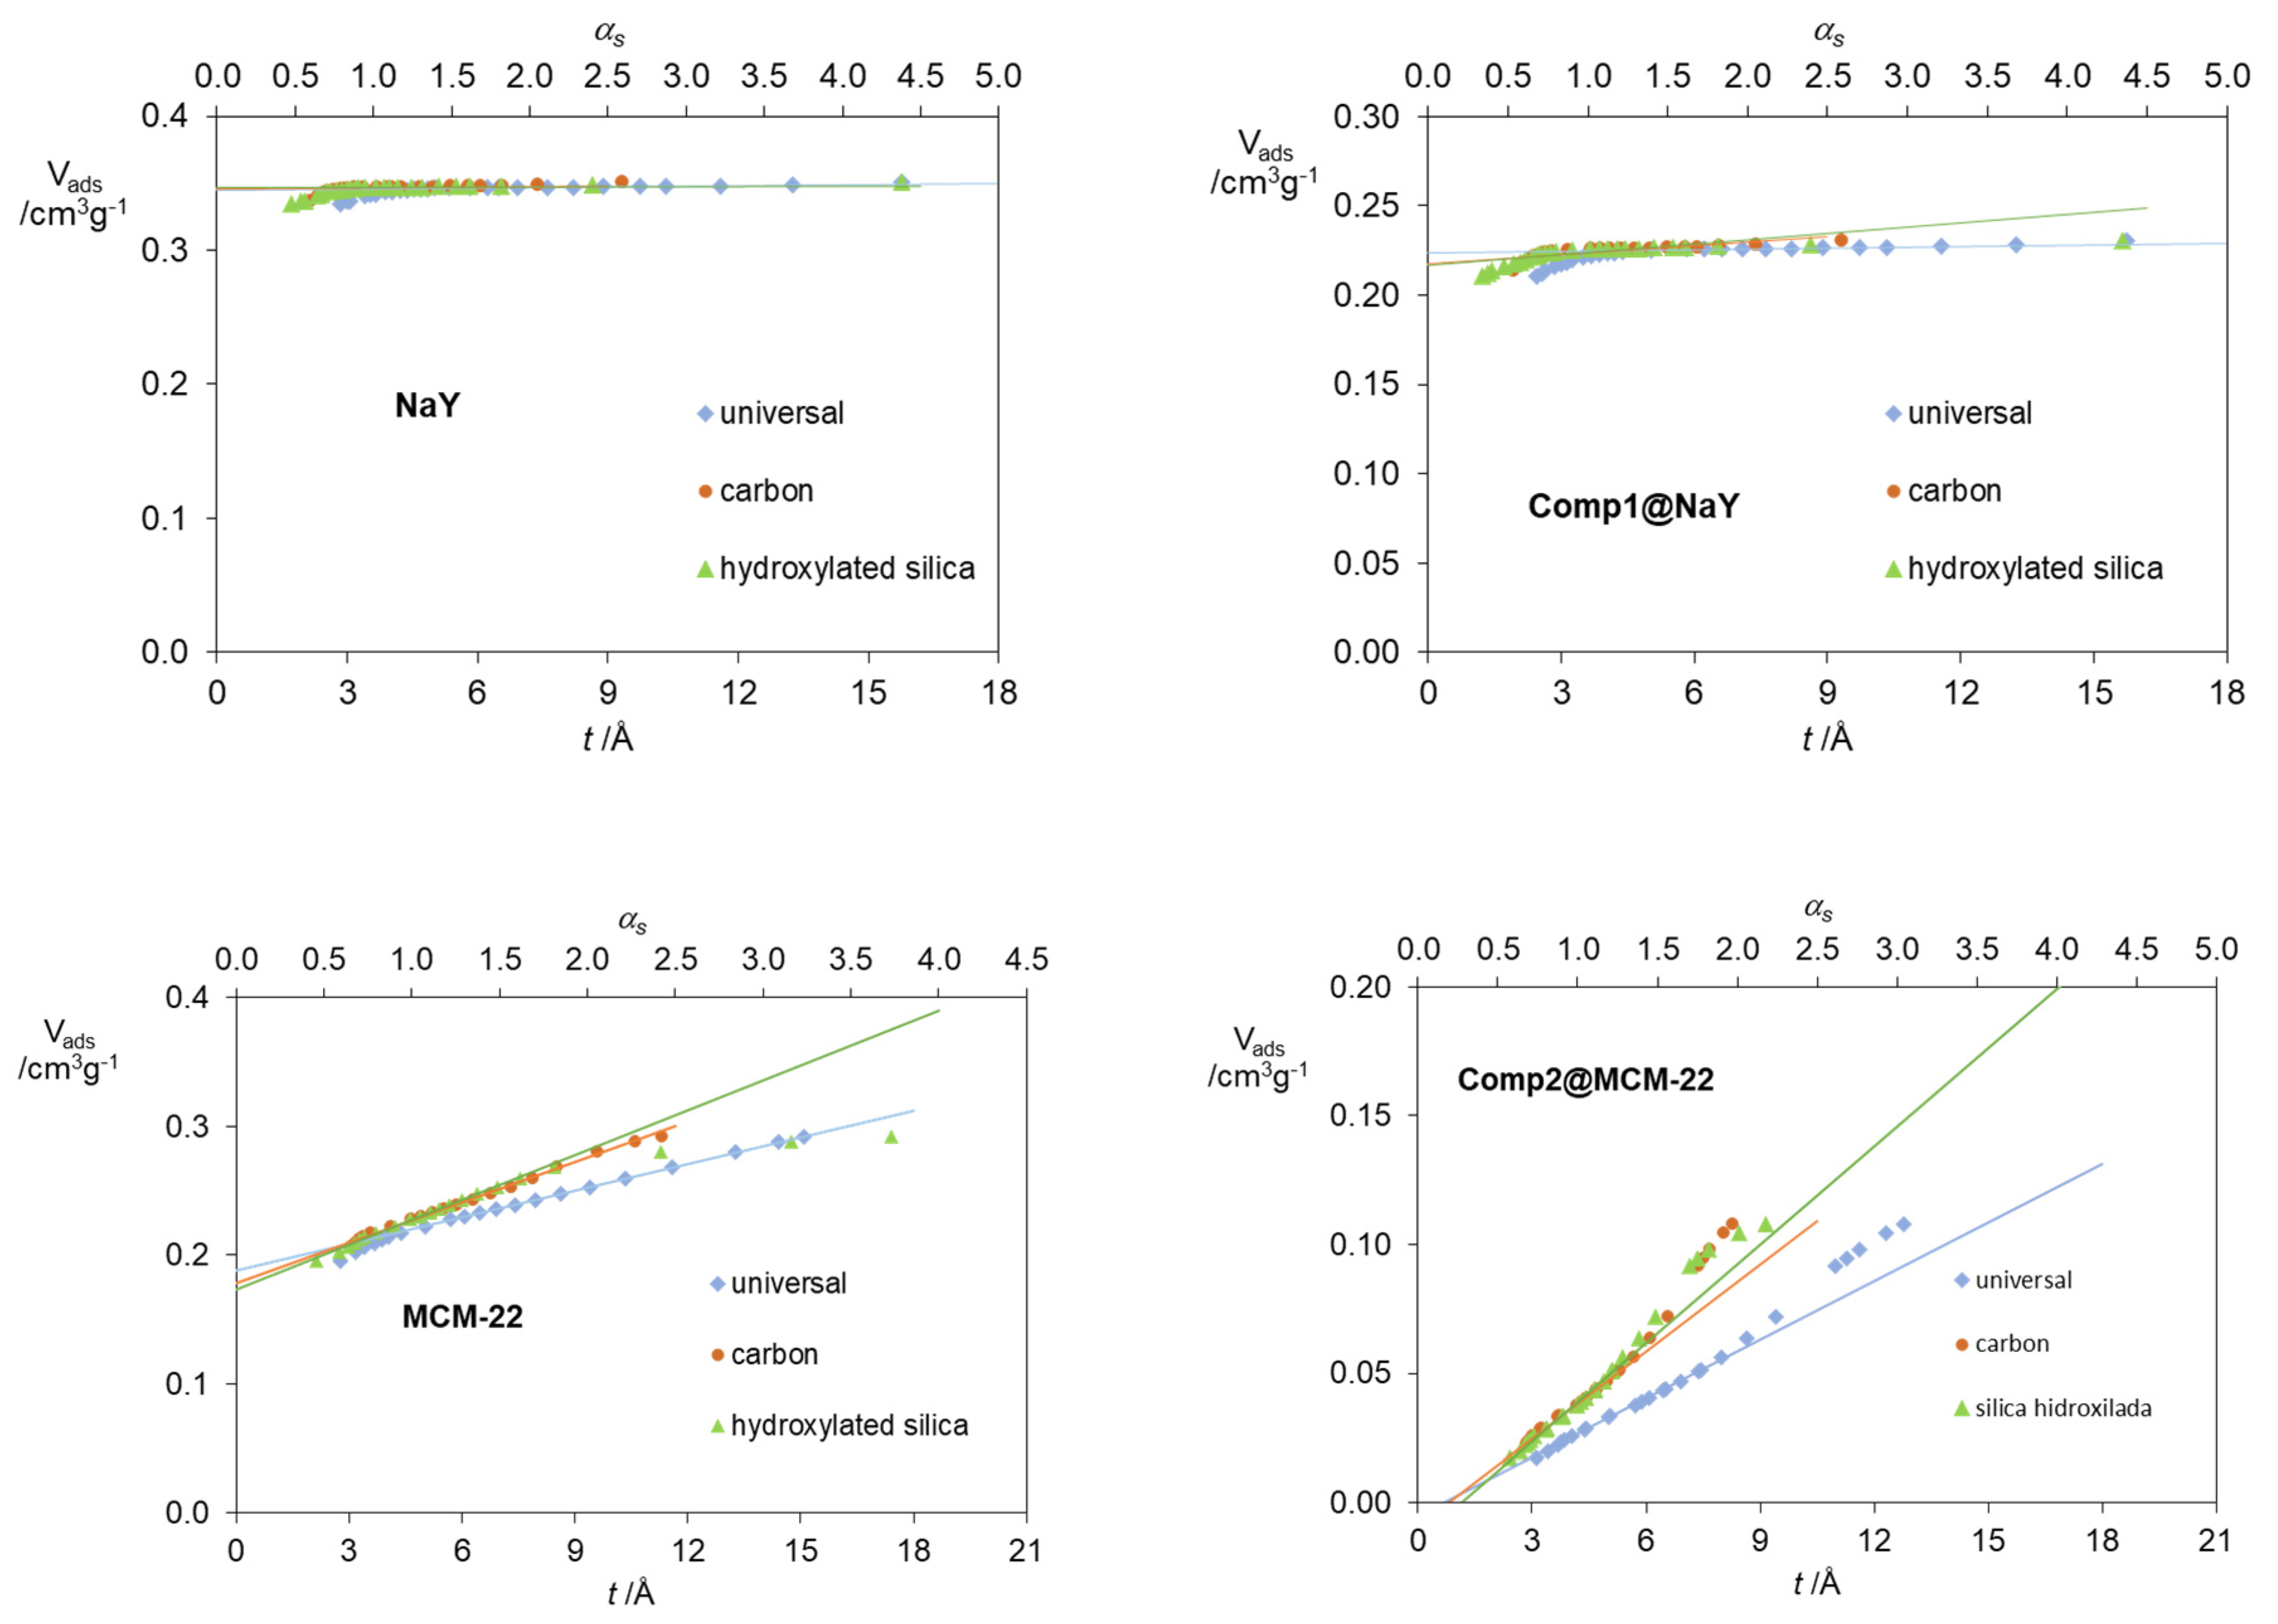
| Zeolites | NaY | 0.345 | 0.346 | 0.347 | 0.348 | 0.9 | 0.9 |
| Mordenite | 0.213 | 0.211 | 0.216 | 0.206 | 4.6 | 3.3 | |
| ETS-10 | 0.141 | 0.138 | 0.153 | 0.130 | 15.0 | 7.8 | |
| Self-Steamed | 0.163 | 0.159 | 0.155 | 0.161 | 4.9 | 4.9 | |
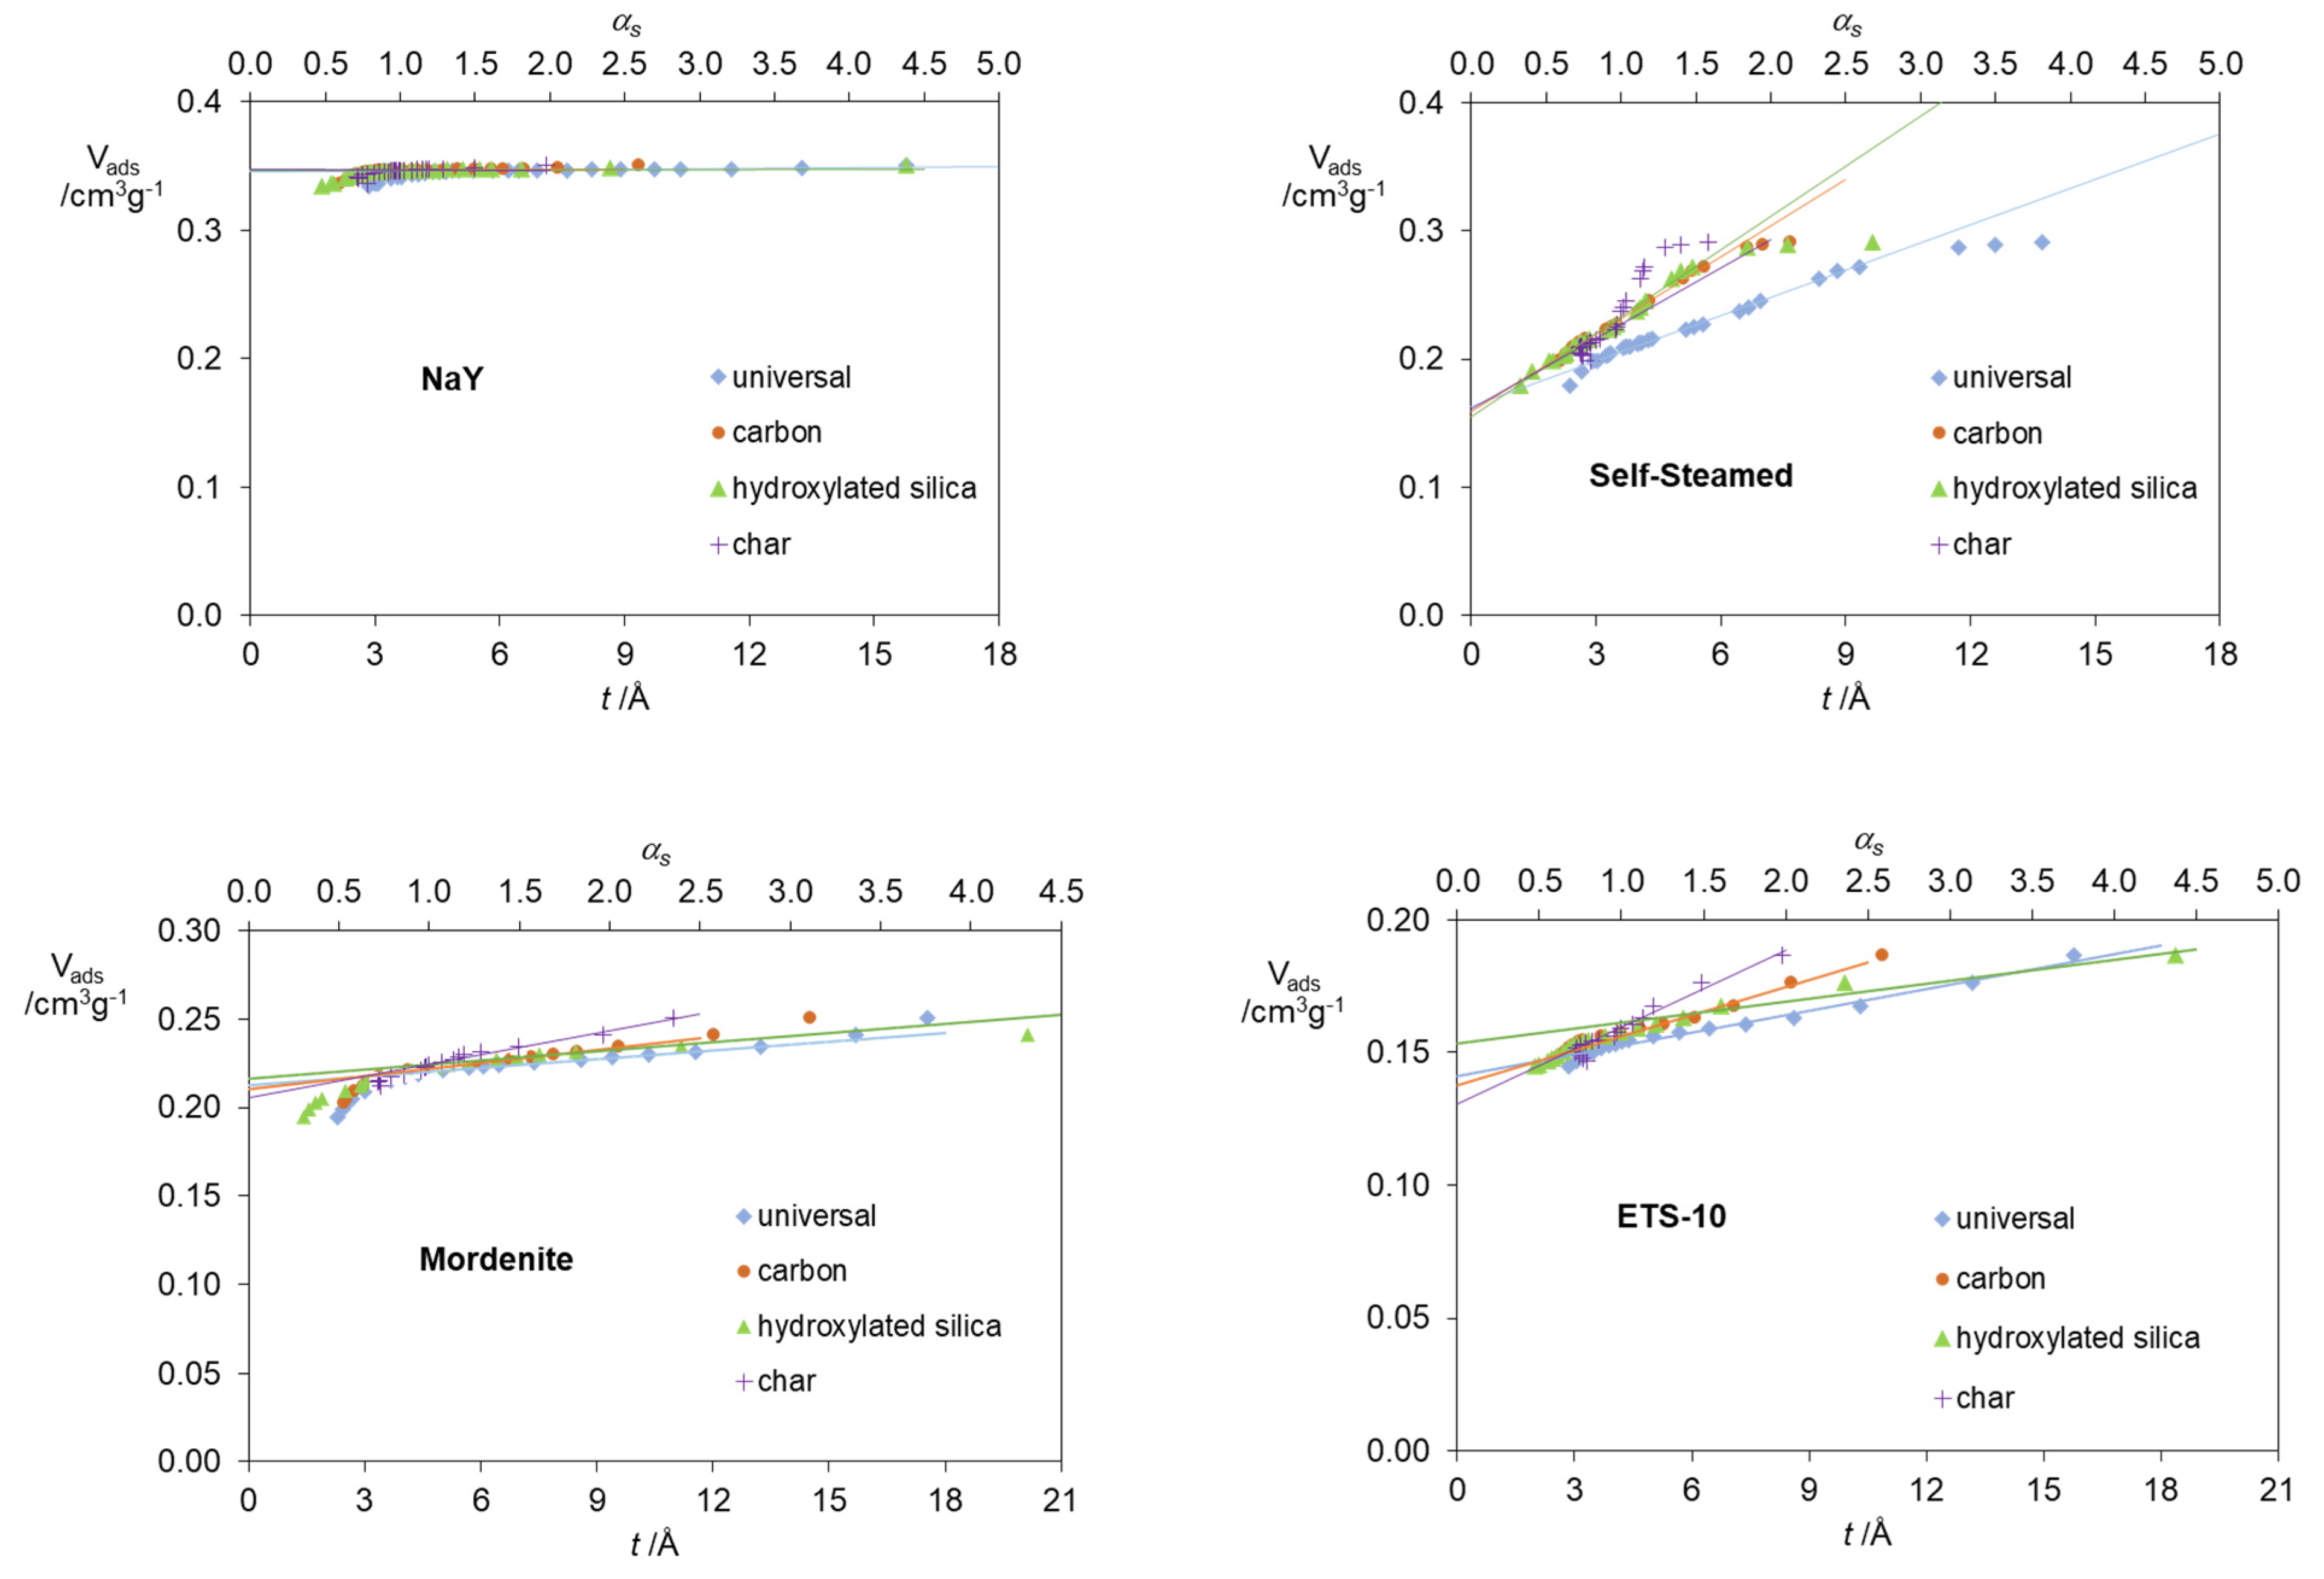
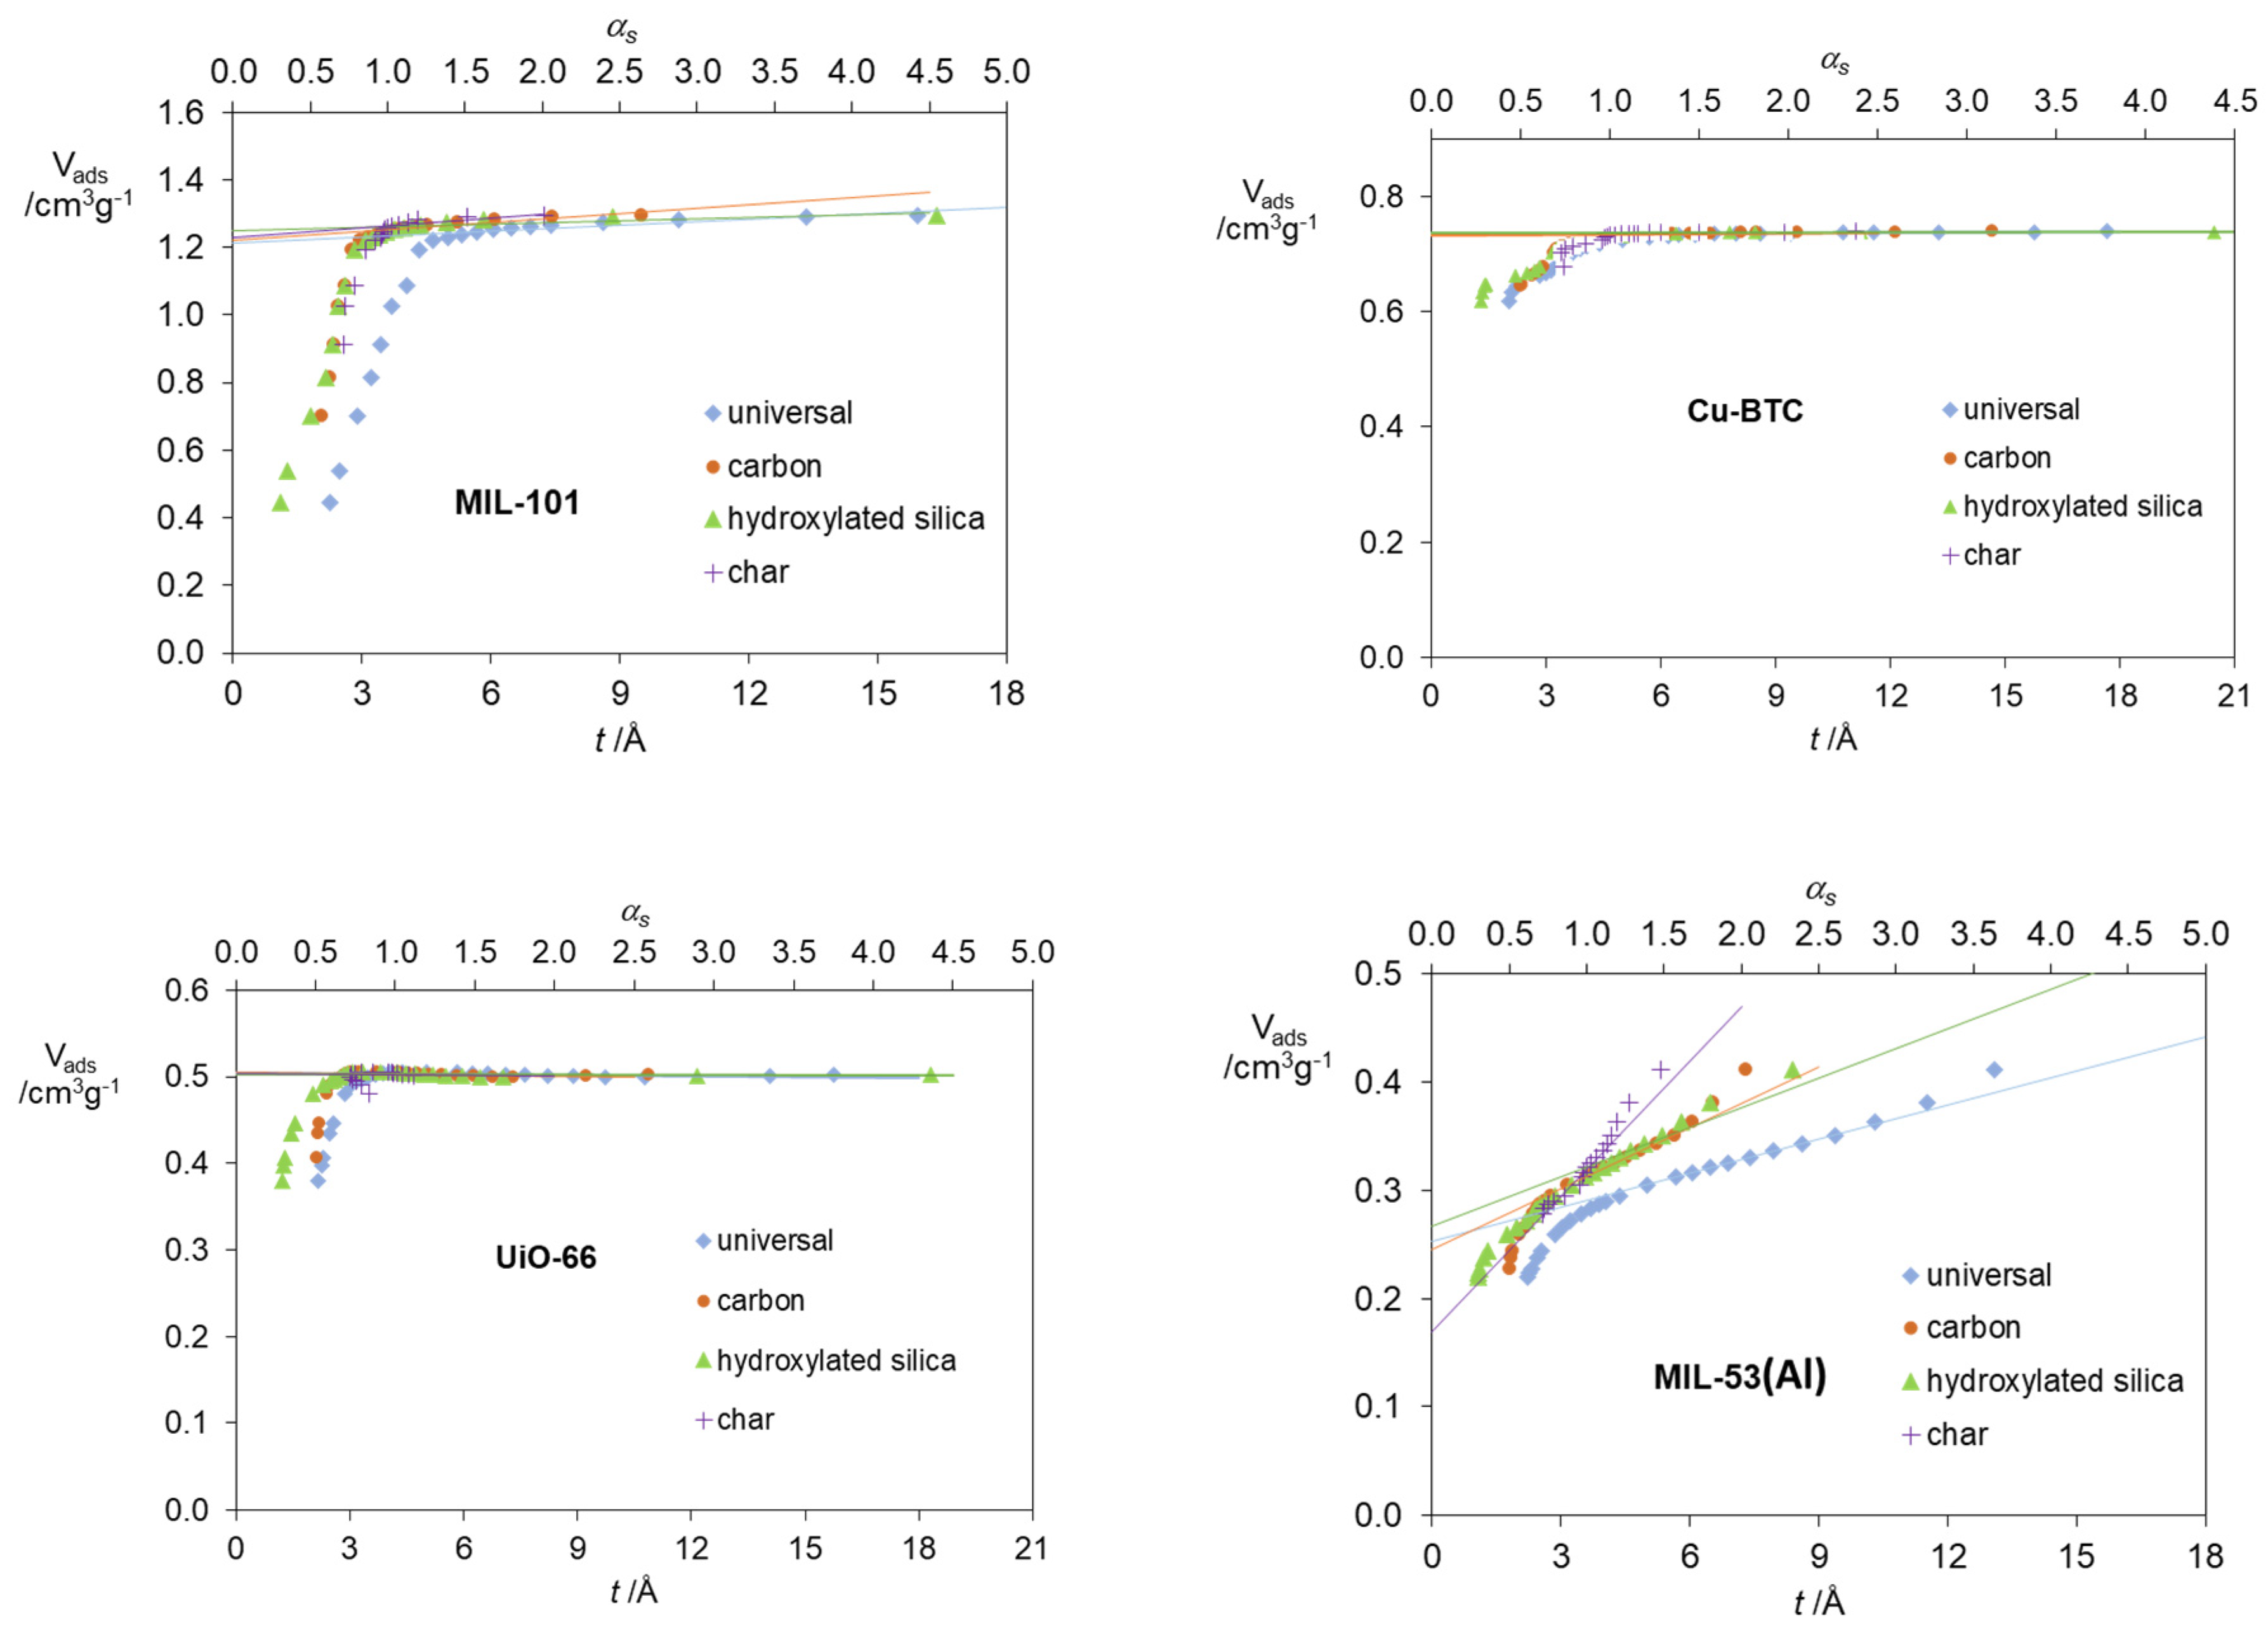
| MOFs | Cu-BTC | 0.734 | 0.733 | 0.736 | 0.734 | 0.1 | 0.1 |
| UiO-66 | 0.505 | 0.505 | 0.503 | 0.504 | 0.4 | 0.4 | |
| MIL-53(Al) | 0.252 | 0.245 | 0.267 | 0.169 | 36.7 | 32.9 | |
| MIL-101 | 1.212 | 1.220 | 1.248 | 1.23 | 2.9 | −3.0 | |
| Standard Material | → | Microporous Volume (cm3 g−1) | ∆ for t (%) (Carbon) (a) | ∆ for t (%) (Hyd. Silica) (b) | ||
|---|---|---|---|---|---|---|
| Universal t-Curve | Carbon | Hydroxylated Silica | ||||
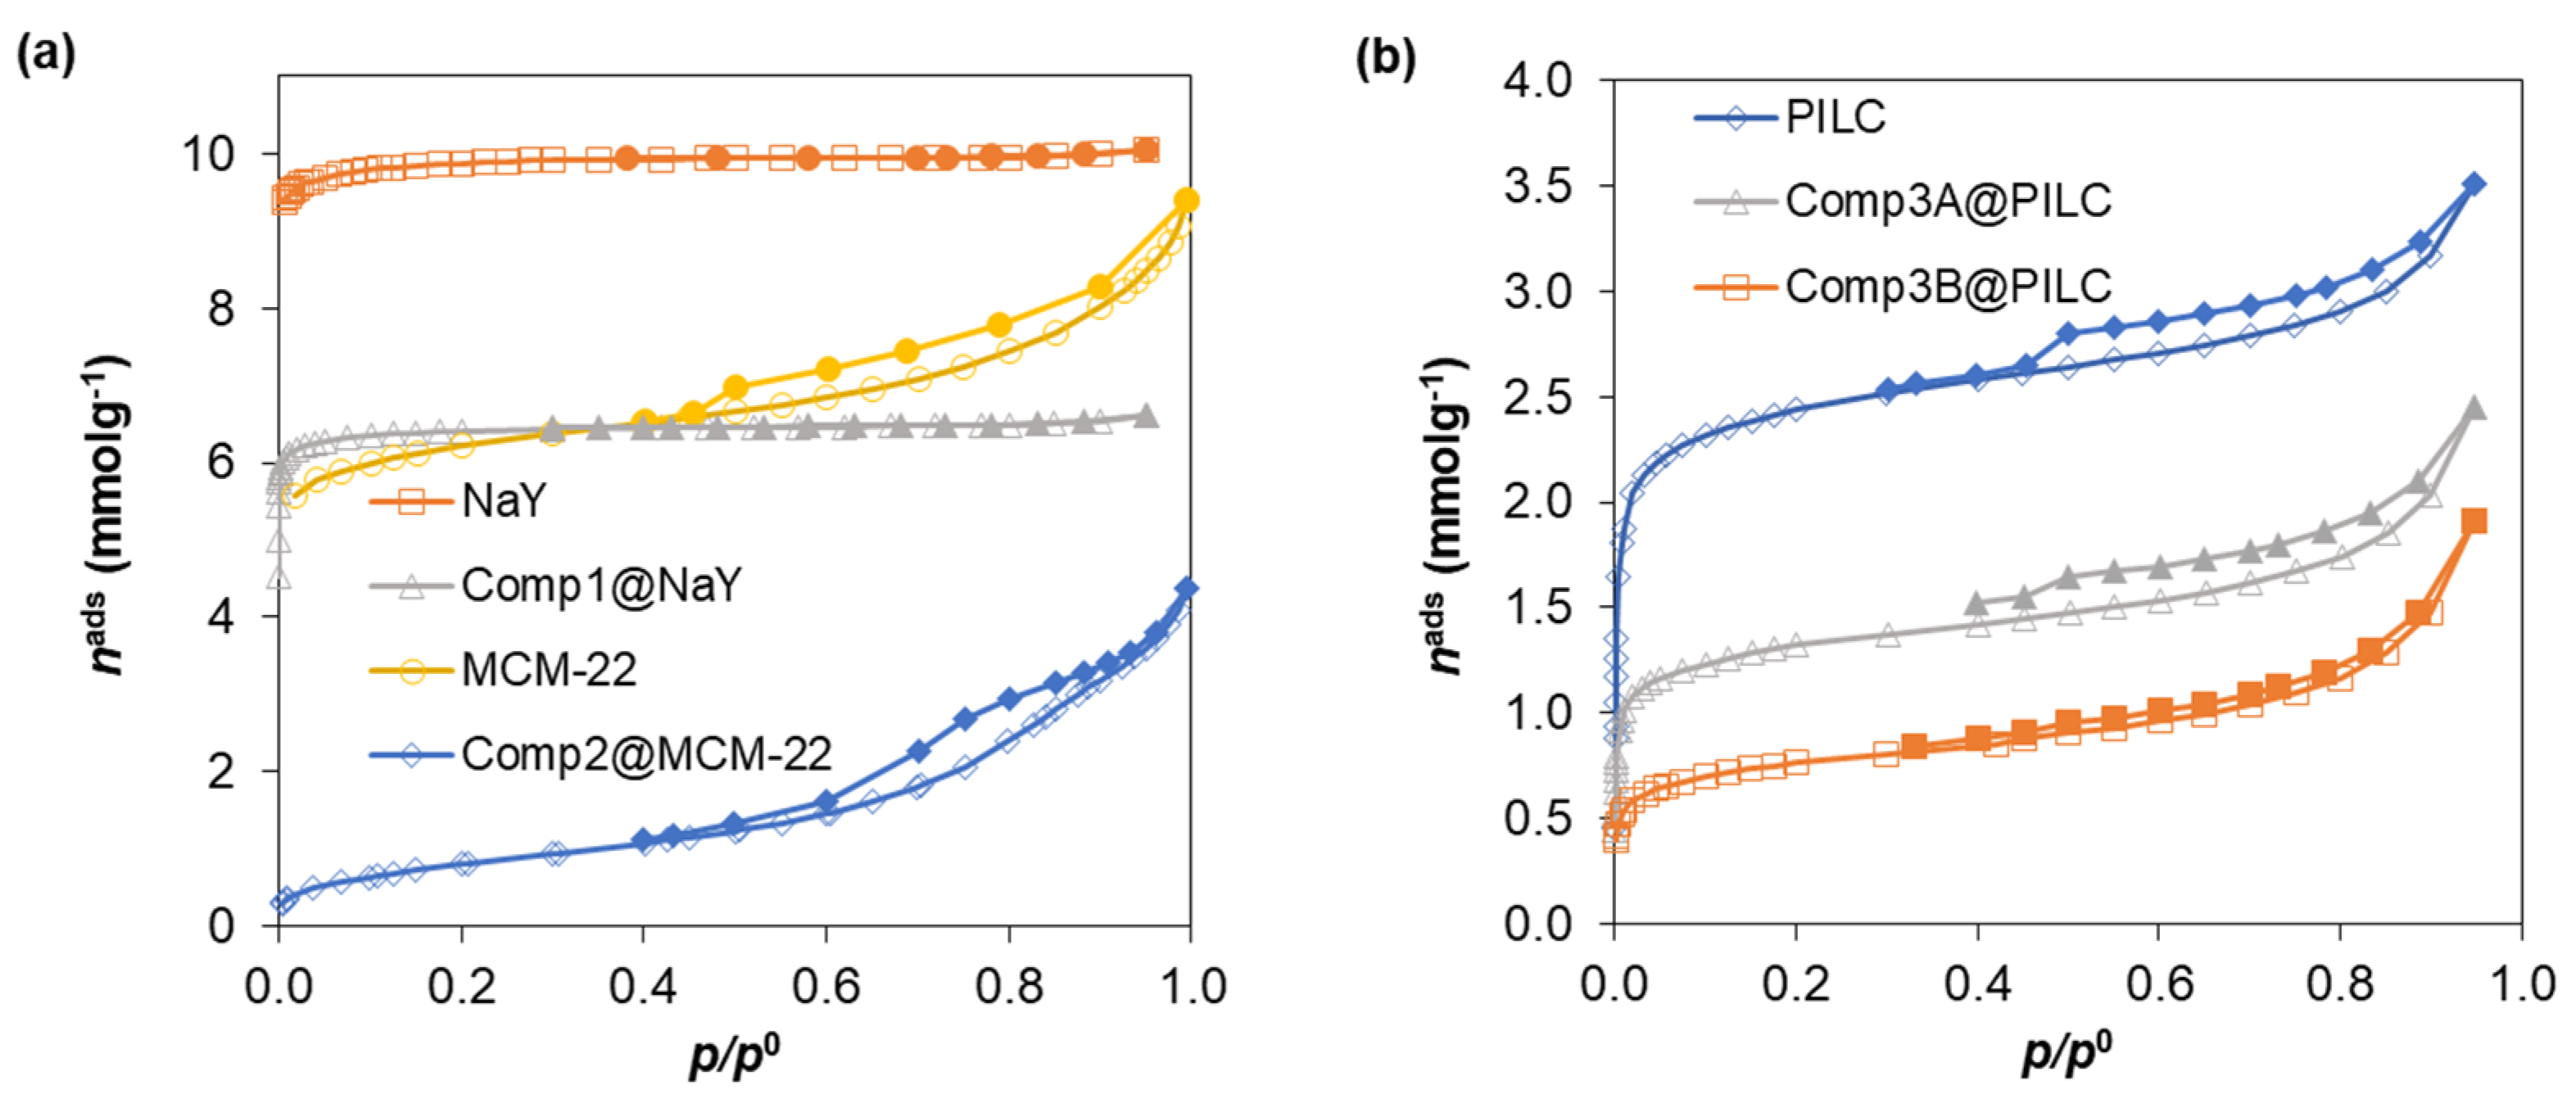
| Zeolites | NaY | 0.345 | 0.346 | 0.347 | 0.3 | 0.6 |
| Comp1@NaY | 0.224 | 0.218 | 0.216 | 2.7 | 3.6 | |
| MCM-22 | 0.188 | 0.178 | 0.173 | 5.3 | 8.0 | |
| Comp2@MCM-22 | 0 | 0 | 0 | 0 | 0 | |
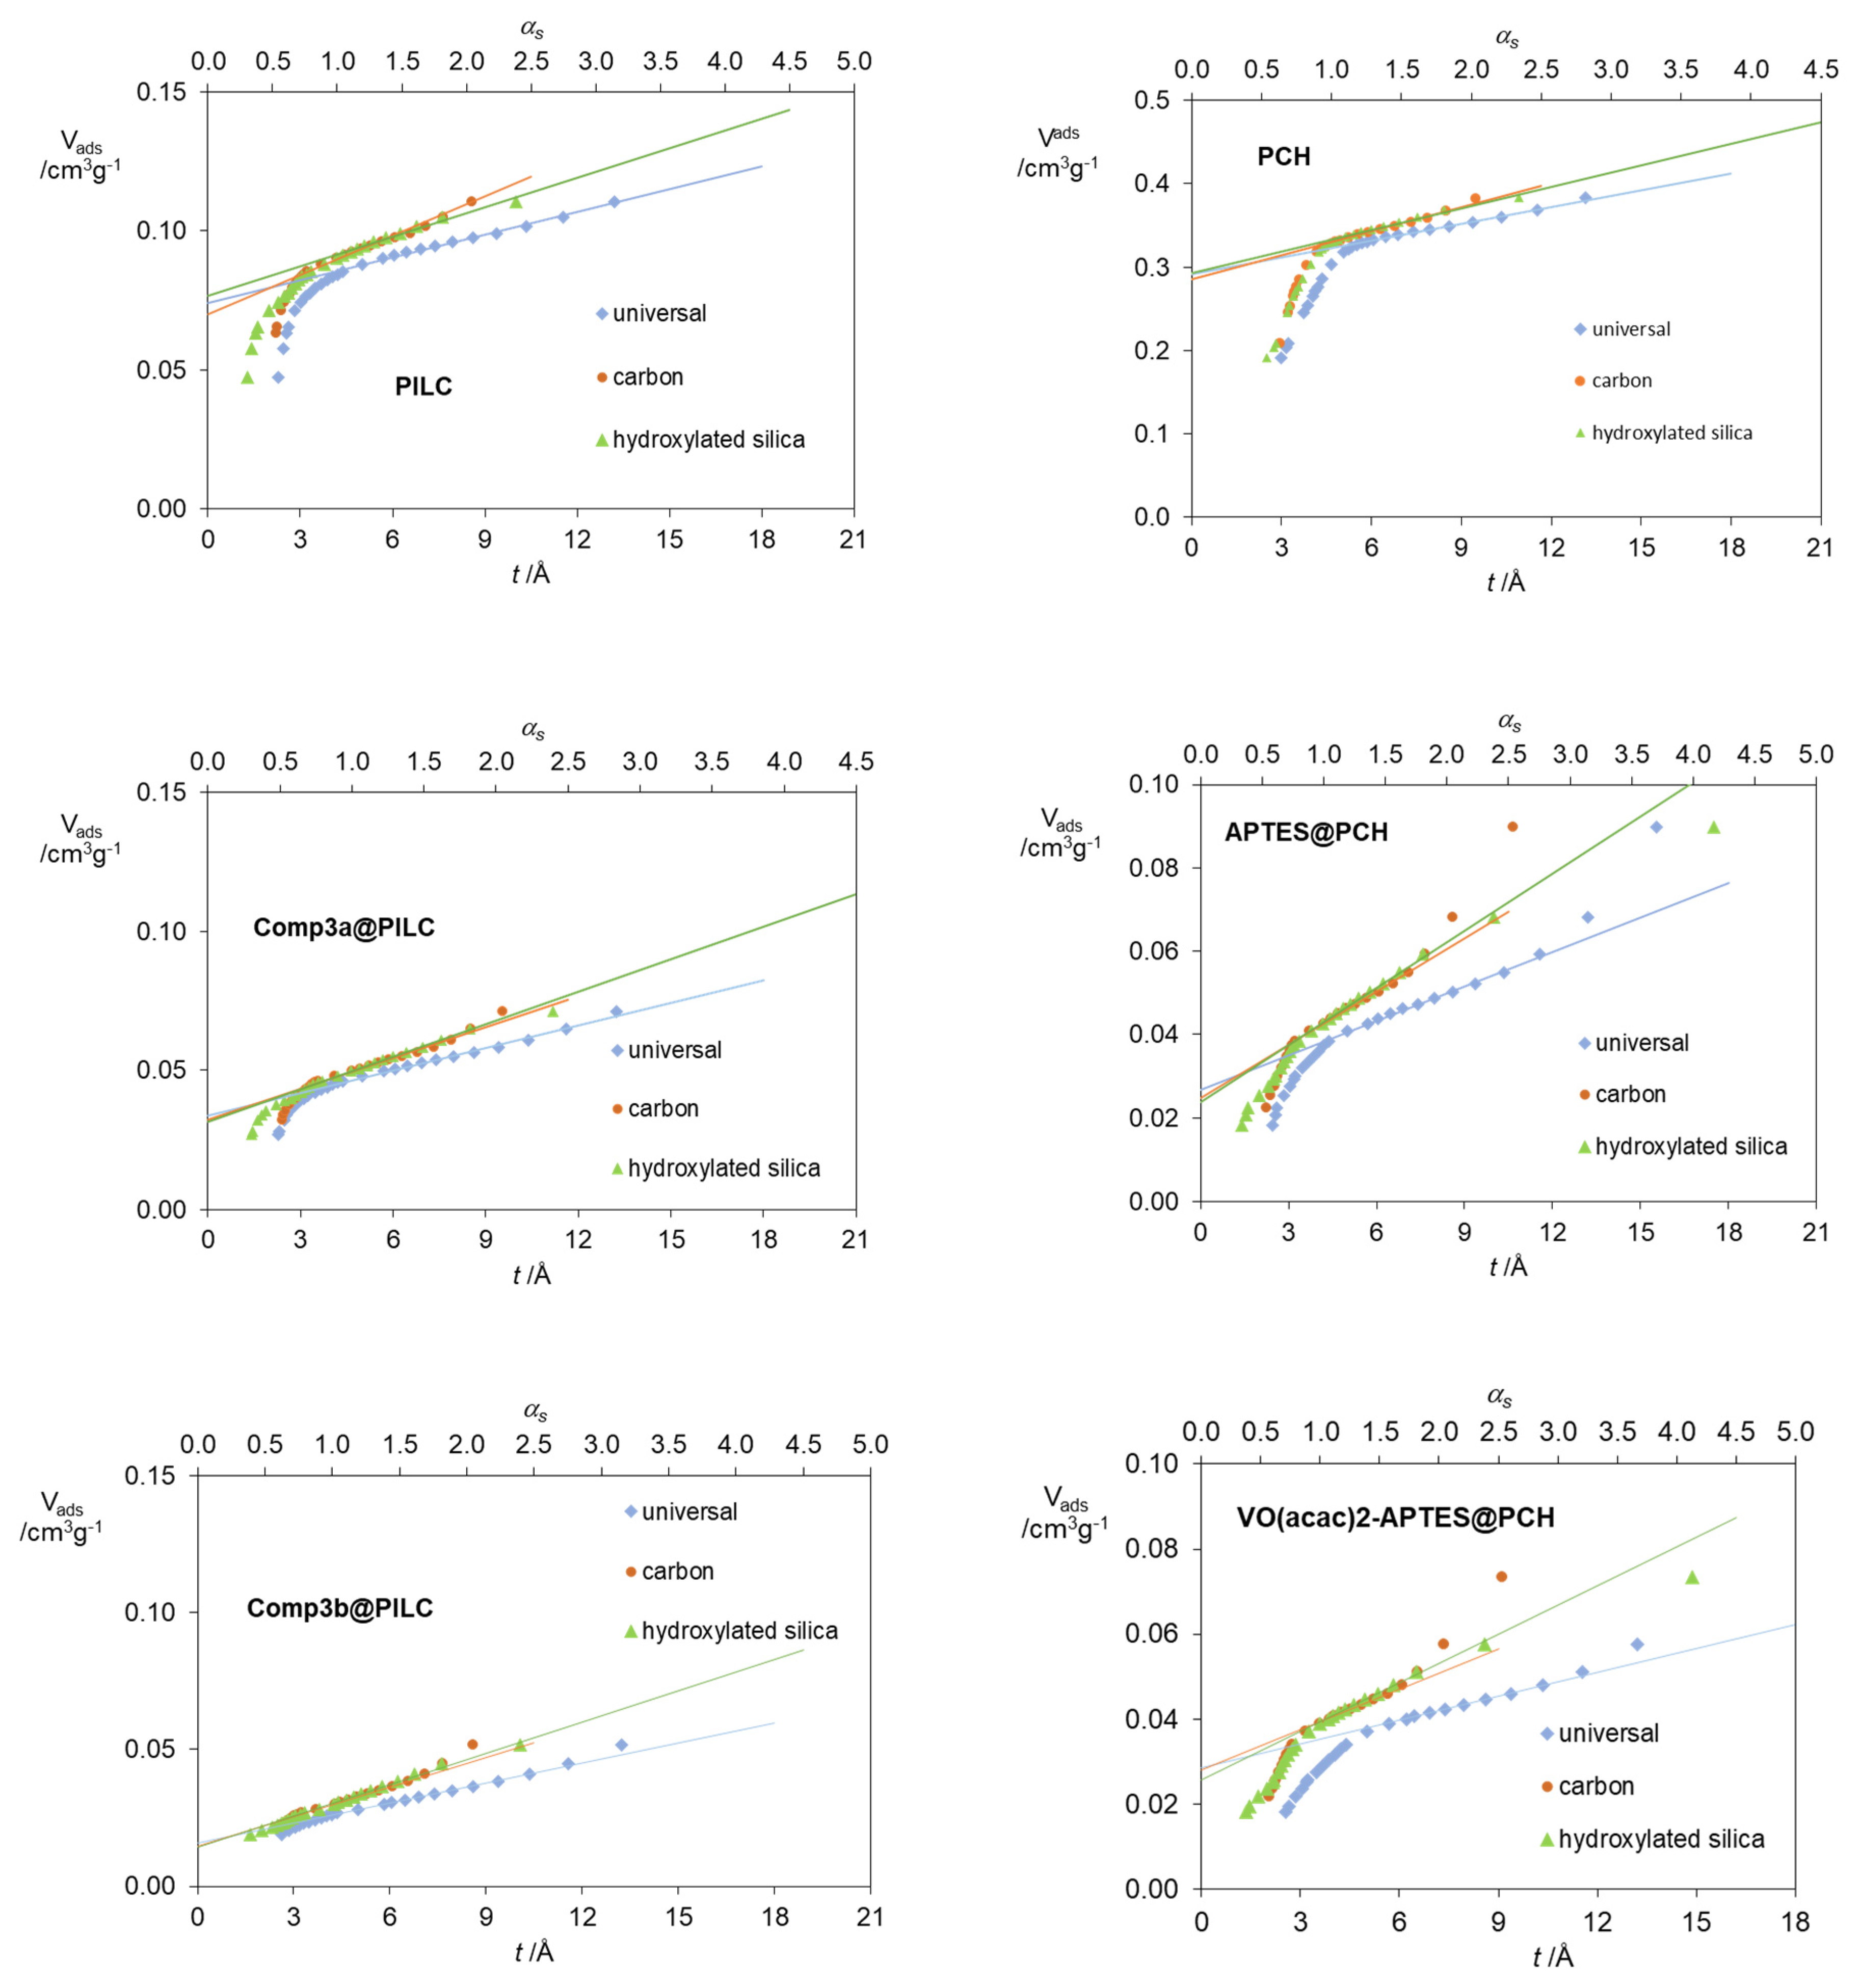
| PILCs | PILC | 0.074 | 0.07 | 0.077 | 5.4 | 4.1 |
| Comp3a@PILC | 0.034 | 0.032 | 0.032 | 5.9 | 5.9 | |
| Comp3b@PILC | 0.016 | 0.015 | 0.014 | 6.3 | 12.5 | |
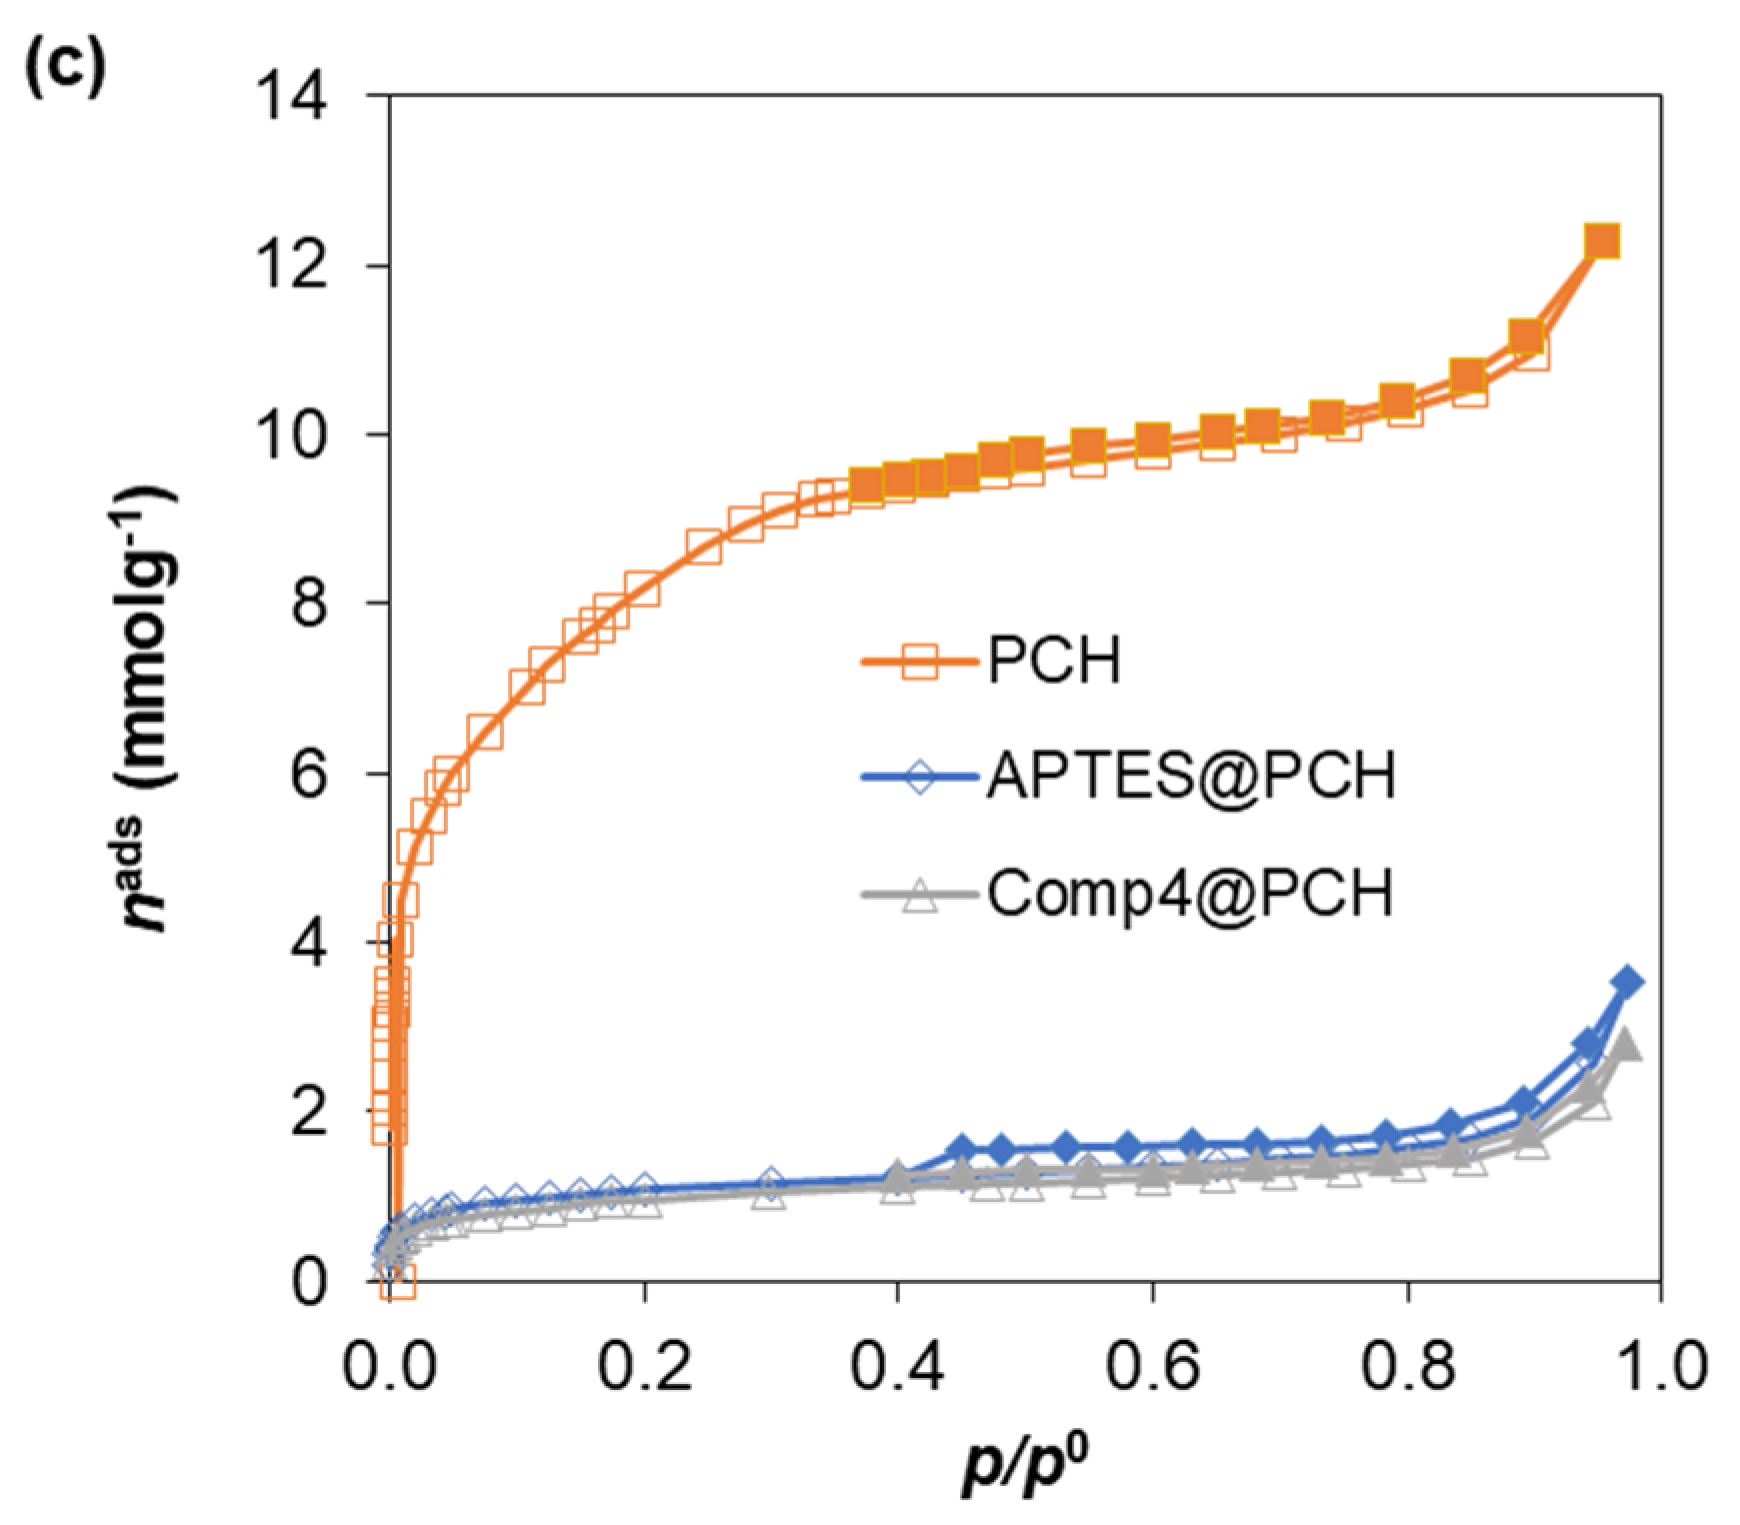
| PCHs | PCH | 0.292 | 0.281 | 0.293 | 3.8 | 0.3 |
| APTES@PCH | 0.027 | 0.026 | 0.024 | 3.7 | 11.1 | |
| Comp4@PCH | 0.028 | 0.028 | 0.026 | 0.0 | 10.7 | |
Publisher’s Note: MDPI stays neutral with regard to jurisdictional claims in published maps and institutional affiliations. |
© 2021 by the authors. Licensee MDPI, Basel, Switzerland. This article is an open access article distributed under the terms and conditions of the Creative Commons Attribution (CC BY) license (https://creativecommons.org/licenses/by/4.0/).
Share and Cite
Pires, J.; Fernandes, R.; Pinto, M.L.; Batista, M. Microporous Volumes from Nitrogen Adsorption at 77 K: When to Use a Different Standard Isotherm? Catalysts 2021, 11, 1544. https://doi.org/10.3390/catal11121544
Pires J, Fernandes R, Pinto ML, Batista M. Microporous Volumes from Nitrogen Adsorption at 77 K: When to Use a Different Standard Isotherm? Catalysts. 2021; 11(12):1544. https://doi.org/10.3390/catal11121544
Chicago/Turabian StylePires, João, Rafaela Fernandes, Moisés L. Pinto, and Mary Batista. 2021. "Microporous Volumes from Nitrogen Adsorption at 77 K: When to Use a Different Standard Isotherm?" Catalysts 11, no. 12: 1544. https://doi.org/10.3390/catal11121544
APA StylePires, J., Fernandes, R., Pinto, M. L., & Batista, M. (2021). Microporous Volumes from Nitrogen Adsorption at 77 K: When to Use a Different Standard Isotherm? Catalysts, 11(12), 1544. https://doi.org/10.3390/catal11121544