Article

Dynamics of Reactive Oxygen Species on Cobalt-Containing Spinel Oxides in Cyclic CO Oxidation

1
Faculty for Chemistry, Inorganic Chemistry, University of Duisburg-Essen, 45141 Essen, Germany
2
Max-Planck-Institut für Kohlenforschung, Kaiser-Wilhelm Platz 1, 45470 Mülheim an der Ruhr, Germany
3
Institute of Inorganic Chemistry, Christian-Albrechts-Universität zu Kiel, Max-Eyth-Straße 2, 24118 Kiel, Germany
4
CENIDE, Center for Nanointegration, University of Duisburg-Essen, 47057 Duisburg, Germany
*
Author to whom correspondence should be addressed.
Catalysts 2021, 11(11), 1312; https://doi.org/10.3390/catal11111312
Submission received: 29 September 2021 / Revised: 22 October 2021 / Accepted: 25 October 2021 / Published: 29 October 2021
(This article belongs to the Special Issue Surface Design of Metal Oxide Catalysts)

Abstract

:
Reactive oxygen species (ROS) are considered to be responsible for the high catalytic activity of transition metal oxides like Co3-xFexO4 in oxidation reactions, but the detailed influences of catalyst composition and morphology on the formation of these reactive oxygen species are not fully understood. In the presented study, Co3O4 spinels of different mesostructures, i.e., particle size, crystallinity, and specific surface area, are characterized by powder X-ray diffraction, scanning electron microscopy, and physisorption. The materials were tested in CO oxidation performed in consecutive runs and compared to a Co3-xFexO4 composition series with a similar mesostructure to study the effects of catalyst morphology and composition on ROS formation. In the first run, the CO conversion was observed to be dominated by the exposed surface area for the pure Co-spinels, while a negative effect of Fe content in the spinels was seen. In the following oxidation run, a U-shaped conversion curve was observed for materials with high surface area, which indicated the in situ formation of ROS on those materials that were responsible for the new activity at low temperature. This activation was not stable at the higher reaction temperature but was confirmed after temperature-programmed oxidation (TPO). However, no activation after the first run was observed for low-surface-area and highly crystalline materials, and the lowest surface-area material was not even activated after TPO. Among the catalyst series studied here, a correlation of small particle size and large surface area with the ability for ROS formation is presented, and the benefit of a nanoscaled catalyst is discussed. Despite the generally negative effect of Fe, the highest relative activation was observed at intermediate Fe contents suggesting that Fe may be involved in ROS formation.

Graphical Abstract

1. Introduction

The oxidation of CO is an important model and probe reaction used to investigate oxidation catalysis, particularly for exhaust treatments. For this reaction, Co-based spinel catalysts like Co3O4 and CoFe2O4 have shown high activity even at temperatures as low as −80 °C [1,2,3,4,5]. The oxidation reaction on Co3O4 catalysts has been extensively studied, and several possible reasons for the high activity of this specific spinel-based catalyst are mentioned in the literature.
There are reports on the importance of reactive oxygen species (ROS) and on an important role of vacancies on the surface of catalysts [3]. However, the generation and role of ROS are not fully understood yet, especially for mixed oxides containing more than one metal cation, such as Co and Fe. Several studies have been performed attempting to unravel the role of ROS in oxidation reactions on Co containing catalysts. In studies from the 1990s, oxidized Co3O4 is labeled as Co3O4+x containing excess oxygen as oxide species (O2−) and excluding adsorbed species such as dioxygen (O2), superoxo (O2), and peroxide (O22−) [6,7,8,9]. The activity was explained by nucleophilic lattice oxygen and activity loss over time by surface reduction from Co3+ to Co2+ [6,7,8,9]. Zasada et al. reported the reactivity of the diatomic superoxo and peroxo ROS on predominantly (100) terminated Co3O4 below 160 °C and monoatomic O species between 160 °C and 300 °C by hydrogen oxidation on Co3O4 [10]. In addition, the involvement of superoxo and peroxo species on the surface was proposed by density functional theory (DFT) for temperatures below 350 °C [10]. Further work by Zasada et al. showed higher activity of adsorbed suprafacial oxygen atoms than interfacial surface oxygen in methane oxidation [11]. Another study by Zasada et al. indicated CO being primarily oxidized by suprafacial diatomic oxygen adsorbed between threefold coordinated Co3+ and threefold coordinated Co2+ and/or monooxygen adsorbed on a threefold coordinated Co3+ center on Co3O4(111) [12]. A recent study by Liu et al. on Co3O4(100) thin films in the low-temperature CO oxidation revealed that the activated oxygen desorbs from oxidized surfaces below 120 K and below 270 K from pre-reduced surfaces, while superoxide/superoxo species do not re-oxidize the reduced surfaces [13]. In addition, the role of oxygen vacancies was critical, as the vacancies promote the formation of superoxo (O2) species that are highly active in CO oxidation [13].
Other possible reasons for the high activity of Co3O4 in CO oxidation apart from the formation of ROS are presented in the literature, such as the exposed planes. In this regard, contradictory information is given for the active facets. For example, Xie et al. reported that (110) planes on nanorods, which are rich in Co3+ sites, are the active facets [2]. Teng et al. showed that the (111) termination, which is rich in Co2+ sites, is more active [14]. Octahedrally coordinated Co2+ can easily be oxidized to Co3+ on the surface, which is reported for several spinel oxides, and it is considered to be the reason for the catalytic activity of Co2+ containing materials like CoFe2O4 [15]. For Co3O4 in 2-propanol oxidation, a correlation of activity loss and reduction from Co3+ to Co2+ was shown by Anke et al., which can corroborate the higher activity of Co3+ in CO oxidation [16].
In terms of mechanisms in gas-phase catalysis, mainly the reaction of adsorbed species in the Langmuir-Hinshelwood (LH) and the Mars-van-Krevelen (MvK) mechanisms involving oxidation by lattice oxygen and subsequent filling of oxygen vacancies by gas-phase oxygen are discussed. A recent study by Lukashuk et al. indicated a complex reaction network consisting of several reaction pathways, including dissociation of CO followed by carbon oxidation to CO2 [17]. They indicated the presence of the MvK mechanism at temperatures above 100 °C and could not exclude LH at low temperatures [17].
Catalytic oxidation in several temperature cycles is frequently used in the literature to show catalyst stability [18,19]. However, some studies indicated further effects of either pretreatment or subsequently performed catalytic runs. After pre-treating Co3O4 and CoO reductively with H2 prior to CO oxidation, an activity increase was found under oxidizing conditions (1% CO, 20% O2) for both types of oxides in consecutive runs up to 200 °C, which showed the restorability of Co3+ on the surface at temperatures even below 200 °C [15]. A study on Co3O4/Al2O3 confirmed the results, a beneficial effect of a consecutive pretreatment with H2 at 300 °C and O2 at 250 °C has been observed and correlated to an increasing number of Co3+ on the surface and decreasing crystallite size. Additionally, an activation for the second of two consecutive runs has been reported [20]. Another paper reported improved catalyst recovery for regeneration in 10% O2 compared to Ar [21]. It seems likely that the activation behavior is related to ROS formation on the catalyst surface.
Not solely Co-containing transition metal oxides are interesting for catalytic oxidation reactions, also mixed Co and Fe transition metal oxides are used either within perovskites or spinel structures [22,23,24,25,26,27,28,29,30,31,32]. With increasing Fe content in spinels, the reducibility decreased steadily until inversion of the spinel materials was found experimentally. However, after inversion was observed, the reducibility behavior was unsteady and not clearly correlated with the nominal Fe content anymore [33]. A mesoporous Co3-xFexO4 spinel series was synthesized via hard-templating using SBA-15 silica as a template, and the catalysts used for this specific study were previously used in different oxidation reactions. In the electrochemical oxygen evolution reaction (OER), a beneficial effect of Fe was observed [34]. In liquid-phase 2-propanol oxidation, however, no effect on the activity of the nominal Co:Fe ratio was detected [35]. Interestingly, if tert-butyl hydroperoxide was used as the oxidant, a beneficial effect of Fe was observed, which was related to different activation pathways [36]. The peroxidic oxidant has to be partially decomposed to be activated, whereas for oxygen activation, a spin transfer is needed [36].
In the presented study, these mesoporous Co3-xFexO4 spinels with high specific surface area were tested in CO oxidation and compared to two pristine Co3O4 samples with lower specific surface area obtained commercially and from a template-free precipitation method. The samples differed in their mesostructure, namely interconnected nanowires, sintered previously hexagonal particles, and a non-homogeneous sample. Low-surface area Co3O4 samples were characterized by powder X-ray diffraction (XRD), physisorption methods, and scanning electron microscopy (SEM) and compared to the SBA-15 templated materials, whose properties were already reported elsewhere [34,35,36]. All samples were tested in cyclic CO oxidation in 2% CO and 20% O2 in three consecutive runs, while between the first and the second run no further pretreatment was performed, while between the second and the third run an oxidative pretreatment was performed. The goal was to study the dynamic behavior as a function of the catalyst’s structure and composition and to discuss the results in the context of the different materials’ ROS formation ability to help design future experiments to identify the ROS under operando conditions by means of dynamic experiments.

2. Results and Discussion

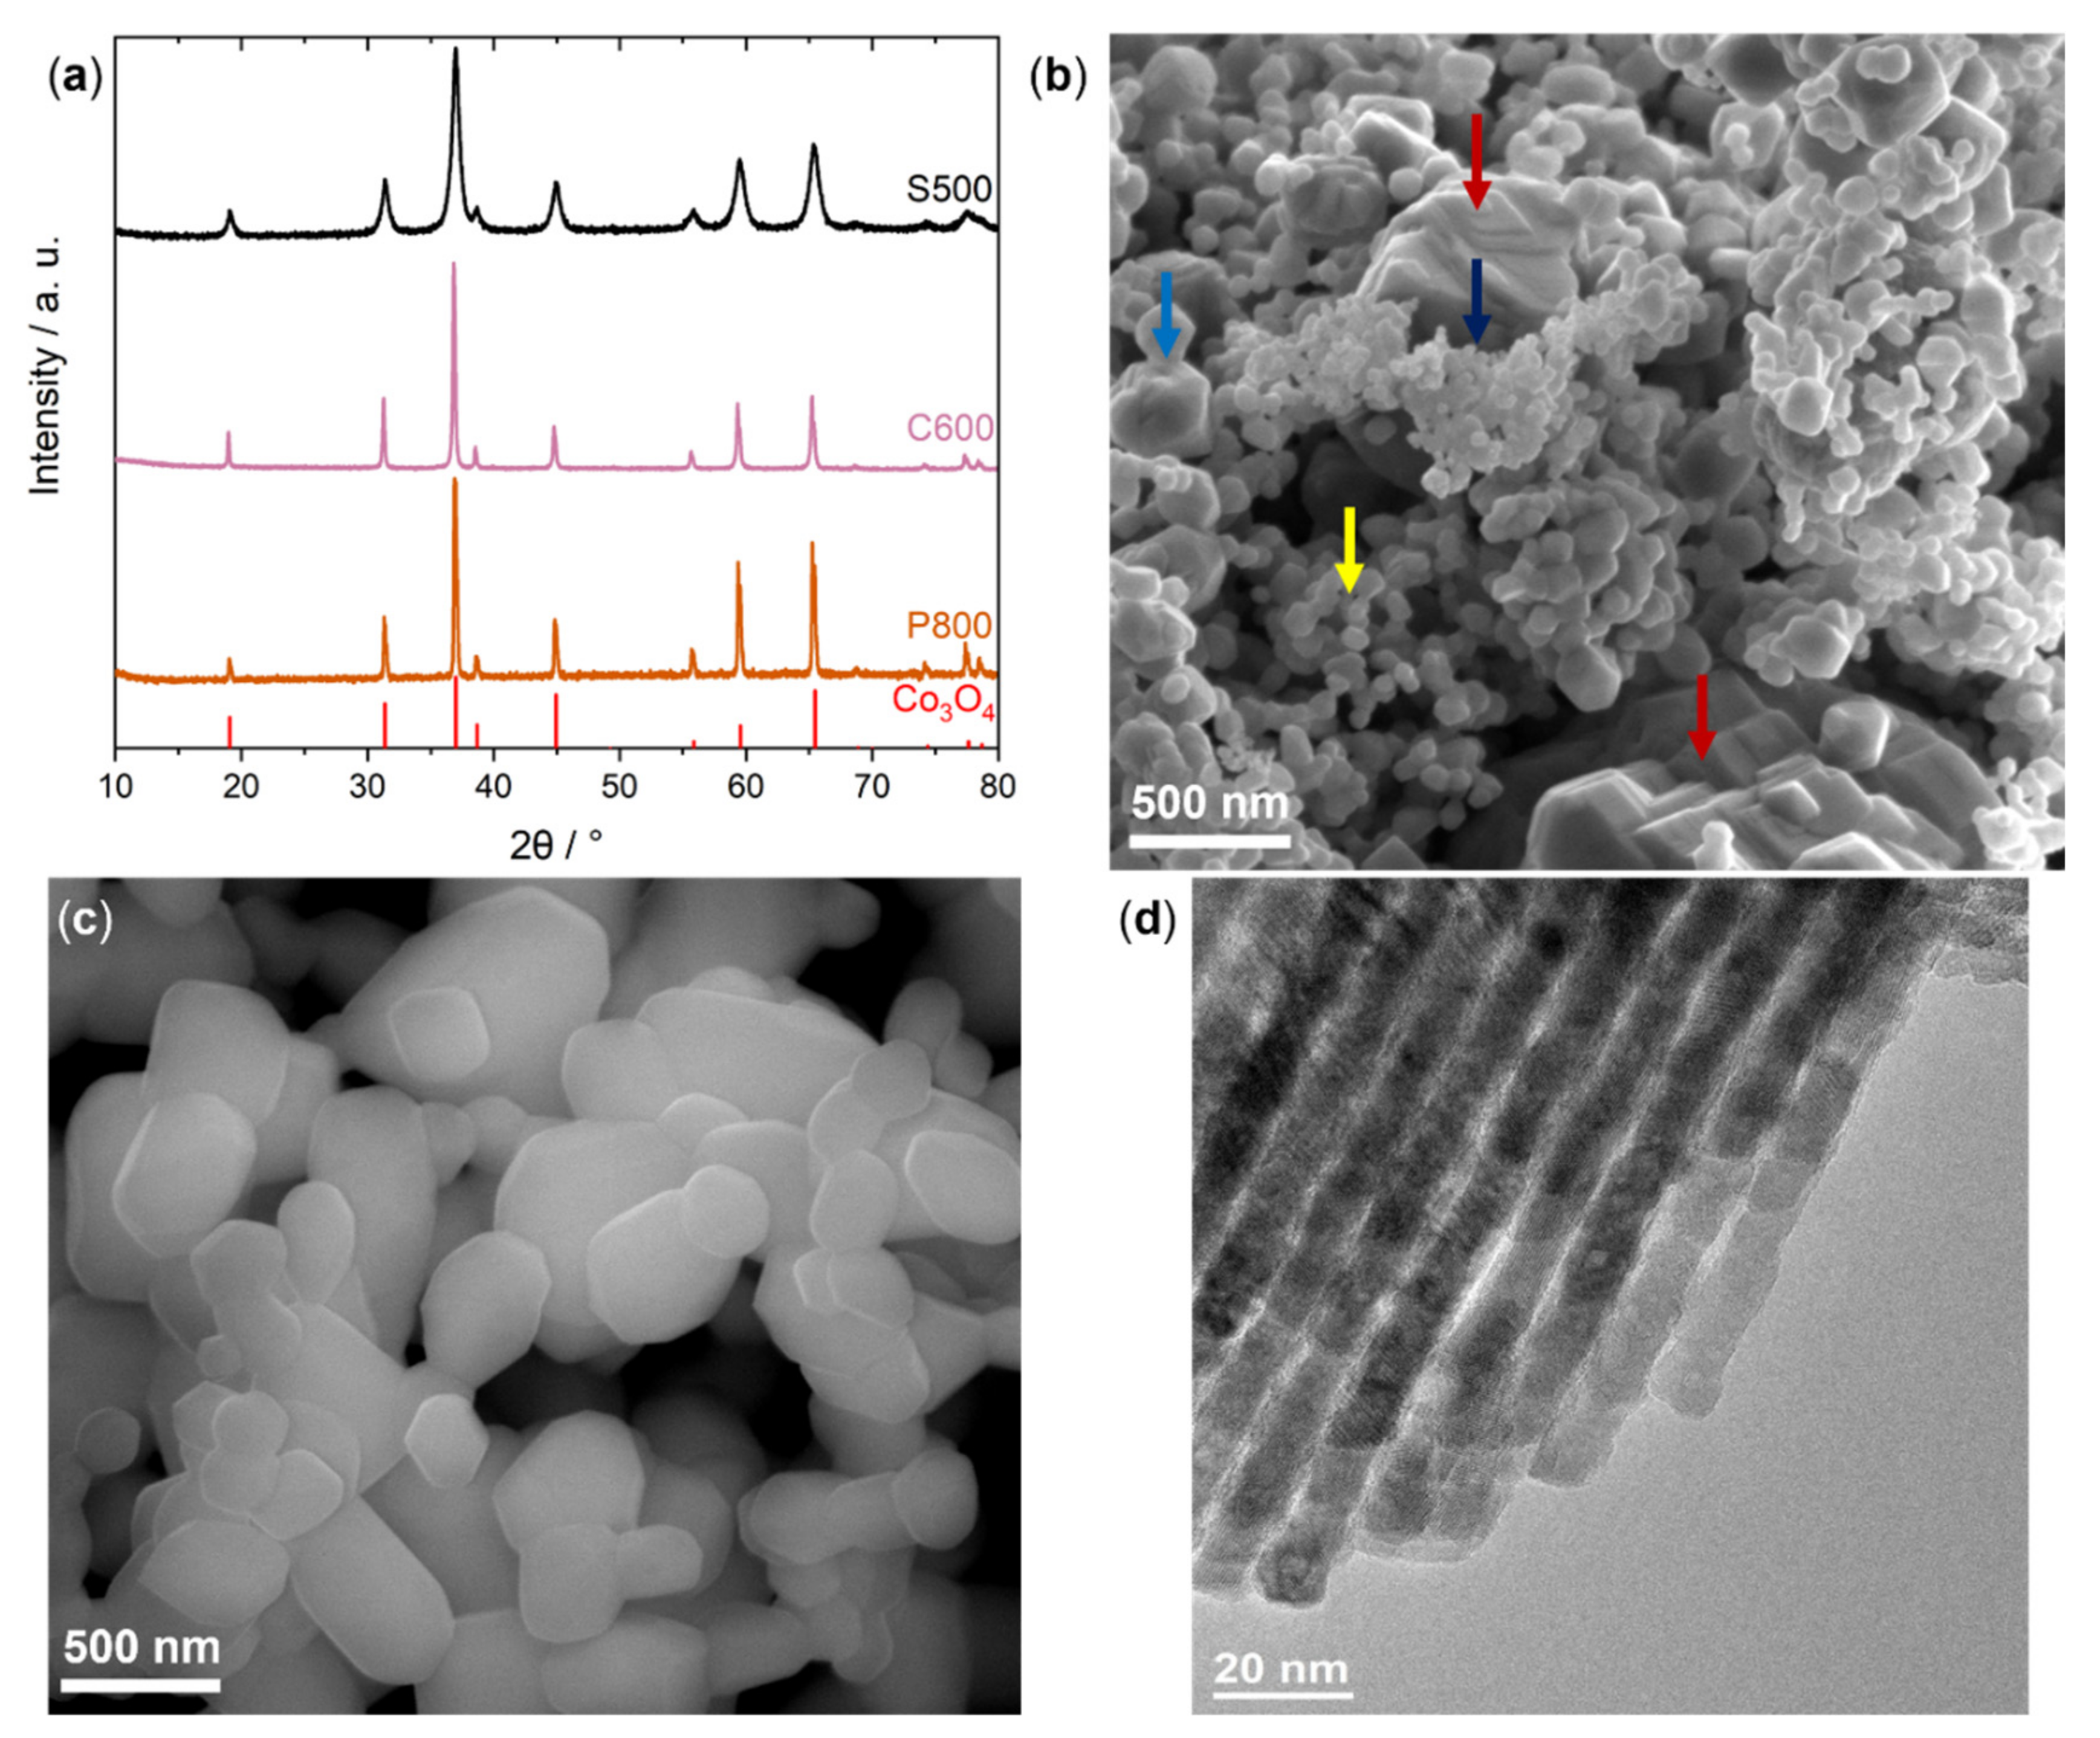
2.1. Characterization
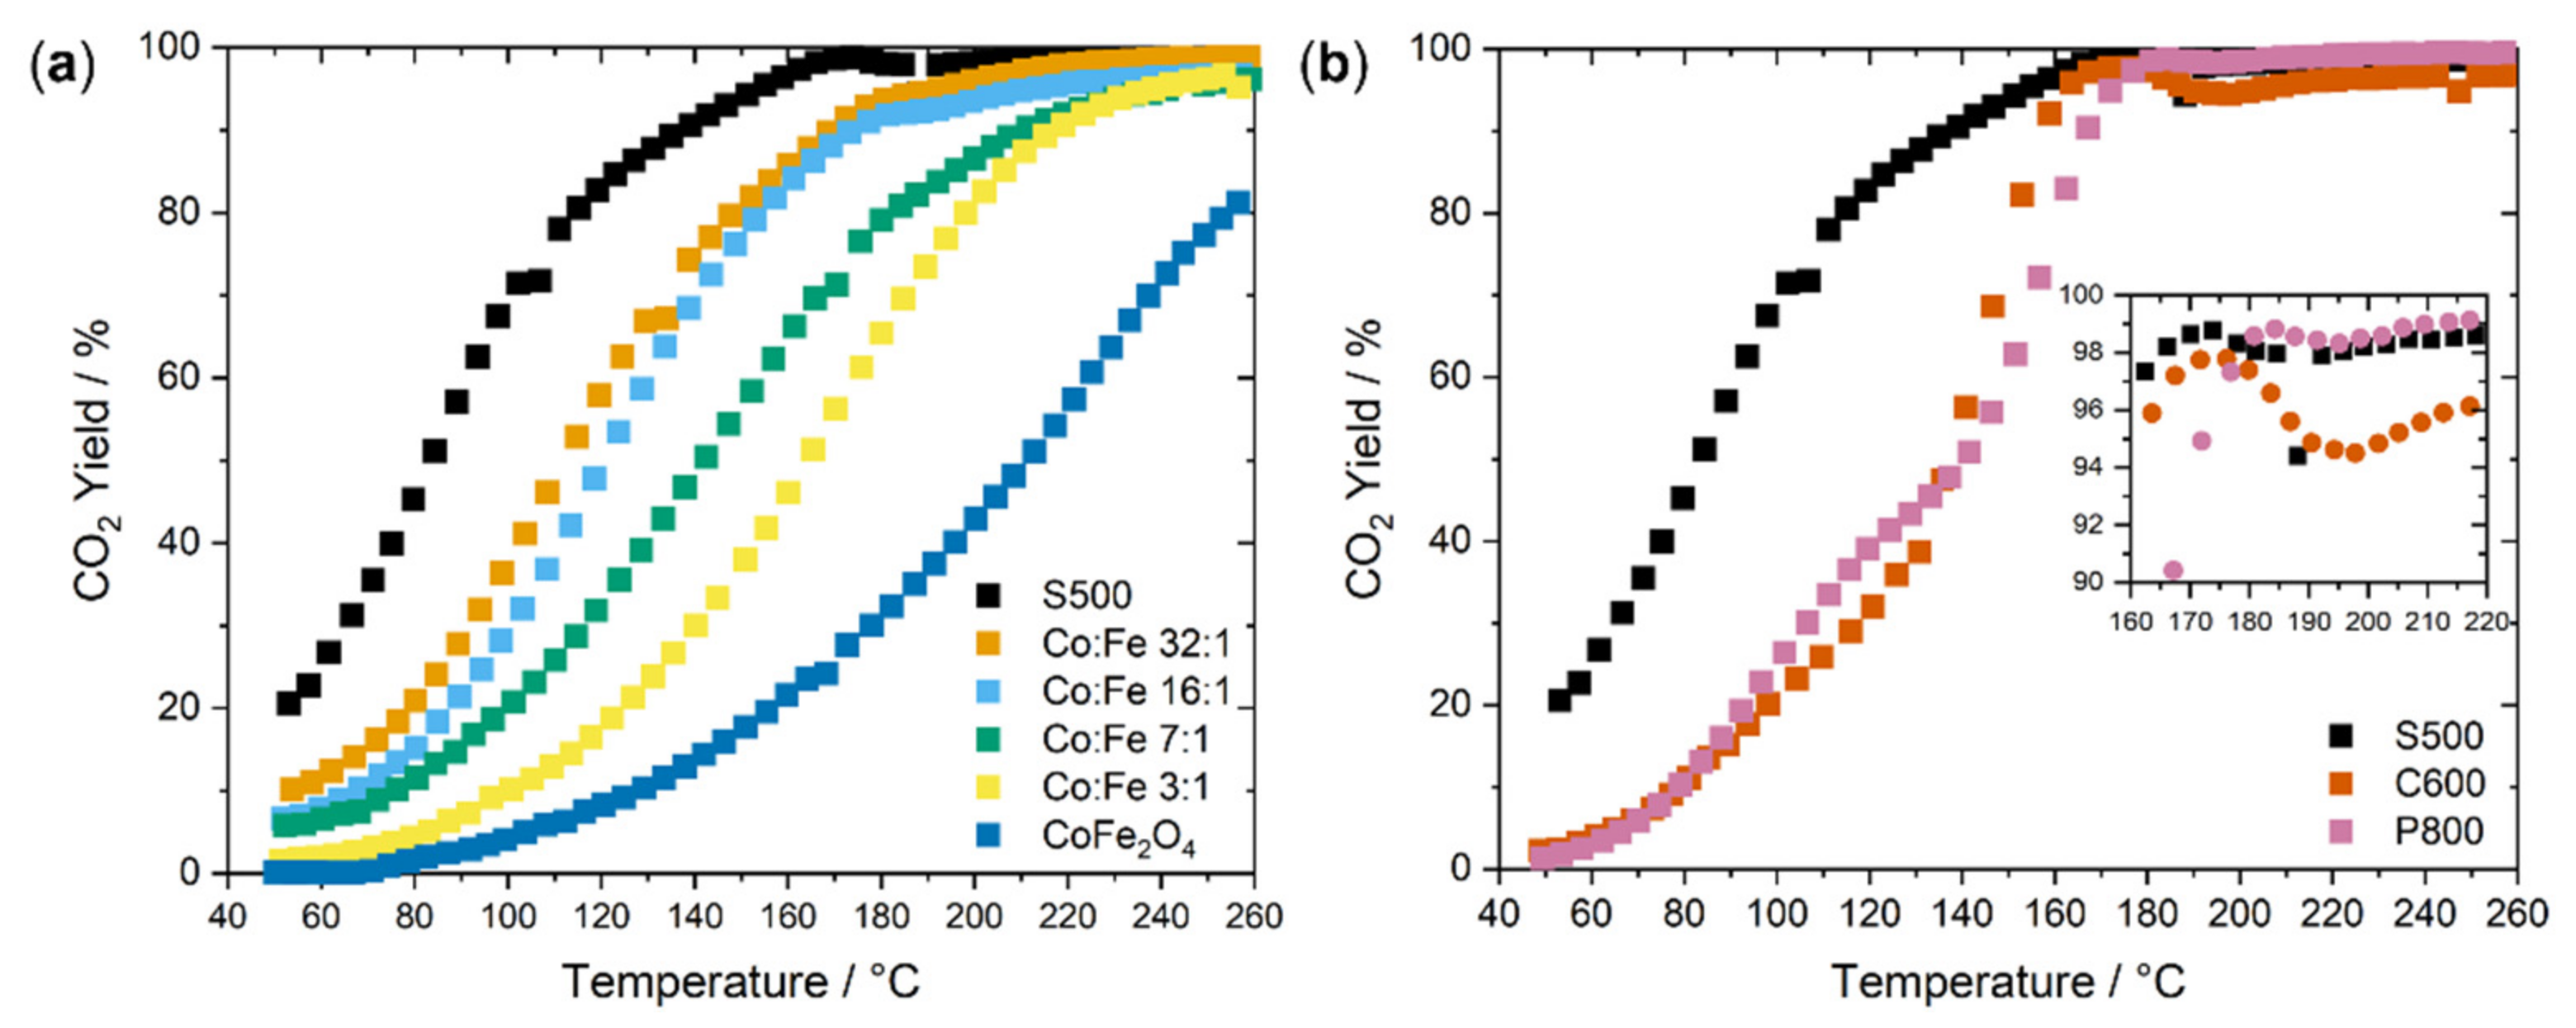
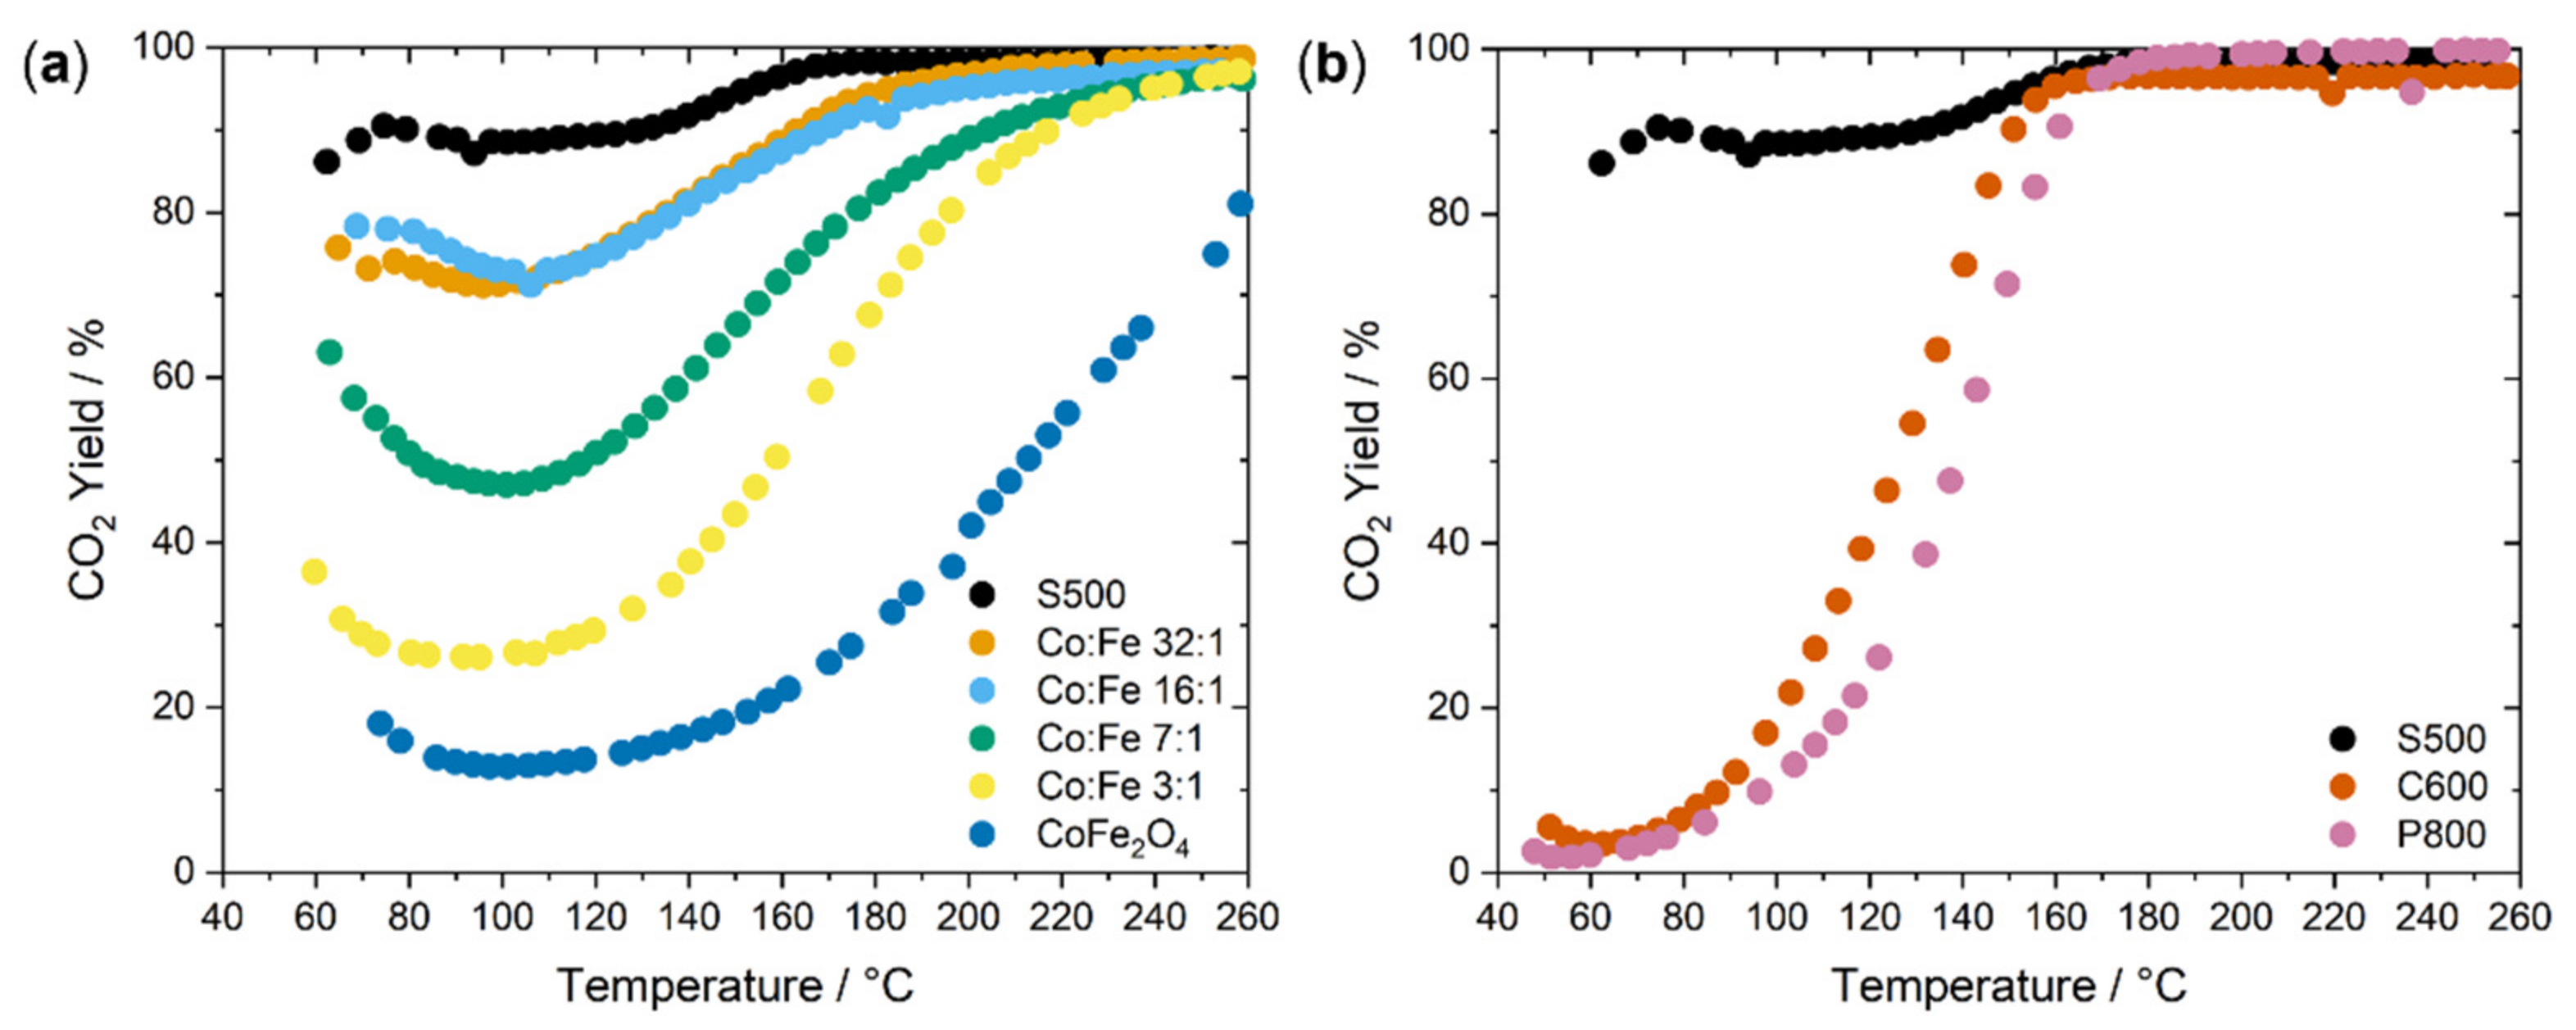
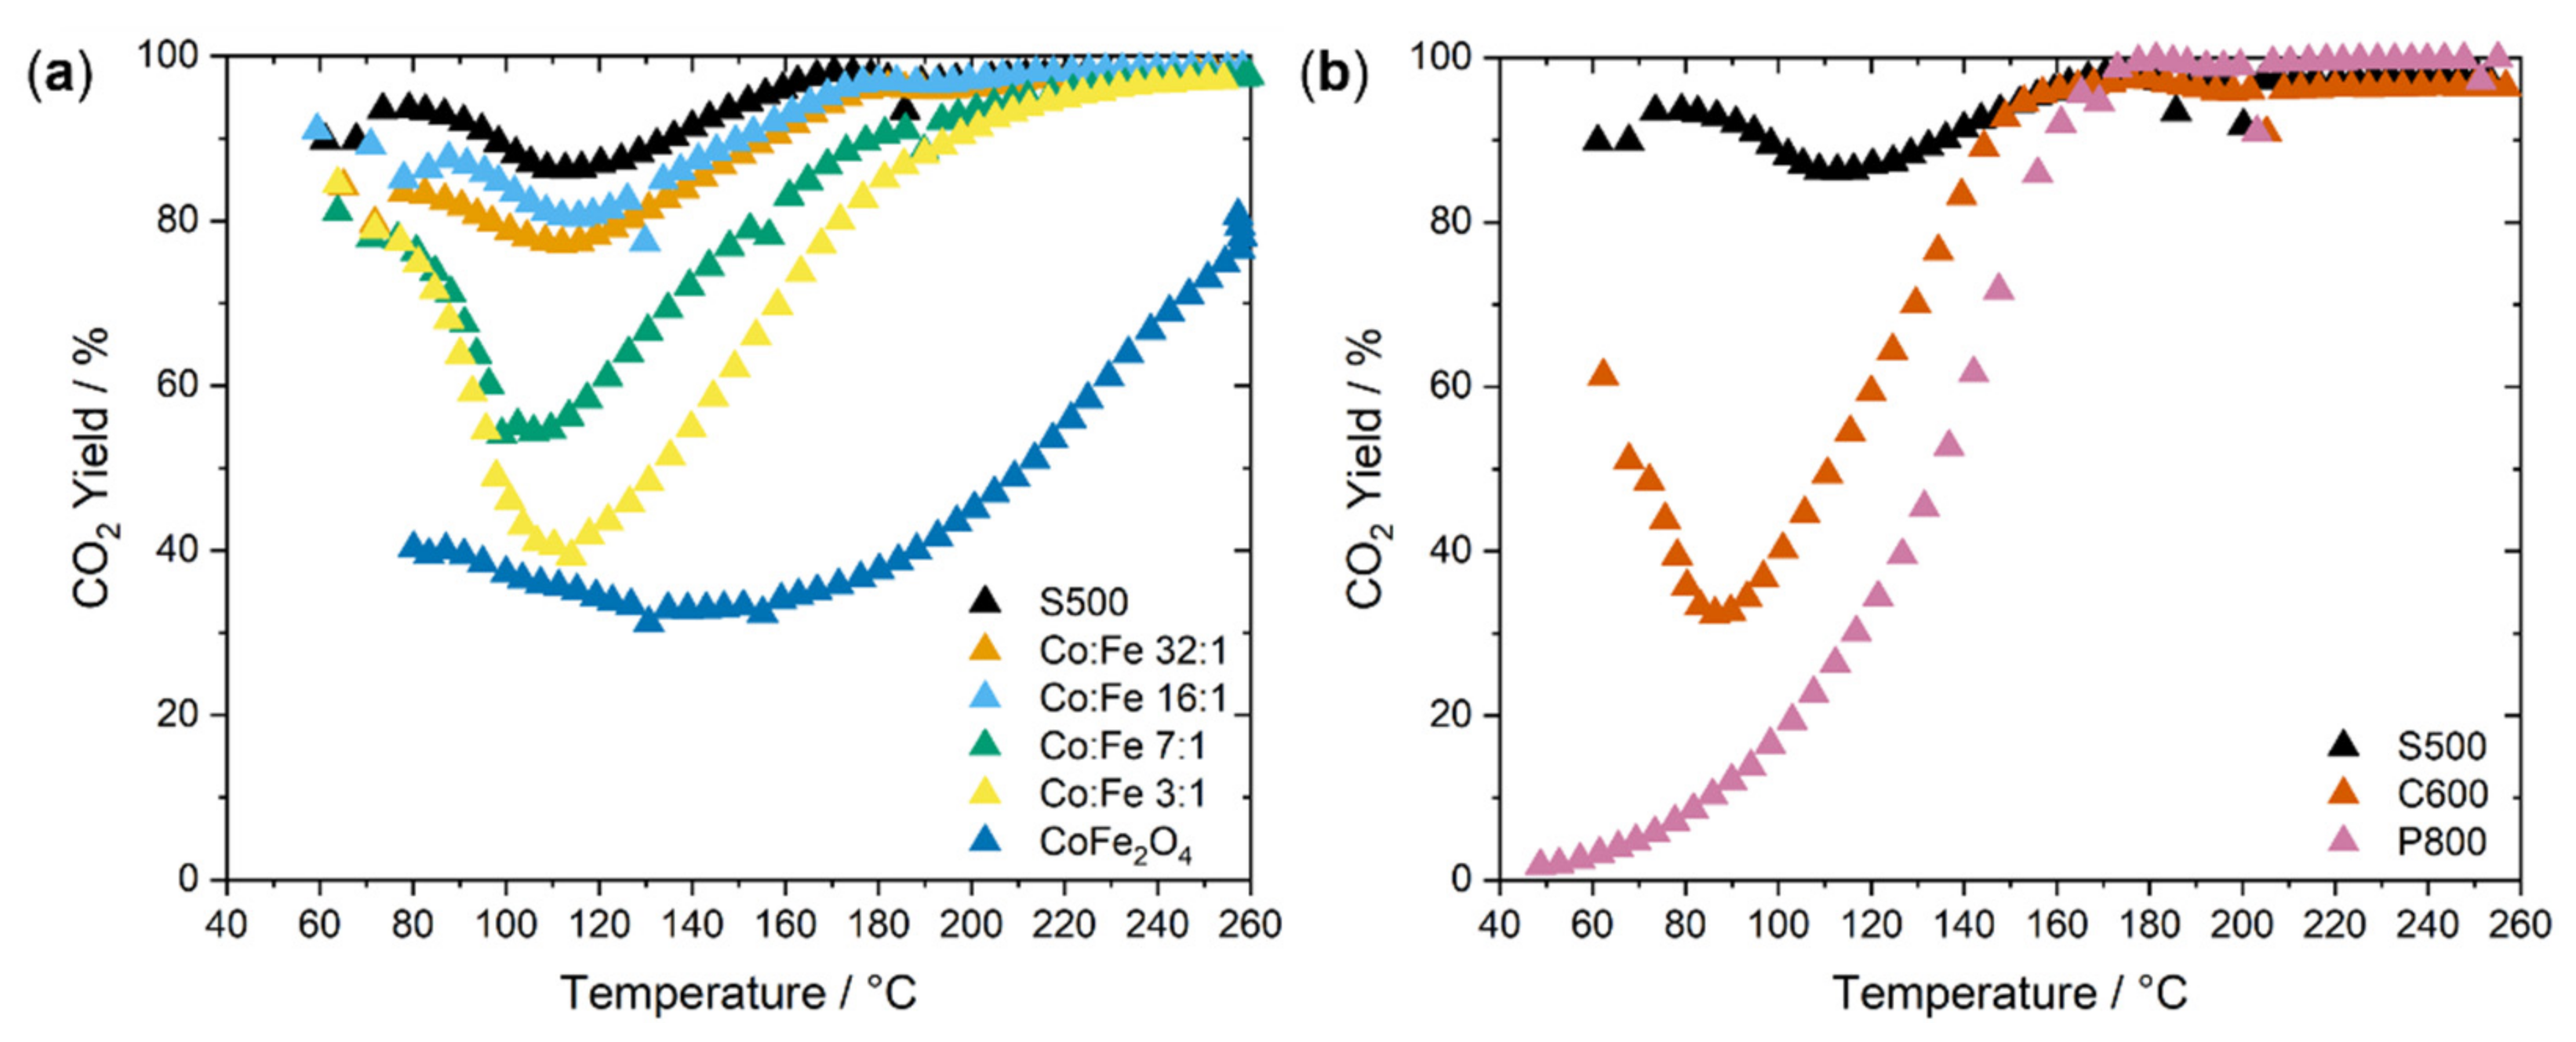
Synthesis and characterization of SBA-15 templated Co:Fe nanowire oxides were reported in a previous publication [34] and the characterization is briefly summarized in the following paragraph. From XRD analysis, the crystalline spinel structure of all materials was verified after calcination at 500 °C. The materials are labelled by the nominal composition during the synthesis, which matched the experimental composition well and was confirmed by bulk energy-dispersive X-ray spectroscopy (EDX) for Co:Fe ratios of 32:1, 16:1, 7:1, 3:1, as well as pure Co3O4 (labeled S500) and CoFe2O4. [34] Furthermore, X-ray photoelectron spectroscopy (XPS) analyses also confirmed the ratio between Co:Fe, which suggested a uniform cation distribution in the bulk and at the surface. The Fe species on the surface were found to be Fe3+ for all catalysts, whereas the Co species were Co3+ and Co2+ despite only Co2+ containing CoFe2O4, as expected from the stoichiometry [35].
In the transmission electron microscopy (TEM) micrographs, a decrease of the degree of the ordering of mesoporous structure and nanowire length was observed with the increasing of Fe content. Furthermore, upon incorporating Fe into the spinel structure, higher occupancy of Co2+ in tetrahedral sites was reported and correlated with a distortion of the Co3+-O bonds [34,37]. In another study on the herein presented SBA-15 templated nanowires, indications for the presence of a Co3O4 secondary phase were reported on CoFe2O4 based on Rietveld refinements [35].
Nitrogen physisorption isotherms are presented in Figure S1a, and they show a typical type IV isotherm that is characteristic for mesoporous materials [38,39]. The hysteresis type of the Co3O4 nanowires can be characterized as a H4 loop, whereas the other SBA-15 templated materials show a H3 loop [40]. Brunauer–Emmett–Teller (BET) surface areas of the SBA-15 templated samples are shown in Table 1. For the Co-rich samples, the BET surface areas scattered between 103 and 125 m2 g−1, while CoFe2O4 shows an increased BET surface area of 178 m2 g−1 due to the formation of small nanoparticles rather than nanowire arrays. From the Barrett–Joyner–Halenda (BJH) method, the pore size distributions were calculated and are shown in Figure S1b. The maximum in the pore-size distribution for Co3O4 was in the range of 3 nm, which indicates a perfect replication of the silica mesostructure since it corresponds to the SBA-15(100) silica wall thickness. Upon Fe incorporation into the spinel materials, additional pores in the range from 10–20 nm are observed due to the pores’ alteration.
Co3O4 (labeled as P800) was synthesized by precipitation of a Co(OH)2 precursor at constant temperature and pH, followed by its thermal decomposition at 800 °C. The synthesis and precursor properties were already reported in a previous study [41]. The BET surface area is very low with 2 m2 g–1 determined by Kr adsorption and might therefore be attributed with a notable error bar, and the material showed no measurable porosity with N2 adsorption–desorption experiments. Co3O4 (labeled as C600) was purchased from Merck and recalcined in synthetic air in a rotating furnace at 600 °C and the surface area of C600 is 9 m2 g–1. The corresponding N2 adsorption–desorption curve is shown in Figure S1a, the BJH pore size distribution in Figure S1b. The isotherms can be classified as type IV isotherms with a H3 loop [38,39,40], and the pore size distribution indicates a maximum in the range between 2 and 3 nm and another maximum in the range between 20 and 30 nm. The low values of the BET surface areas for P800 and C600 might be associated with a notable error bar, but we regard the difference between the two samples as reliable.
XRD patterns of C600, P800, and S500 are shown in Figure 1a. All patterns show the typical cubic spinel structure, as indicated by a literature Co3O4 pattern (ICSD collection code 9362 [42]) and Rietveld refinement [43]. The refinement did not show any indication for secondary phases for all samples, and the refined patterns and the fit parameters are shown in Figure S2 and Table S1. The size of coherently scattering domains was found to be about 10 nm for S500, 45 nm for C600, and 53 nm for P800, as taken from Rietveld refinement. These findings agree with the expected increase of domain and particle size with calcination temperature due to sintering.
An exemplary SEM image of C600 is shown in Figure 1b, which shows a non-homogeneous particle size and shape distribution. As indicated by red arrows, large aggregates are present in the sample, which might be attributed to the sintering of smaller particles upon calcination. Another fraction of particles is exemplarily indicated by a light blue arrow and shows particles in the range of ~200 nm in diameter. In addition, there are two smaller particle fractions marked with a yellow and a dark blue arrow, whose particle sizes seem in a similar range as the average crystallite domain size.
An exemplary SEM image of the precipitated Co(OH)2 precursor for P800 was shown in a previous study and revealed hexagonal platelets, which remained after calcination at 400 °C [41]. After calcination at 800 °C, the platelet structure in a SEM image of P800 in Figure 1c can hardly be seen. The platelets sintered together to more roundish particles with a nonuniform size distribution, whichseems more uniform in comparison to C600. However, because of the high calcination temperature, no porosity is expected for C800. From an exemplary TEM image of S500 in Figure 1d, interconnected nanowires with the average diameter of 8 nm matching the silica template’s pore size can be seen, which leads to mesoporosity [34]. Altogether, this study comprises three Co3O4 catalysts of the same composition, but with different mesostructures, i.e., crystallinity, particle size and morphology, and specific surface area, ranging from a highly crystalline, sintered material with large particles and low specific surface area (P800), and crystalline particles of non-uniform size (C600), to a unique nanosized wire structure with high specific surface area (S500). In addition, the effect of the Fe incorporation into cobalt oxide was investigated by using a series of well-defined and crystalline cobalt iron oxide that was replicated from the SBA-15 silica template.

2.2. Catalysis

The results of the transient temperature-programmed CO oxidation of the Fe-incorporated SBA-templated catalysts are depicted in Figure 2a by showing the CO2 yield. Comparison of CO conversion and CO2 yield are shown in Figure S3, and both were found to follow the same trends as expected without indication for CO2 adsorption. It is evident that by increasing the Fe content incorporated into the spinel structure of the Co3O4, there is a dampening effect on the activity. This can be attributed to the replacement of the highly reducible octahedral Co3+ with the less reducible Fe3+ resulting in a decrease of highly active sites on the surface [33]. DFT calculations on Co3O4(110)-B-surface show Co3+ are more active than Co2+ as it binds the CO molecule stronger and features the lower energy barrier. Furthermore, the reaction which is said to follow the Mars-van-Krevelen mechanism (MvK) [44], can be inversely affected by the presence of less reducible cations, in this case Fe. Indeed, the Co3O4 S500 with no Fe content shows significant activity even close to room temperature, whereby cobalt ferrite spinel shows the lowest activity although it has the highest surface area among all samples. As already stated in the introduction, the incorporation of Fe has different effects on the activity for different oxidation reactions. In the herein investigated CO oxidation, Fe did not have a beneficial effect on the SBA-15 templated catalyst materials, similar to liquid-phase oxidation of 2-propanol with oxygen as the oxidant [35].
The effect of different synthesis routes resulting in different micro- and mesostructures for S500, C800, and P600 with the same nominal Co3O4 composition is shown in Figure 2b. Comparison of CO conversion and CO2 yield are shown in Figure S4. The conversion of S500 was higher, starting already below room temperature, where C600 and P800 hardly show activity in this temperature regime. This goes in line with our previous finding that high surface area ordered mesoporous Co3O4 could catalyze CO oxidation even at room temperature [15,45]. While the onset of the transient activity for C600 and P800 is around 60 °C, whereasS500 already showed >20% conversion at this temperature. However, due to the immense differences in specific surface area, the activity differences cannot be directly concluded from the conversion curves, and a discussion of the reaction rates is presented below. Interestingly, the conversion curve shapes showed shoulders at low temperatures for C600 and P800. This shoulder was more pronounced for P800 leading to higher conversion at low temperatures, whereas at higher temperatures, the conversion of C600 was slightly higher. The temperature to reach 50% conversion (T50) was quite similar for both catalysts. These shoulders indicate changes of the catalyst during heating and may point to active sites, which are consumed rapidly and have a higher abundance on P800. Interestingly, all Co3O4 catalysts reached full conversion in the same temperature range of ~180 °C despite their different mesostructure. In the range of full conversion, an intermediate drop for all catalysts was observed in the temperature range between 160 and 220 °C, that might be explained by reaction dynamics due to the high excess of oxygen in the feed.
Since the exposed BET surface areas of the samples covered a wide range as shown in Table 1 with two groups: high surface area SBA 15-templated and low surface-area materials, reaction rates normalized by the BET surface area were determined and are shown in Figure 3a. Clearly, P800 appeared superior to all catalysts after rate-normalization, followed by C600. The large extent of these rate differences is caused by the normalization as these catalysts exhibit by far the lowest specific surface area and should be treated with care. Among the SBA-15 substitution series (Figure 3a, inset), the activity trend followed the amount of Fe incorporated in the samples, as already reported for the conversion curves. For a better comparison of the activities of the different samples, T50 and CO2 formation rates at 100 °C are shown in Figure 3b. Within the SBA-15 substitution series, T50 was increasing, indicating less activity, and the rate at 100 °C was decreasing accordingly with increasing Fe content in the samples. T50 values of P800 and C600 were similar and shifted to higher temperatures by ~60 °C compared to the high-surface-area catalyst S500. In Figure S5, a plot of the CO2 formation rate against the nominal Co content in the spinels is shown and indicates a nearly linear behavior for the SBA-15 templated catalysts with intermediate Fe content excluding the Co3O4 and CoFe2O4 catalysts. The deactivation with increasing Fe content was previously reported in liquid-phase 2-propanol oxidation, where ensembles of more than six coordinatively unsaturated Co3+ species were identified as the active site [35]. The observation is consistent with the proposal that the active sites of CO oxidation are also Co-centered (see below).
Directly after performing the first run and cooling down to room temperature, a second transient activity test was performed for all catalysts at the same heating rate and gas composition. The activities of the Fe-incorporation series SBA-15 catalysts during the second consecutive run are shown in Figure 4a. Comparisons between all three CO oxidation runs are shown in the Supplementary Material in Figures S6–S13 for each specific catalyst compared to the first run. All samples showed a significantly higher activity already in the lower temperature range. However, the conversion was initially decreasing with temperature for most catalysts before rising again in the high-temperature range of the experiment showing a U-shaped conversion curve. The first run has acted as an activating pretreatment for the second run on all SBA-15 templated catalysts, including the ones with a high Fe content, but the creation of the new activity at low temperature was not stable and could not be maintained during the heating experiment. The temperature to reach full conversion was similar to the first run indicating that the state after deactivation was similar to the first run. The general trend between composition and activity observed in the first run remains, with a slight deviation of the 16:1 and 32:1 samples at lower temperatures.
Different effects of the pretreatment have been studied, for instance, Yu et al. reported a volcano-shaped curve between pretreatment temperature and conversion at −80 °C for the temperature range between 25 °C and 250 °C with a maximum for a pretreatment temperature at 150 °C. The differences between treatments in N2 and dry air were minor [3]. For two consecutive runs on Co3O4, Hu et al. reported stable activity, but no activation of the samples in 2.5% CO and 20% O2, which is in contradiction to our results but might be explained by lower BET surface area in the range of 20–25 m2 g−1 [19]. In another study on Co3O4/Al2O3, a beneficial effect of a consecutive pretreatment with H2 at 300 °C and O2 at 250 °C has been observed and correlated to an increasing number of Co3+ on the surface and decreasing crystallite size. Additionally, an activation for the second of two consecutive runs has been reported, which is in line with our results [20]. Since the catalysts in our study have been subjected to a rather oxidizing atmosphere of 2% CO and 20% O2 in the first reaction cycle and the very high initial activity was observed on all SBA-15 templated catalysts, a likely hypothesis for the activity increase at low temperatures is the formation of reactive oxygen species (ROS) upon performing the reaction at oxygen-rich conditions at high temperature and full conversion at the end of the first cycle. The conversion profile of the second cycle with the high initial conversion of CO followed by a rapid decrease until ~100 °C indicates consumption of these previously formed ROS in the low-temperature range. At higher temperatures, similar conversion profiles are observed again, as observed in the first run after ROS consumption. Likely, their re-formation requires higher temperature and/or dwell time at full conversion and cannot be detected in the reaction profiles. Based on literature reports from Zasada et. al., it is assumed that two fivefold coordinated Co3+ in octahedral sites ( Co 5 c O ) are responsible for the oxygen activation by working as a tandem [46]. The nature of the ROS formed and active in the oxidation of CO at temperatures below 450 °C was described as suprafacial µ-superoxo Co 3 c O - O 2 - Co 3 c T and metal-oxo Co 3 c O - O species [12]. In both cases, undercoordinated cobalt sites are active, as was also shown to be the case in gas- and liquid-phase 2-propanol oxidation on spinel catalysts, where (ensembles of) coordinatively unsaturated (surface) Co 5 c O species were described as the active site [16,35].
A similar U-shaped conversion curve like in the second run was previously reported on a Co3O4–SiO2 catalyst in CO oxidation in a 3 ppm water-containing feed after air and nitrogen treatment with 100% conversion at sub-zero temperatures and a minimum in conversion around 80 °C. The shape was attributed to negative apparent activation energies for certain temperature ranges, including two different oxygen species. However, when water was frozen out from the reaction mixture, no U-shaped curve was observed, and indications for the negative impact of water on the catalyst ability to provide active oxygen species were reported [47]. In another study, after pre-treating Co3O4 and CoO before reaction with H2, an increase in activity was found under similar reaction conditions (1% CO, 20% O2) for both types of oxides in consecutive runs up to 200 °C, which showed the restorability of Co3+ on the surface below 200 °C, which is in line with our results [15].
Zasada et al. reported the reactivity of diatomic ROS below 160 °C and monoatomic species between 160 °C and 300 °C by hydrogen oxidation on Co3O4 [10]. In addition, below 350 °C superoxo and peroxo species on the surface were proposed by density functional theory (DFT) [10]. The temperature window fits the conditions of the end of the previously performed first reaction cycle. In a study on Co3O4(100) films, superoxide species on pre-oxidized surfaces were not active in CO oxidation, whereas superoxides on reduced surfaces catalyzed the reaction already at 120 K and up to 270 K, from which the need of a presence of vacancies and superoxide was concluded to be essential for low-temperature oxidation of CO [13].
Interestingly, in the case of Co3O4 C600 and Co3O4 P800, no significant activation was observed in contrast to SBA-15 templated Co3O4 S500, as shown in Figure 4b. For C600 and P800, the low-temperature shoulders in the reaction profile of the first runs vanished, as shown in Figures S12 and S13. Still, the T50 values are decreased, but the changes are much smaller than the high-surface-area nanowires. This indicates a lower ROS generation ability of C600 and P800 compared to S500 during the first run. This less pronounced formation of ROS is most likely related to the difference in particle size, specific surface area, and porosity, hence indicating that the higher surface energy of nanoscaled materials might facilitate effective ROS formation compared to the typically low-indexed and thermodynamically more stable surface terminations of larger or sintered particles. It thus seems that the sample preparation history has an effect not only on the starting surface area but also on intrinsic properties like dynamic ROS formation.
CO oxidation activities in the third run after temperature-programmed oxidation (TPO) up to 500 °C are shown in Figure 5a. The temperature of 500 °C was chosen to mimic the calcination protocol of the SBA-15 templated materials. During TPO between the second and third run, no CO2 was detected by micro-GC in the outlet stream, which indicates no or only minor carbon laydown or carbonate formation during the reaction of the second run, supporting that the loss of ROS can explain the deactivation observed at medium temperatures. In the third run, the low-temperature activity of the SBA-15 substitution series samples was even more pronounced than during the second run, as well as the subsequent drop in activity upon further heating. This hints at the formation of more or more active ROS after TPO up to 500 °C compared to reaction up to 250 °C, and again to the consumption of these ROS on the surface during catalysis. Based on work from Zasada et al. in the higher temperature range, monoatomic metaloxo ROS are formed [10]. The before-mentioned higher activity of the 16:1 sample compared to the 32:1 sample in the second run is becoming evident over the whole temperature range up to 180 °C in the third run. This suggests that while Fe did not have a beneficial role for the CO oxidation in the first run, it may contribute to effective ROS formation at a higher temperature for specific compositions. For all other samples, the trend with respect to the Fe content was maintained.
As shown in Figure 5b, Co3O4 C600 was activated in the third run like the catalysts of the SBA-15 series already in the second run, whereas Co3O4 P800 remained inactive despite a specific surface area of the same order of magnitude, indicating again an effect of the mesostructure and domain size emerging from synthesis procedure and calcination temperature on the ROS formation ability and catalyst activity. C600 shows an inhomogeneous morphology containing a small fraction of nanoparticles, and P800 features mostly roundish sintered and exclusively larger particles evolved from hexagonal platelets of the Co(OH)2 precursor. The decreased ROS formation capability of P800 might be related to its high calcination temperature and largest domain size in this study, suggesting again that ROS are preferably formed on small particles. Altogether, it strengthens the argument of ROS created on the highly reactive surface of the nanoscaled catalyst during reaction at 100% conversion at net oxidizing conditions or during TPO. In the case of low specific surface area catalysts with large particles obtained at high calcination temperatures, the total number of ROS is lower, and their formation seems hindered.
The previous findings are supported by the extent of catalyst activation at 75 °C, which is assumed to be a measure of ROS formation. It was determined as the difference in conversion at 75 °C between first and second as well as first and third run, ΔY75°C, as shown in Figure 6a. A more negative value indicates a relatively more pronounced activation of the CO oxidation by ROS formation. As the maximum conversion at 75 °C during the second run was 82% for S500 and thus still below 100%, this evaluation between the first and second run is valid for all catalysts as their improvement is not limited by approaching full conversion. Looking at the composition dependency of the SBA-15 series, a volcano-like behavior with maximal activation at Co:Fe 16:1 was observed when comparing the first and second runs. This indicates that the ROS formation is favored at this specific composition and that Fe is involved in forming either a higher number or of intrinsically more active ROS. It also can be seen that activation by ROS formation for the Fe richer catalysts requires the more oxidizing conditions of TPO as the most substantial further activation in the third run was observed for these catalysts, as is also shown in Figure S14 as the difference between the second and the third run, where the peak of the volcano has shifted to a composition of Co:Fe 3:1. However, this trend has to be taken with care for the S500 sample since its conversion in the third run was already close to 100%, which limits the possibility of further improvement in comparison to the other catalysts. A correlation of Y75°C in the second run and the improvement in the third run in Figure S15 shows that higher starting conversions in the second run lead to lower relative improvements in the third run. It can be again seen for C600 and P800 that there was no activation during the first run, and only C600 was activated by the TPO.
Since C600 showed one of the clearest responses to the TPO, CO-TPR was performed before and after a TPO up to 500 °C to study the consumption of potential ROS from the surface. The results are shown in Figure S16. Before the TPO, i.e., in a non-oxygen treated state of the catalyst comparable to the initial 1st CO oxidation run, no direct CO2 formation is evident at 40 °C temperature in the reactor after switching on the CO-containing atmosphere mixture. After starting to heat the reactor, only a slight increase in the concentration of CO2 formed is observed at 79 °C. With rising temperature, the onset of catalyst bulk reduction was detected, and the catalyst was cooled down again. The CO2 concentration decreased again, and no more CO2 formation was detected from 154 °C onward during cooling. However, after the TPO and 15 min of purging in N2, directly after switching to the 2% CO containing feed gas, a strong formation of CO2 is seen, which points out to the formation of ROS on the surface during the TPO, which are consumed over a period of 22 min already close to room temperature and finally in a small peak at 75 °C. The onset of bulk reduction was very similar to the untreated sample, and CO2 formation decayed at a similar temperature, indicating that this protocol exerted no or only a very small effect on the bulk. After the oxidative treatment, the amount of CO2 formed increased from 0.298 µmol to 0.393 µmol over the whole period. After an integration starting from 70 °C to neglect the amount of highly active ROS in the beginning, the integral is 0.298 µmol before TPO and 0.286 µmol before TPO, which confirms the integrity of the bulk. These observations are well in line with the formation of ROS at the surface of this catalyst, causing the increase in catalytic activity.
As discussed above, the comparison between first run activity and second run activity suggests that the first run acts as an in situ TPO under reactive conditions leading to increased activity of the samples by creating ROS under the oxygen excess at full conversion. To support this hypothesis, another cyclic CO oxidation on a fresh batch of the templated nanowire catalyst S500 was performed with a stochiometric feed containing 2% CO and only 1% O2. The new runs with decreased oxygen concentration were compared to the initial runs with 20% O2 and are shown in Figure 6b. The initial activity in the first run was decreased for the lower oxygen content in the feed, which could indicate a Langmuir–Hinshelwood (LH) rather than a MvK mechanism due to the large effect of oxygen partial pressure on the activity. Again, the temperature to reach full conversion is comparable for both oxygen concentrations. According to Lukashuk et al., the MvK mechanism becomes dominant above 100 °C, which is in line with DFT studies that indicate a preferred MvK mechanism on Co3O4(110) B-terminated surfaces [17,44].
For the second run, there was still a substantial activity boost observed upon decreased oxygen concentration, but the magnitude of the activity boost was less pronounced than the measurement performed in 20% O2. Jansson et al. reported the improved catalyst recovery for regeneration in 10% O2 compared to using Ar as the atmosphere for catalyst activity regeneration, so higher oxygen partial pressures are beneficial [21]. As a minimum temperature for catalyst regeneration, a temperature of 250 °C was reported, which indicates that the first run can act as an in situ regeneration of the sample and that the temperature treatment can be considered an important parameter for sample activation by ROS formation also in oxygen-leaner conditions at higher temperatures in a stochiometric feed. The U-shaped curve of the second run in 1% O2 containing feed still indicates the consumption of ROS, but the degree of ROS formation seems to increase with oxygen content in the feed. However, after the TPO before the third run, the conversion of CO was slightly higher with 1% O2 in the reaction mixture compared to the 20% O2 containing reaction mixture, which might be explained by less competitive adsorption of CO and oxygen on the surface at lower total concentrations of reactive species in the feed gas stream.
To confirm the effect of the high concentration of O2 on the reactivity of the second run, a similar experiment as seen in Figure 6b on the catalyst S500 was also performed on the SBA-15 templated catalyst with a Co:Fe ratio 3:1 to check the effect of Fe. The mentioned experiment on 3:1 is shown in Figure S17 as an example for mixed Co:Fe catalysts. It confirmed the basically lower activity in the less oxidizing feed and shows even a decreased activity of the second run directly after the first run on an Fe-rich catalyst suggesting that these conditions are unable to cause ROS formation on the less active Fe-containing catalyst. However, the U-shaped curve and increased low-temperature activity were observed after TPO, as shown in Figure S17b. The Co3O4 catalysts (S500, C600, and P800) were characterized by XRD, TEM (S500), and SEM (C600, P800) after the third run. The mesostructure remains unchanged, as is shown by electron microscopy images in Figure S18. The nanowire morphology of S500 remains intact as well as C600 shows particles in different shapes and sizes. In addition, the structure of P800 remains similar as well, but the particles appear more faceted, which might be a result of surface reconstruction but might also be explained by a better contrast of the image after catalysis. As seen from XRD after catalysis, also the bulk structure remains unchanged, as is shown in Figure S19. S500 shows broad reflections due to low domain size as already reported in the XRD of the as-prepared materials. The integrity of the bulk crystal structure and the particles support the claim that dynamic changes at the surface related to ROS are responsible for the observed dynamics in catalysis.

3. Materials and Methods

3.1. Synthesis and Sample Preparation

S500 and further SBA-15 templated catalyst materials: SBA-15 templated Co3O4 (labeled as S500 in this manuscript), CoFe2O4, and cobalt iron oxide series with controlled mesostructures via nanocasting have been prepared according to our previous report, the mentioned metal cation ratios have been used for synthesis as described in the previous work [34]. In brief, cobalt and iron precursors (Co:Fe atomic ratio of 1:0, 32:1, 16:1, 7:1, 3:1, and 1:2) were prepared by dissolving a stoichiometric amount of Co(NO3)2•6H2O and Fe(NO3)3•9H2O (Merck, Darmstadt, Germany, ACS reagent grade) in pure ethanol. The calculated concentration of precursor solution was 0.8 M. The precursor solutions were then impregnated into the pore system of SBA-15(100) template by the two-step wet impregnation method (15% total pore filling). For the first impregnation step, a mixture of precursor solution and template was stirred 2 h. Then the composites were dried in the oven at 50 °C overnight. The first calcination was carried out at 250 °C for 4 h (ramping rate 2 C min−1). The same impregnation procedure was applied for the second impregnation step; however, the final calcination was carried out at 500 °C for 6 h with the intermediate dwell at 250 °C for 4 h (ramping rate 2 °C min−1). As an exception, a slower ramping rate (1 °C min−1) was applied for calcining CoFe2O4. SBA-15(100) template was then leached out with hot 2 M KOH solution. After four washing cycles and centrifugation in distilled water, the final product was then dried in the oven at 80 °C overnight.
P800: Precursor synthesis was conducted in an automatic lab reactor system (OptiMax 1001, Mettler Toledo), as reported before [41]. The precipitated Co(OH)2 precursor was calcined at 800 °C for 3 h (β = 2 °C min−1) in stagnant air in a muffle furnace (B150, Nabertherm, Lilienthal, Germany) to achieve spinel formation.
C600: Co3O4 was bought from Merck (Darmstadt, Germany). The material was recalcined in a rotary furnace GVA 12/450 (Carbolite Gero, Hope Valley, England) at 600 °C in synthetic air (99.999%, 20% O2 in N2, 100 sccm) for 4 h.
For catalysis, all calcined samples were characterized as powders and pressed with a hydraulic press by PerkinElmer (5 t, 2 min, Überlingen, Germany), pestled, and sieved with stainless steel sieves from ATECHNIK (ISO 3310−1, Leinburg, Germany). A sieve fraction of 250–355 µm was used for the kinetic analysis with a BELCAT-B (MicrotracBEL Corp., Haradanaka Toyonaka, Japan) catalyst analyzer.

3.2. Catalyst Characterization

N2 adsorption-desorption experiment of C600 was performed with a NOVA3000e setup (Quantachrome Instruments, Boynton Beach, FL, USA) at −196 °C after degassing the samples at 80 °C for 2 h in a vacuum. Kr adsorption-desorption experiment of P800 was performed with an ASiQwin setup (Quantachrome Instruments, Boynton Beach, FL, USA) at −196 °C after degassing the samples at 150 °C for 24 h in a vacuum. BET (Brunauer–Emmet–Teller) surface areas were calculated from p/p0 data between 0.05 and 0.3. Total pore volumes were determined at p/p0 = 0.99. Pore size distributions were determined using the Barrett–Joyner–Halenda (BJH) method during desorption. Kr adsorption experiment of P800 to determine the BET surface area was performed with a Belsorp-mini setup (MicrotracBEL Corp., Suminoe-ku, Osaka, Japan) after pretreatment in a vacuum at 150 °C for 24 h. N2 adsorption–desorption experiments of the SBA-15 templated catalyst series were performed by using 3Flex Micromeritics at 77 K. The sample was degassed in a vacuum at 120 °C for 10 h before the measurements. The Brunauer–Emmett–Teller (BET) surface area was calculated within the 0.06−0.3 relative pressure range (p/p0). The pore size distribution was calculated with the BJH method from the desorption branch.
Powder XRD patterns of C600 and P800 were recorded from 5 ° to 90 ° on a Bruker D8 Advance diffractometer (Bruker, Billerica, Massachusetts, USA) in Bragg–Brentano geometry with a position-sensitive LYNXEYE detector (Ni-filtered CuKα radiation Bruker, Billerica, Massachusetts, USA) applying a counting time of 0.3 s and step size of 0.018 °. Samples were mounted by the use of dispersion in ethanol on a glass disc that was inserted in a round PMMA holder. The latter was subject to gentle rotation during scanning after removal of the ethanol by drying.
Scanning electron microscopy (SEM) of C600 and P800 was performed with an Apreo S LoVac (Thermo Fisher Scientific, Waltham, MA, United States). Before the measurements, the samples were sputtered with Pt/Au.
Transmission electron microscopy (TEM) of S500 were recorded with aberration (CS) corrected JEOL 2200FS (Tokyo, Japan) instrument equipped with a 200 kV Field Emission Gun (FEG). The samples were deposited on a Cu lacey carbon grid.

3.3. Catalytic CO Oxidation at Ambient Pressure

The catalytic experiments were performed in a BELCAT-B catalyst analyzer (MicrotracBEL Corp., Suminoe-ku, Osaka, Japan). To this aim, 60 mg (sieve fraction 250–355 μm) of each calcined catalyst sample diluted with 300 mg of silicon carbide (>355 μm) were placed inside a U-shaped quartz tube reactor (inner diameter = 8 mm). Each sample was pre-treated by heating at 3 °C min−1 in He (99.9999%, Air Liquide) from room temperature to 100 °C, which was kept constant for 1 h. Thereafter, the sample was cooled down in He to 45 °C.
Before starting the temperature-programmed catalytic experiments, the catalyst/SiC mixture was purged for 15 min with 2% CO and 20% O2 in He to equilibrate the gas composition. Thereafter, the temperature was increased to 250 °C at a heating rate of 3 °C min−1 for the first run. Then, the sample was cooled in 2% CO and 20% O2 to 45 °C with the maximum possible rate using a fan in the heating oven without data collection, the temperature was equilibrated for 5 min in He.
Afterward, the sample was purged with 2% CO and 20% O2 for 15 min at 45 °C, and a second consecutive run was performed by increasing the temperature to 250 °C at a heating rate of 3 °C min−1 and 5 min dwell time at the maximum temperature.
For the preparation of the third run, the sample was again cooled down using the fan in the reactive atmosphere to 100 °C, purged with He for 5 min and then temperature-programmed oxidation was performed in 20% O2 in He to a maximum temperature of 500 °C with a heating rate of 10 °C min−1. The temperature of 500 °C was chosen to mimic the calcination protocol of the SBA-15 templated materials. The maximum temperature was kept constant for 30 min after which the sample was cooled down with the maximum rate using the fan to 45 °C in 20% O2 balanced with He and kept constant for 15 min in He. Afterward, the sample was purged with 2% CO and 20% O2 for 15 min at 45 °C. The third run was performed by increasing the temperature to 250 °C at a heating rate of 3 °C min−1 and a 5 min dwell at the maximum temperature.
An additional experiment on SBA-15 templated Co3O4 was performed under the same conditions regarding heating ramps and pretreatment with the only difference of changing the reactive gas mixture composition from 2% CO and 20% O2 to 2% CO and 1% O2.
The total gas flow in all segments of the catalytic experiment was 80 mLn min−1. The reactor outlet stream was analyzed using a MicroGC (Agilent Technologies 490, Santa Clara, CA, USA) equipped with a 5-Å molecular sieve and a Pora Plot Q column for the detection of CO, O2, and CO2.

4. Conclusions

Co3-xFexO4 spinel catalysts synthesized through nanocasting by using SBA-15 silica as template served as a model system to study the effect of composition in terms of Co:Fe ratio on cobalt spinel catalyst activity. A second comparison was made among the Co3O4 catalysts from different synthesis procedures or sources (hard templating, precipitation, and commercial material) to investigate the role of mesostructure for their activity and formation of ROS during consecutive runs of CO oxidation in the oxidizing atmosphere up to 250 °C. A general negative correlation between increasing Fe content and initial activity in catalytic CO oxidation was found, suggesting that Fe was not involved directly in the active site. When comparing the first and the second run, the formation of ROS upon reaction in a highly oxidizing feed was observed. These ROS were not stable and vanished during further heating and were observed after TPO shown in an even increased activity. The relative activation was composition-dependent in a non-linear manner suggesting that Fe was involved in ROS formation. Comparison of pure Co3O4 samples showed a higher conversion of the SBA-15 templated nanowire catalyst (S500) compared to materials from precipitation followed by calcination (P800) and a commercial material, which was recalcined (C600). P800 showed the lowest surface area, and larger but more uniform sintered particles with a roundish shape than C600, consisting of a mixture of morphologies and sizes. Only for S500, a strong activation in the second run was observed. After TPO, for C600, a clear activation was seen and ROS formation was confirmed by CO2 formation observed in CO-TPR. However, for P800, again, no beneficial effect was observed. This indicates a correlation between particle size and exposed surface area with the capability of ROS formation induced by sample preparation history. The correlation can be explained by a hindered ROS formation on the large particle with low-indexed surface facets and low surface energy. After the three runs of the catalytic reaction, the mesostructure remained unchanged. The reactivity behavior of C600 and its strong dynamics upon TPO is currently studied in more detail to correlate surface structure and activity after different pretreatments to gain more insight into ROS nature and their formation and consumption.

Supplementary Materials

The following are available online at https://www.mdpi.com/article/10.3390/catal11111312/s1, Figure S1: Normalized N2 adsorption–desorption isotherms (a) and normalized BJH pore size distribution (b). Figure S2: Rietveld refinement plots of C600 (a), P800 (b), and S500 (c). Table S1. Criteria of fit for the Rietveld Refinements of the x-ray diffraction patterns of the calcined samples. Figure S3: Comparison of CO conversion and CO2 yield for the SBA-15 templated catalyst series. CO conversion in the 1st run (a). CO2 yield in the 1st run (b). Figure S4: Comparison of CO conversion and CO2 yield for the different Co3O4 catalysts. CO conversion in the 1st run (a). CO2 yield in the 1st run (b). CO conversion in the 2nd run (c). CO2 yield in the 2nd run (d). CO conversion in the 3rd run (e). CO2 yield in the 3rd run (f). Figure S5: Correlation between CO2 formation rate at 100 °C and the cobalt content in the spinel materials. The red circle shows for clarity where a linear correlation between reaction rate and Co content can be observed. Figure S6: CO oxidation activity in the different runs for S500. Figure S7: CO oxidation activity in the different runs for SBA-15 templated Co:Fe 32:1. Figure S8: CO oxidation activity in the different runs for SBA-15 templated Co:Fe 16:1. Figure S9: CO oxidation activity in the different runs for SBA-15 templated Co:Fe 7:1. Figure S10: CO oxidation activity in the different runs for SBA-15 templated Co:Fe 3:1. Figure S11: CO oxidation activity in the different runs for SBA-15 templated CoFe2O4. Figure S12: CO oxidation activity in the different runs for Co3O4 C600. Figure S13: CO oxidation activity in the different runs for Co3O4 P800. Figure S14: Differences in conversion at 75 °C between the 2nd and the 3rd run of CO oxidation. Figure S15: Conversion at 75 °C in the 2nd run compared to the activation between 2nd and 3rd run for the SBA-15 templated materials. Figure S16: CO temperature programmed reduction of C600 without TPO and after TPO showing the evolved CO2 concentration (a) and the temperature in the reactor (b). Figure S17: (a) Initial measurement of 3:1 in the cyclic CO oxidation in 2% CO and 20% O2 in comparison to a new measurement in 2% CO and 1% O2 performed on another setup. Figure S18: (a) SEM image of C600 before catalysis. (b) SEM image of C600 after catalysis. (c) SEM image of C800 before catalysis. (d) TEM image of C800 after catalysis. (e) SEM image of S500 before catalysis. (f) TEM image of S500 after catalysis. Figure S19: XRD patterns of the spent catalysts.

Author Contributions

Conceptualization, H.T. and M.B.; Funding acquisition, H.T. and M.B.; Investigation, M.D., A.R., and E.B.; Methodology, M.D., A.R., and S.N.; Project administration, H.T. and M.B.; Resources, M.D., A.R., and E.B.; Supervision, H.T. and M.B.; Validation, M.D. and E.B.; Visualization, M.D., E.B. and A.R.; Writing—original draft, M.D.; Writing—review and editing, A.R., E.B., K.F.O., S.N., H.T., and M.B. All authors have read and agreed to the published version of the manuscript.

Funding

This work was funded by the Deutsche Forschungsgemeinschaft (DFG, German Research Foundation)—388390466—TRR 247 within the projects A1 and C1. We also acknowledge the financial support from the Mercator Research Center Ruhr (MERCUR, Pe-2018-0034). H.T. thanks Max Planck Society for the basic funding. We acknowledge support by the Open Access Publication Fund of the University of Duisburg-Essen.

Acknowledgments

The authors also acknowledge Kateryna Loza for SEM measurements, Markus Heidelmann, and Thai Binh Nguyen for TEM, and Dietrich Tönnes for XRD measurements. Furthermore, we acknowledge Benjamin Mockenhaupt, Jil Gieser, Noushin Arshadi, and Michael Thelen for BET measurements. Additionally, we thank Sven Anke for calcination of the C600 material.

Conflicts of Interest

The authors declare no conflict of interest.

References

  1. Freund, H.J.; Meijer, G.; Scheffler, M.; Schlögl, R.; Wolf, M. CO oxidation as a prototypical reaction for heterogeneous processes. Angew. Chem. Int. Ed. Engl. 2011, 50, 10064–10094. [Google Scholar] [CrossRef]
  2. Xie, X.; Li, Y.; Liu, Z.Q.; Haruta, M.; Shen, W. Low-temperature oxidation of CO catalysed by Co(3)O(4) nanorods. Nature 2009, 458, 746–749. [Google Scholar] [CrossRef]
  3. Yu, Y.B.; Takei, T.; Ohashi, H.; He, H.; Zhang, X.L.; Haruta, M. Pretreatments of Co3O4 at moderate temperature for CO oxidation at −80 °C. J. Catal. 2009, 267, 121–128. [Google Scholar] [CrossRef]
  4. Royer, S.; Duprez, D. Catalytic Oxidation of Carbon Monoxide over Transition Metal Oxides. ChemCatChem 2011, 3, 24–65. [Google Scholar] [CrossRef]
  5. Thomas, J.; Thomas, N.; Girgsdies, F.; Behrens, M.; Huang, X.; Sudheesh, V.D.; Sebastian, V. Synthesis of cobalt ferrite nanoparticles by constant pH co-precipitation and their high catalytic activity in CO oxidation. N. J. Chem. 2017, 41, 7356–7363. [Google Scholar] [CrossRef] [Green Version]
  6. Busca, G.; Guidetti, R.; Lorenzelli, V. Fourier-transform infrared study of the surface properties of cobalt oxides. J. Chem. Soc. Faraday Trans. 1990, 86. [Google Scholar] [CrossRef]
  7. Finocchio, E.; Willey, R.J.; Busca, G.; Lorenzelli, V. FTIR studies on the selective oxidation and combustion of light hydrocarbons at metal oxide surfaces Part 3.—Comparison of the oxidation of C3 organic compounds over Co3O4, MgCr2O4 and CuO. J. Chem. Soc. Faraday Trans. 1997, 93, 175–180. [Google Scholar] [CrossRef]
  8. Finocchio, E.; Busca, G.; Lorenzelli, V.; Escribano, V.S. FTIR studies on the selective oxidation and combustion of light hydrocarbons at metal oxide surfaces. Part 2.—Propane and propene oxidation on Co3O4. J. Chem. Soc. Faraday Trans. 1996, 92, 1587–1593. [Google Scholar] [CrossRef]
  9. Busca, G.; Daturi, M.; Finocchio, E.; Lorenzelli, V.; Ramis, G.; Willey, R.J. Transition metal mixed oxides as combustion catalysts: Preparation, characterization and activity mechanisms. Catal. Today 1997, 33, 239–249. [Google Scholar] [CrossRef]
  10. Zasada, F.; Janas, J.; Piskorz, W.; Sojka, Z. Surface oxygen dynamics and H2 oxidation on cobalt spinel surface probed by 18O/16O isotopic exchange and accounted for by DFT molecular modeling: Facile interfacial oxygen atoms flipping through transient peroxy intermediate. Res. Chem. Intermed. 2016, 43, 2865–2880. [Google Scholar] [CrossRef] [Green Version]
  11. Zasada, F.; Janas, J.; Piskorz, W.; Gorczynska, M.; Sojka, Z. Total Oxidation of Lean Methane over Cobalt Spinel Nanocubes Controlled by the Self-Adjusted Redox State of the Catalyst: Experimental and Theoretical Account for Interplay between the Langmuir-Hinshelwood and Mars-Van Krevelen Mechanisms. ACS Catal. 2017, 7, 2853–2867. [Google Scholar] [CrossRef]
  12. Zasada, F.; Grybos, J.; Budiyanto, E.; Janas, J.; Sojka, Z. Oxygen species stabilized on the cobalt spinel nano-octahedra at various reaction conditions and their role in catalytic CO and CH4 oxidation, N2O decomposition and oxygen isotopic exchange. J. Catal. 2019, 371, 224–235. [Google Scholar] [CrossRef]
  13. Liu, Y.; Peng, Y.; Naschitzki, M.; Gewinner, S.; Schollkopf, W.; Kuhlenbeck, H.; Pentcheva, R.; Roldan Cuenya, B. Surface oxygen Vacancies on Reduced Co3 O4 (100): Superoxide Formation and Ultra-Low-Temperature CO Oxidation. Angew. Chem. Int. Ed. 2021, 60, 16514–16520. [Google Scholar] [CrossRef] [PubMed]
  14. Teng, Y.; Kusano, Y.; Azuma, M.; Haruta, M.; Shimakawa, Y. Morphology effects of Co3O4 nanocrystals catalyzing CO oxidation in a dry reactant gas stream. Catal. Sci. Technol. 2011, 1, 920–922. [Google Scholar] [CrossRef]
  15. Gu, D.; Jia, C.J.; Weidenthaler, C.; Bongard, H.J.; Spliethoff, B.; Schmidt, W.; Schüth, F. Highly Ordered Mesoporous Cobalt-Containing Oxides: Structure, Catalytic Properties, and Active Sites in Oxidation of Carbon Monoxide. J. Am. Chem. Soc. 2015, 137, 11407–11418. [Google Scholar] [CrossRef]
  16. Anke, S.; Bendt, G.; Sinev, I.; Hajiyani, H.; Antoni, H.; Zegkinoglou, I.; Jeon, H.; Pentcheva, R.; Roldan Cuenya, B.; Schulz, S.; et al. Selective 2-Propanol Oxidation over Unsupported Co3O4 Spinel Nanoparticles: Mechanistic Insights into Aerobic Oxidation of Alcohols. ACS Catal. 2019, 9, 5974–5985. [Google Scholar] [CrossRef]
  17. Lukashuk, L.; Yigit, N.; Rameshan, R.; Kolar, E.; Teschner, D.; Havecker, M.; Knop-Gericke, A.; Schlögl, R.; Föttinger, K.; Rupprechter, G. Operando Insights into CO Oxidation on Cobalt Oxide Catalysts by NAP-XPS, FTIR, and XRD. ACS Catal. 2018, 8, 8630–8641. [Google Scholar] [CrossRef]
  18. Dreyer, M.; Krebs, M.; Najafishirtari, S.; Rabe, A.; Friedel Ortega, K.; Behrens, M. The Effect of Co Incorporation on the CO Oxidation Activity of LaFe1−xCoxO3 Perovskites. Catalysts 2021, 11, 550. [Google Scholar] [CrossRef]
  19. Hu, L.H.; Sun, K.Q.; Peng, Q.; Xu, B.Q.; Li, Y.D. Surface Active Sites on Co3O4 Nanobelt and Nanocube Model Catalysts for CO Oxidation. Nano Res. 2010, 3, 363–368. [Google Scholar] [CrossRef] [Green Version]
  20. Yang, J.; Guo, J.; Wang, Y.B.; Wang, T.; Gu, J.; Peng, L.M.; Xue, N.H.; Zhu, Y.; Guo, X.F.; Ding, W.P. Reduction-oxidation pretreatment enhanced catalytic performance of Co3O4/Al2O3 over CO oxidation. Appl. Surf. Sci. 2018, 453, 330–335. [Google Scholar] [CrossRef]
  21. Jansson, J.; Palmqvist, A.E.C.; Fridell, E.; Skoglundh, M.; Osterlund, L.; Thormahlen, P.; Langer, V. On the catalytic activity of Co3O4 in low-temperature CO oxidation. J. Catal. 2002, 211, 387–397. [Google Scholar] [CrossRef]
  22. Chakrapani, K.; Bendt, G.; Hajiyani, H.; Lunkenbein, T.; Greiner, M.T.; Masliuk, L.; Salamon, S.; Landers, J.; Schlögl, R.; Wende, H.; et al. The Role of Composition of Uniform and Highly Dispersed Cobalt Vanadium Iron Spinel Nanocrystals for Oxygen Electrocatalysis. ACS Catal. 2018, 8, 1259–1267. [Google Scholar] [CrossRef]
  23. Büker, J.; Alkan, B.; Fu, Q.; Xia, W.; Schulwitz, J.; Waffel, D.; Falk, T.; Schulz, C.; Wiggers, H.; Muhler, M.; et al. Selective cyclohexene oxidation with O2, H2O2 and tert-butyl hydroperoxide over spray-flame synthesized LaCo1−xFexO3 nanoparticles. Catal. Sci. Technol. 2020, 10, 5196–5206. [Google Scholar] [CrossRef]
  24. Waffel, D.; Alkan, B.; Fu, Q.; Chen, Y.T.; Schmidt, S.; Schulz, C.; Wiggers, H.; Muhler, M.; Peng, B. Towards Mechanistic Understanding of Liquid-Phase Cinnamyl Alcohol Oxidation with tert-Butyl Hydroperoxide over Noble-Metal-Free LaCo1-x Fex O3 Perovskites. ChemPlusChem 2019, 84, 1155–1163. [Google Scholar] [CrossRef] [PubMed] [Green Version]
  25. Waag, F.; Gökce, B.; Kalapu, C.; Bendt, G.; Salamon, S.; Landers, J.; Hagemann, U.; Heidelmann, M.; Schulz, S.; Wende, H.; et al. Adjusting the catalytic properties of cobalt ferrite nanoparticles by pulsed laser fragmentation in water with defined energy dose. Sci. Rep. 2017, 7, 13161. [Google Scholar] [CrossRef] [PubMed] [Green Version]
  26. Chakrapani, K.; Bendt, G.; Hajiyani, H.; Schwarzrock, I.; Lunkenbein, T.; Salamon, S.; Landers, J.; Wende, H.; Schlögl, R.; Pentcheva, R.; et al. Role of Composition and Size of Cobalt Ferrite Nanocrystals in the Oxygen Evolution Reaction. ChemCatChem 2017, 9, 2988–2995. [Google Scholar] [CrossRef]
  27. Anke, S.; Falk, T.; Bendt, G.; Sinev, I.; Havecker, M.; Antoni, H.; Zegkinoglou, I.; Jeon, H.; Knop-Gericke, A.; Schlögl, R.; et al. On the reversible deactivation of cobalt ferrite spinel nanoparticles applied in selective 2-propanol oxidation. J. Catal. 2020, 382, 57–68. [Google Scholar] [CrossRef]
  28. Friedel Ortega, K.; Anke, S.; Salamon, S.; Özcan, F.; Heese, J.; Andronescu, C.; Landers, J.; Wende, H.; Schuhmann, W.; Muhler, M.; et al. Topotactic Synthesis of Porous Cobalt Ferrite Platelets from a Layered Double Hydroxide Precursor and Their Application in Oxidation Catalysis. Chemistry 2017, 23, 12443–12449. [Google Scholar] [CrossRef] [Green Version]
  29. Budiyanto, E.; Zerebecki, S.; Weidenthaler, C.; Kox, T.; Kenmoe, S.; Spohr, E.; DeBeer, S.; Rüdiger, O.; Reichenberger, S.; Barcikowski, S.; et al. Impact of Single-Pulse, Low-Intensity Laser Post-Processing on Structure and Activity of Mesostructured Cobalt Oxide for the Oxygen Evolution Reaction. ACS Appl. Mater. Interfaces 2021. [Google Scholar] [CrossRef]
  30. Alkan, B.; Medina, D.; Landers, J.; Heidelmann, M.; Hagemann, U.; Salamon, S.; Andronescu, C.; Wende, H.; Schulz, C.; Schuhmann, W.; et al. Spray-Flame-Prepared LaCo1-xFexO3 Perovskite Nanoparticles as Active OER Catalysts: Influence of Fe Content and Low-Temperature Heating. ChemElectroChem 2020, 7, 2564–2574. [Google Scholar] [CrossRef]
  31. Alkan, B.; Cychy, S.; Varhade, S.; Muhler, M.; Schulz, C.; Schuhmann, W.; Wiggers, H.; Andronescu, C. Spray-Flame-Synthesized LaCo1-xFexO3 Perovskite Nanoparticles as Electrocatalysts for Water and Ethanol Oxidation. ChemElectroChem 2019, 6, 4266–4274. [Google Scholar] [CrossRef] [Green Version]
  32. Angel, S.; Neises, J.; Dreyer, M.; Friedel Ortega, K.; Behrens, M.; Wang, Y.; Arandiyan, H.; Schulz, C.; Wiggers, H. Spray-flame synthesis of La(Fe, Co)O3 nano-perovskites from metal nitrates. AlChE J. 2019, 66, 441. [Google Scholar] [CrossRef] [Green Version]
  33. Bahlawane, N.; Ngamou, P.H.; Vannier, V.; Kottke, T.; Heberle, J.; Kohse-Hoinghaus, K. Tailoring the properties and the reactivity of the spinel cobalt oxide. Phys. Chem. Chem. Phys. 2009, 11, 9224–9232. [Google Scholar] [CrossRef] [PubMed]
  34. Budiyanto, E.; Yu, M.Q.; Chen, M.M.; DeBeer, S.; Rudiger, O.; Tüysüz, H. Tailoring Morphology and Electronic Structure of Cobalt Iron Oxide Nanowires for Electrochemical Oxygen Evolution Reaction. ACS Appl. Energy Mater. 2020, 3, 8583–8594. [Google Scholar] [CrossRef]
  35. Falk, T.; Budiyanto, E.; Dreyer, M.; Pflieger, C.; Waffel, D.; Büker, J.; Weidenthaler, C.; Ortega, K.F.; Behrens, M.; Tüysüz, H.; et al. Identification of Active Sites in the Catalytic Oxidation of 2-Propanol over Co1+xFe2–xO4 Spinel Oxides at Solid/Liquid and Solid/Gas Interfaces. ChemCatChem 2021, 13, 2942–2951. [Google Scholar] [CrossRef]
  36. Waffel, D.; Budiyanto, E.; Porske, T.; Büker, J.; Falk, T.; Fu, Q.; Schmidt, S.; Tüysüz, H.; Muhler, M.; Peng, B.X. Investigation of Synergistic Effects between Co and Fe in Co3-xFexO4 Spinel Catalysts for the Liquid-Phase Oxidation of Aromatic Alcohols and Styrene. Mol. Catal. 2020, 498, 111251. [Google Scholar] [CrossRef]
  37. Wang, X.T.; Ouyang, T.; Wang, L.; Zhong, J.H.; Ma, T.; Liu, Z.Q. Redox-Inert Fe(3+) Ions in Octahedral Sites of Co-Fe Spinel Oxides with Enhanced Oxygen Catalytic Activity for Rechargeable Zinc-Air Batteries. Angew. Chem. Int. Ed. 2019, 58, 13291–13296. [Google Scholar] [CrossRef] [PubMed]
  38. Thommes, M. Physical Adsorption Characterization of Nanoporous Materials. Chem. Ing. Tech. 2010, 82, 1059–1073. [Google Scholar] [CrossRef]
  39. Thommes, M.; Kaneko, K.; Neimark, A.V.; Olivier, J.P.; Rodriguez-Reinoso, F.; Rouquerol, J.; Sing, K.S.W. Physisorption of gases, with special reference to the evaluation of surface area and pore size distribution (IUPAC Technical Report). Pure Appl. Chem. 2015, 87, 1051–1069. [Google Scholar] [CrossRef] [Green Version]
  40. Neimark, A.V.; Sing, K.S.W.; Thommes, M. Surface Area and Porosity. In Handbook of Heterogeneous Catalysis; Wiley-VCH Verlag GmbH & Co. KGaA: Weinheim, Germany, 2008; pp. 721–738. [Google Scholar]
  41. Rabe, A.; Büker, J.; Salamon, S.; Koul, A.; Hagemann, U.; Landers, J.; Ortega, K.F.; Peng, B.; Muhler, M.; Wende, H.; et al. The Roles of Composition and Mesostructure of Cobalt-based Spinel Catalysts in Oxygen Evolution Reactions. Chem. Eur. J. 2021. [Google Scholar] [CrossRef]
  42. Kotousova, I.; Polyakov, S. Electron-diffraction study of Co3O4. Kristallografiya 1972, 17, 661–663. [Google Scholar]
  43. Rietveld, H.M. Line Profiles of Neutron Powder-Diffraction Peaks for Structure Refinement. Acta Crystallogr. 1967, 22, 151. [Google Scholar] [CrossRef]
  44. Wang, H.F.; Kavanagh, R.; Guo, Y.L.; Guo, Y.; Lu, G.Z.; Hu, P. Origin of extraordinarily high catalytic activity of Co3O4 and its morphological chemistry for CO oxidation at low temperature. J. Catal. 2012, 296, 110–119. [Google Scholar] [CrossRef]
  45. Tüysuz, H.; Comotti, M.; Schüth, F. Ordered mesoporous Co3O4 as highly active catalyst for low temperature CO-oxidation. Chem. Commun. 2008, 34, 4022–4024. [Google Scholar] [CrossRef] [PubMed]
  46. Zasada, F.; Piskorz, W.; Janas, J.; Budiyanto, E.; Sojka, Z. Dioxygen Activation Pathways over Cobalt Spinel Nanocubes—From Molecular Mechanism into Ab Initio Thermodynamics and 16O2/18O2 Exchange Microkinetics. J. Phys. Chem. C 2017, 121, 24128–24143. [Google Scholar] [CrossRef]
  47. Jia, C.J.; Schwickardi, M.; Weidenthaler, C.; Schmidt, W.; Korhonen, S.; Weckhuysen, B.M.; Schüth, F. Co3O4-SiO2 nanocomposite: A very active catalyst for CO oxidation with unusual catalytic behavior. J. Am. Chem. Soc. 2011, 133, 11279–11288. [Google Scholar] [CrossRef] [Green Version]
Figure 1. (a) XRD patterns of C600, P800, and S500. (b) SEM image of C600, different size particles are indicated exemplarily by the use of red (large particles), light blue (medium size), yellow (small), and dark blue (very small) arrows. (c) SEM image of P800. (d) TEM micrograph of S500.
Catalysts 11 01312 g001
Figure 2. (a) Temperature-programmed CO oxidation activation of the SBA-15 templated pristine Co3O4, CoFe2O4, and Fe incorporation series in the 1st run. (b) Temperature-programmed CO oxidation activity of the different Co oxide samples in the 1st run.
Catalysts 11 01312 g002
Figure 3. (a) Temperature-programmed CO oxidation rates of the investigated catalysts in the 1st run. SBA-15-templated Fe incorporation series is shown as a zoom-in insert for better visibility. (b) Temperature-programmed CO oxidation activity of the different Co oxide samples in the 1st run.
Catalysts 11 01312 g003
Figure 4. (a) Temperature-programmed CO oxidation activation of the SBA-15 templated Fe incorporation series in the 2nd run. (b) Temperature-programmed CO oxidation activity of the different Co oxide samples in the 2nd run.
Catalysts 11 01312 g004
Figure 5. (a) Temperature-programmed CO oxidation activation of the SBA-15 templated Fe incorporation series in the 3rd run. (b) Temperature-programmed CO oxidation activity of the different Co3O4 samples in the 3rd run.
Catalysts 11 01312 g005
Figure 6. (a) Difference in conversion at 75 °C between the 1st and 2nd/3rd run (ΔY75°C) of CO oxidation for all catalysts. Please note that the conversion of S500 is 90% during the 2nd run, which is why it cannot be excluded that the improvement of this sample is to some extent limited by approaching full conversion, and the data point is shown as a hollow symbol. (b) CO oxidation activity of S500 in all runs for feed compositions 2% CO and 20% O2 and 2% CO and 1% O2.
Catalysts 11 01312 g006
Table 1. BET surface areas of the catalysts used for catalytic testing.
SampleSABET/m2 g−1
Co3O4 S500 (SBA-15 templated)107
Co:Fe 32:1 (SBA-15 templated)118
Co:Fe 16:1 (SBA-15 templated)103
Co:Fe 7:1 (SBA-15 templated)113
Co:Fe 3:1 (SBA-15 templated)125
CoFe2O4 (SBA-15 templated)178
Co3O4 C600 (commercial)9
Co3O4 P800 (precipitated)2
Publisher’s Note: MDPI stays neutral with regard to jurisdictional claims in published maps and institutional affiliations.

