Article

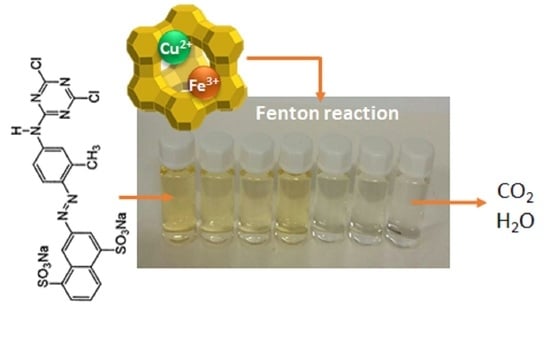
Fenton-Type Bimetallic Catalysts for Degradation of Dyes in Aqueous Solutions

by
Bebiana L. C. Santos
1,2,
Pier Parpot
1,3,
Olívia S. G. P. Soares
4,
Manuel F. R. Pereira
4,
Elisabetta Rombi
5,
António M. Fonseca
1,3,* and
Isabel Correia Neves
1,3,*
1
CQUM, Centro de Química, Departamento de Química, Universidade do Minho, Campus de Gualtar, 4710-057 Braga, Portugal
2
Departamento de Química, Faculdade de Ciências, Universidade Agostinho Neto, Av. 4 de Fevereiro, 71, Luanda, Angola
3
CEB, Centre of Biological Engineering, Universidade do Minho, Campus de Gualtar, 4710-057 Braga, Portugal
4
Laboratório Associado LSRE-LCM, Departamento de Engenharia Química, Faculdade de Engenharia, Universidade do Porto, Rua Dr. Roberto Frias, 4200-465 Porto, Portugal
5
Dipartimento di Scienze Chimiche e Geologiche, Università di Cagliari, Complesso Universitario di Monserrato, S.S. 554 bivio Sestu, 09042 Monserrato, Italy
*
Authors to whom correspondence should be addressed.
Catalysts 2021, 11(1), 32; https://doi.org/10.3390/catal11010032
Submission received: 30 November 2020 / Revised: 18 December 2020 / Accepted: 24 December 2020 / Published: 30 December 2020

Abstract

:
Dye compounds are becoming a problematic class of pollutants for the environment, so it is important to develop stable catalysts for their elimination. First, several studies were performed with different Y zeolites (NaY, (NH4)Y and USY) in order to select the best support for the preparation of the bimetallic catalysts. In particular, NaY zeolite was used as the support for Fe, Cu and Mn metals to prepare mono and bimetallic Fenton-type catalysts by the ion exchange method. The catalysts were characterized by several techniques, such as chemical analysis, nitrogen physisorption, X-ray diffraction (XRD), scanning electron microscopy (SEM) and cyclic voltammetry studies. Characterization results revealed that the metals were successfully ion-exchanged within the NaY zeolite. The prepared catalysts were tested for the aqueous-phase degradation of dye compounds (Procion yellow (PY) and Tartrazine (Tar)) at atmospheric pressure and different temperatures, using H2O2 as the oxidant. All the investigated samples were found to be active in degrading the dyes through the Fenton-type process; however, the oxidation rate was found to be higher in the presence of the bimetallic catalysts. CuFe-NaY displays the best mineralization rate for PY oxidation while MnFe-NaY shows the highest activity for Tar degradation. This work may provide further insight into the design of Fenton-type bimetallic catalysts with improved catalytic properties for environmental remediation.

Graphical Abstract

1. Introduction

The discharge of dyes into water resources, in addition to unaesthetic effects, has far more dangerous repercussions on health, since some of them are carcinogenic and mutagenic; this is why their removal from the environment is a very important issue. In this light, the degradation of these pollutants by effective and economical treatments, such as the advanced oxidation processes (AOPs), has attracted a great and continuous interest [1,2,3,4,5,6]. Among AOPs, the heterogeneous Fenton-like processes have been paid great attention for their low cost, high efficiency, and mild conditions (20–50 °C and atmospheric pressure) [6,7,8]. Recently, several heterogeneous Fenton-like catalysts containing iron supported on zeolites [8,9] or iron and copper supported on mesostructured silica [10] have been reported to be efficient catalytic systems for oxidative degradation reactions. In the presence of iron-containing ZSM-5 zeolite, degradation of acetic acid was found to accelerate in acidic medium with the increase in temperature [8] and 2,4,6-tribromophenol was completely mineralized on an iron-containing natural zeolite when NH2OH and H2O2 were sequentially added to the reaction mixture at pH 5 [9]. Finally, 83% of N,N-diethyl-p-phenyl diamine was degraded after 120 min on a Fe-Cu/SBA-15 bimetallic catalyst by using H2O2 as the oxidant, in aqueous solution [10]. Different authors using mono or bimetallic catalysts [11,12,13,14] also studied the decomposition of azo compounds. An almost complete degradation (98%) of Acid Orange II (AOII) was observed after 1 h of reaction in the presence of bimetallic iron-copper nanoparticles supported on carbon nanofibers [12]. Iron-exchanged ultra-stable Y zeolites were investigated in the Fenton reaction for degrading Reactive Yellow 84, and the catalyst with a SiO2/Al2O3 ratio equal to 11.5 mol/mol (Fe-Y11.5) was found to be able to remove 97% of color, 71% of COD (Carbon Oxygen Demand), and 35% of TOC (Total Organic Carbon) after 60 min of oxidation in mild conditions [14]. Moreover, the successful use of a NaY-supported iron catalyst in the Orange II dye (OII) degradation was reported in [11], where the effect of different operating parameters as well as the kinetics were also investigated.
This work deals with the study of azo dyes degradation by the heterogeneous Fenton-like process using metal zeolite catalysts. Two dyes, Procion yellow (PY) and Tartrazine (Tar) (Scheme 1), were investigated: the first (also known as Reactive Yellow 4) is used in the textile industry [15] while the second (a synthetic lemon yellow azo dye identified as E102) is primarily used as a food coloring [16]. Mono and bimetallic materials, prepared by loading the metals (Fe, Cu, and Mn) on NaY through the ion-exchange method, were used as heterogeneous catalysts for the aqueous-phase degradation of the dyes. Catalytic runs were performed in a semi-batch reactor operating at room temperature and atmospheric pressure. Preliminary tests were performed using different Y zeolites (NaY, (NH4)Y and (NH4)USY) as supports for iron in order to choose the best zeolite carrier, on which the Fe content, as well as the reaction conditions were optimized before investigating the effect of the second metal component.
From our best knowledge, the studies using bimetallic catalysts based in zeolites for Fenton processes are scarce. This work provides an alternative route for obtaining stable and efficient catalysts with a lower amount of iron, which reduced its contamination of the sewage sludge [11,14]. These bimetallic catalysts based in zeolites have been shown to have potential application in the treatment of effluents.

2. Results and Discussion

The aqueous-phase degradation of the two dye compounds, Procion Yellow (PY) and Tartrazine (Tar), whose solubility in water is due to the presence of the –SO3Na groups (Scheme 1), was first studied on monometallic Fenton-type catalysts based on Fe supported on different Y zeolite, that is, NaY, (NH4)Y (Y), and (NH4)USY (USY), with the aim of choosing the best zeolite support and optimizing the content of Fe, whose presence in the Fenton reaction is important due to the formation of the Fe3+/Fe2+ pair that is responsible for the formation of HO radicals [11,17].
Before the catalytic tests, experiments using only the oxidant (without any kind of catalyst), NaY and NaY/H2O2 were also performed (results not shown) to check the possibility of dye adsorption and/or oxidation over the parent NaY zeolite using PY and preserved the other variables constants (VDye = 250 mL, C0 = 30 ppm, CH2O2 = 0 or 12 mM, initial pH = 3.00, reaction time = 360 min and TR = 40 °C). It was concluded that NaY presents a low performance both for dye adsorption and oxidation, with only 5% and 8% of dye being degraded, in the presence of NaY or NaY/H2O2, respectively.

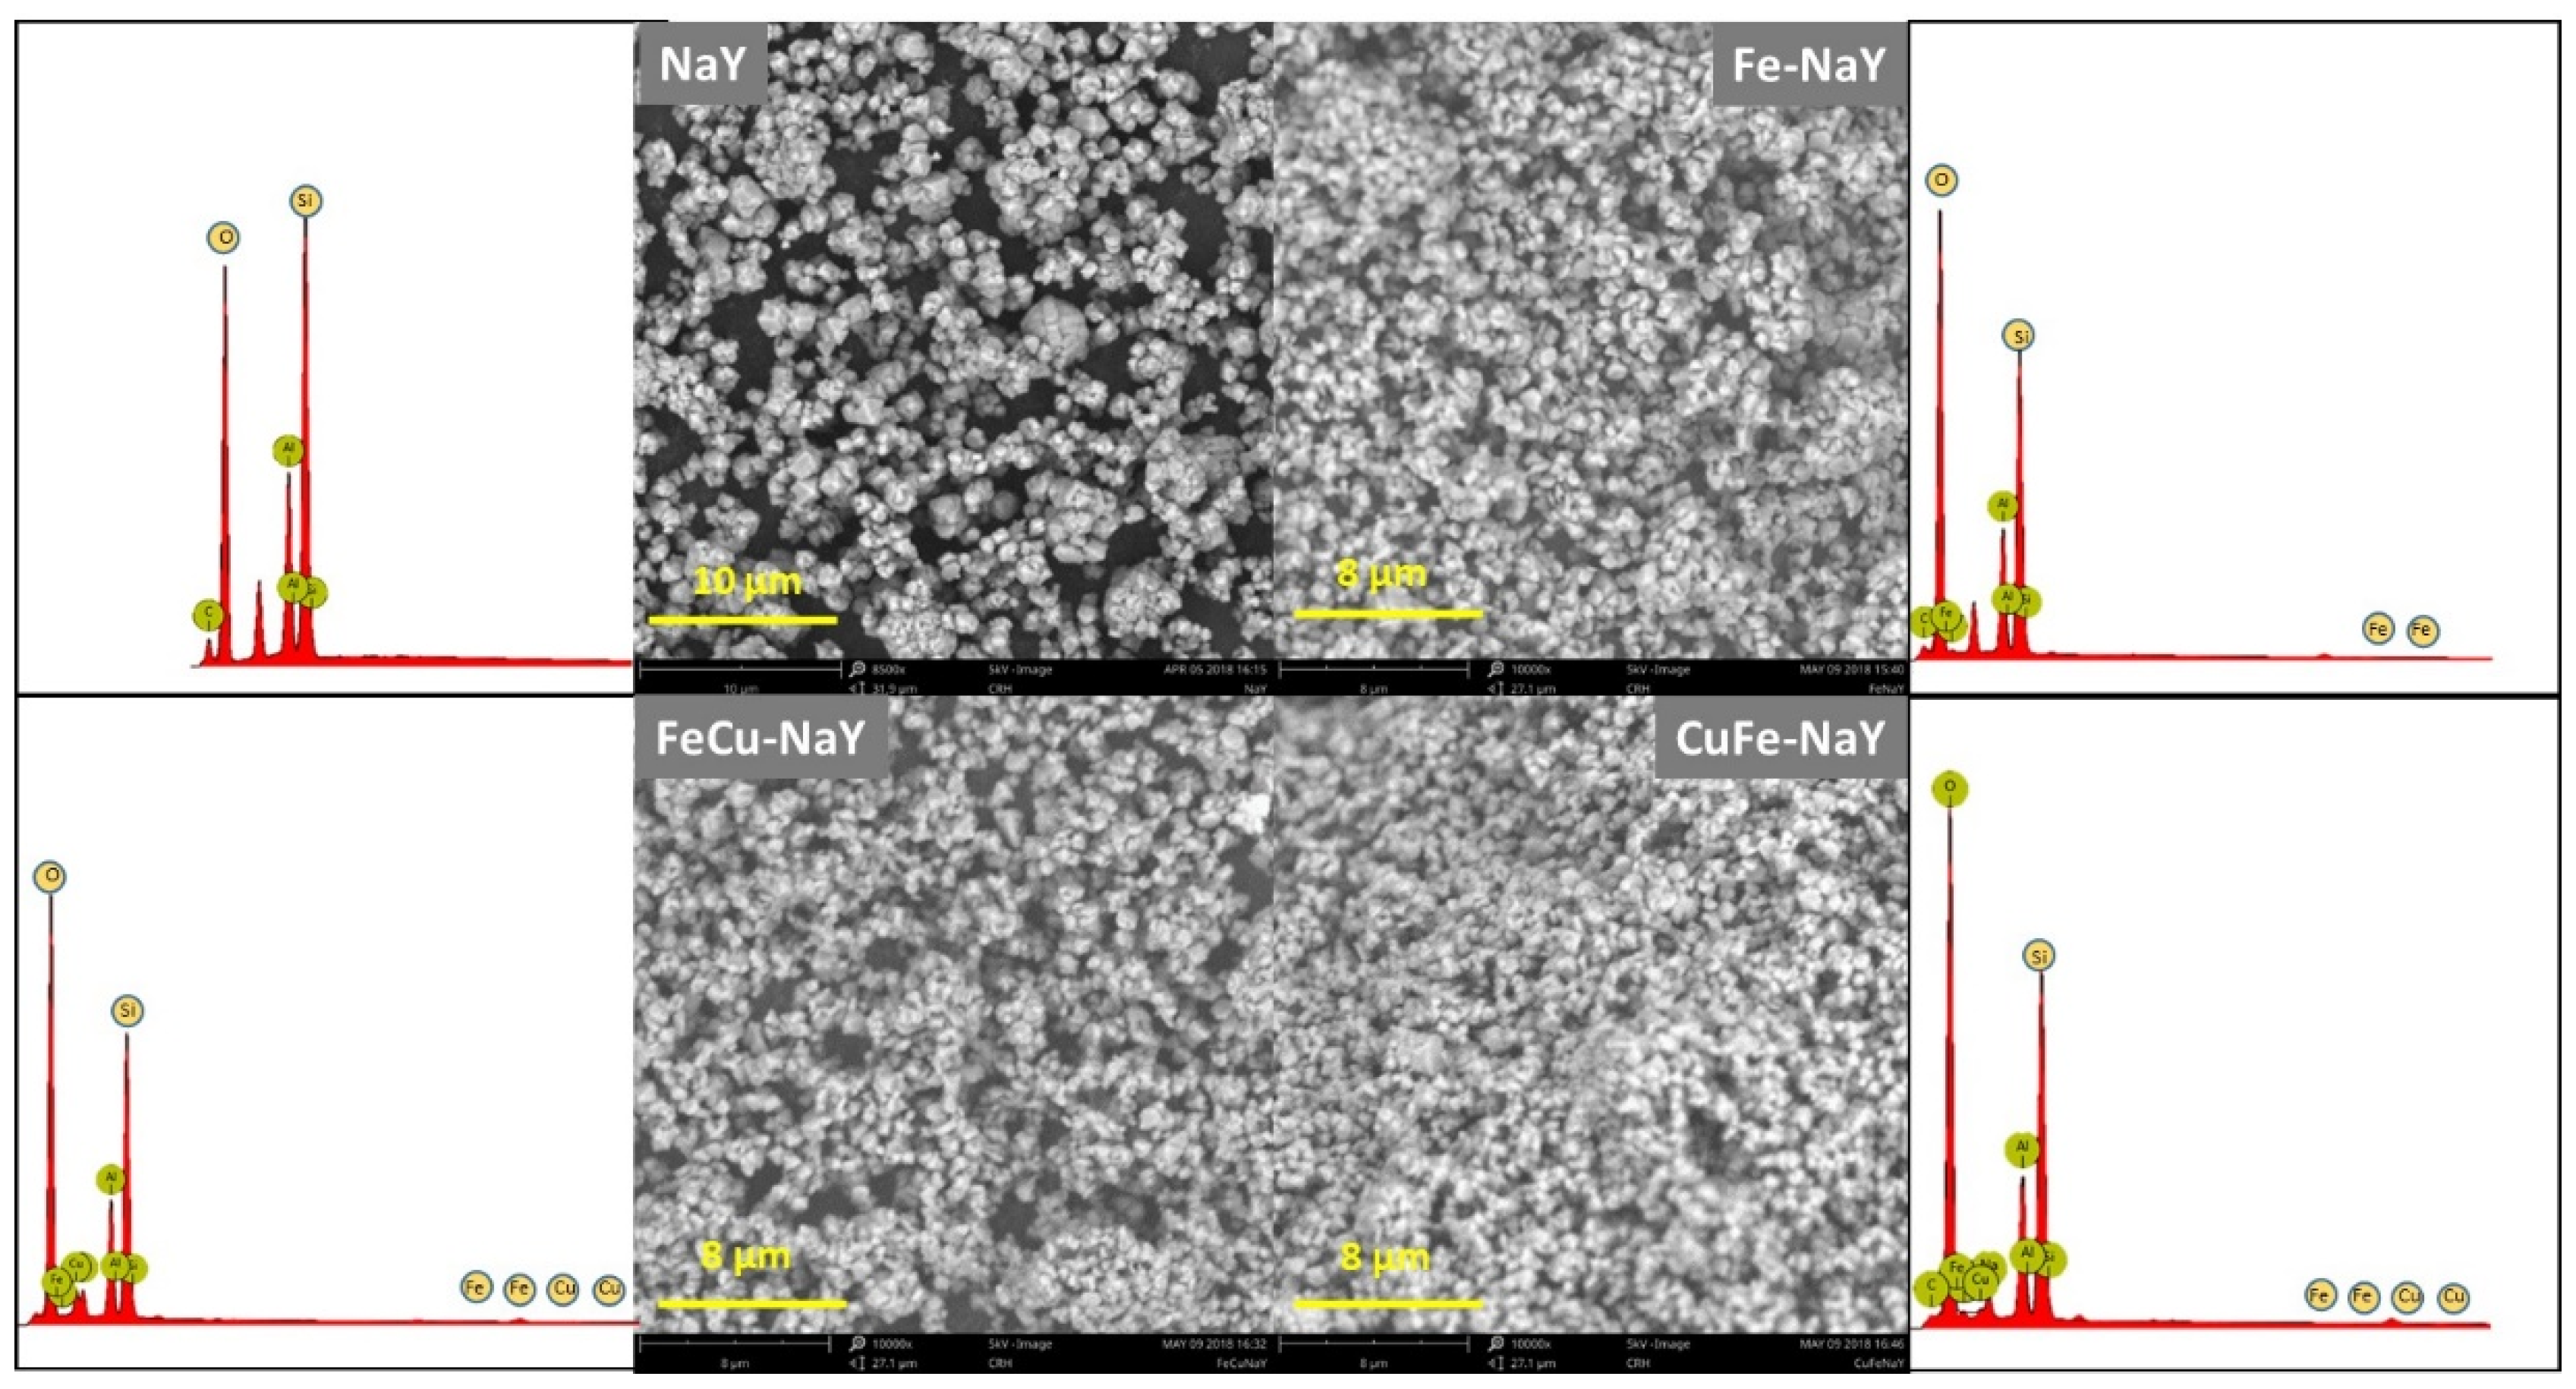
2.1. Selection of the Parent Zeolite Support

Chemical analyses were performed on the Y-supported Fe catalysts to determine the framework Si/Al ratio, which was found equal to 3.39, 3.22 and 4.50 for Fe-NaY, Fe-Y and Fe-USY, respectively. These values are higher than those of the parent zeolites (Section 3.1), denoting a certain degree of dealumination, as a consequence of the ion-exchange process. The amount of iron, determined by inductively coupled plasma atomic emission spectroscopy (ICP-AES), was equal to 10.0, 9.3, and 4.5 wt% for Fe-NaY, Fe-Y and Fe-USY, respectively. The lower Fe content of Fe-USY may be explained by the higher dealumination extent which occurred on this sample.
Figure 1 displays the XRD patterns of the monometallic catalysts. The comparison between the XRD patterns of the Fe-containing samples and the Y-supports showed that the faujasite zeolite structure is to some extent affected by iron introduction. Indeed, an estimation of the relative crystallinity through the standard ASTM (American Society for Testing Materials) D-3906-80 method, using NaY as the reference (100% crystalline, Figure S1), gave crystallinity degrees of 95%, 80%, and 55% for Fe-NaY, Fe-USY, and Fe-Y, respectively.
These catalysts were tested for the degradation of Tar at 35 °C, using the following experimental conditions: 50 mg of catalyst, 250 mL of the dye solution (30 ppm), 5 mL of H2O2 12 mM, pH 3.0. The obtained results are summarized in Figure 2. The evolution of the relative Tar concentration of Tar (C/C0) as a function of reaction time (Figure 2A) suggests that the Fe content affects the catalytic performance, the worst degradation efficiency being shown by the Fe-USY catalyst, which contains the lowest amount of iron.
The UV-vis absorption spectra (200–500 nm) of the initial Tar solution and of liquid samples collected at different times (Figure 2B) show a marked decrease in the absorbance of the dye and in the original color of the solution, which at the end became colorless, confirming the degradation of the dye during the Fenton reaction on the Fe10-NaY catalyst and suggesting the possible formation of products with relatively few conjugated groups.
In order to prevent the higher concentration of iron, which leads to the decline in catalytic activity for oxidation [9], a NaY-supported catalyst with a nominal content of iron equal to 1 wt% (Fe1-NaY) was prepared and its activity was compared with that of Fe10-NaY in the catalytic degradation of both dyes at 40 °C. As expected, Fe10-NaY (with the higher amount of iron) show the best performance in degrading both dyes (Figure 3). Despite the last results, Fe1-NaY was chosen as the support for preparing the bimetallic catalysts.

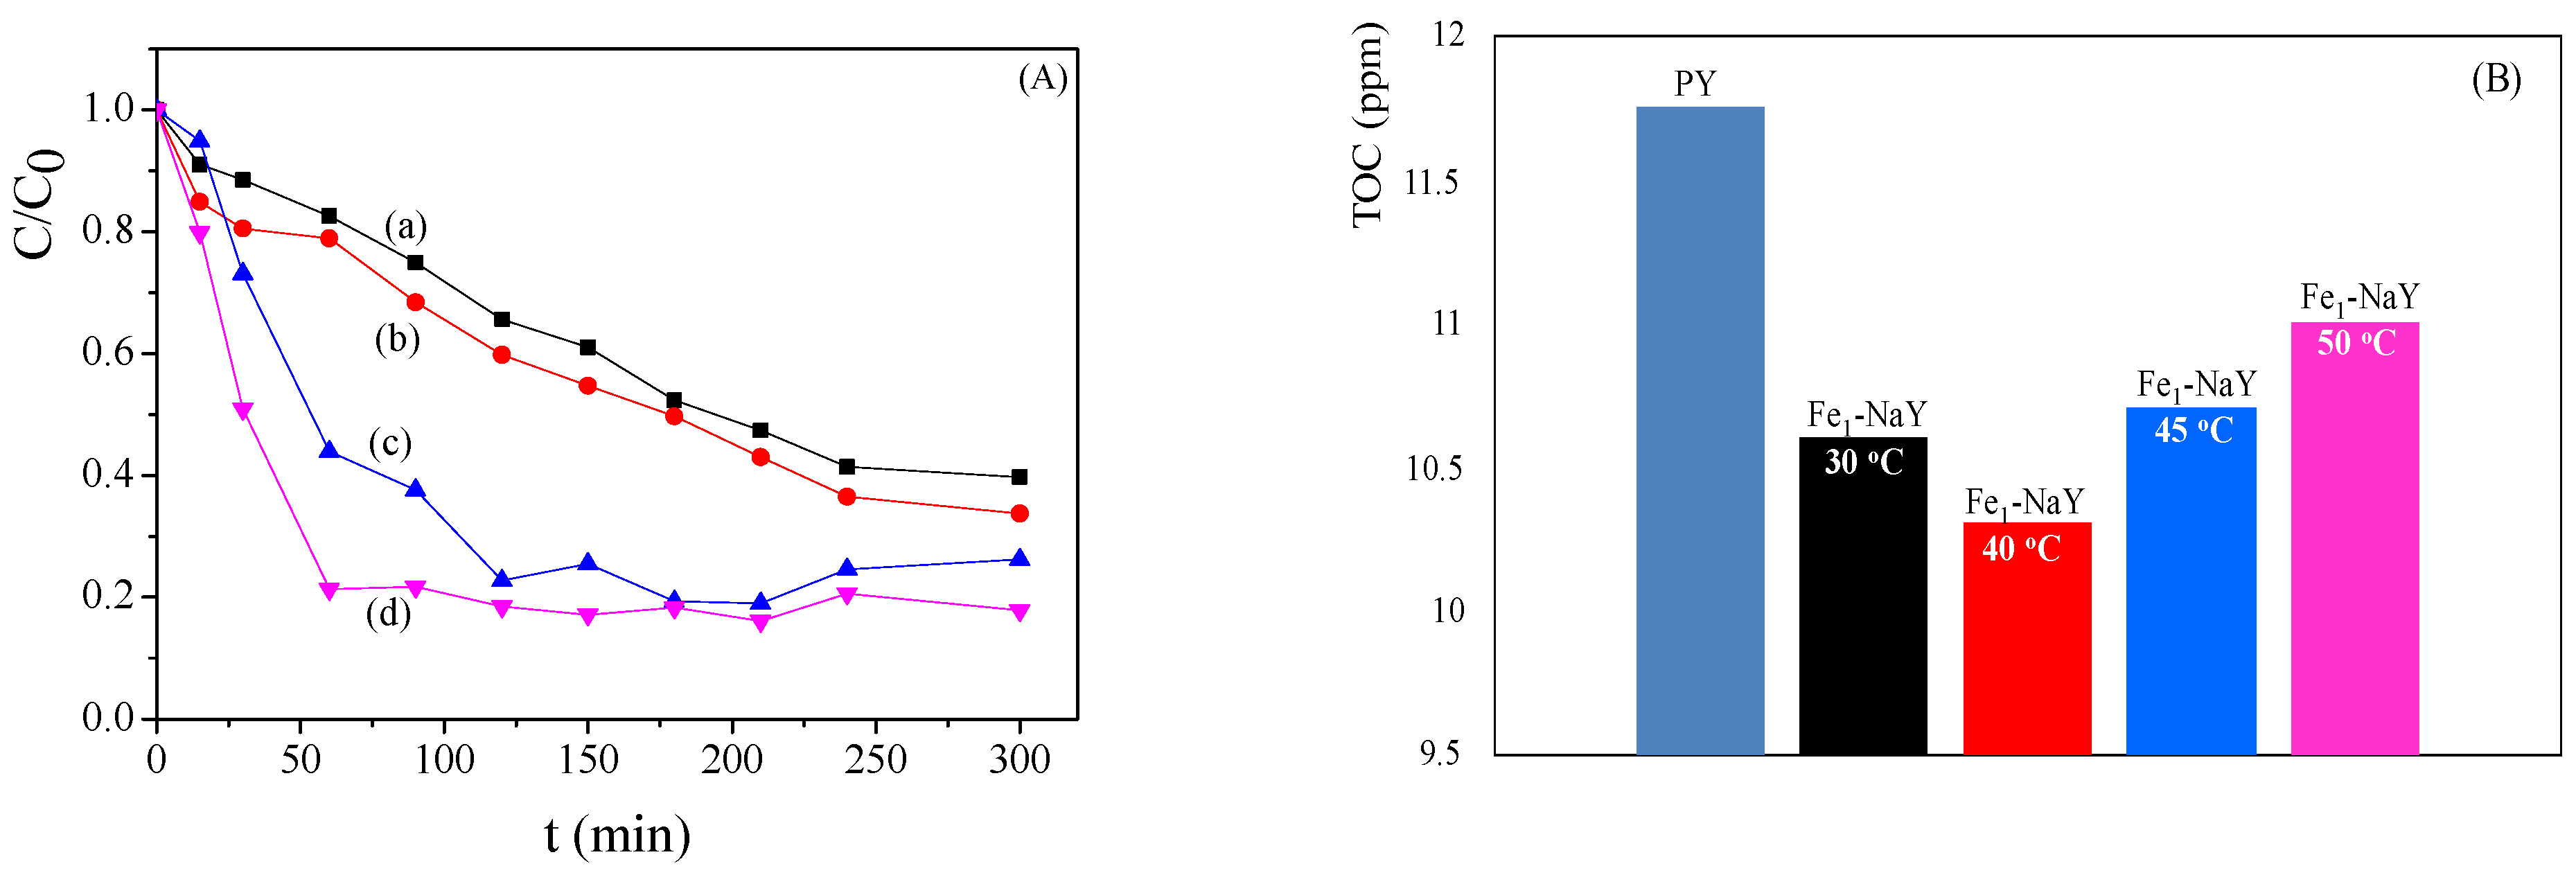
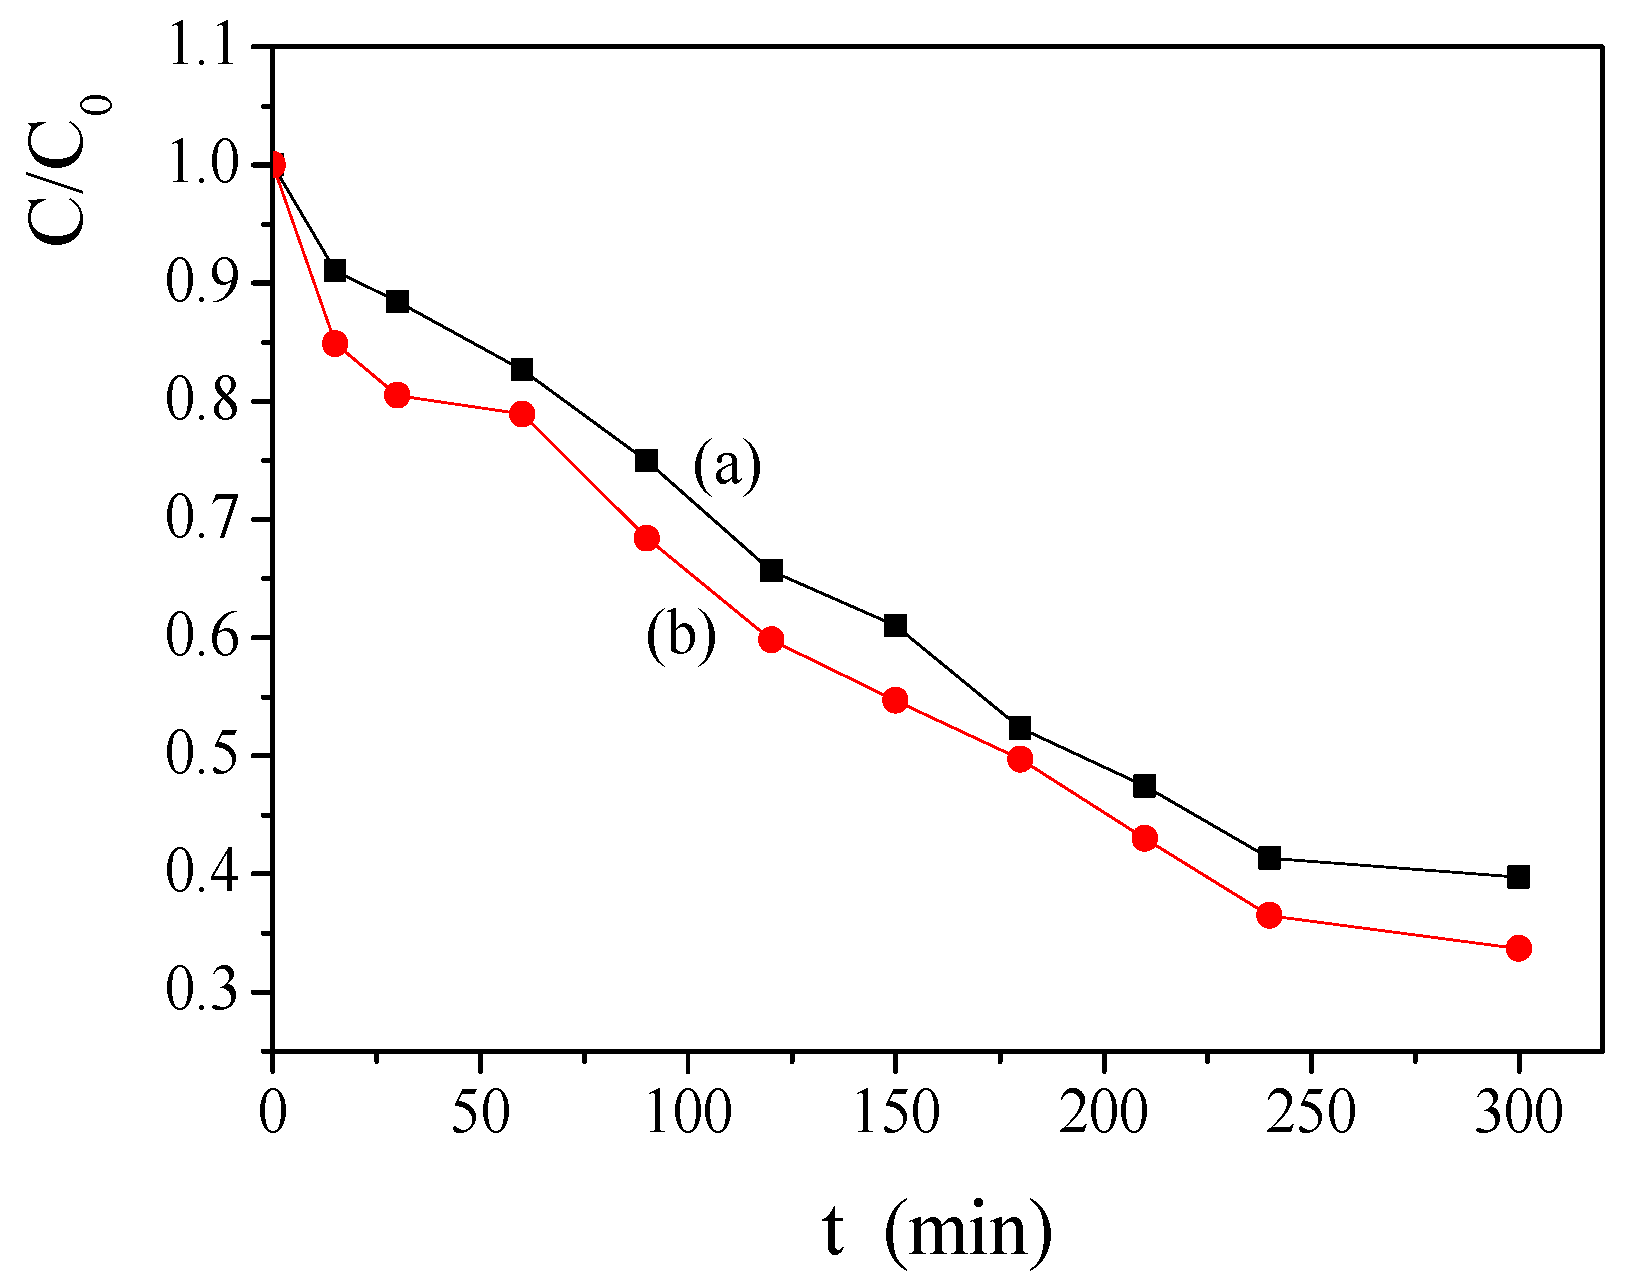
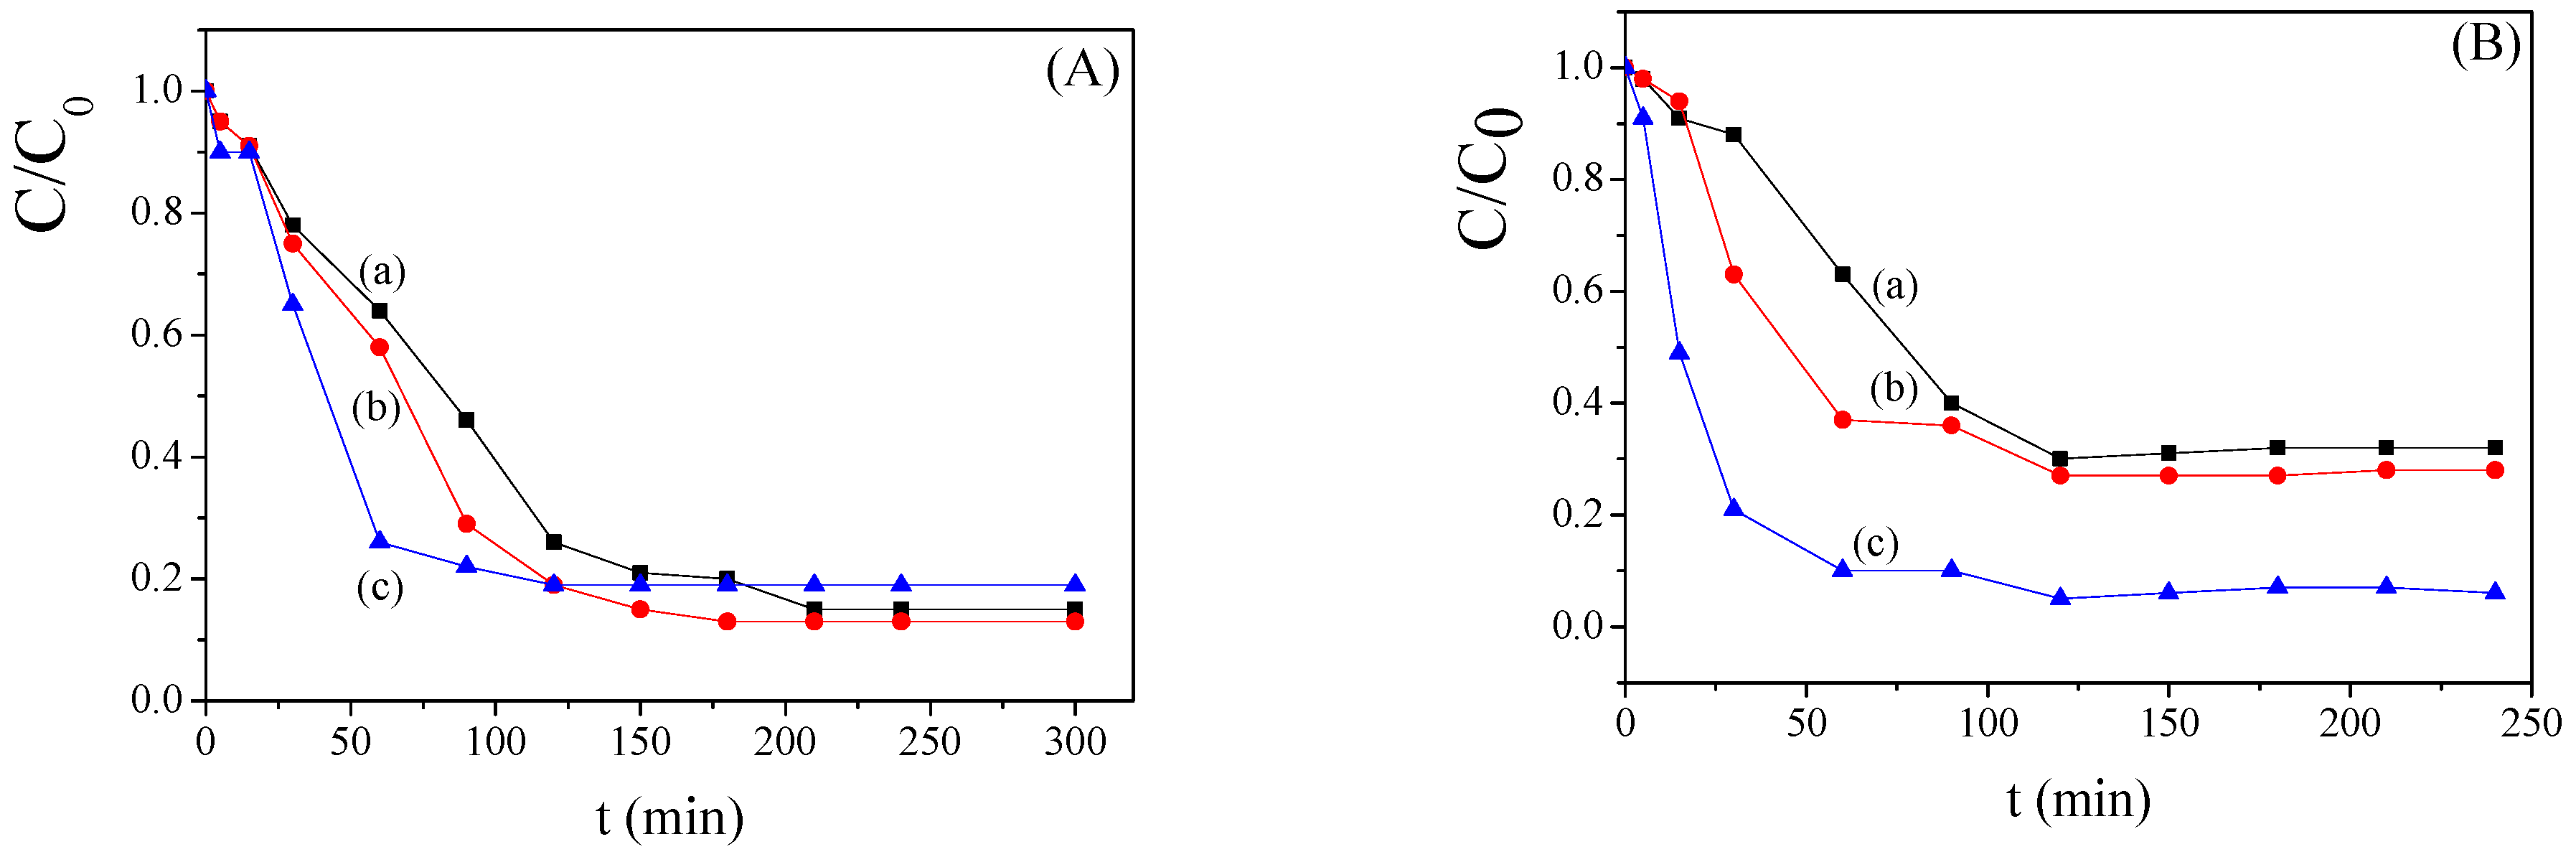
2.2. Effect of the Temperature and the Concentration of H2O2

Degradation of PY on the Fe1-NaY catalyst was studied in the range of 30 to 50 °C, also by varying the hydrogen peroxide concentration in order to optimize the reaction conditions and then investigate the performance of the bimetallic catalysts. Figure 4 shows the trend of the relative concentration (C/C0) of PY as a function of reaction time at different temperatures (Figure 4A) and the corresponding TOC values determined at the end of the reaction (Figure 4B).
It can be observed from Figure 4A that, as expected, the reaction rate increases with the increase in temperature, the most significant increase being observed between 40 °C (curve b) and 45 °C (curve c); indeed, the slope of the curve C/C0 vs. t is much lower for the former temperature. For temperatures of 45 °C and below, a sharp decrease in C/C0 occurs up to 60 min on reaction, and then an almost constant value is reached. Interestingly, comparable C/C0 plateau values are observed for the reaction temperature of 30 to 40 °C, and 45 to 50 °C. However, the lowest TOC value is achieved at 40 °C. For that, such temperature has been chosen for performing the additional experiments.
The effect of hydrogen peroxide concentration was studied at 40 °C on the Fe1-NaY catalyst using 6 and 12 mM H2O2 aqueous solutions. The results, summarized in Figure 5, show that PY degradation is not remarkably affected by the hydrogen peroxide concentration; however, a slightly better performance is observed in the presence of the more concentrated solution (12 mM), which was therefore used in the subsequent experiments.

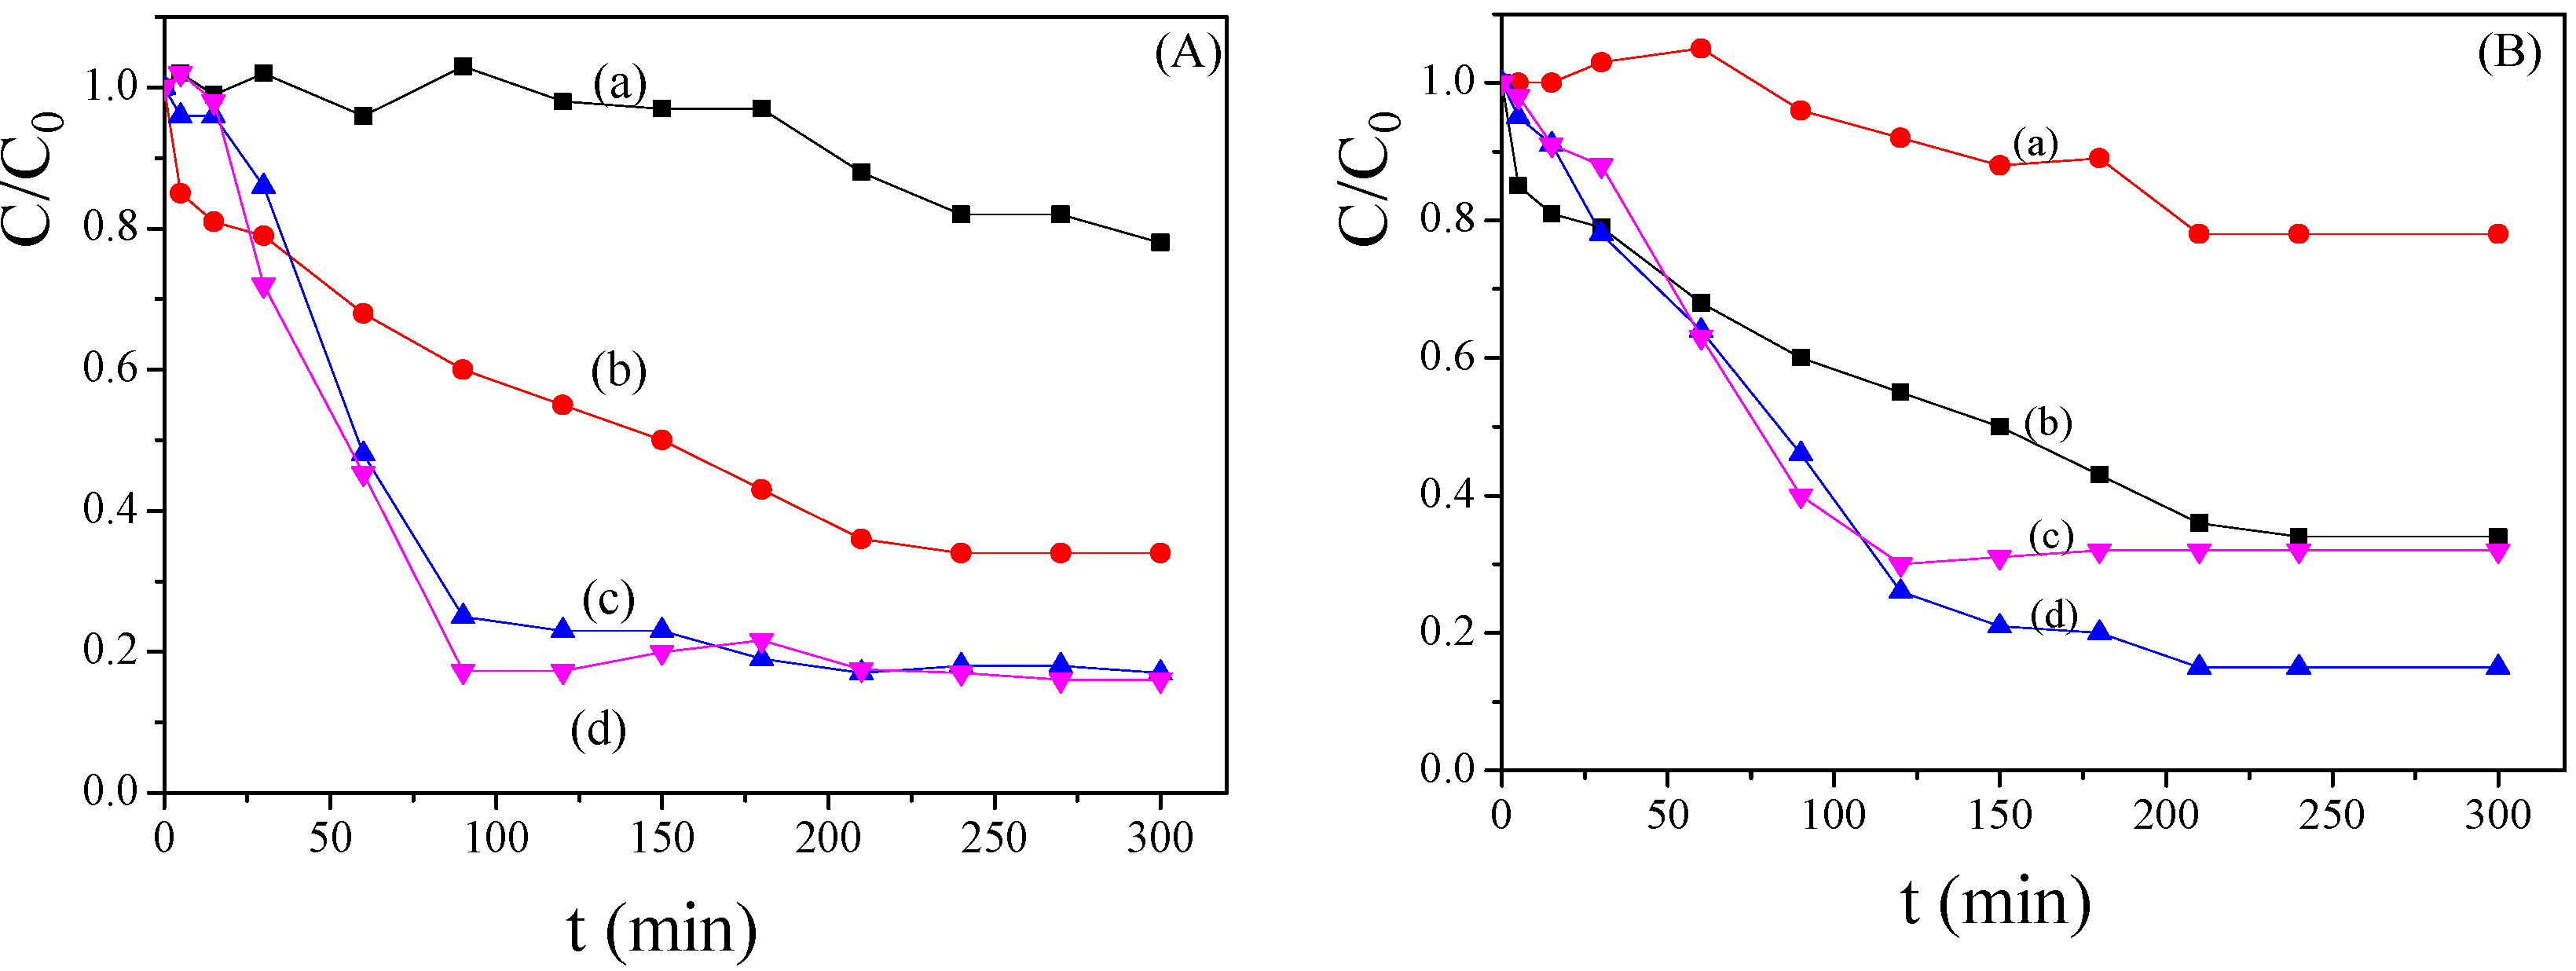
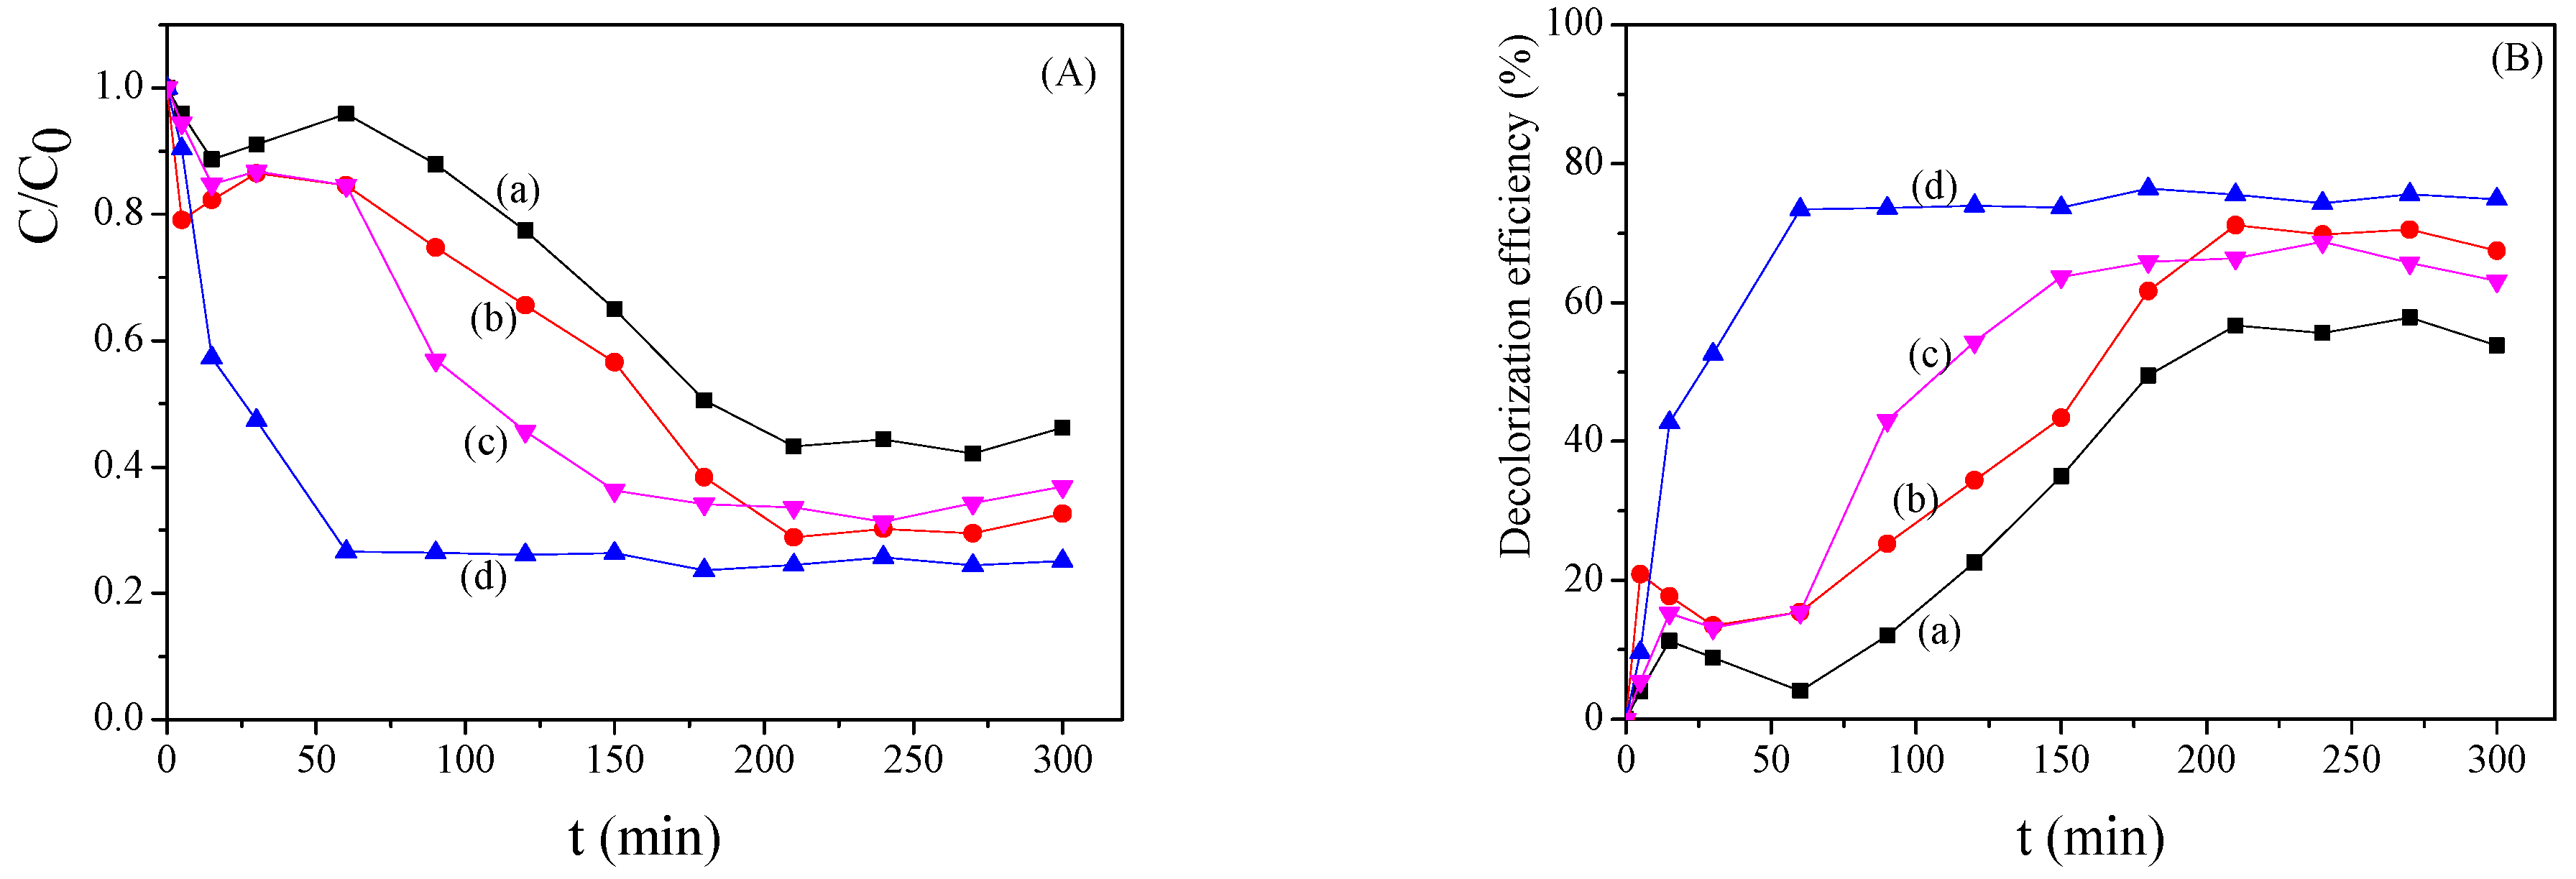
2.3. Bimetallic Zeolite Catalysts in the Degradation of Dye Compounds

Four bimetallic (M1M2-NaY) catalysts were obtained, namely FeCu-NaY, FeMn-NaY, CuFe-NaY and MnFe-NaY. The first two samples were prepared using Fe1-NaY as the support for copper or manganese, while for the others, Fe was loaded on Cu1.39-NaY and Mn1.09-NaY, respectively.
Scanning electron microscopy SEM micrographs of the parent NaY as well as of the Fe-NaY, FeCu-NaY and CuFe-NaY catalysts (Figure 6) indicate that no changes occur in the morphology of the parent zeolite after the ion-exchange treatment and subsequent calcinations.
All catalysts retain the morphology typical for the parent zeolite, with particles of about 700 nm in diameter (Figure S2). Besides those of the characteristic elements of the zeolite, the energy-dispersive X-ray (EDX) analysis shows signals ascribable to the ion-exchanged metals (Figure 6), confirming that they are successfully loaded on the faujasite zeolite structure. The metals amount determined by ICP-AES analysis is presented in Table 1.
As expected, for the bimetallic catalysts, the amount of the second metal is higher in the second ion exchange [18,19].
Textural properties of the catalysts were investigated by N2 physisorption and the results are summarized in Table 2. Compared to the parent NaY zeolite, the monometallic catalysts do not show an appreciable decrease in the surface areas (SBET) values, while the external surface (Sext) decreases with percentages between 50 and 75%. Concerning the bimetallic catalysts, a remarkable diminution in SBET is observed when Cu or Mn are loaded on Fe-NaY, but almost constant values are obtained when Fe is added on the M1-NaY samples as the second metal component (M2). In addition, for all the bimetallic catalysts an increase in the (Sext) values, together with a diminution in the micropore volume (Vmicro), can be generally noted.
In Figure 7, the evolution of the PY degradation in the presence of the Mn- (Figure 7A) and Cu-containing (Figure 7B) bimetallic catalysts is compared with that of the monometallic ones. Mn-NaY and Cu-NaY (a curves) are only poorly active in degrading the azo dye, confirming the crucial role of iron as the active phase in the Fenton-type processes. Indeed, when Fe is added, the resulting M1Fe-NaY catalysts show a significant increase in activity (d curves), being able to degrade more than 80% of the dye within 100 min on reaction. Interestingly, a manifest improvement in the catalytic behavior (c curves) is also noted when Mn or Cu are added to the monometallic Fe-NaY catalyst.
These results highlight that, provided that iron is present, the introduction of a second component positively influences the degradation capacity of the catalyst, regardless of the order in which the two metals are introduced into the supporting zeolite. Probably, the interaction between the two metals favors the redox properties of the Fe3+/Fe2+ couple and are stabilize by the zeolite structure.
The effect of the reaction temperature on the ability to degrade the PY dye was studied between 40 and 50 °C on the copper and iron-containing bimetallic catalysts and the obtained results are reported in Figure 8 and summarized in Table 3.
As expected, the oxidation reaction is always accelerated by the increase in temperature, although to a different extent for the two catalysts, as evidenced by the time required to degrade 50% of the dye initially present (t50), which is lower for CuFe-NaY in comparison with FeCu-NaY (Table 3). It is worthy of note that, although exhibiting a higher rate in reaching constant C/C0 values at all the investigated temperatures, the CuFe-NaY catalyst appears to be less efficient than FeCu-NaY in degrading PY at 40 and 45 °C. In fact, final C/C0 values, (C/C0)final, of 28 and 15% are found at these temperatures for the CuFe-NaY and FeCu-NaY catalysts, respectively. However, while for FeCu-NaY the final C/C0 value is independent of temperature, a marked decrease in this value is observed between 45 and 50 °C for CuFe-NaY (Table 3).
Similar trends of C/C0 and decolorization efficiency vs. time at 40 °C were observed for the Mn-containing bimetallic catalysts, whose results are summarized in Table 3.
However, for all bimetallic catalysts the decolorization efficiency is faster than the mineralization efficiency. It emerges that the Cu-containing bimetallic catalysts perform better than the Mn-containing ones, for the reaction temperature of 40 °C showing higher mineralization efficiencies. Noteworthy, while the degradation degree (and then decolorization, Figure S3) of the Fe- and Cu-containing bimetallic catalysts seem to be enhanced when Fe is originally present, the mineralization efficiency is higher when Fe is added as the second metal to the Cu-NaY sample.
The catalytic Fenton-like reaction was also investigated for Tar degradation at 40 °C using the bimetallic catalysts. The obtained results are shown in Figure 9 and summarized in Table 4.
At variance with what observed for PY degradation, in the case of Tar the Mn-containing bimetallic catalysts perform better compared to the Cu-containing ones. In particular, MnFe-NaY shows the highest activity, being able to degrade 50% of the dye within 30 min and reaching the final value of C/C0 (25%, which is the lowest among those obtained) after 300 min. Also, for this catalyst the decolorization and mineralization efficiencies are higher than for the other bimetallic catalysts. Interestingly, the curves of C/C0 vs. time reaction of the other three bimetallic catalysts, instead of constantly decreasing with time and then reaching a plateau, show a different trend. After an initial decrease, the Tar concentration remains approximately constant for a certain period (whose extent depends on the catalyst), then it decreases and finally reaches the final constant value. The presence of the plateau at low reaction times, not observed in the case of MnFe-NaY, may be probably due to the following different kinetic models [10,11,17,20].

2.4. Kinetic Model of the Degradation of Dye Compounds by the Bimetallic Catalysts

The mechanisms involved in these bimetallic catalysts were reported in [10], where they proposed that the bimetallic catalyst with copper promotes the formation of hydroperoxyl and hydroxyl radicals from H2O2. In accordance, our catalysts could also be acting by the same mechanism. In the case of copper, the formation of the pairs Fe3+/Cu2+ and Fe3+/Cu+ could happen and enhance the degradation of PY:
Fe3+/Cu2+-NaY + H2O2 → Fe2+/Cu2+-NaY+ H+ + HO2,
Fe2+/Cu2+-NaY + H2O2 → Fe3+/Cu2+-NaY + 2 HO,
Fe3+/Cu2+-NaY + H2O2 → Fe3+/Cu+-NaY + H+ + HO2,
Fe3+/Cu+-NaY + H2O2 → Fe3+/Cu2+-NaY + 2 HO,
In the case of Mn, where the degradation of Tar is desired rather than the other compound, the pairs Fe3+/Mn2+ and Fe3+/Mn0 could be formed and following the described equations:
Fe3+/Mn2+-NaY + H2O2 → Fe2+/Mn2+-NaY + H+ + HO2,
Fe2+/Mn2+-NaY + H2O2 → Fe3+/Mn2+-NaY + 2 HO,
Fe3+/Mn2+-NaY + H2O2 → Fe3+/Mn0-NaY + H+ + HO2,
Fe3+/Mn0-NaY + H2O2 → Fe3+/Mn2+-NaY + 2 HO,
The same reactions were observed when iron was introduced as the second metal by the ion exchange method and in this case occurs as Cu2+/Fe3+-NaY or Mn2+/Fe3+-NaY.
Cyclic voltammetry (CV) studies provide qualitative information on the electrochemical response of prepared bimetallic catalysts with respect to electrochemical reactions in the stability region of the solvent. Cyclic voltammograms of the NaY/CT electrode in the same medium without any oxidation or reduction peaks were given in our previous works, confirming that no significant redox process takes place on support material alone [21,22]. As expected, in the potential region of −1.5 to 1.5 V vs. SCE (Saturated Calomel Electrode) used in this work, the parent zeolite does not present any electroactive species.
In order to evaluate the effect of the presence of Fe/Cu and Fe/Mn bimetallic species on the electrode surface on the zeolite structure, as well as the effect of the ion exchange order during the preparation of catalysts, CV measurements were carried out.
Figure 10 shows the typical CVs of bimetallic-zeolite modified electrodes containing the pairs FeCu-NaY or CuFe-NaY (Figure 10A,B) and FeMn-NaY or MnFe-NaY (Figure 10C,D), for a scan rate of 50 mV s−1 in the absence of dye (black lines) and in the presence of PY (red lines) of +1.50 V to −1.50 V vs. SCE. The upper potential limit was set at +1.50 V vs. SCE to minimize oxidation of the electrode surface.
The redox process observed at about 0.0 V vs. SCE for FeCu-NaY and CuFe-NaY catalysts can be attributed to Cu/Cu(II) and Fe/Fe(II) redox couples while the oxidation peak noticed at approximately 1.0 V vs. SCE can be related to the Fe(II)/Fe(III) redox couple with further oxide formation. The reduction peak at −1.0 V vs. SCE is probably due to the reduction of oxides formed during the anodic scan at potentials above 1.0 V vs. SCE. The redox process attributed to the Fe(II)/Fe(III) couple can also be found on the voltammograms of FeMn-NaY and MnFe-NaY, shown in Figure 10C,D, respectively. Redox peaks corresponding to the Mn(0)/Mn(II) couple could not be noticed in the potential region of the study, probably due to the high reducing power of this metal. Cyclic voltammograms acquired in the presence of pigment show that the electrochemical reactivity of this specie depends on the electrode material. An oxidation process at around 1.0 V vs. SCE can be noticed for FeCu-NaY and CuFe-NaY modified electrodes. Considering that this last potential region corresponds to the Fe(II)/Fe(III) couple, the contribution of Fe(II) species can be foreseen in this case.
Important differences concerning the electrochemical behavior of the pigment can be noticed between FeMn-NaY and MnFe-NaY modified electrodes. No significant oxidation of the PY can be observed for FeMn-NaY, contrarily to that noticed for the MnFe-NaY modified electrode, which provides significant oxidation of this substrate. This difference can be explained by the ease of oxide species formation for MnFe-NaY, resulting in the inhibition of the PY oxidation. Cyclic voltammograms of FeMn-NaY in the absence and the presence of electroactive specie, respectively, without and with significant oxidation currents in this potential range is in agreement with this suggestion.
The kinetic model usually used to describe the degradation of the dye compounds is a pseudo first-order reaction [10,20]. The catalytic activity (r) is calculated with the following equation:
r = K C
where K is K = k , ( W V ) , k, (L·mg−1·min−1) is the pseudo first-order rate constant, W is weight of the catalyst (mg) and V (L) is the volume of the solution. Table 5 shows the results obtained for the bimetallic catalysts.
The lower values obtained for the pseudo first-order rate constant for CuFe-NaY and MnFe-NaY are consistent with the catalytic results observed for the degradation of PY (Figure 7) and Tar (Figure 9).
Interesting, for both dye compounds, the best catalyst was that where the iron was introduced as second metal. It seems that iron is more accessible for the dye degradation. Besides, in both these catalysts the amount of iron is almost the same, with 3.49 wt% for CuFe-NaY and 3.84 wt% for MnFe-NaY (Table 1); the decrease in the BET surface also appears related to the amount of iron, the large amount of iron in MnFe-NaY imply a high decrease in the BET surface area (Table 2).

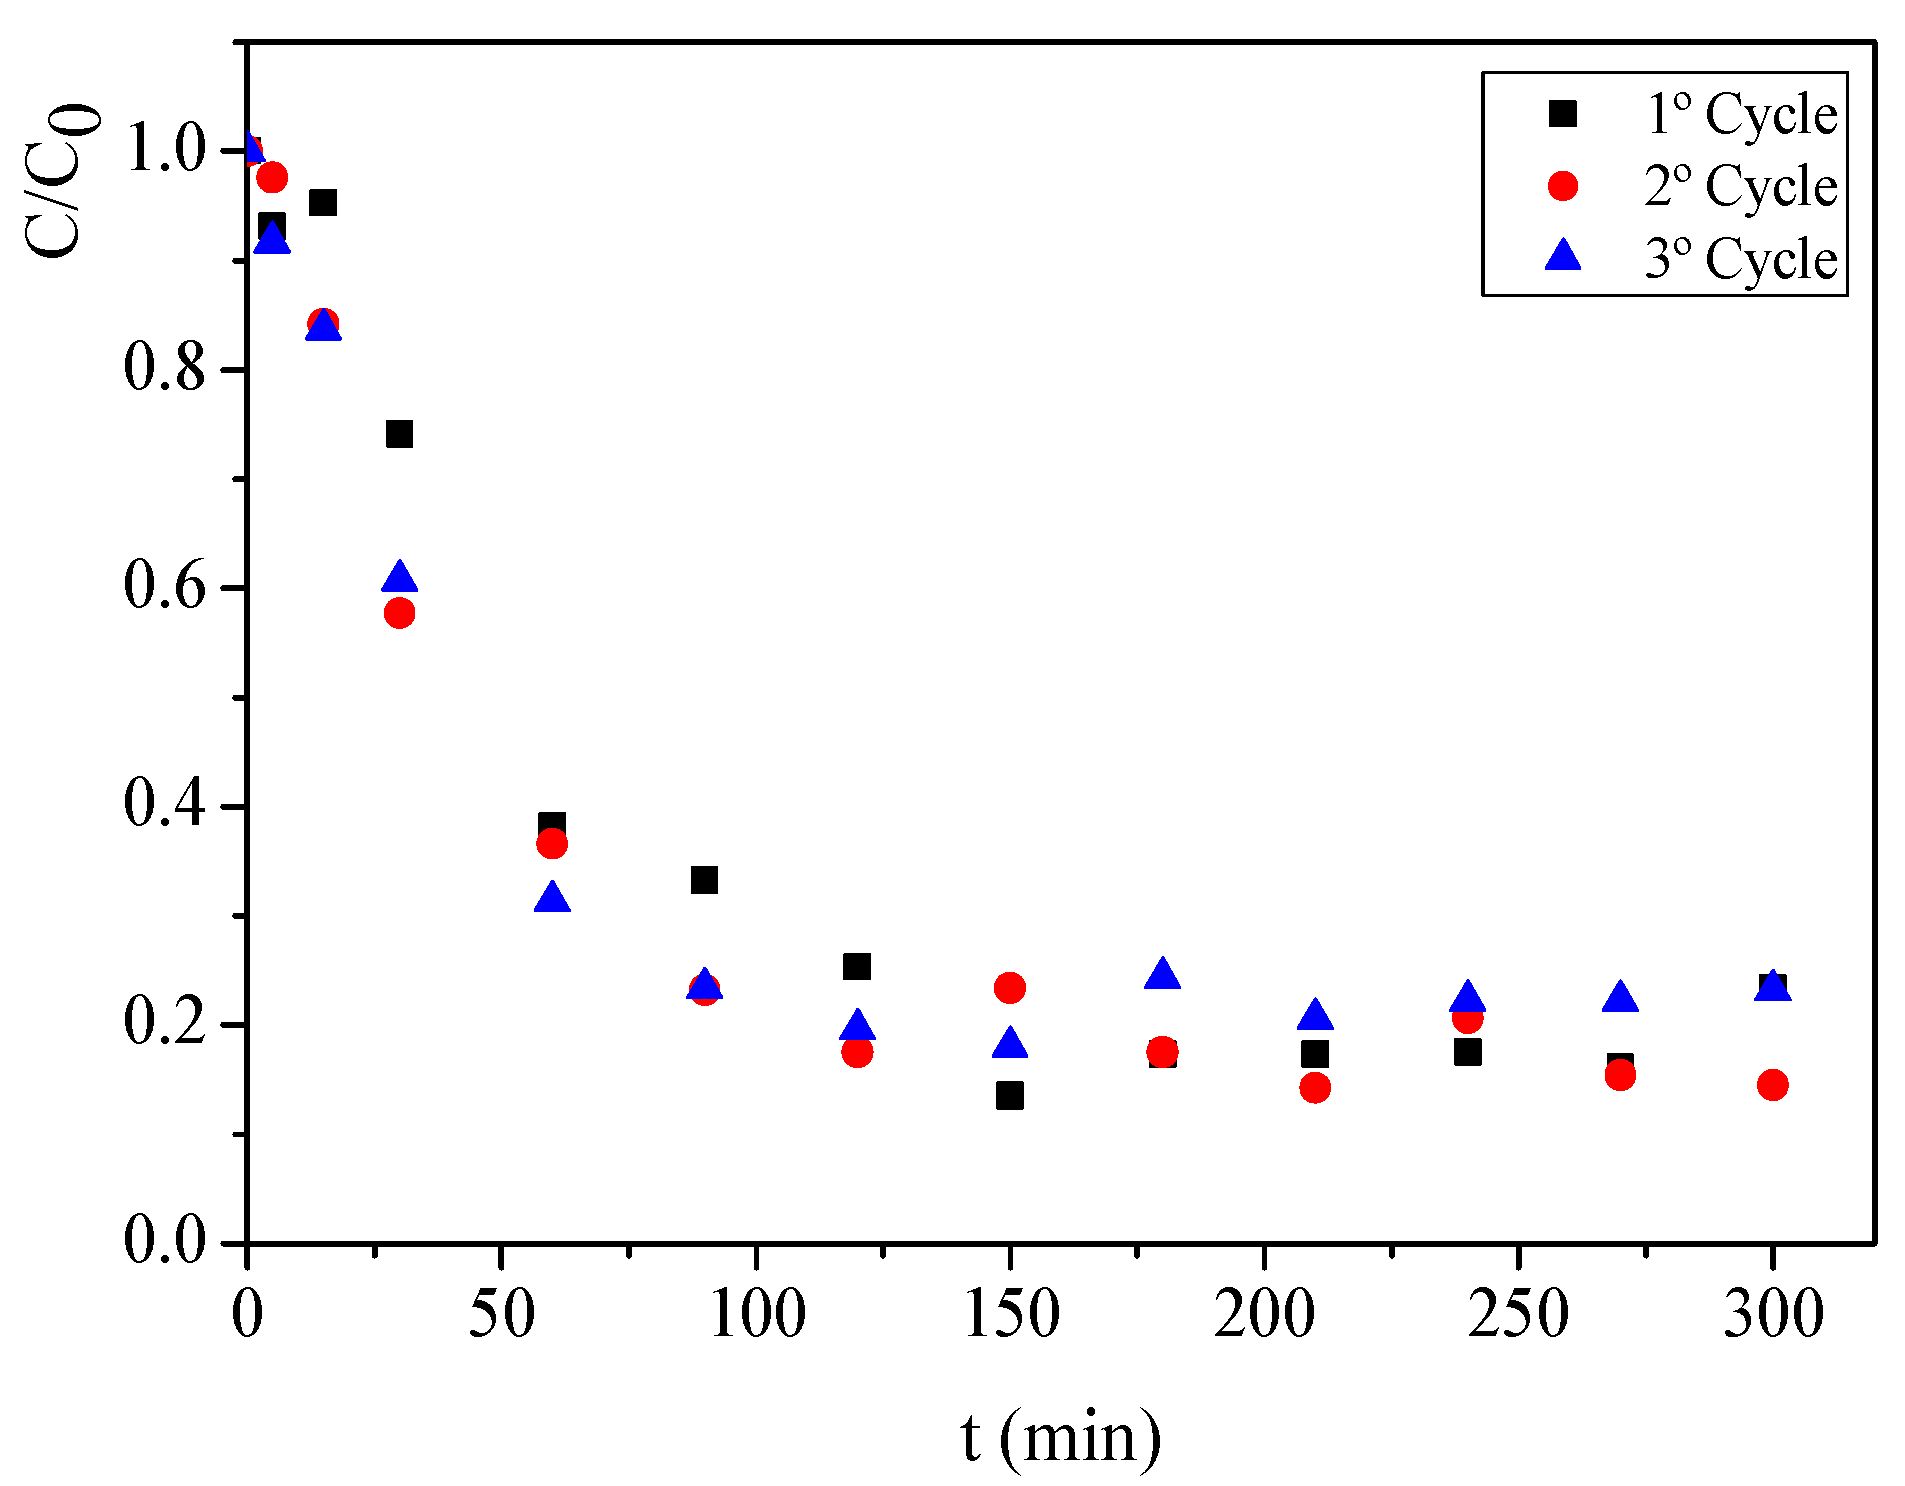
2.5. Reutilization of the Bimetallic Catalysts

For the best catalysts, the bimetallic ones, the stability and reusability after three reaction cycles, each experiment lasting 5 h, were carried out for the degradation of PY. Figure 11 shows the obtained results for the FeCu-NaY catalysts as example.
All bimetallic catalysts after the third reaction cycle show similar performance as the first cycle. The bimetallic catalysts can be reused at least three times with the same performance. Figure S4 shows the same behavior for MnFe-NaY and FeMn-NaY in Tar degradation for the first two reaction cycles.
FeCu-NaY (PY) and FeMn-NaY (Tar) after the reusability studies were analyzed by SEM/EDX (Figure 12).
SEM micrographs of FeCu-NaY and FeMn-NaY catalysts exhibit the same morphology as the parent zeolite NaY, which confirms the preservation of the structure after at least three reaction cycles, without significant loss of catalytic activity. The presence of the metal ions was also evidenced in the EDX spectrum with a negligible leaching degree. These results clearly show that the bimetallic catalysts for the degradation of the dyes using the Fenton reaction are very stable.

3. Materials and Methods

3.1. Materials and Reagents

NaY (CBV100, Si/Al = 2.83), (NH4)Y (CBV300, Si/Al = 2.81) and (NH4)USY (CBV500, Si/Al = 2.99) zeolites were obtained from Zeolyst International (Kansas, KS, USA) in powdered form. The azo-dye compounds Procion Yellow (PY, C20H12Cl2N6Na2O6S2, disodium;3-[[4-[(4,6-dichloro-1,3,5-triazin-2-yl)amino]-2-methylphenyl]diazenyl]naphthalene-1,5-disulfonate, 613 g/mol, ≥90%) and Tartrazine (Tar, C16H9N4Na3O9S2, trisodium-(4E)-5-oxo-1-(4-sulfonatophenyl)-4-[(4-sulfonatophenyl)hydrazono]-3-pyrazolecarboxylate, 534 g/mol, ≥90%,) were provided by Sigma Aldrich (St. Louis, MO, USA). Iron nitrate (Fe(NO3)3·9H2O, Aldrich), copper nitrate (Cu(NO3)2·3H2O, Riedel de Haen, (Seelzs, Germany) or manganese chloride (MnCl2·4H2O, Aldrich, (St. Louis, MO, USA), hydrogen peroxide (H2O2, 30 wt%, Merck, Darmstadt, Germany), acid chloride (HCl, Aldrich, St. Louis, MO, USA) and sodium bisulphite (Na2SO3, Aldrich, St. Louis, MO, USA) were used as received.

3.2. Catalysts Preparation

NaY, (NH4)Y and (NH4)USY zeolite supports were modified by the ion exchange method with aqueous solutions of metal species. Before using, the parent zeolites were pretreated at 120 °C for 12 h in an oven. Details on the adopted preparation procedure are reported elsewhere [18,19]. In order to choose the best Y zeolite support, three samples (Fe-NaY, Fe-Y and Fe-USY) were prepared with 3.65 mmol of iron concentration for 3 g of each zeolite. Also, three monometallic catalysts based in NaY (Fe-NaY, Cu-NaY and Mn-NaY) were prepared by contacting 5 g of zeolite with a solution 1.00 mmol of the appropriate metal precursor (Fe(NO3)3, Cu(NO3)2 or MnCl2) in an Erlenmeyer flask under stirring, at room temperature, during 24 h. The bimetallic catalysts (FeCu-NaY, CuFe-NaY, MnFe-NaY and FeMn-NaY) were prepared placing the monometallic samples (Fe-NaY, Cu-NaY and Mn-NaY, 1.5 g each) in contact with solutions (1.00 mmol) containing the second metal precursors. After the ion exchange treatment, the suspensions were filtered off and the recovered solids were washed with deionized water, dried in an oven at 60 °C for 8 h, and calcined at 350 °C during 4 h under a dry air stream.

3.3. Catalysts Characterization

Inductively coupled plasma atomic emission spectroscopy (ICP-AES) analyses were performed with a 5110 ICP-OES spectrometer (Agilent Technologies, St. Clara, SA, USA) to determine the metals (Na, Al, Si, Fe, Cu, Mn) content. Samples (ca. 0.015 g) were thermally treated at 500 °C for 12 h to remove the adsorbed water and subsequently placed in a platinum crucible. Then, the melting agent was added (Li2B4O7/sample = 15:1 by weight) and the alkaline fusion was carried out in a muffle furnace at 1000 °C for 30 min. After cooling of the melt, the resultant fusion bead was transferred into a beaker and heated on a plate at 80 °C after addition of 20 mL of 5% HNO3 (all the samples were found to completely dissolve within 30 min). Finally, the solution was transferred into a volumetric flask and brought to the desired volume with milliQ water.
In order to choose the best Y zeolite support for the bimetallic catalysts, powder X-ray diffraction patterns of the monometallic catalysts, Fe-NaY, Fe-USY and Fe-Y were measured on a Philips Analytical X-ray model PW1710 BASED diffractometer (Almelo, Netherlands) using Cu Kα radiation with λ = 1.54056 Å. Measurements were performed in the 2θ range 5–70° at room temperature.
Surface area and pore volume were determined from the nitrogen adsorption/desorption isotherms at −196 °C, using a Carlo Erba (Sorptomatic Instruments CE Series, Rodano, Mi, Italy) gas adsorption device. Before analysis, all samples were outgassed at 250 °C under vacuum (7.5 × 10⁻³ Torr) for 12 h in order to clean the surface of any adsorbed impurities. The isotherms were elaborated according to the BET method, applying the procedure suggested by Roquerol et al. [23] for the proper calculation of BET surface area of microporous materials. The external surface area (Sext) and micropore volume (Vmicro) were calculated by the t-method. The mesopore volume (Vmeso) was calculated by the difference between the total pore volume at P/P0 = 0.99 (Vtotal) and Vmicro.
The total organic carbon (TOC) was also measured using a SKALAR FormacsHT/Analyzer instrument (Breda, Netherlands).
The powder samples were characterized using a desktop scanning electron microscope (SEM) coupled with energy-dispersive X-ray spectroscopy (EDX) analysis (Phenom ProX with an EDX detector (Phenom-World BV, Eindhoven, Netherlands). All results were acquired using the ProSuite software integrated with Phenom Element Identification software; this allowed for the quantification of the concentration of the elements present in the samples, expressed in either weight or atomic concentration. The samples were added to aluminum pin stubs with electrically conductive carbon adhesive tape (PELCO Tabs™). Samples were imaged without coating. The aluminum pin stub was then placed inside a Phenom Charge Reduction Sample Holder (CHR), and different points were analyzed for elemental composition. EDX analysis was conducted at 15 kV; an intensity map and SEM analysis were conducted at 5 kV. The average particle diameters of NaY zeolite [24] and the bimetallic catalysts were determined using ImageJ Software (University of Wisconsin, USA, 2019, Figure S2).
Cyclic voltammetry measurements were performed in order to characterize the bimetallic catalysts using a thermostat three-electrode cell assembly composed of an Hg/Hg2Cl2 (sat. KCl) reference electrode, a platinum foil (99.95%) counter electrode and a Toray carbon paper (Quintech, Göppingen, Germany, geometrical area of 4.0 cm2) working electrode. The Toray carbon paper was glued to the platinum wire using conductive carbon cement (Quintech, Göppingen, Germany) and was dried at room temperature during 24 h. The reference electrode consists of a Saturated Calomel Electrode (SCE) Hg/Hg2Cl2 (sat. KCl) separated from the solution by a Habber–Luggin capillary tip. All electrochemical measurements were conducted at a controlled temperature of 25 °C. The electrochemical instrumentation consisted of a potentiostat/galvanostat from Amel Instruments (Milano, Italy) coupled to a microcomputer (Pentium II/500 MHz, Intel, St. Clara, CA, USA) through an AD/DA converter. The Labview software (National Instruments, 2011, Austin, TX, USA) and a PCI-MIO-16E-4 I/O module were used for generating and applying the potential program as well as acquiring data such as current intensities. The catalytic ink was ultrasonically prepared by dispersing the prepared bimetallic catalyst powders in a mixture of ultra-pure water (Millipore pure system Milli-Q, Massachusetts, MA, USA, 18.2 MΩ cm at 20 °C) and Nafion® suspension (5 wt.% Sigma-Aldrich, St. Louis, MO, USA). A catalyst loading of 20 mg cm−2 of catalytic ink was homogeneously deposited onto the wet proofed Toray carbon paper and the solvent was then evaporated at room temperature. Prior to electrochemical measurements, the solution was de-aerated with ultra-pure N2 (U Quality from Air Liquide, Paris, France) for 30 min, and a nitrogen stream was maintained over the solution during the measurements in order to avoid any dissolved oxygen interferences. The detailed experimental set-up was well described elsewhere [25].

3.4. Catalysts Evaluation

Catalytic tests were carried out in a semi-batch reactor, at room temperature and atmospheric pressure under stirring based in the conditions described in [11]. The reaction temperature was controlled (±0.1 °C) with a thermostatic bath and the pH was continuously measured. In a typical run, the reactor was loaded with 250 mL of a dye solution of known concentration (30 ppm), and both temperature and pH were then adjusted to the desired values keeping the solution (pH of 3.0, for different temperatures) under stirring. The dye concentration used in this work was selected in the typical range (between 10 and 50 mg L−1) of dye concentrations in the industrial effluents [11,26]. Several runs were conducted by varying the temperature (in the range 30–50 °C) and the H2O2 concentration (6.0 or 12.0 mM). In such experiments, the catalyst dose was always 200 mg L−1. The beginning of the reaction (t = 0) was considered when the catalyst (50 mg) and H2O2 (6 or 12 mM) were simultaneously added. Dye samples were withdrawn from the reactor at fixed times and the reaction was stopped by adding excess NaHSO3, which instantaneously consumed the remaining hydrogen peroxide. After separation of the solid catalyst by filtration, the reaction mixture was analyzed by TOC. Concentration of the dye samples was quantified using an UV-vis Spectrophotometer (UV-2501PC from Shimadzu, Kyoto, Japan) operating at the characteristic wavelength of the dyes, i.e., λmax = 406.5 and 426.5 nm for PY and Tar, respectively. The catalytic tests for both dye compounds were performed in triplicate and the average absolute deviation was always less than 7%.
Decolorization and mineralization efficiencies were calculated by the following expressions:
D e c o l o r i z a t i o n   e f f i c i e n c y   ( % ) = ( 1 C C 0 ) × 100
M i n e r a l i z a t i o n   e f f i c i e n c y   ( % ) = ( 1 T O C T O C 0 ) × 100 ,
where C0 and TOC0 are the initial concentrations (mg L−1) of the dyes and TOC, respectively, while C and TOC are the values of the same parameters at time t.
In recycling experiments, the same experimental catalytic conditions as described above were applied for the best catalysts, the bimetallic ones for the degradation of PY and Tar. Three runs were performed, each lifelong 5 h. After each run the catalyst was washed with ethanol, filtered and dried in an oven at 70 °C overnight before reutilization. The recycling catalysts were analyzed by SEM in order to verify the structure of the support and the presence of metals after cycle reactions were identified by EDX analysis.

4. Conclusions

The degradation of dye compounds (Procion yellow (PY) and Tartrazine (Tar)) at atmospheric pressure and different temperatures, using H2O2 as the oxidant was achieved by bimetallic catalysts based in Y zeolite. These bimetallic catalysts were prepared with Fe3+, Cu2+ and/or Mn2+ ions introduced by ion exchange method in Y zeolite and were found to be highly active in degrading the dyes trough the Fenton-type process at 40 °C and 12 mM of H2O2. The bimetallic catalysts show high dye oxidation and mineralization rates; CuFe-NaY displayed the best mineralization rate for PY oxidation and MnFe-NaY showed the highest activity for Tar degradation. The prepared bimetallic catalysts can be used at least three times without a significant loss of catalytic activity, proving to have a very high stability.

Supplementary Materials

The following are available online at https://www.mdpi.com/2073-4344/11/1/32/s1. Figure S1: XRD pattern of NaY zeolite. Figure S2: SEM micrographs of CuFe-NaY and MnFe-NaY catalysts, with a magnification of 17,000×. Figure S3: Decolorization efficiency vs. reaction time at different temperatures for FeCu-NaY (C) and CuFe-NaY (D): (a) 40 °C; (b) 45 °C and (c) 50 °C. Other reaction conditions: 50 mg of catalyst, VPY = 250 mL, C0 = 30 ppm, initial pH = 3.00, CH2O2 = 12 mM; Figure S4: Relative Tar concentration, C/C0, as a function of time for FeMn-NaY (a) and MnFe-NaY for two cycles of reaction. Reaction conditions: 50 mg of catalyst, VTar = 250 mL, C0 = 30 ppm, initial pH = 3.00, H2O2 = 12 mM, TR = 40 °C.

Author Contributions

Investigation, B.L.C.S.; analysis training and supervision, A.M.F. and I.C.N.; investigation, resources and writing—original draft preparation, P.P., O.S.G.P.S. and I.C.N.; investigation and writing—review, M.F.R.P. and E.R.; all supervision, A.M.F. and I.C.N.; funding acquisition, A.M.F. and I.C.N. All authors have read and agreed to the published version of the manuscript.

Funding

This research work has been developed under the scope of the projects: BioTecNorte (operation NORTE-01-0145-FEDER-000004), supported by the Northern Portugal Regional Operational Programme (NORTE 2020), under the Portugal 2020 Partnership Agreement, through the European Regional Development Fund (ERDF). This work also has been funded by national funds (Fundação para Ciência e Tecnologia, FCT), through the projects: PTDC/AAGTEC/5269/2014, Centre of Chemistry (UID/QUI/00686/2013 and UID/QUI/0686/2016) and Associate Laboratory LSRE-LCM-UIDB/50020/2020. OSGPS acknowledges FCT funding under the Scientific Employment Stimulus—Institutional Call CEECINST/00049/2018.

Data Availability Statement

Data is contained within the article or Supplementary Material.

Acknowledgments

The authors thank INAGBE (Instituto Nacional de Gestão de Bolsas de Estudo, Angola) for the PhD grant of B.L.C.S.

Conflicts of Interest

The authors declare no conflict of interest.

References

  1. Georgi, A.; Kopinke, F.-D. Interaction of adsorption and catalytic reactions in water decontamination processes Part I: Oxidation of organic contaminants with hydrogen peroxide catalyzed by activated carbon. Appl. Catal. B Environ. 2005, 58, 9–18. [Google Scholar] [CrossRef]
  2. Neyens, E.; Baeyens, J. A review of classic Fenton’s peroxidation as an advanced oxidation technique. J. Hazard. Mater. 2003, 98, 33–50. [Google Scholar] [CrossRef]
  3. Gogate, P.R.; Pandit, A.B. A review of imperative technologies for wastewater treatment I: Oxidation technologies at ambient conditions. Adv. Environ. Res. 2004, 8, 501–551. [Google Scholar] [CrossRef]
  4. Bauer, R.; Fallmann, H. The photo-fenton oxidation—a cheap and efficient wastewater treatment method. Res. Chem. Intermed. 1997, 23, 341–354. [Google Scholar] [CrossRef]
  5. Alderete, B.L.; Silva, J.; Godoi, R.; Silva, F.R.; Taffarel, S.R.; Silva, L.P.; Garcia, A.L.H.; Júnior, H.M.; Amorim, H.L.N.; Picada, J.N. Evaluation of toxicity and mutagenicity of a synthetic effluent containing azo dye after advanced oxidation process treatment. Chemosphere 2020, 263, 128291. [Google Scholar] [CrossRef] [PubMed]
  6. Ribeiro, A.R.; Nunes, O.C.; Pereira, M.F.R.; Silva, A.M.T. An overview on the advanced oxidation processes applied for the treatment of water pollutants defined in the recently launched Directive 2013/39/EU. Environ. Int. 2015, 75, 33–51. [Google Scholar] [CrossRef] [PubMed] [Green Version]
  7. Gonzalez-Olmos, R.; Holzer, F.; Kopinke, F.-D.; Georgi, A. Indications of the reactive species in a heterogeneous fenton-like reaction using Fe-containing zeolites. Appl. Catal. A Gen. 2011, 398, 44–53. [Google Scholar] [CrossRef]
  8. Cihanoglu, A.; Gündüz, G.; Dükkancı, M. Degradation of acetic acid by heterogeneous Fenton-like oxidation over iron-containing ZSM-5 zeolites. Appl. Catal. B Environ. 2015, 165, 687–699. [Google Scholar] [CrossRef]
  9. Fukuchi, S.; Nishimoto, R.; Fukushima, Q.; Zhu, M. Effects of reducing agents on the degradation of 2,4,6-tribromophenol in a heterogeneous Fenton-like system with an iron-loaded natural zeolite. Appl. Catal. B Environ. 2014, 147, 411–419. [Google Scholar] [CrossRef] [Green Version]
  10. Karthikeyan, S.; Pachamuthu, M.P.; Isaacs, M.A.; Kumar, S.; Lee, A.F.; Sekaran, G. Cu and Fe oxides dispersed on SBA-15: A Fenton type bimetallic catalyst for N, N-diethyl-p-phenyl diamine degradation. Appl. Catal. B Environ. 2016, 199, 323–330. [Google Scholar] [CrossRef] [Green Version]
  11. Rache, M.L.; García, A.R.; Zea, H.R.; Silva, A.M.T.; Madeira, L.M.; Ramírez, J.H. Azo-dye orange II degradation by the heterogeneous Fenton-like process using a zeolite Y-Fe catalyst-Kinetics with a model based on the Fermi’s equation. Appl. Catal. B Environ. 2014, 146, 192–200. [Google Scholar] [CrossRef] [Green Version]
  12. Wang, J.; Liu, C.; Li, J.; Luo, R.; Hu, X.; Sun, X.; Shen, J.; Han, W.; Wang, L. In-situ incorporation of iron-copper bimetallic particles in electrospun carbon nanofibers as an efficient Fenton catalyst. Appl. Catal. B Environ. 2017, 207, 316–325. [Google Scholar] [CrossRef]
  13. Fernández, C.; Larrechi, M.S.; Callao, M.P. An analytical overview of processes for removing organic dyes from wastewater effluents. TrAC Trends Anal. Chem. 2010, 29, 1202–1211. [Google Scholar] [CrossRef]
  14. Neamtu, M.; Catrinescu, C.; Kettrup, A. Effect of dealumination of iron(III)-exchanged Y zeolites on oxidation of reactive yellow 84 azo dye in the presence of hydrogen peroxide. Appl. Catal. B Environ. 2004, 51, 149–157. [Google Scholar] [CrossRef]
  15. Gonçalves, M.S.T.; Pinto, E.M.S.; Nkeonye, P.; Oliveira-Campos, A.M.F. Degradation of C.I. reactive orange 4 and its simulated dye bath wastewater by heterogeneous photocatalysis. Dye. Pigment. 2005, 64, 135–139. [Google Scholar] [CrossRef] [Green Version]
  16. Thiam, A.; Zhou, M.; Brillas, E.; Sirés, I. Two-step mineralization of tartrazine solutions: Study of parameters and by-products during the coupling of electrocoagulation with electrochemical advanced oxidation processes. Appl. Catal. B Environ. 2014, 150, 116–125. [Google Scholar] [CrossRef]
  17. Ramirez, J.H.; Costa, C.A.; Madeira, L.M.; Mata, G.; Vicente, M.A.; Rojas-Cervantes, M.L.; López-Peinado, A.J.; Martín-Aranda, R.M. Fenton-like oxidation of orange II solutions using heterogeneous catalysts based on saponite clay. Appl. Catal. B Environ. 2007, 71, 44–56. [Google Scholar] [CrossRef] [Green Version]
  18. Soares, O.S.G.P.; Fonseca, A.M.; Parpot, P.; Órfão, J.J.M.; Pereira, M.F.R.; Neves, I.C. Oxidation of volatile organic compounds by highly efficient metal zeolite catalysts. ChemCatChem 2018, 10, 3754–3760. [Google Scholar] [CrossRef] [Green Version]
  19. Soares, O.S.G.P.; Marques, L.; Freitas, C.M.A.S.; Fonseca, A.M.; Parpot, P.; Órfão, J.J.M.; Pereira, M.F.R.; Neves, I.C. Mono and bimetallic NaY catalysts with high performance in nitrate reduction in water. Chem. Eng. J. 2015, 281, 411–417. [Google Scholar] [CrossRef]
  20. Xu, L.; Wanga, J. Fenton-like degradation of 2, 4-dichlorophenol using Fe3O4 magnetic nanoparticles. Appl. Catal. B Environ. 2012, 123, 117–1266. [Google Scholar] [CrossRef]
  21. Fonseca, A.M.; Gonçalves, S.; Parpot, P.; Neves, I.C. Host–guest chemistry of the (N, N0-diarylacetamidine) rhodium (III) complex in zeolite Y. Phys. Chem. Chem. Phys. 2009, 11, 6308–6314. [Google Scholar] [CrossRef] [PubMed]
  22. Biernacka, I.K.; Parpot, P.; Oliveira, C.; Silva, A.R.; Alves, M.J.; Fonseca, A.M.; Neves, I.C. Norbornene oxidation by chiral Complexes encapsulated in NaY zeolite. J. Phys. Chem. C 2014, 118, 19042–19050. [Google Scholar] [CrossRef]
  23. Rouquerol, J.; Llewellyn, P.; Rouquerol, F. “Is the BET Equation Applicable to Microporous Adsorbents?”, In Characterization of Porous Solids VII; Llewellyn, P., Rodriguez-Reinoso, F., Rouquerol, J., Seaton, N., Eds.; Elsevier: Amsterdam, The Netherlands, 2007; Volume 160, pp. 49–56. [Google Scholar]
  24. Vilaça, N.; Gallo, J.; Fernandes, R.; Figueiredo, F.; Fonseca, A.M.; Baltazar, F.; Neves, I.C.; Bañobre-López, M. Synthesis, characterization and in vitro validation of a magnetic zeolite nanocomposite with T2-MRI properties towards theranostic applications. J. Mater. Chem. B 2019, 7, 3351–3361. [Google Scholar] [CrossRef]
  25. Ferreira, M.; Pinto, M.F.; Soares, O.S.G.P.; Pereira, M.F.R.; Órfão, J.J.M.; Figueiredo, J.L.; Neves, I.C.; Fonseca, A.M.; Parpot, P. Electrocatalytic oxidation of oxalic and oxamic acids in aqueous media at carbon nanotube modified electrodes. Electrochim. Acta 2012, 60, 278–286. [Google Scholar] [CrossRef] [Green Version]
  26. Ramirez, J.H.; Lampinen, M.; Vicente, M.A.; Costa, C.A.; Madeira, L.M. Experimental design to optimize the oxidation of orange II dye solution using a clay-based fenton-like catalyst. Ind. Eng. Chem. Res. 2008, 47, 284–294. [Google Scholar] [CrossRef]
Scheme 1. Molecular structures of the dye compounds: (a) procion yellow (PY) and (b) tartrazine (Tar).
Catalysts 11 00032 sch001
Figure 1. X-ray diffraction (XRD) patterns of Fe-NaY (blue), Fe-USY (red) and Fe-Y (black).
Catalysts 11 00032 g001
Figure 2. (A) C/C0 vs. reaction time for Fe4.5-USY (a), Fe10-NaY (b), and Fe9.3-Y (c): Reaction conditions: 50 mg of catalyst, VTar = 250 mL, C0 = 30 ppm, initial pH = 3.00, CH2O2 = 12 mM, TR = 35 °C and (B) UV-vis spectra of the initial Tar solution (blue curve) and after 60 (red curve), 150 (violet curve), and 210 (green curve) min on reaction (inset: the color of the solutions after the degradation of Tar by Fe10-NaY, as example).
Catalysts 11 00032 g002
Figure 3. (A) Relative dye concentration, C/C0, as a function of reaction time for (A) tar and (B) PY for Fe1-NaY (a) and Fe10-NaY (b) catalysts: reaction conditions: 50 mg of catalyst, VDye = 250 mL, C0 = 30 ppm, initial pH = 3.00, CH2O2 = 12 mM, TR = 40 °C.
Catalysts 11 00032 g003
Figure 4. (A) Relative PY concentration, C/C0, as a function of time for the Fe1-NaY catalyst: (a) 30 °C, (b) 40 °C, (c) 45 °C and (d) 50 °C. Other reaction conditions: 50 mg of catalyst, VPY = 250 mL, C0 = 30 ppm, initial pH = 3.00, CH2O2 = 12 mM and (B) TOC values determined at the end of reaction.
Catalysts 11 00032 g004
Figure 5. Relative PY concentration, C/C0, as a function of time for the Fe1-NaY catalyst at different H2O2 concentrations: (a) 6 mM and (b) 12 mM. Other reaction conditions: 50 mg of catalyst, VPY = 250 mL, C0 = 30 ppm, initial pH = 3.00, TR = 40 °C.
Catalysts 11 00032 g005
Figure 6. SEM micrographs and energy-dispersive X-ray (EDX) spectrum of the parent NaY and of the Fe-NaY, FeCu-NaY, and CuFe-NaY catalysts.
Catalysts 11 00032 g006
Figure 7. Relative PY concentration as a function of time for Mn-containing (A) and Cu-containing (B) catalysts: (a) M1-NaY; (b) Fe-NaY; (c) FeM2-NaY and (d) M1Fe-NaY: Reaction conditions: 50 mg of catalyst, VPY = 250 mL, C0 = 30 ppm, initial pH = 3.00, CH2O2 = 12 mM, TR = 40 °C.
Catalysts 11 00032 g007
Figure 8. Relative PY concentration vs. reaction time at different temperatures for FeCu-NaY (A) and CuFe-NaY (B): (a) 40 °C; (b) 45 °C and (c) 50 °C. Other reaction conditions: 50 mg of catalyst, VPY = 250 mL, C0 = 30 ppm, initial pH = 3.00, CH2O2 = 12 mM.
Catalysts 11 00032 g008
Figure 9. Relative Tar concentration vs. reaction time for Mn-containing (A) and decolorization efficiency (B) as a function of reaction time for the bimetallic catalysts: (a) CuFe-NaY; (b) FeCu-NaY; (c) FeMn-NaY and (d) MnFe-NaY. Reaction conditions: 50 mg of catalyst, VTar = 250 mL, C0 = 30 ppm, initial pH = 3.00, CH2O2 = 12 mM, TR = 40 °C.
Catalysts 11 00032 g009
Figure 10. Cyclic voltammograms of FeCu-NaY-CT (A), CuFe-NaY-CT (B), FeMn-NaY-CT (C) and MnFe-NaY-CT (D), with a scan rate 0.05 Vs−1 in a different potential range in 0.10 M NaCl (------) with PY (------, 30 ppm).
Catalysts 11 00032 g010
Figure 11. Relative PY concentration, C/C0, as a function of time for FeCu-NaY for three cycles of reaction. Reaction conditions: 50 mg of catalyst, VTar = 250 mL, C0 = 30 ppm, initial pH = 3.00, H2O2 = 12 mM, TR = 40 °C.
Catalysts 11 00032 g011
Figure 12. SEM micrographs of the parent zeolite NaY, FeCu-NaY and FeMn-NaY, respectively. EDX spectrum of the FeCu-NaY and FeMn-NaY catalysts after the reusability studies.
Catalysts 11 00032 g012
Table 1. Inductively coupled plasma atomic emission spectroscopy (ICP-AES) results for the mono (M1-NaY) and bimetallic (M1Me2-NaY) catalysts.
SamplesM1 (wt%)M2 (wt%)
FeMnCuFeMnCu
Fe-NaY1.13-----
Cu-NaY--1.39---
Mn-NaY-1.09----
FeCu-NaY1.06----3.43
CuFe-NaY--0.853.49--
MnFe-NaY-0.46-3.84--
FeMn-NaY1.11---2.77-
Table 2. Textural properties of the parent NaY and of the supported metal catalysts.
SamplesSBET (m2/g)1Vtotal
(cm3/g)2
Sext
(m2/g)3
Vmicro (cm3/g)3Vmeso
(cm3/g)4
SDR
(m2/g)5
VDR,mic
(cm3/g)5
VHK,total
(cm3/g)6
VHK,mic
(cm3/g)6
NaY9070.351020.290.069380.330.330.33
Fe-NaY8280.33380.290.048740.310.330.31
Cu-NaY9130.32260.33-9570.340.340.34
Mn-NaY9100.35540.320.039550.340.350.34
FeCu-NaY8140.35960.270.088790.310.340.31
CuFe-NaY6480.281110.210.077000.250.280.25
MnFe-NaY6130.24770.200.046640.240.240.23
FeMn-NaY8150.33640.280.058780.310.330.31
1 Specific surface area calculated from the BET (Brunauer–Emmett–Teller) equation. 2 Total pore volume determined from the amount adsorbed at P/Po = 0.99. 3 External surface area and micropore volume calculated by the t-method. 4 Mesopore volume calculated by the difference Vtotal-Vmicro. 5 Surface area and micropore volume calculated by the Dubinin–Radushkevich equation. 6 Total and micropore volumes calculated by the Horvath–Kawazoe equation.
Table 3. Catalytic results for PY degradation on the bimetallic catalysts. Reaction conditions: 50 mg of catalyst, VPY = 250 mL, C0 = 30 ppm, initial pH = 3.00, CH2O2 = 12 mM.
SamplesT (°C)t50 (min) 1(C/C0)final (%) 2Decolorization Efficiency (%) 3TOCfinal (ppm) 2,4Mineralization Efficiency (%) 5
FeCu-NaY408015859.419.7
4565138711.51.7
5045198111.33.4
CuFe-NaY407032688.924.2
4545287210.87.7
501579310.411.1
MnFe-NaY4050168410.212.8
FeMn-NaY4060178311.06.0
1 Time required to degrade 50% of the dye initially present. 2 C/C0 and TOC values determined at the end of reaction = 300 min. 3 Decolorization efficiency (%) calculated by Equation (10) (see Section 3.4). 4 TOCinitial of PY = 11.7 ppm. 5 Mineralization efficiency (%) calculated by Equation (11) (see Section 3.4).
Table 4. Catalytic results for Tar degradation on the bimetallic catalysts. Reaction conditions: 50 mg of catalyst, VPY = 250 mL, C0 = 30 ppm, initial pH = 3.00, CH2O2 = 12 mM, T = 40 °C.
SamplesT (°C)t50 (min) 1(C/C0)final (%) 2Decolorization Efficiency (%) 3TOCfinal (ppm) 2,4Mineralization Efficiency (%) 5
FeCu-NaY4015030709.98.3
CuFe-NaY40180455510.26.0
MnFe-NaY403025759.115.7
FeMn-NaY4090356510.61.8
1 Time required to degrade 50% of the dye initially present. 2 C/C0 and TOC values determined at the end of reaction = 300 min. 3 Decolorization efficiency (%) calculated by Equation (10) (see Section 3.4). 4 TOCinitial of Tar = 10.8 ppm. 5 Mineralization efficiency (%) calculated by Equation (11) (see Section 3.4).
Table 5. Kinetic results for bimetallic catalysts obtained at 40 °C.
SamplesPYTar
EquationR2k, (10−5 L·mg−1·min−1)EquationR2k, (10−5 L·mg−1·min−1)
FeCu-NaYy = −0.0049x + 0.95280.92721.06y = −0.0023x + 0.90810.90551.15
CuFe-NaYy = −0.0053x + 0.98540.95040.98y = −0.0021x + 0.98590.90871.05
MnFe-NaYy = −0.0067x + 0.97540.91101.34y = −0.0118x + 0.90260.87315.90
FeMn-NaYy = −0.0051x + 0.96710.93731.02y = −0.0038x + 0.96840.94951.90
Publisher’s Note: MDPI stays neutral with regard to jurisdictional claims in published maps and institutional affiliations.

