Article

Vapor-Phase Furfural Decarbonylation over a High-Performance Catalyst of 1%Pt/SBA-15

Dalian Institute of Chemical Physics, Chinese Academy of Sciences, Dalian 116023, China
*
Author to whom correspondence should be addressed.
Catalysts 2020, 10(11), 1304; https://doi.org/10.3390/catal10111304
Submission received: 9 October 2020 / Revised: 1 November 2020 / Accepted: 7 November 2020 / Published: 12 November 2020

Abstract

:
A high-performance Pt catalyst supported on SBA-15 was developed for furfural decarbonylation. Compared to Pt catalysts loaded on microporous DeAl-Hbeta zeolite and hierarchical micro-mesoporous MFI nanosheet (NS) materials, the 1%Pt/SBA-15 catalyst afforded notably higher activity, furan selectivity and stability owing to the negligible acid sites and proper mesopores on the SBA-15 support. Among a set of 1%Pt/SBA-15 catalysts bearing Pt nanoparticles (NPs) with sizes of 2.4–4.3 nm, the catalyst with 3.7 nm Pt NPs afforded the highest furan selectivity. Over the optimal catalyst, 88.6% furan selectivity and ca. 90% furfural conversion were obtained at 573 K and a high weight hourly space velocity (WHSV) of 16.5 h−1. Moreover, the reaction temperatures at 440–573 K and the ratios of H2 to furfural at 0.79–9.44 did not affect the reaction selectivity notably, showing that the reaction over 1%Pt/SBA-15 can be conducted over a wide range of conditions. The catalyst was stable under the harsh reaction conditions and lasted for 90 h without significant deactivation, demonstrating the superior property of SBA-15 as a catalyst support for furfural decarbonylation.

Graphical Abstract

1. Introduction

Furan is an important, five-membered, oxygen-containing chemical widely used in the synthesis of pharmaceuticals and agrochemicals [1,2]. Attempts have been made to produce it by the oxidation of butadiene or the decarboxylation of furoic acid, which suffer from low product selectivity and serious environmental problems [3]. Thanks to the abundant furfural production from renewable C5 carbohydrates and the developments of catalytic processes, more environmentally benign and atom-economic furfural decarbonylation has become the prevailing way for furan production in both gas and liquid phases [4,5,6,7]. Currently, the market price of furan is about twice that of furfural. In industry, the gas phase method is more attractive because of its advantages of simple operation and the easy separation and recycling of catalysts. Due to the high energy barrier for the C–C bond cleavage, the decarbonylation of furfural is preferably conducted at high temperatures. Additionally, hydrogen is always present in this reaction to maintain the metallic state of catalysts [8,9,10]. Nevertheless, furfural is metastable under reaction conditions and prone to polymerizing into high-molecular-weight products and causing catalyst deactivation [11]. The presence of hydrogen also readily leads to unselective hydrogenation products. Today, the decarbonylation of furfural with high efficiency over a stable catalyst still presents considerable challenges.
Among the various catalysts employing different metals and supports, Pd catalysts loaded on carbon, alumina and silica have demonstrated superior activity due to the favorable formation of acyl surface species, the key adsorption intermediate for decarbonylation [12,13,14,15,16,17]. More recently, metallic Pt catalysts have attracted much attention due to their advantages of cost and good activity [5,18,19]. Over noble metal catalysts, furfural decarbonylation was found to be a structure-sensitive reaction, in which the selectivity for furan was affected by the size of the metallic nanoparticles on the catalysts [19,20]. To obtain a high-performance catalyst, it is necessary to control the metal particle size in a suitable range. Thus, employing suitable porous materials as the catalyst supports is of particular importance in view of their vital roles in manipulating active components with specific structures, particle sizes, and distributions. Porous silica materials such as SBA-15 possess large specific surface areas and orderly mesoporous channels, which would benefit metallic Pt nanoparticle (NP) dispersion and stabilization by the confinement of mesopores. Additionally, the diverse acidity on the surfaces of the silica materials may provide multiple options for realizing a high reaction selectivity for furan.
Herein, we prepared and comparatively studied Pt catalysts supported on the porous materials SBA-15, DeAl-Hbeta, and MFI(NS), which have different pore structures and acidity. The size of the Pt NPs on the 1%Pt/SBA-15 catalysts was modulated by using different preparation conditions. According to a variety of characterizations of the catalysts, the factors determining the catalyst’s activity and reaction selectivity for furan were probed. The effects of the reaction conditions and the catalyst stability were also evaluated, and the high performance of 1%Pt/SBA-15 was identified for furfural decarbonylation.

2. Results and Discussion

2.1. Comparison of Pt/SBA-15 with Pt/MFI(NS) and Pt/DeAl-Hbeta

To identify the advantages of an SBA-15 support for the Pt catalysts, we first compared the properties and catalytic performance of Pt/SBA-15 with those of Pt/MFI(NS) and Pt/DeAl-Hbeta. The three silica materials possess different types of pore structures: straight channels with 2–30 nm diameters in SBA-15 [21,22], hierarchical structures consisting of micropores (0.6–0.8 nm) from MFI and the mesopores (~4 nm) from the assembled nanolayers of MFI [23,24,25], and the typical micropores (0.4–1.3 nm) in DeAl-Hbeta [26].

2.1.1. Physico-Chemical Properties of Pt Catalysts

The physico-chemical properties of the Pt catalysts were characterized by different methods. From N2-sorption measurements (Figure S1), typical IV (with an H1 hysteresis loop), I–II (with an H4 hysteresis loop), and I isotherms were observed, corresponding to the mesoporous, hierarchical porous, and microporous structures of SBA-15, MFI(NS), and DeAl-Hbeta, respectively. The specific surfaces areas of the supports were similarly high (Table S1), varying in a range of 385–523 m2/g, with the highest value obtained on MFI(NS). After loading 1%Pt, the surface areas slightly decreased to 354–435 m2/g, but the volumes of the micropores and mesopores were retained well. The pore sizes of the catalysts increased in the order of 1%Pt/DeAl-Hbeta (0.6 nm), 1%Pt/MFI(NS) (3.7 nm), and 1%Pt/SBA-15 (7.8 nm).
From the X-ray diffraction (XRD) patterns (Figure S2), it can be confirmed that 1%Pt/MFI(NS) and 1%Pt/DeAl-Hbeta catalysts well retained the crystalline structures of the parent zeolites. For 1%Pt/SBA-15, the mesopore structure owing to SBA-15 was also intact, as shown by the small angle X-ray scattering (SAXS) analysis (Figure S3). The broadened X-ray diffraction peaks assigned to the (111) and (200) planes of metallic Pt [27,28] were detected on the patterns of 1%Pt/SBA-15 and 1%Pt/MFI(NS), indicating the high dispersion of metal in nanosized particles on the supports. Differently, the intensity of the diffraction peaks assigned to metallic Pt was relatively high for the 1%Pt/DeAl-Hbeta catalyst, indicating the inferior dispersion of Pt over this microporous support. The morphologies of the three catalysts are shown in Figure S4. From the scanning electron microscopy (SEM) images, the typical crystallites of DeAl-Hbeta and nanosheets of MFI(NS) were observed, consistent with the results of the XRD analysis.
High-resolution transmission electron microscopy (HRTEM) analysis (Figure 1) further revealed the differences in the Pt particle size on the three supports. Consistent with the XRD analysis, large Pt particles in size range of 5–20 nm were notably present on DeAl-Hbeta, co-existing with numerous tiny Pt clusters randomly located in the supports. Over 1%Pt/SBA-15, orderly straight channels for the silica were observed, and Pt nanoparticles in size range of 2–6 nm were distributed throughout the support, as reflected by the aligned location of most of the Pt particles along the channels of SBA-15. For Pt%MFI(NS), the Pt NPs were also highly dispersed, owing to the mesoporous structure of the support. Evidently, SBA-15 and MFI(NS) showed advantages over DeAl-Hbeta for metallic Pt dispersion.
The Pt dispersions on the catalysts were probed by CO chemosorption. From the data listed in Table S2, it can be observed that the calculated metal particles are notably larger than those observed in transmission electron microscopy (TEM) analysis. This should be attributed to the presence of the bridge adsorption of CO accompanying the linear CO adsorption on the Pt particles (see more discussion in Section 2.2.1), which led to the underestimation of metal dispersion. Even though some system errors occurred in the CO chemosorption measurement, some interesting phenomena were found. Among the three catalysts, it is 1%Pt/DeAl-Hbeta, the microporous catalyst, but not mesoporous catalysts, that gave the highest Pt dispersion. This seems to rather conflict with the observation in the HRTEM analysis. A plausible explanation is that, besides the large Pt NPs (>5 nm) present on the outer surface of the zeolite, there are abundant Pt clusters smaller than 1 nm distributed in the micropores of DeAl-Hbeta and contributing to the Pt dispersion. Between the two mesoporous catalysts, 1%Pt/SBA-15 afforded higher Pt dispersion than 1%Pt/MFI(NS), which may be related to the confinement by the more orderly mesopore size of SBA-15 than MFI(NS).
Given that the side reactions in furfural decarbonylation could be affected by the catalyst’s acidity, we measured the numbers of acidic sites on the three catalysts by the Fourier transform infrared spectroscopy (FTIR) spectroscopy of pyridine adsorption at different temperatures. As shown in Figure S5, peaks at 1540 and 1450 cm−1 were observed on the spectra of 1%Pt/DeAl-Hbeta, demonstrating that both Brønsted acid and Lewis acid sites were present on the catalyst. Moreover, the strength of the Lewis acid sites was rather high, as evidenced by the stable adsorption of pyridine at 623 K. For 1%Pt/MFI(NS), it merely contained Brønsted acid sites, as reflected by the peak at 1540 cm−1. The quantification analysis shows that the sums of the acid site numbers over these two catalysts were very similar (ca. 10 μmol·g−1, Table S3). In contrast, no acid sites were detected on 1%Pt/SBA-15, indicating that SBA-15 is a quite neutral catalyst support, which might contribute to the hindrance of side reactions during furfural decarbonylation.

2.1.2. Catalytic Performance of Different Catalysts

The catalytic performance of Pt loaded on the three silica supports was evaluated in a gas-phase furfural decarbonylation reaction in a fixed-bed reactor. The reactions were conducted at 573 K, with a weight hourly space velocity (WHSV) of 3.3 h−1 and molar ratio of H2 to furfural of 2.4.
As shown in Figure 2A, the furfural conversion over the 1%Pt/SBA-15 catalyst was maintained at 100% over the 6 h time on stream (TOS). By contrast, the 1%Pt/MFI(NS) and 1%Pt/DeAl-Hbeta catalysts showed inferior performance. Particularly, over 1%Pt/DeAl-Hbeta, the furfural conversion decreased from the initial 98% to 52% over the 6 h TOS, although the catalyst possessed the highest Pt dispersion among the three catalysts as discussed above.
For the furan selectivity, as shown in Figure 2B, both 1%Pt/SBA-15 and 1%Pt/MFI(NS) afforded stable values levelling off at 73% and 69%, respectively. Interestingly, the furan selectivity over 1%Pt/DeAl-Hbeta continuously increased from 33% to 55% as the reaction proceeded, in spite of the continuous decrease in the catalyst’s activity during the evaluation. The rising of the furan selectivity with the TOS over 1%Pt/DeAl-Hbeta might be related to the coke formation over the active sites, which caused the side reactions. Differently, the furan selectivity over 1%Pt/MFI(NS) was stable when the furfural conversion decreased slightly. This suggests that the gradual deactivation of 1%Pt/MFI(NS) did not change the properties of active sites, but merely reduced the number of available catalytic sites for the reaction. The product distribution and carbon balance data in the reaction are shown in Table S4. 2-MTHF (2-methyl-tetrahydrofuran) was the major detectable byproduct over these catalysts, but the selectivity was lower than 3.4%. The carbon balance in the reaction over 1%Pt/DeAl-Hbeta was the lowest one, consistent with the rapid catalyst deactivation. Taken together, the SBA-15-supported Pt catalyst showed the most outstanding performance in furfural conversion to furan among the three microporous or mesoporous catalysts.
From the results of physico-chemical property measurements of the catalysts discussed above, one may observe that the 1%Pt/SBA-15 catalyst did not bear a detectable number of acid sites, while ca. 10 μmol·g−1 of acid sites were observed over the 1%Pt/MFI(NS) and 1%Pt/DeAl-Hbeta catalysts. It is reported that the acid sites can cause furfural polymerization at high temperatures [29,30]. This could account for the rapid deactivation of the 1%Pt/MFI(NS) and 1%Pt/DeAl-Hbeta catalysts. Additionally, the pore size of the support would also play important roles in the catalyst performance [31,32,33]. For instance, for the 1%Pt/DeAl-Hbeta catalyst, which contained more abundant Pt active sites in the micropores of the support, its deactivation rate was notably higher than that of 1%Pt/MFI(NS), which possessed hierarchical micro-mesoporous structures. Therefore, taking into account the advantages of the low acidity and suitable mesoporous structure, which contributes to avoiding furfural polymerization and reactant mass transfer, respectively, the 1%Pt/SBA-15 catalyst afforded the best catalytic performance.

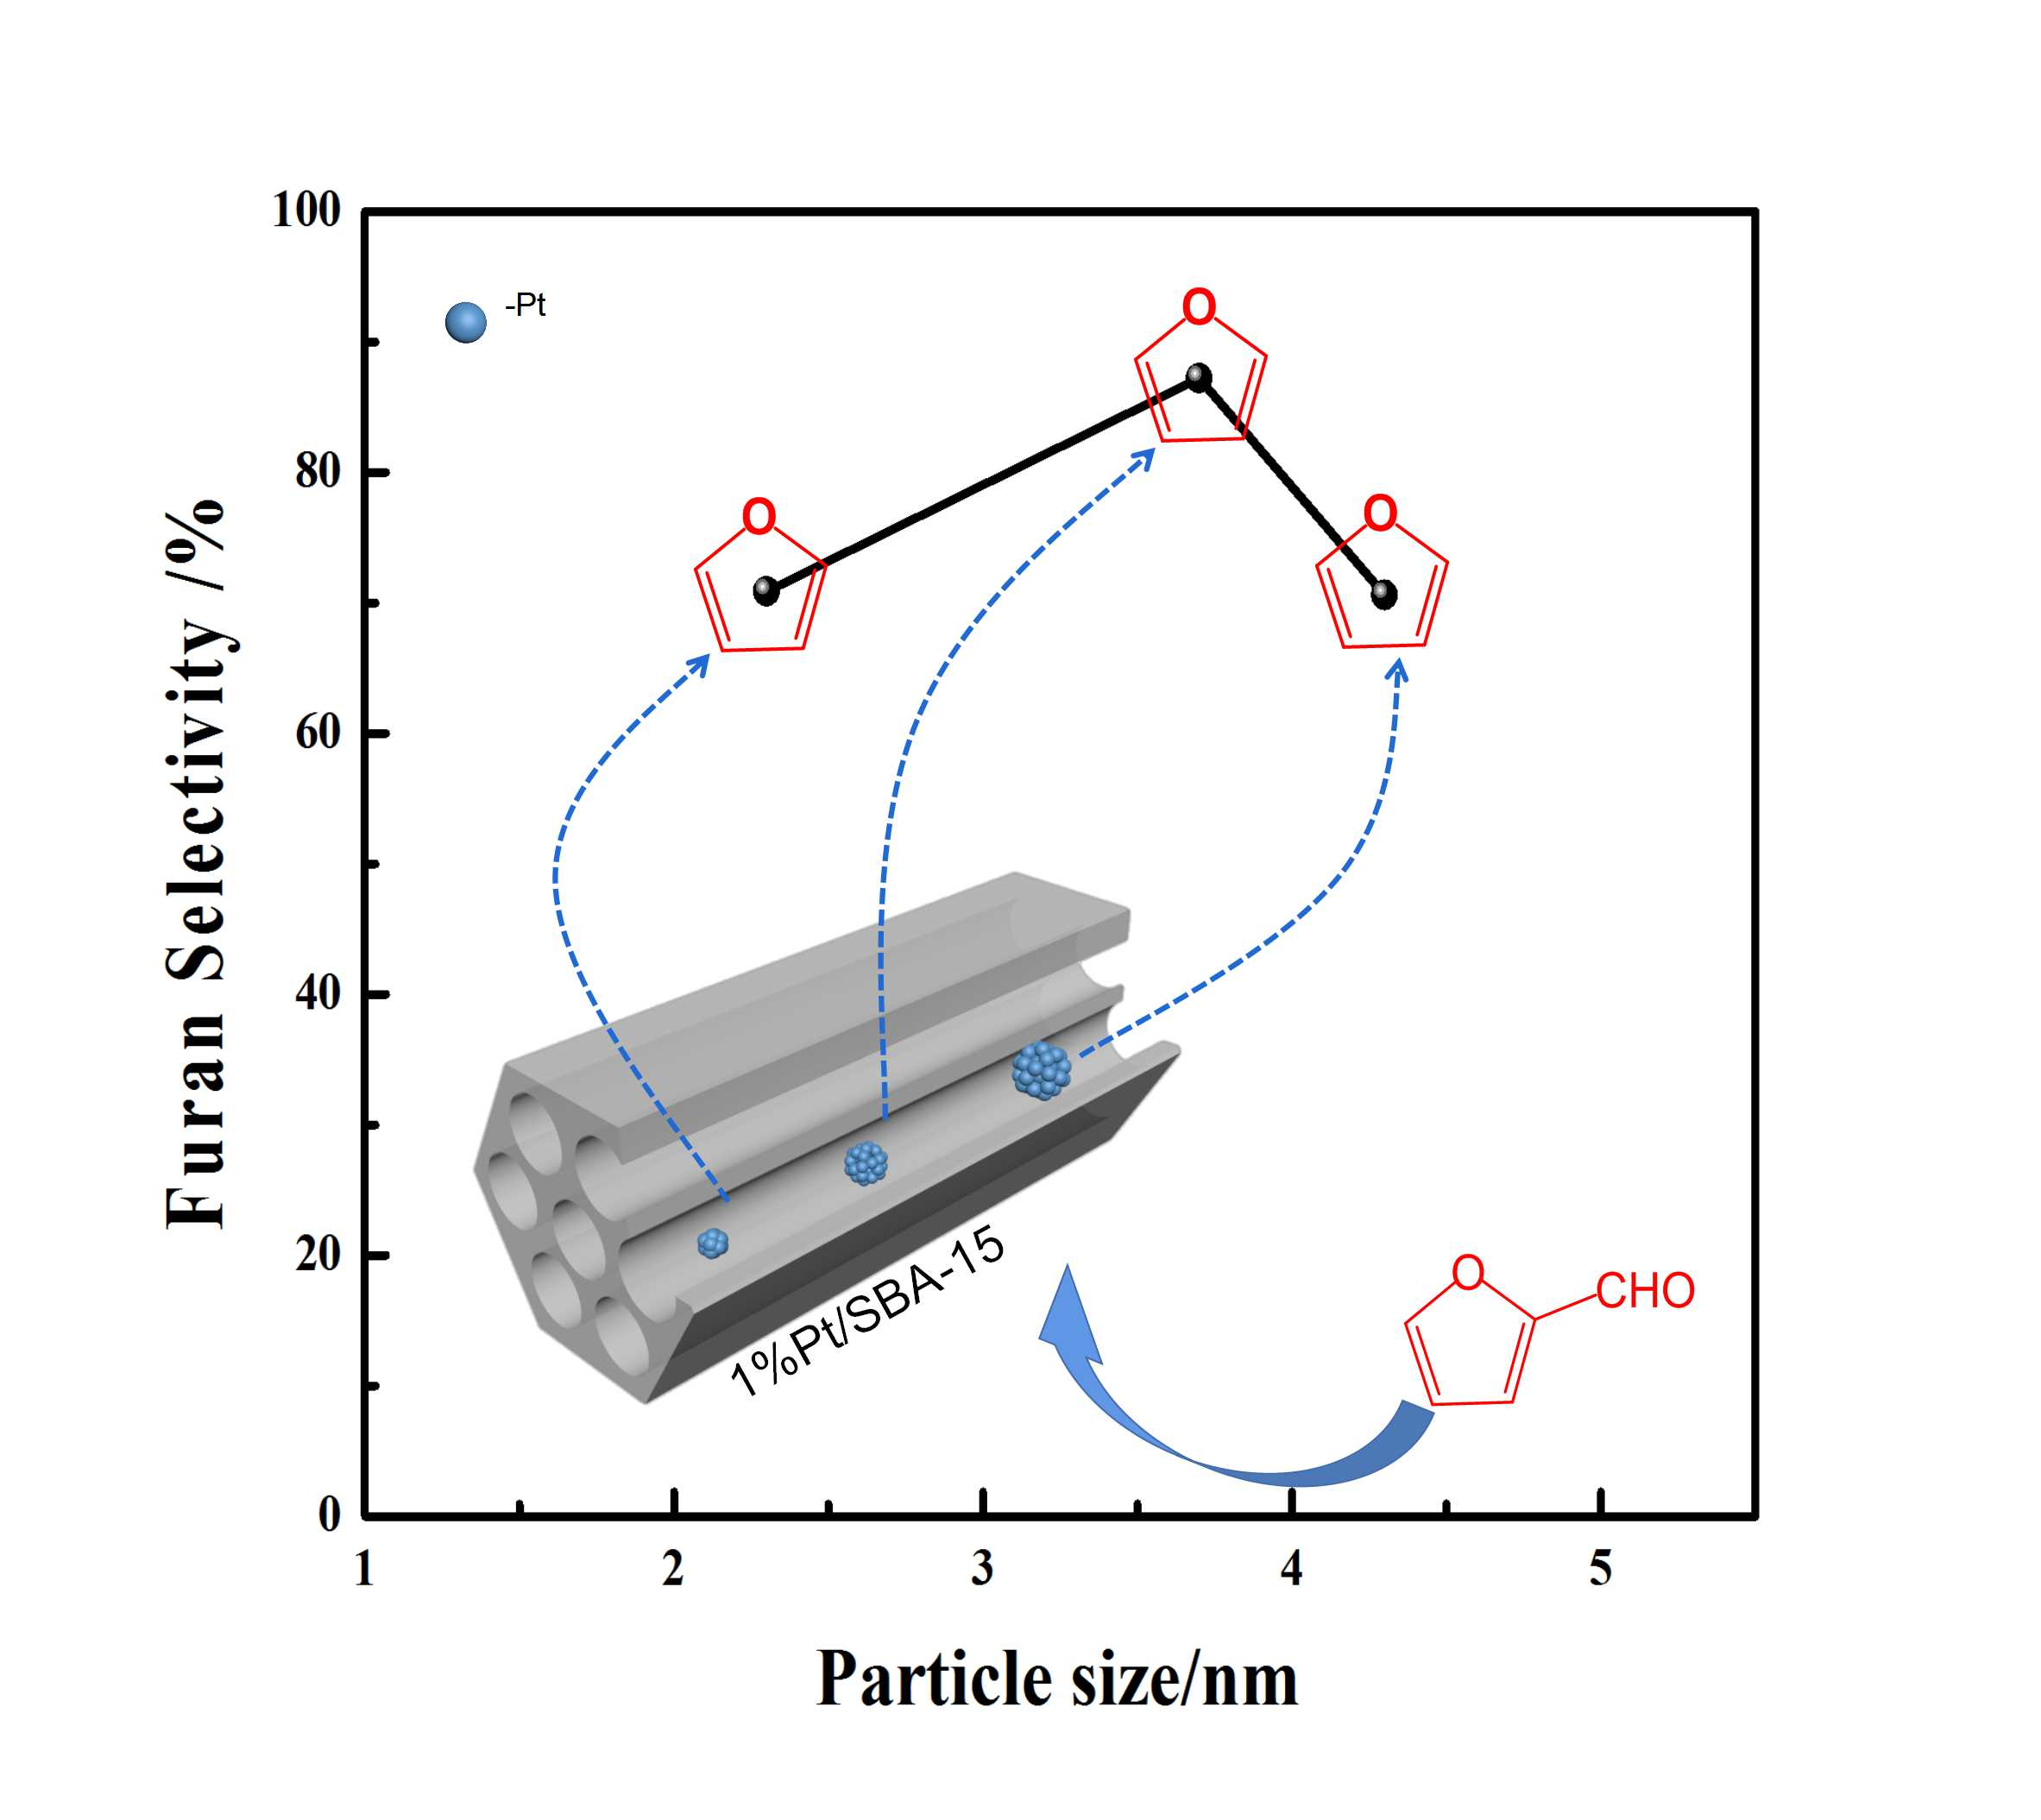
2.2. Effects of Sizes of Pt NPs over Pt/SBA-15 on the Reaction

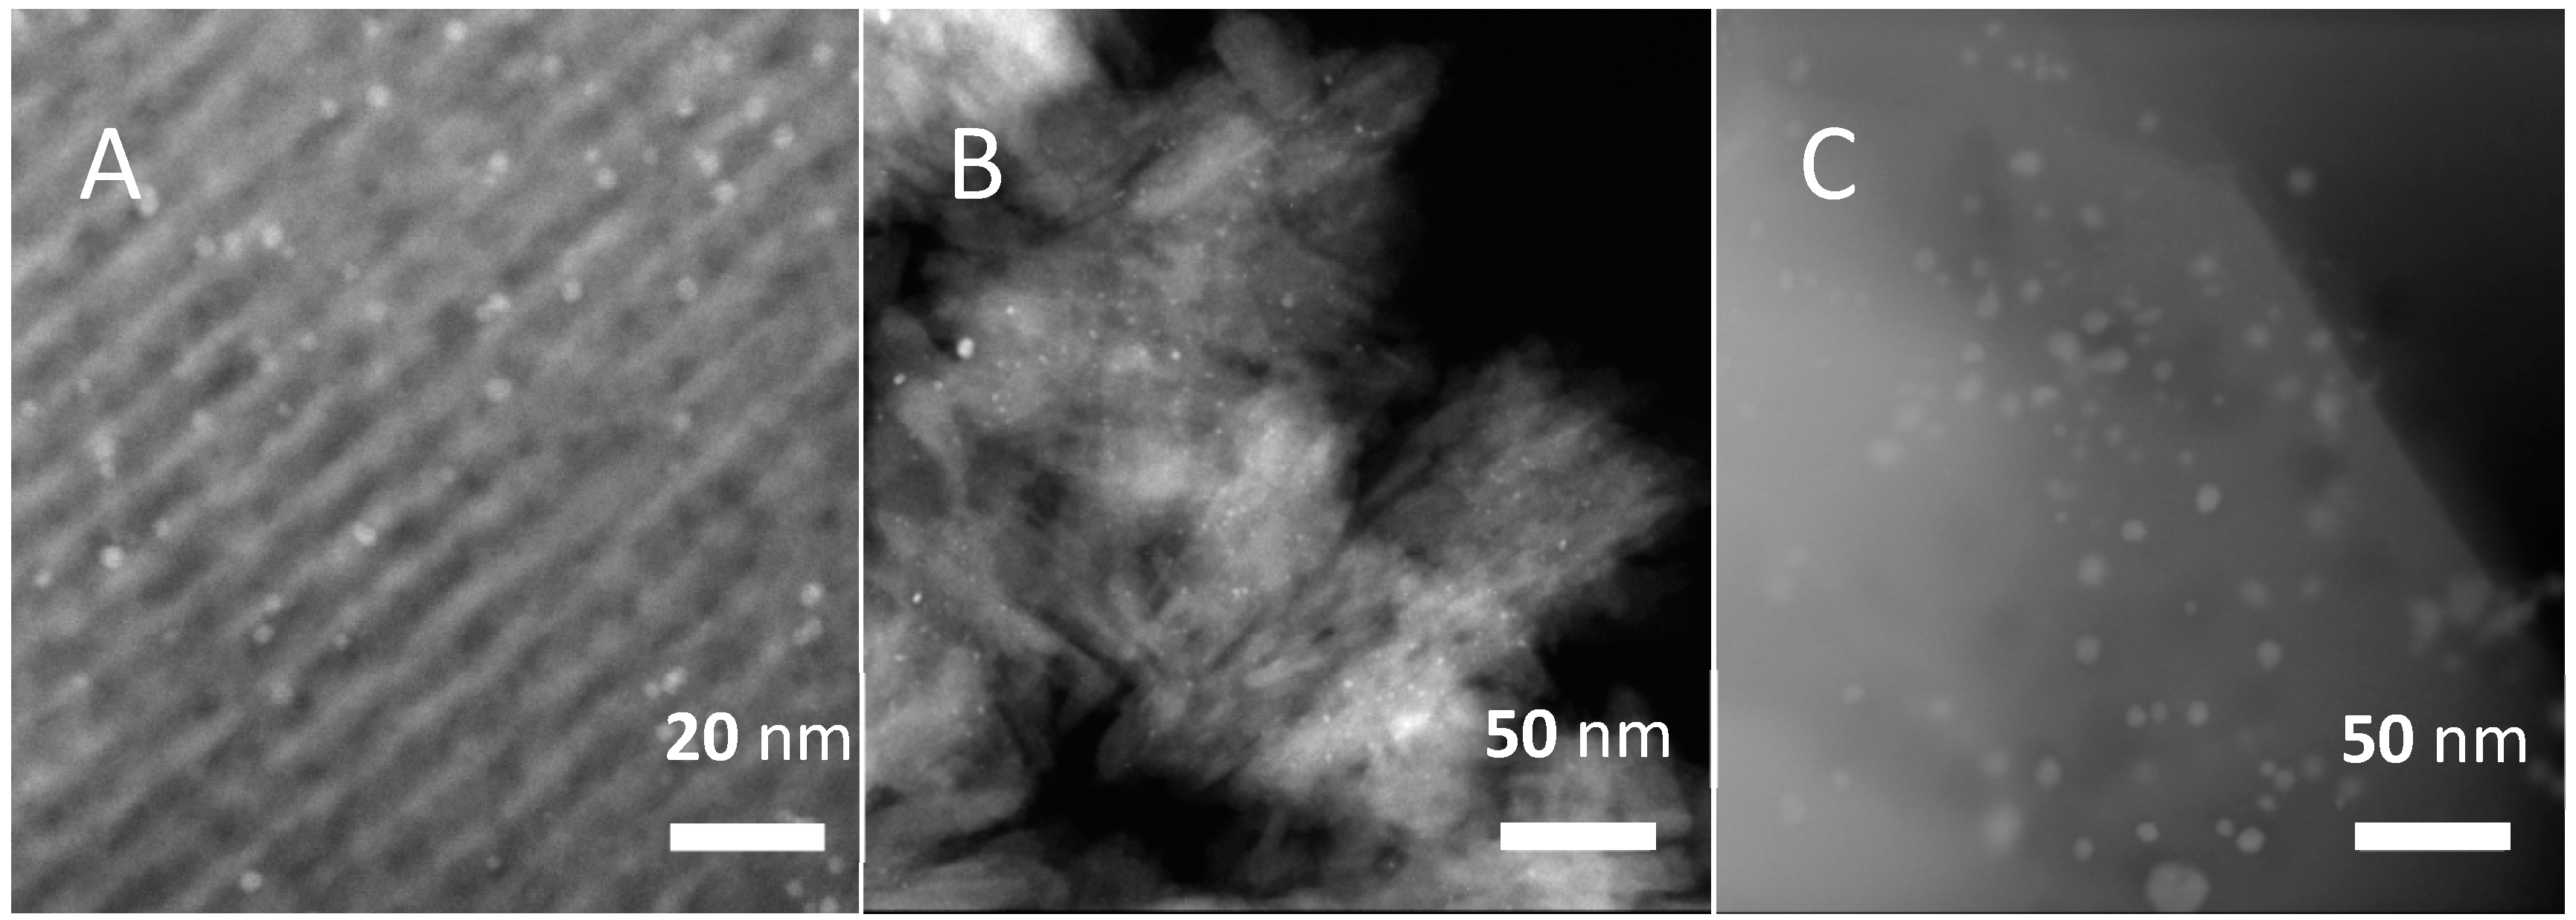
2.2.1. Results of Catalyst Characterization

Given that the decarbonylation of furfural to furan is a structure-sensitive reaction [5], we further investigated the effect of the Pt NP size on the catalysts. To obtain 1%Pt/SBA-15 catalysts with different Pt NP sizes, the catalysts were prepared under different preparation conditions, including varied pHs for the Pt salt solutions, calcination temperatures and impregnation processes [34,35]. For instance, the Pt/SBA-15 pH = 6A catalyst was prepared at a pH value of 6 and a calcination temperature of 573 K. The Pt/SBA-15 pH = 6B catalyst was prepared at a pH value of 6 and a calcination temperature of 773 K. For the Pt/SBA-15 pH = 6C catalyst, it was prepared by two-step impregnation and calcined at 573 K.
The physical properties of the 1%Pt/SBA-15 catalysts prepared under different conditions were investigated by XRD and N2 sorption analysis. As shown in Figure 3A, typical diffraction peaks owing to the metallic Pt were observed for the patterns of all the catalysts, while the full width at half maximum (FWHM) of the Pt peaks at 39.8° varied slightly as the catalyst preparation methods were changed. Using the Scherrer formula can roughly estimate the crystalline size of the nanoparticles according to the XRD patterns of the sample [36,37]. According to the Scherrer equation, the average crystalline sizes of the Pt NPs on the 1%Pt/SBA-15 catalysts were subtly tuned in a range of 3.5–9.5 nm (Table 1). The catalysts prepared at pH values of 1 and 2 had the smallest Pt NP size, while the catalyst prepared at a pH value of 6 and a higher temperature of 773 K had the largest Pt NP size. The N2 adsorption–desorption isotherms (Figure 3B) show that the mesoporous structures of the SBA-15 support were retained well in the various catalysts. Additionally, the specific surface areas of the catalysts were kept in a narrow range of 350–390 m2/g, with the same pore size for SBA-15 (7.8 nm).
The states of the Pt NPs on the SBA-15-supported catalysts were visualized by HRTEM. As shown in Figure 4A, all the 1%Pt/SBA-15 catalysts retained the original orderly channels of SBA-15, with an average diameter of 7–8 nm, consistent with the results of the N2 sorption measurements. Among the catalysts, the Pt NPs on 1%Pt-SBA-15-pH1 had the smallest size, which was centered at 2.4 nm (Figure 4B). The Pt NPs’ average sizes increased to 3.2–4.0 nm when the catalysts were prepared at higher pH values (Figure 4C,D). Elevating the calcination temperature from 573 to 773 K further enlarged the Pt NPs to ca. 4.3 nm and widened the NP size distribution (Figure 4E). The two-step impregnation method produced intermediate sizes of Pt NPs on the Pt/SBA-15 pH = 6C catalyst (Figure 4F).
The metal dispersions on the various 1%Pt/SBA-15 catalysts were also measured by CO chemisorption. As listed in Table 1, the Pt particle sizes determined by CO adsorption are notably larger than those observed from the TEM images. From the CO-FTIR spectra (Figure S6), both linear and bridge adsorptions of CO on the Pt NPs were observed [38,39]. This indicates that the Pt dispersion determined by CO adsorption was underestimated in our case. Although there are some discrepancies in the average NP sizes of the Pt as determined by the different methods, the values largely show the same tendency for the different catalysts. From the point of view of data accuracy, we preferred to use the TEM results to correlate the relationship between the Pt NP size and the catalytic performance.

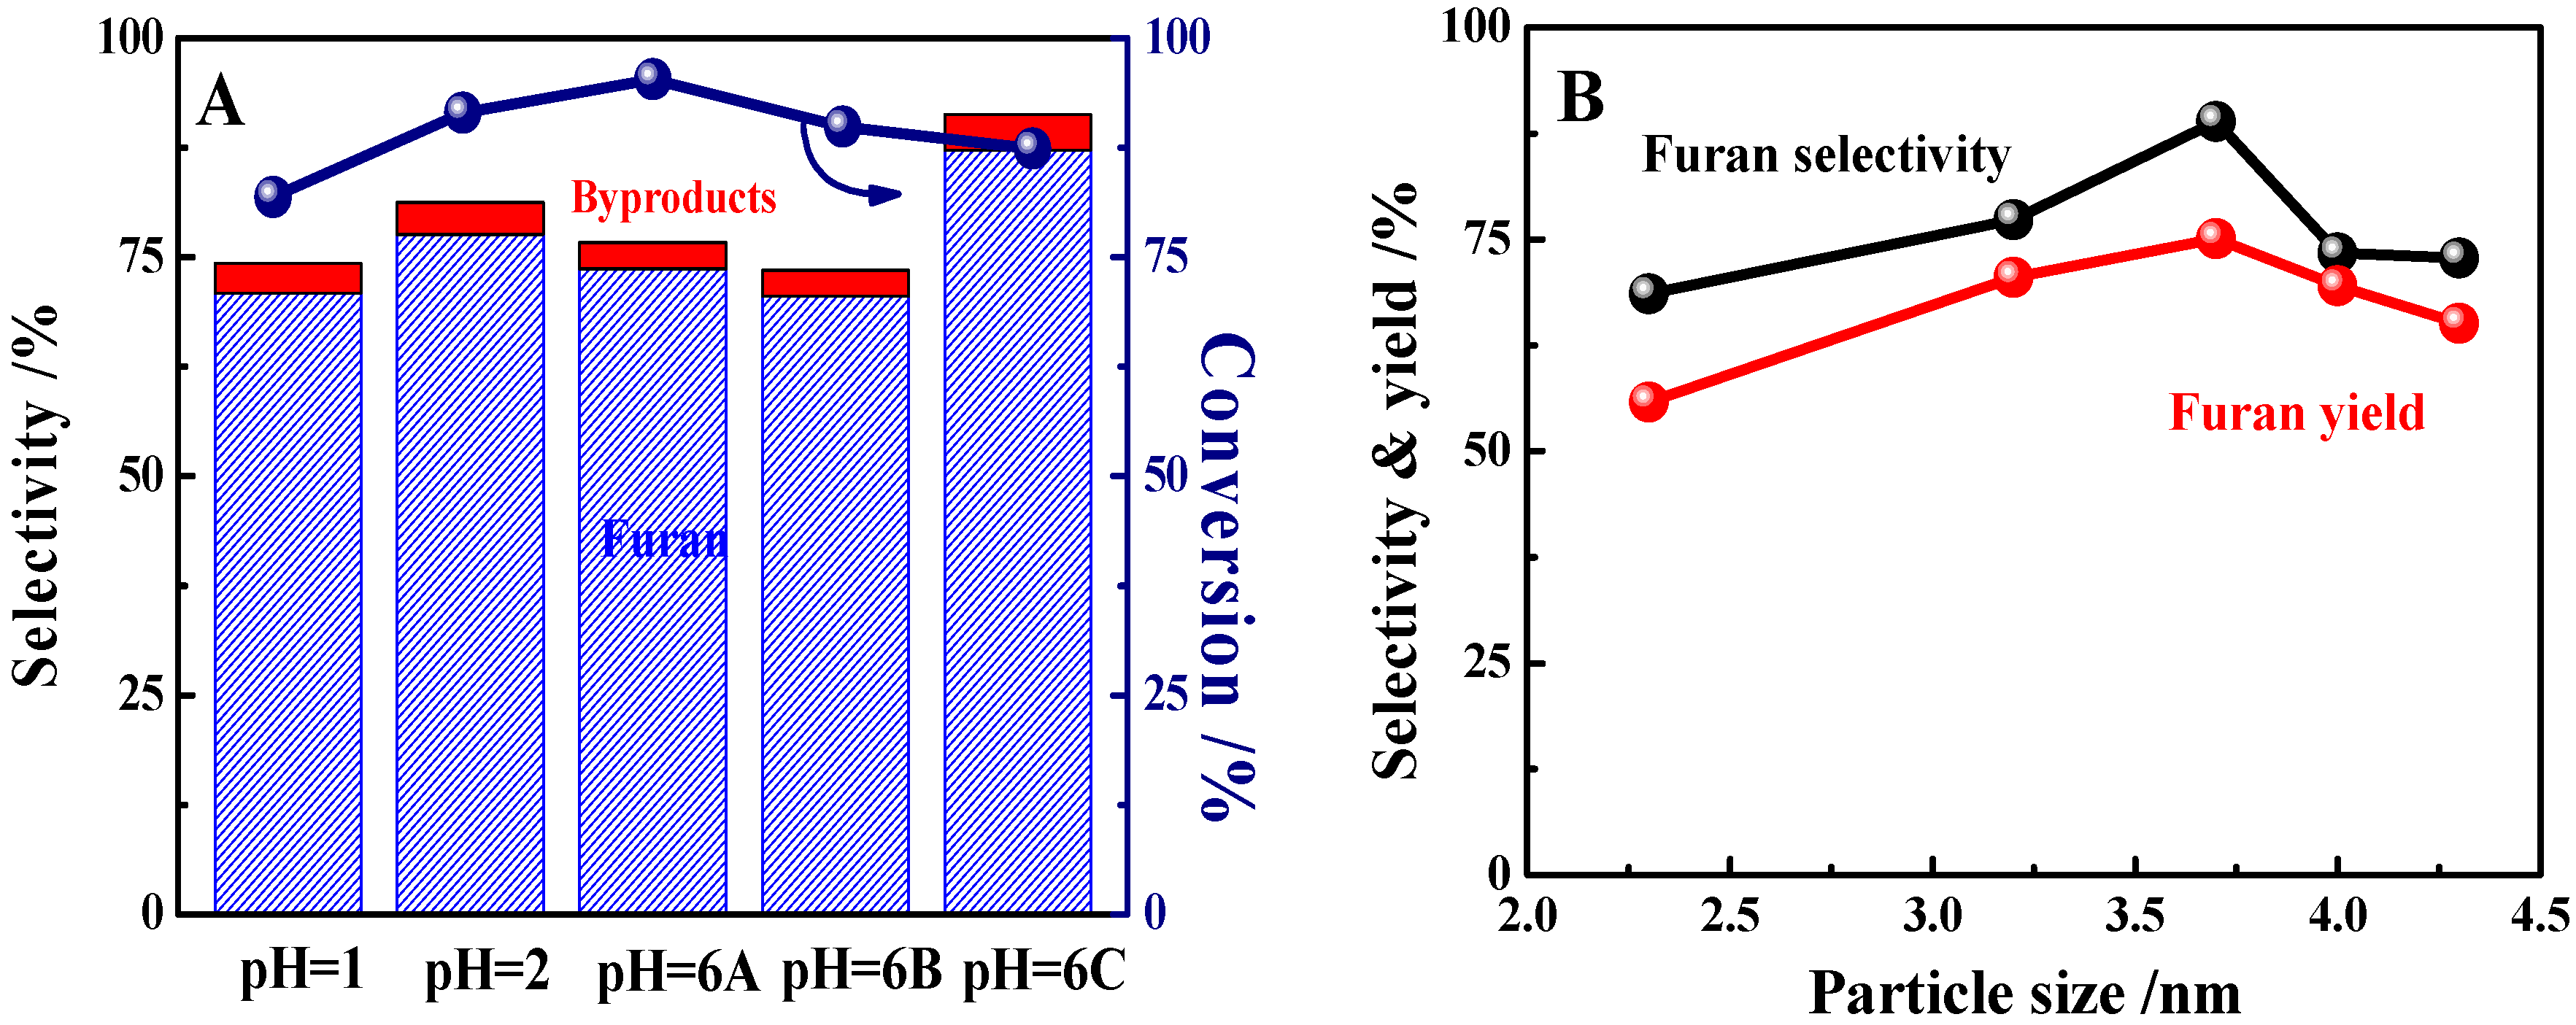
2.2.2. Catalytic Performance of Various 1%Pt/SBA-15 Catalysts

To more clearly compare the catalyst activity, the reactions were conducted at a high WHSV of 16.5 h−1 so that the conversions of furfural were confined below 100%. As shown in Figure 5A and Figure S7, the furfural conversion increased from 81.4% to 94.7% when increasing the preparing-solution pH values from 1 to 6. Increasing the calcination temperature to 773 K caused depressed furfural conversion. Regarding the furan selectivity, it was maximized at 77.3% at the pH value of 2. Interestingly, the two-step impregnation of Pt at pH 6 remarkably increased the furan selectivity to 88.9%, along with a high level of furfural conversion.
The correlation between the Pt particle size and furan selectivity and yield is depicted in Figure 5B. In the range of 2–5 nm, increasing the Pt particle sizes first increased and then decreased the furan selectivity and yield, giving maximums of 88.9% and 75.1%, respectively. According to previous studies, the rate of furfural decarbonylation is determined by the manner of the adsorption of the reactant on the metallic particle surface, which results in the structure-sensitivity of the reaction [40,41,42]. In our study, Pt NPs at a size of ca. 3.7 nm were suitable for achieving high selectivity for furan over the 1%Pt/SBA-15 catalysts. On the other hand, this finding is slightly different from that reported by Pushkarev et al., where the highest selectivity for furan was obtained over Pt particles at a small size of 1.5 nm [19]. The reason might be related to the different catalyst preparation methods (wet impregnation vs. poly(vinylpyrrolidone) capped and adsorption). Moreover, the reaction conditions were rather different (573 K, H2/furfural (mol) = 2.4, and furfural conversions >80% vs. 443–513 K, H2/furfural (mol) = 10, and furfural conversions < 2%), which may have a great influence on the reaction results [43,44]. In short, the Pt/SBA-15 catalysts studied herein were evaluated under conditions close to those in industrial operation, which can provide more valuable information for practical applications.

2.3. Effect of Reaction Temperature and H2/Furfural Ratio on Furfural Decarbonylation

Over the optimal 1%Pt/SBA-15 pH = 6C catalyst, the furfural conversion and product selectivity under different temperatures and hydrogen flows were tested. As shown in Figure 6A, the furfural conversion was 2.1% at 443 K, and gradually increased to 95.4% at 573 K. By contrast, the selectivity for furan was maintained at ca. 78% over the whole range of temperature. The selectivity for the hydrogenation product of 2-MTHF decreased with the temperature increase, which should be attributed to the lower energy barrier for C=O hydrogenation than that of C–C bond cleavage [11]. Increasing the molar ratio of H2 to furfural from 0.79 to 9.44 slightly enhanced the hydrogenation products (Figure 6B). The major product for this reaction was always furan, even at a high H2/furfural molar ratio of 9.4, with selectivity up to 88.6% at ca. 90% furfural conversion. This suggests that the decarbonylation of furfural over the Pt/SBA-15 catalysts can be operated over a wide range of hydrogen ratios and temperatures, which will benefit the coke depression and prolong the catalyst’s stability [5]. The advantage of 1%Pt/SBA-15 could be further noticed by comparing its performance with that of catalysts reported previously (Table 2). For instance, 74.8% furan selectivity was obtained at 15.7% furfural conversion over 1%Pt/SBA-15 at 503 K, in contrast to the 30.0% selectivity and 3.1% conversion obtained over Pt/MCF-17 at 493 K [19]. Moreover, the WHSV for the reaction over 1%Pt/SBA-15 was notably larger than that in most of the cases reported previously, but providing similar or even higher furan yields.
According to the product distribution over the 1%Pt/SBA-15 catalyst, the reaction pathway of furfural conversion is depicted in Scheme 1. Over the Pt catalyst, the decarbonylation of furfural is a major route (>75% selectivity) as the reaction takes place at 473–573 K, while 2-MTHF is the major byproduct at a reaction temperature below 533 K.

2.4. Catalyst Stability

The stability of the 1%Pt/SBA-15 catalyst is shown in Figure 7. The initial furan selectivity was 88% at 90% furfural conversion at 2 h of TOS. After a slight decrease at 20 h of TOS, the furfural conversion and furan selectivity were maintained at ca. 78% and 85%, respectively, at 90 h of TOS. The thermogravimetric (TG) analysis of the spent catalyst showed that there was ca. 18 wt% coke deposited on the catalyst, which may account for the catalytic performance deterioration [45]. Considering that the reaction was conducted under such a high WHSV, the catalytic activity of the 1%Pt/SBA-15 catalyst is attractive. Moreover, compared to the rapid deactivation within one to two days usually reported in the literature [46], the SBA-15-supported Pt catalyst exhibited a high level of stability. According to previous studies, introducing base components such as alkalis and alkaline earths to the support can remarkably prolong the running time of the catalyst [5]. Therefore, for the 1%Pt/SBA-15 catalyst, it would be highly possible to further improve the performance by using similar modifications in a future study.
The HRTEM images of the spent 1%Pt/SBA-15 catalyst after 90 h of running are shown in Figure 8. The Pt particle size distribution after the reaction was very close to that of the fresh catalyst. Most of the Pt particles were still fixed in the channels of the SBA-15. On the other hand, some Pt particles larger than 7 nm were observed, indicating that the high reaction temperature can lead to Pt nano-particle aggregation without the pore size confinement from the SBA-15 support. In short, the 1%Pt/SBA-15 catalyst demonstrated very promising catalytic activity, selectivity and stability in furfural decarbonylation. This should be attributed to the virtues of the SBA-15 support, including the negligible acid sites preventing coke formation, mesoporous structure dispersing the Pt NPs, and suitable pore size confining and stabilizing the Pt NPs.

3. Materials and Methods

3.1. Support and Catalyst Preparation

The SBA-15 support was prepared by a soft template method as reported previously [21,22]. In detail, 2 g of poly (ethylene glycol)-block-poly (propylene glycol)-block-poly (ethylene glycol) (P123) (Aladdin, Shanghai, China) was dissolved in a solution containing 15 g of ultrapure water and 60 g of HCl (2 mol/L) (Damao, Tianjin, China). Then, 4.25 g of tetraethyl orthosilicate (Xilong, Foshan, China) was added to the homogeneous solution with stirring. The mixture was continuously stirred at 313 K for 24 h, and hydrothermally aged in a Teflon-lined autoclave at 393 K for 12 h. The solid product was then centrifuged, filtered, washed with deionized water, and dried at 373 K for 12 h. Finally, the precursor was calcined in air at 873 K for 2 h to decompose the soft template and obtain the white powder of SBA-15.
MFI(NS) was prepared following a method previously reported [24,25]. Typically, tetrabutylphosphonium hydroxide (TBPOH) (Aladdin, Shanghai, China) was added dropwise into tetraethyl orthosilicate (Xilong, Foshan, China) under stirring, followed by deionized water addition. The mixture was stirred for 12 h, and a clear solution with the composition of 1SiO2/0.3TBPOH/10H2O/4EtOH (mol) was formed. The solution was sealed in a Teflon-lined stainless autoclave and heated in a pre-heated oven operating at 388 K for 40 h. After being filtered, dried at 373 K and calcined at 823 K for 4 h, the white powder of MFI(NS) was obtained.
The DeAl-Hbeta support (Nankai University, Tianjin, China) was prepared in the following way: 10 g of commercial Hbeta (SiO2/Al2O3 = 200) zeolite was pretreated with nitric acid (13 mol/L) (Damao, Tianjin, China) at 373 K for 12 h [47]. After filtration, washing with ultrapure water and drying at 373 K for 12 h, the white powder of DeAl-Hbeta (SiO2/Al2O3 = 257, determined by inductively coupled plasma optical emission spectrometry (ICP-OES) analysis) was obtained.
The Pt catalysts were prepared by the incipient-wetness impregnation method. Taking the 1%Pt/SBA-15 catalyst as an example, 1 g of 5% tetraamine platinum nitrate solution (Sigma-Aldrich, Shanghai, China) was dissolved in 17.5 g of ultrapure water for 30 min. Then, the solution pH was modified by adding a certain amount of 2-hydroxy-1,2,3-propanetricarboxylic acid (Aladdin, Shanghai, China). Finally, 5 g of SBA-15 was added into the solution and stirred fiercely. After drying at 393 K for 12 h, the sample was calcined at 673 K for 4 h and reduced at 573 K for 1 h in a H2 flow. According to the different pHs of the solution, the resulting catalysts were named as Pt/SBA-15 pH = X, X indicating the pH value of the solution. For the 1%Pt/SBA-15 pH = 6 A and B catalysts, they were calcined at 573 and 773 K, respectively. For the 1%Pt/SBA-15 pH = 6 C catalyst, it was prepared by a two-step impregnation method. A half amount of Pt was first introduced onto the SBA-15 and then calcined at 573 K. Then, it was re-impregnated by another half amount of Pt solution. Finally, it was reduced to form the 1%Pt/SBA-15 pH = 6 C catalyst. For comparison, the Pt catalysts supported on MFI(NS) and DeAl-Hbeta were prepared at pH = 6 and calcined at 573 K.

3.2. Catalyst Characterization

X-ray diffraction (XRD) patterns of the samples were collected on a PW3040/60 X’ Pert PRO diffractometer (PANalytical B. V., Almelo, The Netherlands) with Cu-Kα monochromated radiation (λ = 0.1541 nm) operated at 40 kV and 40 mA. Data were collected from 5° to 90° at a scanning speed of 14°/min.
N2 adsorption and desorption experiments were conducted on a Micromeritics ASAP 2460 system (Micromeritics, Norcross, GA, USA). Before the measurements, the samples were pretreated at 423 K for 3 h and then at 573 K for 4 h under vacuum conditions. The specific surface areas were calculated according to the Brunner-Emmet-Teller (BET) equation. The mesopore size distributions of the SBA-15 and MFI(NS) materials were determined by the Barrett-Joyner-Halenda (BJH) method according to the N2 desorption branch of isotherms. The micropore size of DeAl-Hbeta was calculated using the H-K formula. The microvolume was calculated by the t-plot method.
In situ SAXS experiments were performed on a modified Xeuss 2.0 system (Anton-Paar, Graz, Austria) with the wavelength of X-ray radiation of 0.154 nm. The sample wrapped by aluminum foil was mounted onto the hot stage at the beamline with a sample to detector distance of 2430 mm. At this distance the effective scattering vector q (q = (4πsinθ)/λ, where 2θ is the scattering angle and λ the wavelength of X-ray radiation) range is 0.1–4 nm−1.
Scanning electron microscopy (SEM) was used to observe the morphology of the Pt catalysts on different supports. The SEM images were obtained on a Hitachi S-4800 (HITACHI, Tokyo, Japan), operated at 5 kv.
High-resolution transmission electron microscopy (HRTEM) images were obtained on a JEM-2100F (JEOL, Tokyo, Japan), operated at a voltage of 200 kV. Before analysis, the catalysts were dispersed in ethanol and then mounted on C-coated Cu grids, followed by the slow evaporation of the solvent. The histograms of the Pt NP frequency distribution were obtained by measuring the diameters of two hundred Pt nanoparticles observed in the HRTEM images. The metal dispersion was estimated according to the equation D = 1.13/d, where d represents the averaged diameter of the metal nanoparticles from the TEM images.
CO-pulse chemical adsorption was measured by using the Micromeritics AutoChem II 2920 (Micromeritics, Norcross, GA, USA). Prior to adsorption, the sample was reduced at 573 K for 1 h and cooled to 323 K. Then, CO was introduced for adsorption. The metal dispersion and particle size were calculated with the following equations: D (dispersion) = Ns/Nt, and d (diameter) = 1.13/D, where Ns = mol of surface Pt, and Nt = mol of total Pt [48].
Thermogravimetric analysis (TG) was performed on a TA SDTQ600 analyzer (TA Instruments, Newcastle, DE, SA) with the temperature changing at a rate of 10 °C·min−1 from room temperature to 1073 K.
The acidic property of the catalysts was probed, and the acid sites were quantified by the observation of pyridine adsorption using a Bruker Tensor 27 instrument (Bruker, Billerica, MA, USA). The sample was pretreated at 623 K for 1 h under a vacuum pressure of 1.0 × 10⁻² Pa, and then, pyridine vapor was introduced at room temperature for 1 min. Afterwards, the pyridine-adsorbed catalyst was heated and evacuated at 423, 523 and 623 K, respectively, and the spectra were finally collected at room temperature. The acid sites were calculated with the following equations: C (pyridine on B sites) = 1.88 IA(B)R2/W, and C (pyridine on L sites) = 1.42 IA(L)R2/W, where C = the concentration (mmol·g−1), IA (B or L) = the integrated absorbance of the B or L bands (cm−1), R = the radius of the catalyst disk (cm), and W = the weight of the disk (mg) [49].
The states of the metallic Pt dispersed on the supports were probed by CO-FTIR analysis on a Bruker Tensor 27 instrument (Bruker, Billerica, MA, USA). In detail, the sample was reduced in H2 at 573 K for 1 h. Then, it was heated to 583 K, purged with a flow of N2 for 30 min and cooled to 298 K. After the saturated adsorption of CO, the gas phase or physically adsorbed CO was removed by flowing N2 until the spectrum was unchanged, and then, the spectra were collected.

3.3. Furfural Decarbonylation

The furfural decarbonylation reaction was conducted in a home-made fixed-bed reactor at ambient pressure. The stainless-steel reactor (5 mm i.d.) was mounted vertically, which allowed for downflow operation. For the reaction operated at 3.3 h−1 WHSV, 1.0 g of catalyst (40–60 meshes) was loaded in the middle of the reactor tube. For the reaction at 16.5 h−1 WHSV, 0.2 g of catalyst mixed with 4.0 g of quartz sands (Damao, Tianjin, China) was charged in the reactor. The catalysts were reduced in situ in a stream of pure H2 (60 mL/min) at 573 K for 1 h before the activity evaluation. In detail, 0.1–0.2 g of catalyst was charged into the reactor and reduced on-line at 573 K for 1 h in flowing H2. Then, furfural (Aladdin, Shanghai, China) was introduced into the system by a high-pressure pump. After passing through a preheated gasification chamber (443 K), the furfural gas was introduced into the reactor and reacted under different conditions. Finally, the products were adsorbed in DMF (N,N-dimethylformamide) (Damao, Tianjin, China) solvent, which was cooled at 268 K. The liquid products were analyzed on a Gas Chromatograph (Agilent Technologies 6890, Santa Clara, CA, USA) equipped with a flame ionization detector and a Varian CP-WAX58 (FFAP) CB capillary column.
The furfural conversion and product selectivity were calculated according to the following equations:
Conversion   ( % ) = ( 1 mol   of   unreacted   furfural mol   of   furfural   injected   into   the   reactor ) × 100
Yield   ( % ) = ( mol   of   product mol   of   furfural   injected   into   the   reactor ) × 100
Selectivity   ( % ) = yield conversion × 100

4. Conclusions

In summary, porous silica material-supported Pt catalysts were prepared for gas-phase furfural decarbonylation. Compared to microporous DeAl-Hbeta and hierarchical micro-mesoporous MFI nanosheets, the SBA-15-supported Pt catalysts showed higher furan selectivity and stable activity. The superior performance of 1%Pt/SBA-15 was attributed to the less acid sites and mesoporous structure, which inhibited furfural polymerization, favored reactant transfer and readily realized the high dispersion of Pt NPs. The furan selectivity showed dependence on the Pt NP sizes on the catalysts, and reached the highest value at the Pt NP size of ca. 3.7 nm. Over the optimal 1%Pt/SBA-15 catalyst, 88.6% furan selectivity and ca. 90% furfural conversion were obtained at 573 K and a high WHSV of 16.5 h−1. The catalyst was stable under the harsh reaction conditions and maintained high performance over the 90 h of TOS. Moreover, the furan selectivity was not affected notably at reaction temperatures of 44–573 K and the H2-to-furfural ratio of 0.79–9.44, endowing the 1%Pt/SBA-15 catalyst with a wide range of operational conditions.

Supplementary Materials

The following are available online at https://www.mdpi.com/2073-4344/10/11/1304/s1. Figure S1: N2 sorption isotherms of Pt catalysts on different supports. Figure S2: XRD patterns of 1%Pt/SBA-15, 1%Pt/MFI(NS) and 1%Pt/DeAl-Hbeta catalysts. Figure S3: Small-angle X-ray scattering patterns of SBA-15 and Pt/SBA-15. Figure S4: SEM images of (A) 1%Pt/SBA-15, (B) 1%Pt/MFI(NS) and (C) 1%Pt/DeAl-Hbeta. Figure S5: Pyridine-IR spectra of (A) 1%Pt/SBA-15, (B) 1%Pt/MFI(NS) and (C) 1%Pt/DeAl-Hbeta catalysts desorbed at 423, 523 and 623 K. Figure S6: CO-FTIR spectra of 1%Pt/SBA-15 catalysts prepared under different conditions. Figure S7: (A) Furfural conversion and (B) furan selectivity as a function of time on stream. Table S1: Specific surface areas and pore structures of the silica supports and Pt catalysts. Table S2: Metallic Pt dispersion and nanoparticle size of Pt determined by CO-pulse adsorption. Table S3: Numbers of acid sites on different silica-supported Pt catalysts. Table S4: Catalytic performance of the various catalysts.

Author Contributions

Q.Y. conducted the experiments, analyzed data and prepared the draft. J.P. contributed to the scientific discussion of the results and prepared the draft. W.Y. contributed to the catalyst characterizations by using chemosorption. M.Z. designed the study and revised the manuscript. All authors have read and agreed to the published version of the manuscript.

Funding

This work was supported by the National Natural Science Foundation of China (21690081, 21721004 and 21776268) and “Transformational Technologies for Clean Energy and Demonstration”, Strategic Priority Research Program of the Chinese Academy of Sciences (No. XDA 21060200).

Conflicts of Interest

The authors declare no conflict of interest.

References

  1. Dau, X.D. Recent progress in the synthesis of furan. Mini-Rev. Org. Chem. 2019, 16, 422–452. [Google Scholar]
  2. Cao, H.; Rupar, P.A. Recent advances in conjugated furans. Chem. Eur. J. 2017, 23, 14670–14675. [Google Scholar] [CrossRef]
  3. Li, X.; Jia, P.; Wang, T. Furfural: A promising platform compound for sustainable production of C4 and C5 chemicals. ACS Catal. 2016, 6, 7621–7640. [Google Scholar] [CrossRef]
  4. Agirrezabal-Telleria, I.; Gandarias, I.; Arias, P.L. Heterogeneous acid-catalysts for the production of furan-derived compounds (furfural and hydroxymethylfurfural) from renewable carbohydrates: A review. Catal. Today 2014, 234, 42–58. [Google Scholar] [CrossRef]
  5. Mariscal, R.; Maireles-Torres, P.; Ojeda, M.; Sádaba, I.; López Granados, M. Furfural: A renewable and versatile platform molecule for the synthesis of chemicals and fuels. Energy Environ. Sci. 2016, 9, 1144–1189. [Google Scholar] [CrossRef]
  6. Chen, S.; Wojcieszak, R.; Dumeignil, F.; Marceau, E.; Royer, S. How catalysts and experimental conditions determine the selective hydroconversion of furfural and 5-hydroxymethylfurfural. Chem. Rev. 2018, 118, 11023–11117. [Google Scholar] [CrossRef] [Green Version]
  7. Peleteiro, S.; Rivas, S.; Luis Alonso, J.; Santos, V.; Carlos Parajo, J. Furfural production using ionic liquids: A review. Bioresour. Technol. 2016, 202, 181–191. [Google Scholar] [CrossRef]
  8. Sitthisa, S.; Resasco, D.E. Hydrodeoxygenation of furfural over supported metal catalysts: A comparative study of Cu, Pd and Ni. Catal. Lett. 2011, 141, 784–791. [Google Scholar] [CrossRef]
  9. Bhogeswararao, S.; Srinivas, D. Catalytic conversion of furfural to industrial chemicals over supported Pt and Pd catalysts. J. Catal. 2015, 327, 65–77. [Google Scholar] [CrossRef]
  10. Coca, J.; Morrondo, E.S.; Sastre, H. Catalytic decarbonylation of furfural in a fixed-bed reactor. J. Chem. Technol. Biotechnol. 1982, 32, 904–908. [Google Scholar] [CrossRef]
  11. Srivastava, R.D.; Guha, A.K. Kinetics and mechanism of deactivation of Pd-Al2O3 catalyst in the gaseous-phase decarbonylation of furfural. J. Catal. 1985, 91, 254–262. [Google Scholar] [CrossRef]
  12. Wang, S.; Vorotnikov, V.; Vlachos, D.G. Coverage-induced conformational effects on activity and selectivity: Hydrogenation and decarbonylation of furfural on Pd(111). ACS Catal. 2015, 5, 104–112. [Google Scholar] [CrossRef] [Green Version]
  13. Singh, H.; Prasad, M.; Srivastava, R.D. Metal support interactions in the palladium-catalysed decomposition of furfural to furan. J. Chem. Technol. Biotechnol. 1980, 30, 293–296. [Google Scholar] [CrossRef]
  14. Stevens, J.G.; Bourne, R.A.; Twigg, M.V.; Poliakoff, M. Real-time product switching using a twin catalyst system for the hydrogenation of furfural in supercritical CO2. Angew. Chem. Int. Ed. 2010, 49, 8856–8859. [Google Scholar] [CrossRef]
  15. Zhang, W.; Zhu, Y.; Niu, S.; Li, Y. A study of furfural decarbonylation on K-doped Pd/Al2O3 catalysts. Mol. Catal. 2011, 335, 71–81. [Google Scholar] [CrossRef]
  16. An, N.; Ainembabazi, D.; Reid, C.; Samudrala, K.; Wilson, K.; Lee, A.F.; Voutchkova-Kostal, A. Microwave-assisted decarbonylation of biomass-derived aldehydes using Pd-doped hydrotalcites. ChemSusChem 2020, 13, 312–320. [Google Scholar] [CrossRef]
  17. Ishida, T.; Honma, T.; Nakada, K.; Murayama, H.; Mamba, T.; Kume, K.; Izawa, Y.; Utsunomiya, M.; Tokunaga, M. Pd-catalyzed decarbonylation of furfural: Elucidation of support effect on Pd size and catalytic activity using in-situ XAFS. J. Catal. 2019, 374, 320–327. [Google Scholar] [CrossRef]
  18. Fellah, M.F. Direct decarbonylation of furfural to furan: A density functional theory study on Pt-graphene. Appl. Surf. Sci. 2017, 405, 395–404. [Google Scholar] [CrossRef]
  19. Pushkarev, V.V.; Musselwhite, N.; An, K.; Alayoglu, S.; Somorjai, G.A. High structure sensitivity of vapor-phase furfural decarbonylation/hydrogenation reaction network as a function of size and shape of Pt nanoparticles. Nano Lett. 2012, 12, 5196–5201. [Google Scholar] [CrossRef]
  20. Godawa, A.G.; Kalck, P.; Maire, Y. Mise en oeuvre d’un catalyseur actif pour l’hydrogenation selective du furanne en tetrahydrofuranne. J. Mol. Catal. 1986, 34, 199–212. [Google Scholar] [CrossRef]
  21. Zhao, D.; Huo, Q.; Feng, J.; Chmelka, B.F.; Stucky, G.D. Nonionic triblock and star diblock copolymer and oligomeric surfactant syntheses of highly ordered, hydrothermally stable, mesoporous silica structures. J. Am. Chem. Soc. 1998, 120, 6024–6036. [Google Scholar] [CrossRef]
  22. Tu, C.; Wang, A.; Zheng, M. Factors influencing the catalytic activity of SBA-15-supported copper nanoparticles in CO oxidation. Appl. Catal. A Gen. 2006, 297, 40–47. [Google Scholar] [CrossRef]
  23. Varoon, K.; Zhang, X.Y.; Elyassi, B. Dispersible exfoliated zeolite nanosheets and their application as a selective membrane. Science 2011, 6052, 72–75. [Google Scholar] [CrossRef] [PubMed] [Green Version]
  24. Wang, C.; Zheng, M.; Li, X.; Li, X.; Zhang, T. Catalytic conversion of ethanol into butadiene over high performance LiZnHf-MFI zeolite nanosheets. Green Chem. 2019, 21, 1006–1010. [Google Scholar] [CrossRef]
  25. Li, X.; Pang, J.; Wang, C.; Li, L.; Pan, X.; Zheng, M.; Zhang, T. Conversion of ethanol to 1,3-butadiene over high-performance Mg–ZrOx/MFI nanosheet catalysts via the two-step method. Green Chem. 2020, 22, 2852–2861. [Google Scholar] [CrossRef]
  26. Mark, E.D.; Raul, F.L. Zeolite and molecular sieve synthesis. Chem. Mater. 1992, 4, 756–768. [Google Scholar]
  27. Yu, W.; Hsu, Y.P.; Tan, C.S. Synthesis of rhodium-platinum bimetallic catalysts supported on SBA-15 by chemical fluid deposition for the hydrogenation of terephthalic acid in water. Appl. Catal. B-Environ. 2016, 196, 185–192. [Google Scholar] [CrossRef]
  28. Pang, J.; Zheng, M.; Li, X.; Song, L.; Sun, R.; Sebastian, J.; Wang, A.; Wang, J.; Wang, X.; Zhang, T. Catalytic conversion of carbohydrates to methyl lactate using isolated tin sites in SBA-15. ChemistrySelect 2017, 2, 309–314. [Google Scholar] [CrossRef]
  29. Ishida, T.; Kume, K.; Kinjo, K.; Honma, T.; Nakada, K.; Ohashi, H.; Yokoyama, T.; Hamasaki, A.; Murayama, H.; Izawa, Y.; et al. Efficient decarbonylation of furfural to furan catalyzed by Zirconia-supported Palladium clusters with low atomicity. ChemSusChem 2016, 9, 3441–3447. [Google Scholar] [CrossRef]
  30. Shao, Y.; Hua, X.; Zhang, Z. Direct conversion of furfural to levulinic acid/ester in dimethoxymethane: Understanding the mechanism for polymerization. Green Energy Environ. 2019, 4, 400–413. [Google Scholar] [CrossRef]
  31. van Donk, S.; Bitter, J.H.; Verberckmoes, A.; Versluijs-Helder, M.; Broersma, A.; de Jong, K.P. Physicochemical characterization of porous materials: Spatially resolved accessibility of zeolite crystals. Angew. Chem. Int. Edit. 2005, 44, 1360–1363. [Google Scholar] [CrossRef] [PubMed] [Green Version]
  32. Chal, R.; Gerardin, C.; Bulut, M.; van Donk, S. Overview and industrial assessment of synthesis strategies towards zeolites with mesopores. ChemCatChem 2011, 3, 67–81. [Google Scholar] [CrossRef]
  33. Jin, F.; Cui, Y.; Li, Y. Effect of alkaline and atom-planting treatment on the catalytic performance of ZSM-5 catalyst in pyridine and picolines synthesis. Appl. Catal. A Gen. 2008, 350, 71–78. [Google Scholar] [CrossRef]
  34. Li, X.; Chen, W.; Zhao, J.; Xing, W.; Xu, Z. Microwave polyol synthesis of Pt/CNTs catalysts: Effects of pH on particle size and electrocatalytic activity for methanol electrooxidization. Carbon 2005, 43, 2168–2174. [Google Scholar] [CrossRef]
  35. Rajesh, K.M.; Ajitha, B.; Reddy, Y.A.K.; Suneetha, Y.; Reddy, P.S. Synthesis of copper nanoparticles and role of pH on particle size control. Mater. Today-Proc. 2016, 3, 1985–1991. [Google Scholar] [CrossRef]
  36. Borchert, H.; Shevchenko, E.V.; Robert, A.; Mekis, I.; Kornowski, A.; Grubel, G.; Weller, H. Determination of nanocrystal sizes: A comparison of TEM, SAXS, and XRD studies of highly monodisperse CoPt3 particles. Langmuir 2005, 21, 1931–1936. [Google Scholar] [CrossRef]
  37. Patterson, A.L. The Scherrer formula for X-Ray particle size determination. Phys. Rev. 1939, 56, 978–982. [Google Scholar] [CrossRef]
  38. Lee, J.; Jang, E.J.; Oh, D.G.; Szanyi, J.; Kwak, J.H. Morphology and size of Pt on Al2O3: The role of specific metal-support interactions between Pt and Al2O3. J. Catal. 2020, 385, 204–212. [Google Scholar] [CrossRef]
  39. Jiao, L.; Regalbuto, J.R. The synthesis of highly dispersed noble and base metals on silica via strong electrostatic adsorption: II. Mesoporous silica SBA-15. J. Catal. 2008, 260, 342–350. [Google Scholar] [CrossRef]
  40. Xue, J.; Wang, Y.; Meng, Y.; Zhou, X.; Pan, G.; Xia, S. Theoretical investigation of decarbonylation mechanism of furfural on Pd (111) and M/Pd(111)(M = Ru, Ni, Ir) surfaces. Mol. Catal. 2020, 493, 111054. [Google Scholar] [CrossRef]
  41. Falivene, L.; Kozlov, S.M.; Cavallo, L. Constructing bridges between computational tools in heterogeneous and homogeneous catalysis. ACS Catal. 2018, 8, 5637–5656. [Google Scholar] [CrossRef]
  42. Taylor, M.J.; Jiang, L.; Reichert, J.; Papageorgiou, A.C.; Beaumont, S.K.; Wilson, K.; Lee, A.F.; Barth, J.V.; Kyriakou, G. Catalytic hydrogenation and hydrodeoxygenation of furfural over Pt(111): A model system for the rational design and operation of practical biomass conversion. J. Phys. Chem. C 2017, 121, 8490–8497. [Google Scholar] [CrossRef] [PubMed]
  43. Qian, M.; Xue, J.; Xia, S.; Ni, Z.; Jiang, J.; Cao, Y. Decarbonylation and hydrogenation reaction of furfural on Pd/Cu(111) surface. J. Fuel Chem. Techno. 2017, 45, 34–42. [Google Scholar] [CrossRef]
  44. Pino, N.; Sitthisa, S.; Tan, Q.; Souza, T.; López, D.; Resasco, D.E. Structure, activity, and selectivity of bimetallic Pd-Fe/SiO2 and Pd-Fe/γ-Al2O3 catalysts for the conversion of furfural. J. Catal. 2017, 350, 30–40. [Google Scholar] [CrossRef] [Green Version]
  45. Jiménez-Gómez, C.P.; Cecilia, J.A.; García-Sancho, C.; Moreno-Tost, R.; Maireles-Torres, P. Selective production of furan from gas-phase furfural decarbonylation on Ni-MgO catalysts. ACS Sustain. Chem. Eng. 2019, 7, 7676–7685. [Google Scholar] [CrossRef]
  46. Lange, J.P.; van der, H.; Evan, B. Furfural- A promising platform for lignocellulosic biofuels. ChemSusChem 2012, 5, 150–166. [Google Scholar] [CrossRef]
  47. Chen, C.; Zhang, S.; Wang, Z. Ultrasmall Co confined in the silanols of dealuminated beta zeolite: A highly active and selective catalyst for direct dehydrogenation of propane to propylene. J. Catal. 2020, 383, 77–87. [Google Scholar] [CrossRef]
  48. Xia, S.; Nie, R.; Lu, X.; Wang, L.; Chen, P.; Hou, Z. Hydrogenolysis of glycerol over Cu0.4/Zn5.6−xMgxAl2O8.6 catalysts: The role of basicity and hydrogen spillover. J. Catal. 2012, 296, 1–11. [Google Scholar] [CrossRef]
  49. Pang, J.; Zheng, M.; He, L.; Li, L.; Pan, X.; Wang, A.; Wang, X.; Zhang, T. Upgrading ethanol to n-butanol over highly dispersed Ni–MgAlO catalysts. J. Catal. 2016, 344, 184–193. [Google Scholar] [CrossRef]
Figure 1. HRTEM images of (A) 1%Pt/SBA-15, (B) 1%Pt/MFI(NS), and (C) 1%Pt/DeAl-Hbeta (2–8 nm).
Catalysts 10 01304 g001
Figure 2. (A) Furfural conversion and (B) furan selectivity over Pt catalysts on different supports (reaction conditions: 573 K, weight hourly space velocity (WHSV) = 3.3 h−1, H2/furfural (mol) = 2.4).
Catalysts 10 01304 g002
Figure 3. (A) XRD patterns and (B) N2 sorption isotherms of 1%Pt-SBA-15 catalysts prepared under different conditions.
Catalysts 10 01304 g003
Figure 4. HRTEM images of (A) SBA-15, (B) 1%Pt-SBA-15 pH = 1, (C) 1%Pt-SBA-15 pH = 2, (D) 1%Pt-SBA-15 pH = 6A, (E) 1%Pt-SBA-15 pH = 6B and (F) 1%Pt-SBA-15 pH = 6C. The insets in images (BF) are the histograms of the Pt NP frequency distributions.
Catalysts 10 01304 g004
Figure 5. (A) Furfuran conversions over Pt/SBA-15 catalysts prepared under different conditions (furfural conversion and furan selectivity are the average values from 2 to 6 h time on stream (TOS) shown in Figure S7) and (B) effect of Pt particle size on furan selectivity and yield (reaction conditions: 573 K, WHSV = 16.5 h−1, H2/furfural (mol) = 2.4). Note: besides furan as the major product, byproducts including 2-methylfuran (2-MF) and 2-methyltetrahydrofuran (2-MTHF) were detected in the reaction, accounting for the ca. 0.7–4.8% selectivity.
Catalysts 10 01304 g005
Figure 6. Furfural conversion, furan selectivity and hydrogenation product selectivity over 1%Pt/SBA-15 pH = 6C at the first hour of the reaction as a function of (A) temperature (H2/furfural (mol) = 2.4, WHSV = 16.5 h−1) and (B) H2/furfural (mol) (573 K, WHSV = 16.5 h−1).
Catalysts 10 01304 g006
Scheme 1. Reaction pathway of furfural conversion over the 1%Pt/SBA-15 catalyst.
Catalysts 10 01304 sch001
Figure 7. Stability of the 1%Pt/SBA-15 pH = 6C catalyst in furfural decarbonylation (reaction conditions: 573 K, WHSV = 16.5 h−1, H2/furfural (mol) = 2.4).
Catalysts 10 01304 g007
Figure 8. HRTEM images (A,B) of the 1%Pt-SBA-15 pH = 6C catalyst after 90 h reaction. The inset in image (A) is the histogram of the Pt NP frequency distribution.
Catalysts 10 01304 g008
Table 1. Particle sizes of Pt on Pt/SBA-15 catalysts calculated by different methods.
CatalystTEM/nmCO-Chemisorption/nmXRD/nmTEM Dispersion/%
1%Pt/SBA-15 pH = 12.34.13.549.1
1%Pt/SBA-15 pH = 23.24.23.735.3
1%Pt/SBA-15 pH = 6A4.08.85.428.2
1%Pt/SBA-15 pH = 6B4.38.69.526.3
1%Pt/SBA-15 pH = 6C3.77.06.730.5
Table 2. Comparison of catalytic results between our study and other studies.
CatalystReaction ConditionsConv./%Furan Select./%Ref.
Pt/MCF-170.49 wt% Pt, 493 K, 9.3 kPa furfural in 93 kPa H2 flow, gas hourly space velocity (GHSV) 1300 h−13.130.0[19]
Pd/SiO21 wt% Pd, 423 K, furfural (1.0 mmol), THF (1.5 mL), N2 (0.1 MPa), 12 h58.098.0[29]
Pd/C40.060.0
Pd/SiO21% Pd, 523 K, H2/furfural 25 (mol), 1 atm, W/F 0.075 h82.054.0[44]
Pd/Al2O31% Pd, 533 K, 1 atm, H2/furfural 20 (mol), WHSV 0.77 h−199.080.0[15]
Pd/Al2O3-K2CO31% Pd, 8 % K, 533 K, 1 atm, H2/furfural 20 (mol), WHSV 0.77 h−199.099.0
Pd/Al2O35 wt% Pd, 513 K, furfural 1 g, H2 20 bar, iso-propanol 20 g, catalyst 0.05 g, 5 h10050.4[9]
1%Pt/SBA-151% Pt, 573 K, 1 atm, H2/furfural 2.4 (mol), WHSV 16.5 h−187.487.2This study
1% Pt, 503 K, 1 atm, H2/furfural 2.4 (mol), WHSV 16.5 h−115.774.8
Publisher’s Note: MDPI stays neutral with regard to jurisdictional claims in published maps and institutional affiliations.

