Article

Study of Catalysts’ Influence on Photocatalysis/Photodegradation of Olive Oil Mill Wastewater. Determination of the Optimum Working Conditions

by
Gassan Hodaifa
1,*,
Cristina Agabo García
1,2 and
Rafael Borja
3
1
Molecular Biology and Biochemical Engineering Department, Chemical Engineering Area, Faculty of Experimental Sciences, University of Pablo de Olavide, ES-41013 Seville, Spain
2
Department of Environmental Technologies, University of Cadiz, Campus de Puerto Real, ES-11500 Puerto Real, Cadiz, Spain
3
Instituto de la Grasa (CSIC), Campus Universitario Pablo de Olavide, Carretera de Utrera km 1, Building 46, ES-41013 Seville, Spain
*
Author to whom correspondence should be addressed.
Catalysts 2020, 10(5), 554; https://doi.org/10.3390/catal10050554
Submission received: 22 April 2020 / Revised: 13 May 2020 / Accepted: 15 May 2020 / Published: 17 May 2020
(This article belongs to the Special Issue Photocatalysis in the Wastewater Treatment)

Abstract

:
The high production of raw olive oil mill wastewater (OMW) is a current environmental problem due to its high organic load and phenol compounds. In this work, photo-Fenton reaction as an advanced oxidation process has been chosen for OMW treatment. In this sense, different iron salts (FeCl3, Fe2(SO4)3, FeSO4·7H2O, and Fe(ClO4)3) as catalysts were used in order to compare their effects on treatment. For each catalyst, different H2O2 concentrations (2.5, 5.0, 7.5, 10.0, 15.0, 20.0, and 30.0%, w/v) as oxidizing agents were tested. The common experimental conditions were temperature 20 °C, the catalyst/H2O2 ratio = 0.03, pH = 3, and ultraviolet light. The Lagergren kinetic model, in cases of total organic carbon removal, for the best H2O2 concentration per catalyst was used. During the experiments, the water quality was determined by measuring the removal percentages on chemical oxygen demand, total carbon, total organic carbon, total nitrogen, total phenolic compounds, total iron, turbidity and electric conductivity. The best catalyst was FeCl3 and the optimum H2O2 concentration was 7.5% (w/v). At these optimal conditions, the removal percentages for chemical oxygen demand, total phenolic compounds, total carbon, total organic carbon and total nitrogen were 60.3%, 88.4%, 70.1%, 63.2% and 51.5%, respectively.

1. Introduction

Global olive oil production is about 3 millions of tons per year. European Union is the most olive oil producing region representing around 73% of world production, and Spanish olive oil industry produces 45% of total world production [1]. This high production brings a considerable amount of wastewater. In the two-phase process, the wastewater generated come from olives and olive oil washing.
The physicochemical characterization of olive mill wastewater (OMW) depends on the process in which it has been generated. For the press and three-phase continuous centrifugation processes, chemical oxygen demand (COD) and biological oxygen demand (BOD5) values of wastewater vary in the range of 40–220 g O2/L and 35–110 g O2/L, respectively [2,3]. Nevertheless, for the two-phase continuous centrifugation process, the COD and BOD5 values of wastewater vary from 0.5 to 65 g O2/L and 0.5 to 19 g O2/L, respectively [4,5,6]. In general, total phenolic compounds (TPCs) are in the range of 0.044–1 g/L [7,8]. The high organic load present in OMW requires more dissolved oxygen for its degradation by aerobic microorganisms, which implies its consumption causing low dissolved oxygen levels. In addition, the phenolic compounds it contains have inhibitory/toxic effects on microbial growth. The solubility of phenolic compounds in water and its relative stability in the environment make them resistance to natural biodegradation. In fact, the US Environmental Protection Agency reported that the degradation of phenol compounds in wastewater is a priority [9]. In addition, this kind of component produces a negative environmental impact on rivers, other natural surface and underground waters, making them unsuitable for use. For this reason, it is necessary to treat these wastewaters before discharging them to natural streams.
Due to the lack of consensus on European legislation for OMW treatment, different possibilities have arisen [10]. In some countries, such as Spain, the main management method is based on the accumulation of these wastewaters in evaporation ponds (large reservoirs) in order to its biological auto-depuration and its elimination during the summer months. This solution requires a low economic investment due to its simplicity of operation. In any case, the auto-depuration of OMW needs large expanses of land with 1 m2 of area and 1.5 m of deep per each 2.5 m3 of OMW [11]. Besides, the management method is commonly uncontrolled (having different operational conditions in each season), slow (complete evaporation needs approximately 8–9 months) and has some environmental risks related to atmospheric pollution, clogging, insect plague and aquifer infiltration [12,13].
In this context, advanced oxidation processes (AOPs) have considerable potential for the treatment of different polluted wastewaters, due to the formation of hydroxyl radicals, which oxidize a wide range of compounds [14,15,16,17]. In addition, chemical oxidation not only has a high efficiency and simplicity but also it produces no residues [18]. Advanced oxidation processes include normally a transition metal (Fe3+, Cu2+, Mn2+, Co2+ and Ag+) as a catalyst, an oxidizing agent (O3, H2O2 and KMnO4) and/or an energy source (artificial UV-light or solar light) [19]. The combination of H2O2 as an oxidizing agent and iron salt without any energy source (dark conditions) is named as the Fenton reagent [20,21]. It is known that the Fenton reaction has a high potential to treat wastewater with a high load of organic matter due to its high effectivity in removing a wide range of hazardous organic pollutants from wastewater. Its main benefit is the complete degradation of the contaminants to harmless compounds, e.g., CO2, water and inorganic salts [18,22,23,24]. Fenton’s reagent generates hydroxyl radicals according to the following reaction [25]:
Fe 2 + + H 2 O 2 Fe 3 + + OH + OH
The generation of hydroxyl radicals involves a complex reaction sequence in an aqueous solution. Hydroxyl radicals can oxidize organics (RH) by abstraction of protons producing organic radicals (R), which are highly reactive and can be further oxidized [26]:
RH + OH   H 2 O + R     further   oxidation
Recent studies claim the benefits of combined Fenton process with ultraviolet/solar light irradiation (H2O2/catalyst/UV or Visible) due to the reaction time being shorter and the removal rate being higher, which makes it possible to work with smaller equipment and reduce operating costs [14,27,28,29]. In addition, in these conditions, the Fenton reaction increases its oxidizing capacity due to the decomposition of the photoactive Fe(OH)2+ species by UV/visible light, promoting an additional generation of OH radicals (Equation (3)) in the solution [30,31].
Fe 3 + + H 2 O + h ν     Fe 2 + + HO + H +
Reaction 3 shows that UV/Visible irradiation leads not only to the formation of additional hydroxyl radicals but also to the recycling of the iron catalyst. The resulting product of organic matter after the photo-Fenton reaction is carbon dioxide as the final product. If the organic matter contains heteroatoms, oxidation often leads to the formation of inorganic acids ( HCl ,   HNO 3 ,   H 2 SO 4 ,   etc . ) . [29]. The organic bonded nitrogen can be released in ionic and gaseous forms, for example as nitrate, nitrite, ammonia, molecular nitrogen, dinitrogen monoxide and nitrogen monoxide [32].
The implementation of these treatment processes in olive oil mills is clearly beneficial, taking into account: (i) the mild operational conditions (room temperature, atmospheric pressure), (ii) the lack of high investments (economic equipment), (iii) the simplicity of the technology and (iv) the eco-friendly character of the process (harmless oxidizing agents and recoverable catalysts) [33]. In previous works, Fe3+ salts (coming mainly from ferric chloride, FeCl3) were as effective as Fe2+ ones, in spite of producing an initial slower rate of H2O2 decomposition [30]. In this sense, Nieto et al. [18] studied OMW treatment through a homogeneous Fenton-like reaction. Furthermore, Esteves et al. [33] tested Fe3+/H2O2 and Fe3+/H2O2/UV systems for OMW treatment. In the second system, the UV/visible light generated from a high-pressure mercury vapor, Heraeus TQ (TQ is the lightest of the permissible cap lamps) 150 with 150 W, was used. The comparison between Fenton and photo-Fenton reactions for OMW treatment was developed achieving 34.9% vs. 41.8% on total organic carbon (TOC) removal, 55.7% vs. 63.2% on COD removal and 81.4% vs. 83.8% of total phenolic compounds (TPCs) removal. Esteves et al. [33], also tested two different iron salts FeSO4·7H2O and FeCl3·6H2O at only [Fe2+ or Fe3+] = 1 g/L, obtaining that TOC removal was higher in the case of FeCl3·6H2O in comparison with applying FeSO4·7H2O as the catalyst.
In this research work, the treatment of olives and olive oil washing wastewaters using a homogeneous photo-Fenton reaction for the photodegradation of the organic matter was studied. The effect of four iron salts (Fe2+ or Fe3+) at different hydrogen peroxide concentrations (2.5, 5.0, 7.5, 10.0, 15.0, 20.0, and 30.0%, w/v) in the photodegradation of industrial OMWs were studied (data not found in the literature). In addition, the photolysis effect on OMW (UV/OMW) at different initial organic matters were studied as control experiments. The best catalyst for OMWs treatment was chosen based on the evaluation of the photodegradation efficacy in terms of total carbon (TC), total organic carbon (TOC), total nitrogen (TN), COD, phenolic compounds (PCs), and turbidity in the final treated wastewater. In addition, the best %H2O2 (w/v) to use was selected according to the kinetic modelling in base of TOC removal.

2. Results and Discussion

2.1. Analysis of OMW Characterization Parameters

Table 1 shows the characterization of raw OMWs collected from different evaporation ponds. In general, high values for all parameter were registered. However, low values (COD = 501 mg O2/L, TOC = 177 mg/L, TN = 12.6 mg/L, electric conductivity (EC) = 1.51 mS/cm and pH = 7.04) were registered in the case of OMW accumulated in the pond of Seville 2. This pond only accumulated olives washing wastewater, which normal COD value is below 1000 mg O2/L [22]. According to the literature [17,22,23,27,28], COD values of olive oil washing wastewater from the two-phase process normally vary from 4000 to 16,000 mg O2/L. In this sense, only COD of Seville 1 (6187 mg O2/L) was found in the range. Samples of Seville 3 and 4 have high organic matter (COD = 18,981 mg O2/L and 38,139 mg O2/L, respectively) in comparison with the literature, due to the evaporation effect in the ponds during spring and summer seasons in this region. Similar effect was observed on the other OMWs parameters as pH (>7.04) and electric conductivity (>30.7 mS/cm) values registered. Besides, other wastewaters (as that coming from washing of machines and tanks or brine wastewater) can be mixed in the ponds since some of these ponds collected also wastewaters from table olive processing.
On the other hand, the great variation among the different parameters of these wastewaters was not only due to the mixture of wastewaters in each pond but also because of the way each industry operates (Table 1). In this sense, the variation may be also due to (1) the regeneration cycles of the water used in the olives machines, (2) the chemicals and dirt contained in the olives, (3) the chemicals used for OMW treatment by sedimentation such as aluminum sulfate or ferric chloride before its discharge in the evaporation ponds, etc.

2.2. Effect of Photo-Fenton Reaction on Organic Matter Degradation

Considering the characterization determined of the raw wastewaters (Table 1) and the mean initial COD values showed in the bibliography (3000–4000 mg O2/L, Nieto et al. [18]). In this work, it was chosen to use a wastewater with a relatively high initial COD value equal to 6454 ± 307 mg O2/L for the performance of the experiments. Therefore, mixtures of these real raw wastewaters were performed to eliminate the factor of the uniqueness of the mill and to achieve a real representative OMW sample, as shown in Table 2.
Figure 1A shows how the TOC values of OMW decreased throughout the experiment time. For both OMW loads, an instantaneous reaction was detected in the first 3 min. Then, a slowly reaction was observed towards the end of the experiment. Figure 1B shows the removal percentages registered for nitrogen and carbon species. In this sense, depreciated variation was determined in the cases of TOC (average value = 33.7 ± 0.7 mg/L and CV = 2.1%), TC (average value = 42.5 ± 1.0 mg/L and CV = 2.4%) and TN (average value = 40.6 ± 0.4 mg/L and CV = 0.1%). Only, in the case of inorganic carbon (IC) slightly higher CV = 8.3% was registered (IC = 81.9 ± 6.8 mg/L). In addition, similar results were obtained in the case of the COD values (average value = 15.6 ± 0.5 mg O2/L and CV = 3.5%). These results allow the conclusion that, in the OMW photolysis experiments, the removal percentages of TOC, TC, IC, TN and COD are virtually independent of the initial organic matter of OMWs.
Figure 2 shows the variation of the TC content of the wastewater versus the operating time when the FeCl3 is used as a catalyst in the system (Catalyst/UV/H2O2). A similar behavior has been recorded in the rest of the iron catalysts used (Figure S1). As it can be observed, photo-oxidation of OMW occurs in two stages: the first is an instantaneous reduction (instantaneous reaction) of total carbon in the first 5 min, and the second is a gradual reduction (slower reaction) where the degradation occurs more slowly (Figure 2). This mechanism of reaction is similar to that observed in the reaction recorded during OMW photolysis (Figure 1A). In this sense, the complexity of the chemical compounds formed as intermediates in the photo-Fenton oxidation of OMW makes it virtually impossible to carry out a detailed kinetic study with the different individual reactions that take place during the photochemical oxidation. The instantaneous decrease at the beginning of the reaction can be explained considering the high power of the UV-lamp used in this research up to 150 W and its emission over a wide range (UV-visible). Not to mention that the photo-reactor configuration has 8 cm internal diameter and immersion UV-lamp with a diameter 4 cm, which means the thickness of the OMW liquid exposed to UV-light is only 2 cm. In addition, Fe(III) hydroxy complexes present in a mildly acidic solution, such as Fe ( OH ) 2 + and Fe 2 ( OH ) 2 4 + , absorb light appreciably in the UV and into the visible region. These complexes undergo photo-reduction to give HO and Fe(II). The most important species is Fe ( OH ) 2 + due to a combination of its relatively high absorption coefficient and concentration relative to other Fe(III) species under typical conditions [34,35,36].
The difference in the initial TC values at the beginning of each experiment is due to the variation obtained after crude OMWs mixtures. For this reason and for the correct interpretation of the experimental results, the parameters TC, TOC and TN have been normalized as follows:
TC norm = TC TC 0 ;   TOC norm = TOC TOC 0 ;   IC norm = IC IC 0 ;   TN norm = TN TN 0
where TCnorm, TOCnorm and TNnorm represent the normalized values of each parameter and TC0, TOC0 and TN0 correspond to the values of each parameter at the beginning of the experiment (t = 0 min).
Figure 3 shows the variation in the normalized total organic carbon values of OMW throughout the photo-oxidation reaction time, when FeCl3 was used as catalyst.
The lowest value of TOCnorm at the end of the experiments (0.368 ± 0.008) was obtained when 7.5% of initial H2O2 concentration was used. The best range of initial H2O2 concentrations to use for OMWs photodegradation was from 5% to 10% (w/v). In the same way, similar behaviors were obtained for TCnorm, ICnorm and TNnorm.
Table 3 shows the average removal percentages of the main characterization parameters of treated OMWs by the photo-Fenton reaction at different oxidant concentrations. As it can be seen, all catalysts used the highest percentage reductions values: 52.0–72.1% in TC, 45.3–80.6% in TOC, 46.0–69.5% in TN, 25.8–74.3% in COD and 34.1–72.1% in total phenolic compounds (TPCs) parameters were recorded using hydrogen peroxide in the range of 5 to 10% (w/v), with the exception of Fe(ClO4)3·H2O.
In this exceptional case, optimal TOC degradation percentages (47–80%) were reached when oxidant concentrations were 2.5–5.0% (w/v) H2O2. Comparing the degree of organic matter removal it can be seen that in the case of the TC and TOC parameters, the best concentration of hydrogen peroxide was 7.5% (w/v), and for COD, the best concentration was 10% (w/v). Concentration of hydrogen peroxide is the operating parameter that more significantly affects the photodegradation. The rise in initial hydrogen peroxide concentration entails an increase in the photodegradation efficiency until achieving the optimal concentration. Then, further increases in the initial hydrogen peroxide concentration cause a decrease in the photodegradation efficiency due to the “scavenging nature” of OH radicals at high H2O2 concentrations. The result is the formation of perhydroxyl radicals, which are significantly less reactive than hydroxyl radicals, which directly affect the final efficiency of wastewater photodegradation [37]. This fact permits more options in the selection of the initial hydrogen peroxide concentration to use at the industrial treatment level.
In the case of total phenolic compounds, removal percentages higher than 36.1% or next to 72.1% were registered at optimal hydrogen peroxide concentrations (5–10%) for all the tested catalysts. In general, the percentages of total nitrogen removal (Table 3) were not greatly affected by the concentration of hydrogen peroxide registering values of 65.3% ± 14.5%, 57.9% ± 8.2%, 60.6% ± 5.1% and 55.1% ± 6.2% for FeCl3, Fe2(SO4)3·H2O, FeSO4·7H2O and Fe(ClO4)3·H2O catalysts, respectively. The high standard deviation (>10%) observed in the case of FeCl3 is due to the high nitrogen removal percentage (98.7%) achieved in the experiment that operated at an initial hydrogen peroxide concentration of 20% (w/v), which is approximately double than that reached for the 7.5% of FeCl3. A possible reason for this behavior is that nitrogen is generated in specific conditions (abiotic N2 fixation in presence of CO2 abundance conditions [38,39]), which was not examined.
Considering the selectivity of the TOC parameter compared with the COD parameter, as well as the rest of removal results, 7.5% (w/v) of hydrogen peroxide concentration as the optimal concentration has been chosen to be used in the photocatalysis system. This is in concordance with previous studies, where low concentrations of H2O2 were used in order to avoid “scavenging effect” to OH radicals [23].
Figure 4 shows the discoloration of OMW samples during and after the photo-Fenton treatment, indicating the gradual degradation of color with the course of the photo-oxidation reaction.
It is important to note that the amount of final iron determined (residual iron) in the treated water throughout the experiment (all catalysts) was about 95% lower than the initial amount of iron (Figure 5). This is because centrifugation allows the removal of MnO2 and a large part of the iron ions that form sedimentary complexes with the organic matter and the OH molecules.
Different researchers have postulated that the degradation of organic matter using different iron salts varies depending on the nature of the salt used (iron II or III). In this sense, in a study conducted by Franch et al. [31], photo-catalyzed degradation of maleic acid was studied using Fe(III) salt of different natures: Fe2(SO4)3, FeCl3, Fe(ClO4)3, among others. The values of the constant of lower “K” reactions were obtained when using the Fe(ClO4)3 salt since ClO 4 did not form complexes with Fe(III) or Fe(II) [40]. In this work and as an example, the time needed by the photodegradation reaction to achieve the highest removal percentage of TC was 7 min in the case of Fe(ClO4)3 in comparison with 2 to 4 min for the other catalysts used at 5% of H2O2 (w/v). In addition, it was observed that when using iron-chloride, complexes gave a small water absorption band at 350 nm that did not appear when using iron-sulfate complexes, so that could affect the degradation kinetics.
The photodegradation of OMW leads to photo-reduction of dissolved ferric iron to ferrous iron (Equation (3)). The first step is a ligand-to-metal charge-transfer (LMCT) reaction. Secondly, intermediate complexes dissociate formation. The ligand can be any Lewis base able to form a complex with ferric iron ( OH ,   H 2 O , HO 2 , Cl , R COO ,   R OH ,   R NH 2 , etc.). Depending on the reacting ligand, the product may be a hydroxyl radical (OH) or another radical derivate from the ligand (R). Depending on the ligand, the ferric iron complex has different light absorption properties and a reaction takes place. Therefore, the pH plays a crucial role in the efficiency of the photo-Fenton reaction, because it strongly influences which complexes are formed. Hence, pH 2.8 was frequently indicated as an optimum pH for the photo-Fenton treatment, because at this pH, precipitation does not take place yet and the dominant iron species in solution is [ Fe ( OH ) ] 2 + , the most photoactive ferric iron–water complex [35,36].
Bamwenda et al., [41] studied the formation of O2 and H2 from water using different iron salts coupled to a tungsten salt. They concluded that the solution of Fe2(SO4)3 had much higher absorption in near UV-light than FeSO4, indicating that, in this region, iron III ions had a higher coefficient of light absorption than iron II species. However, in the present study, quite similar percentages of degradation in terms of TOC have been obtained when using any of the catalysts where the highest percentages of TOC removal have been registered when using concentrations of H2O2 in the range 5–10% (w/v) (Table 3).

Selection of Catalyst
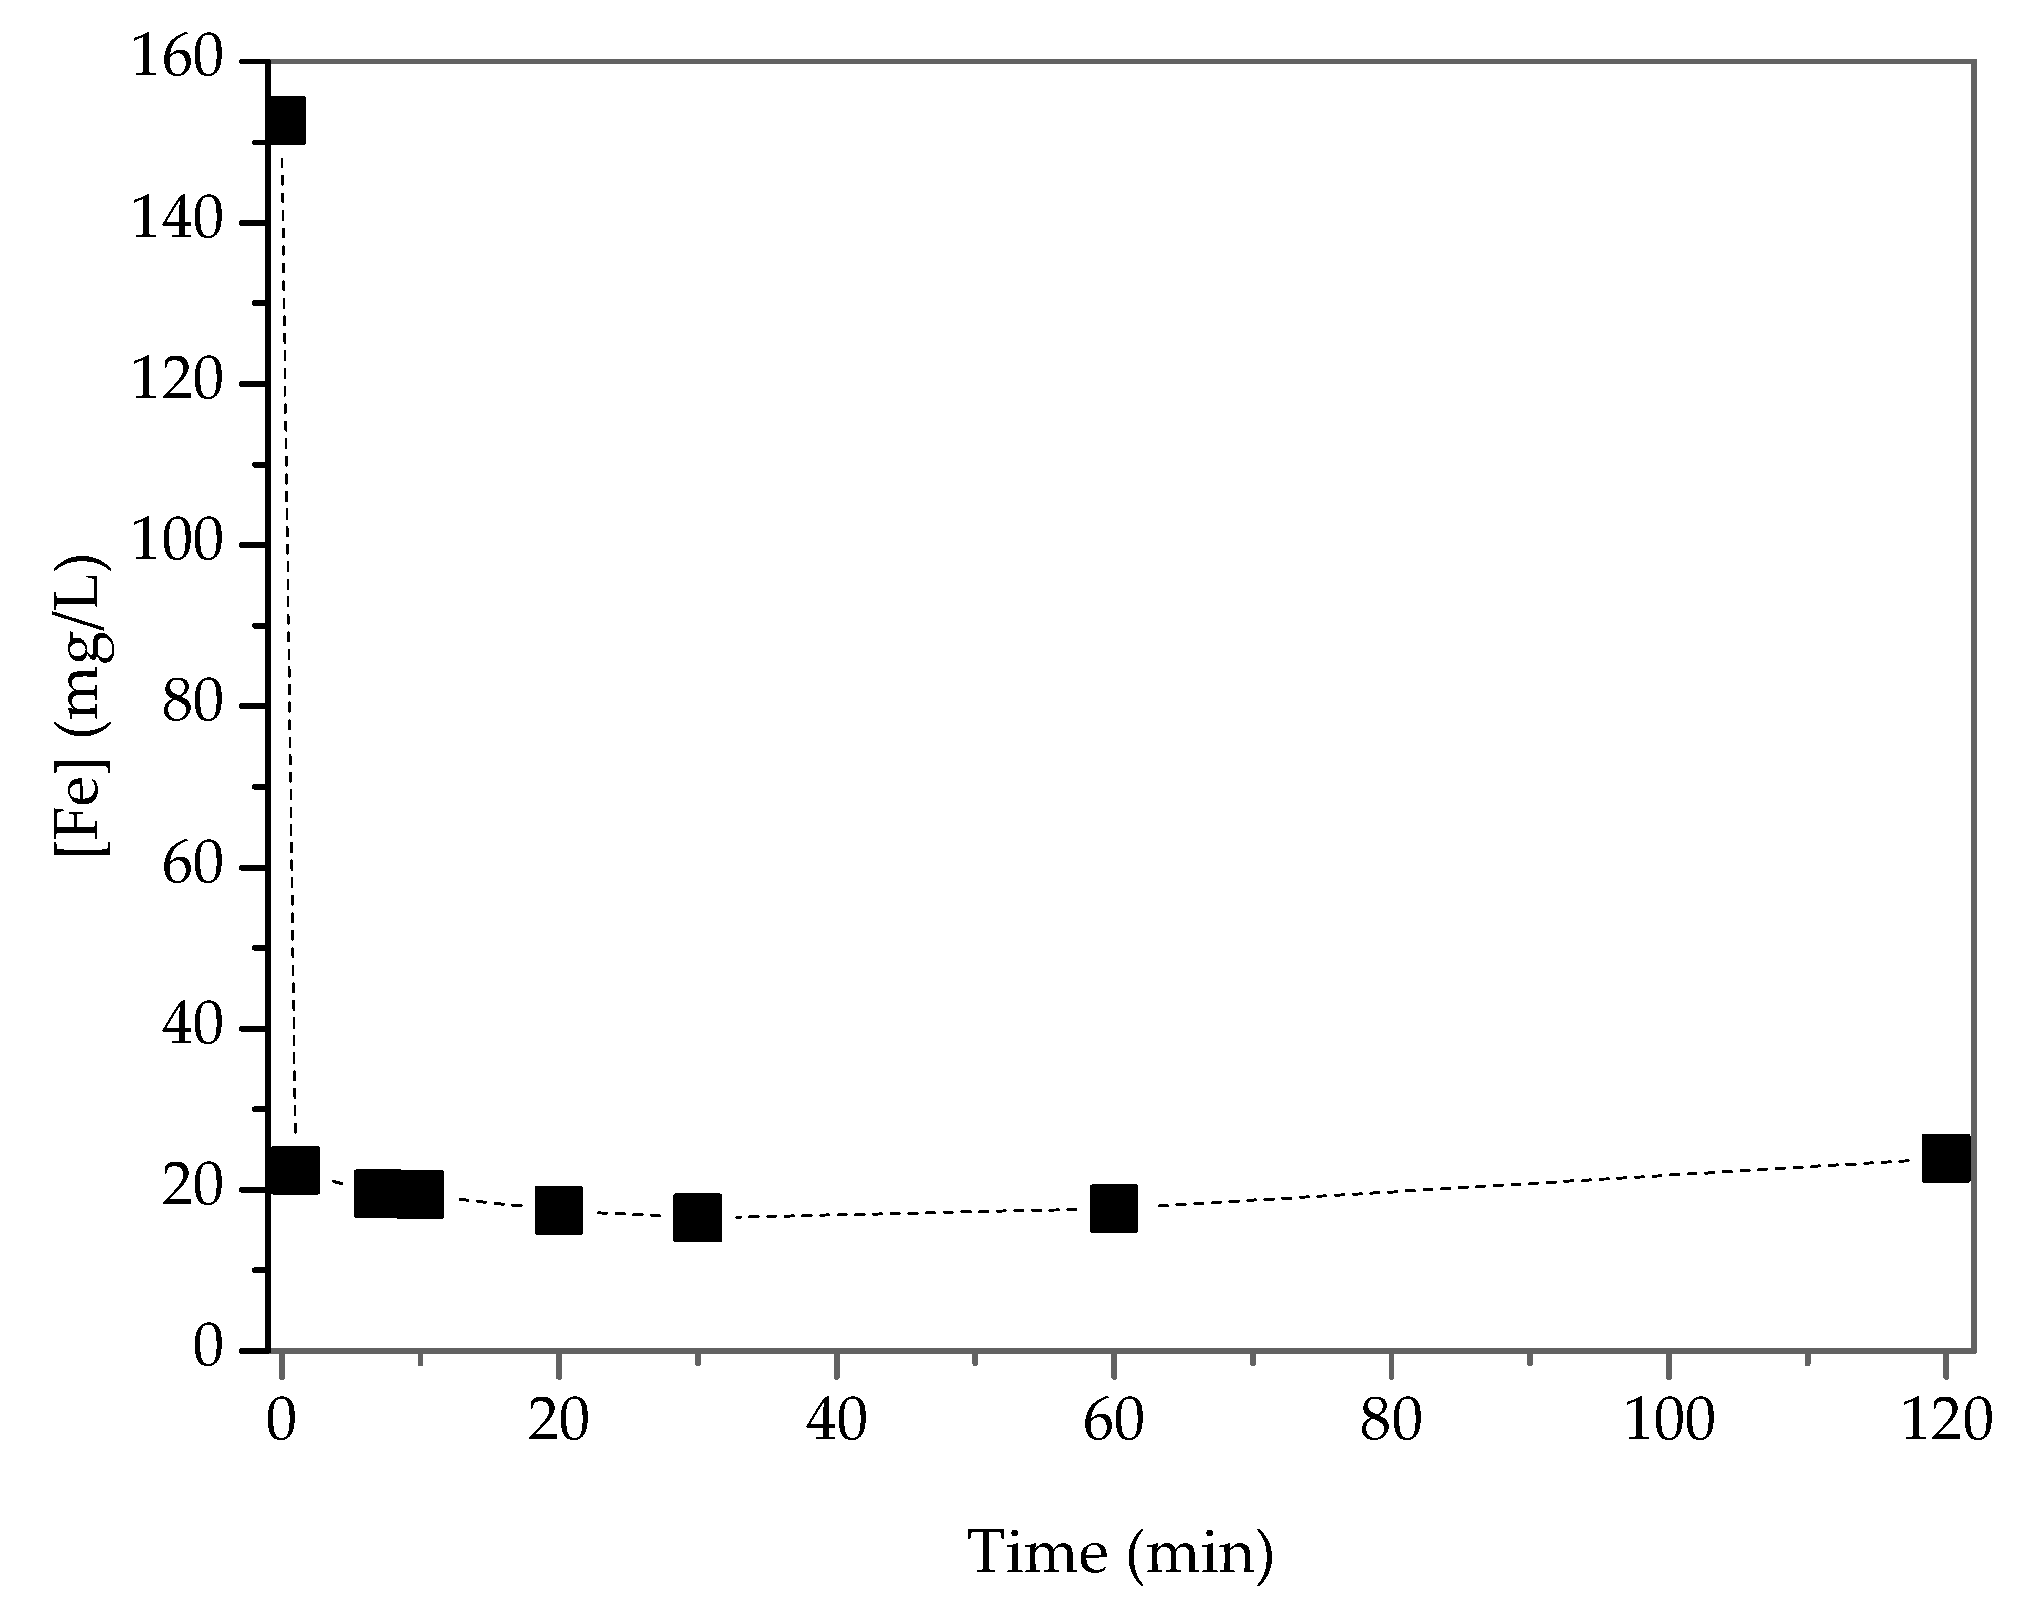
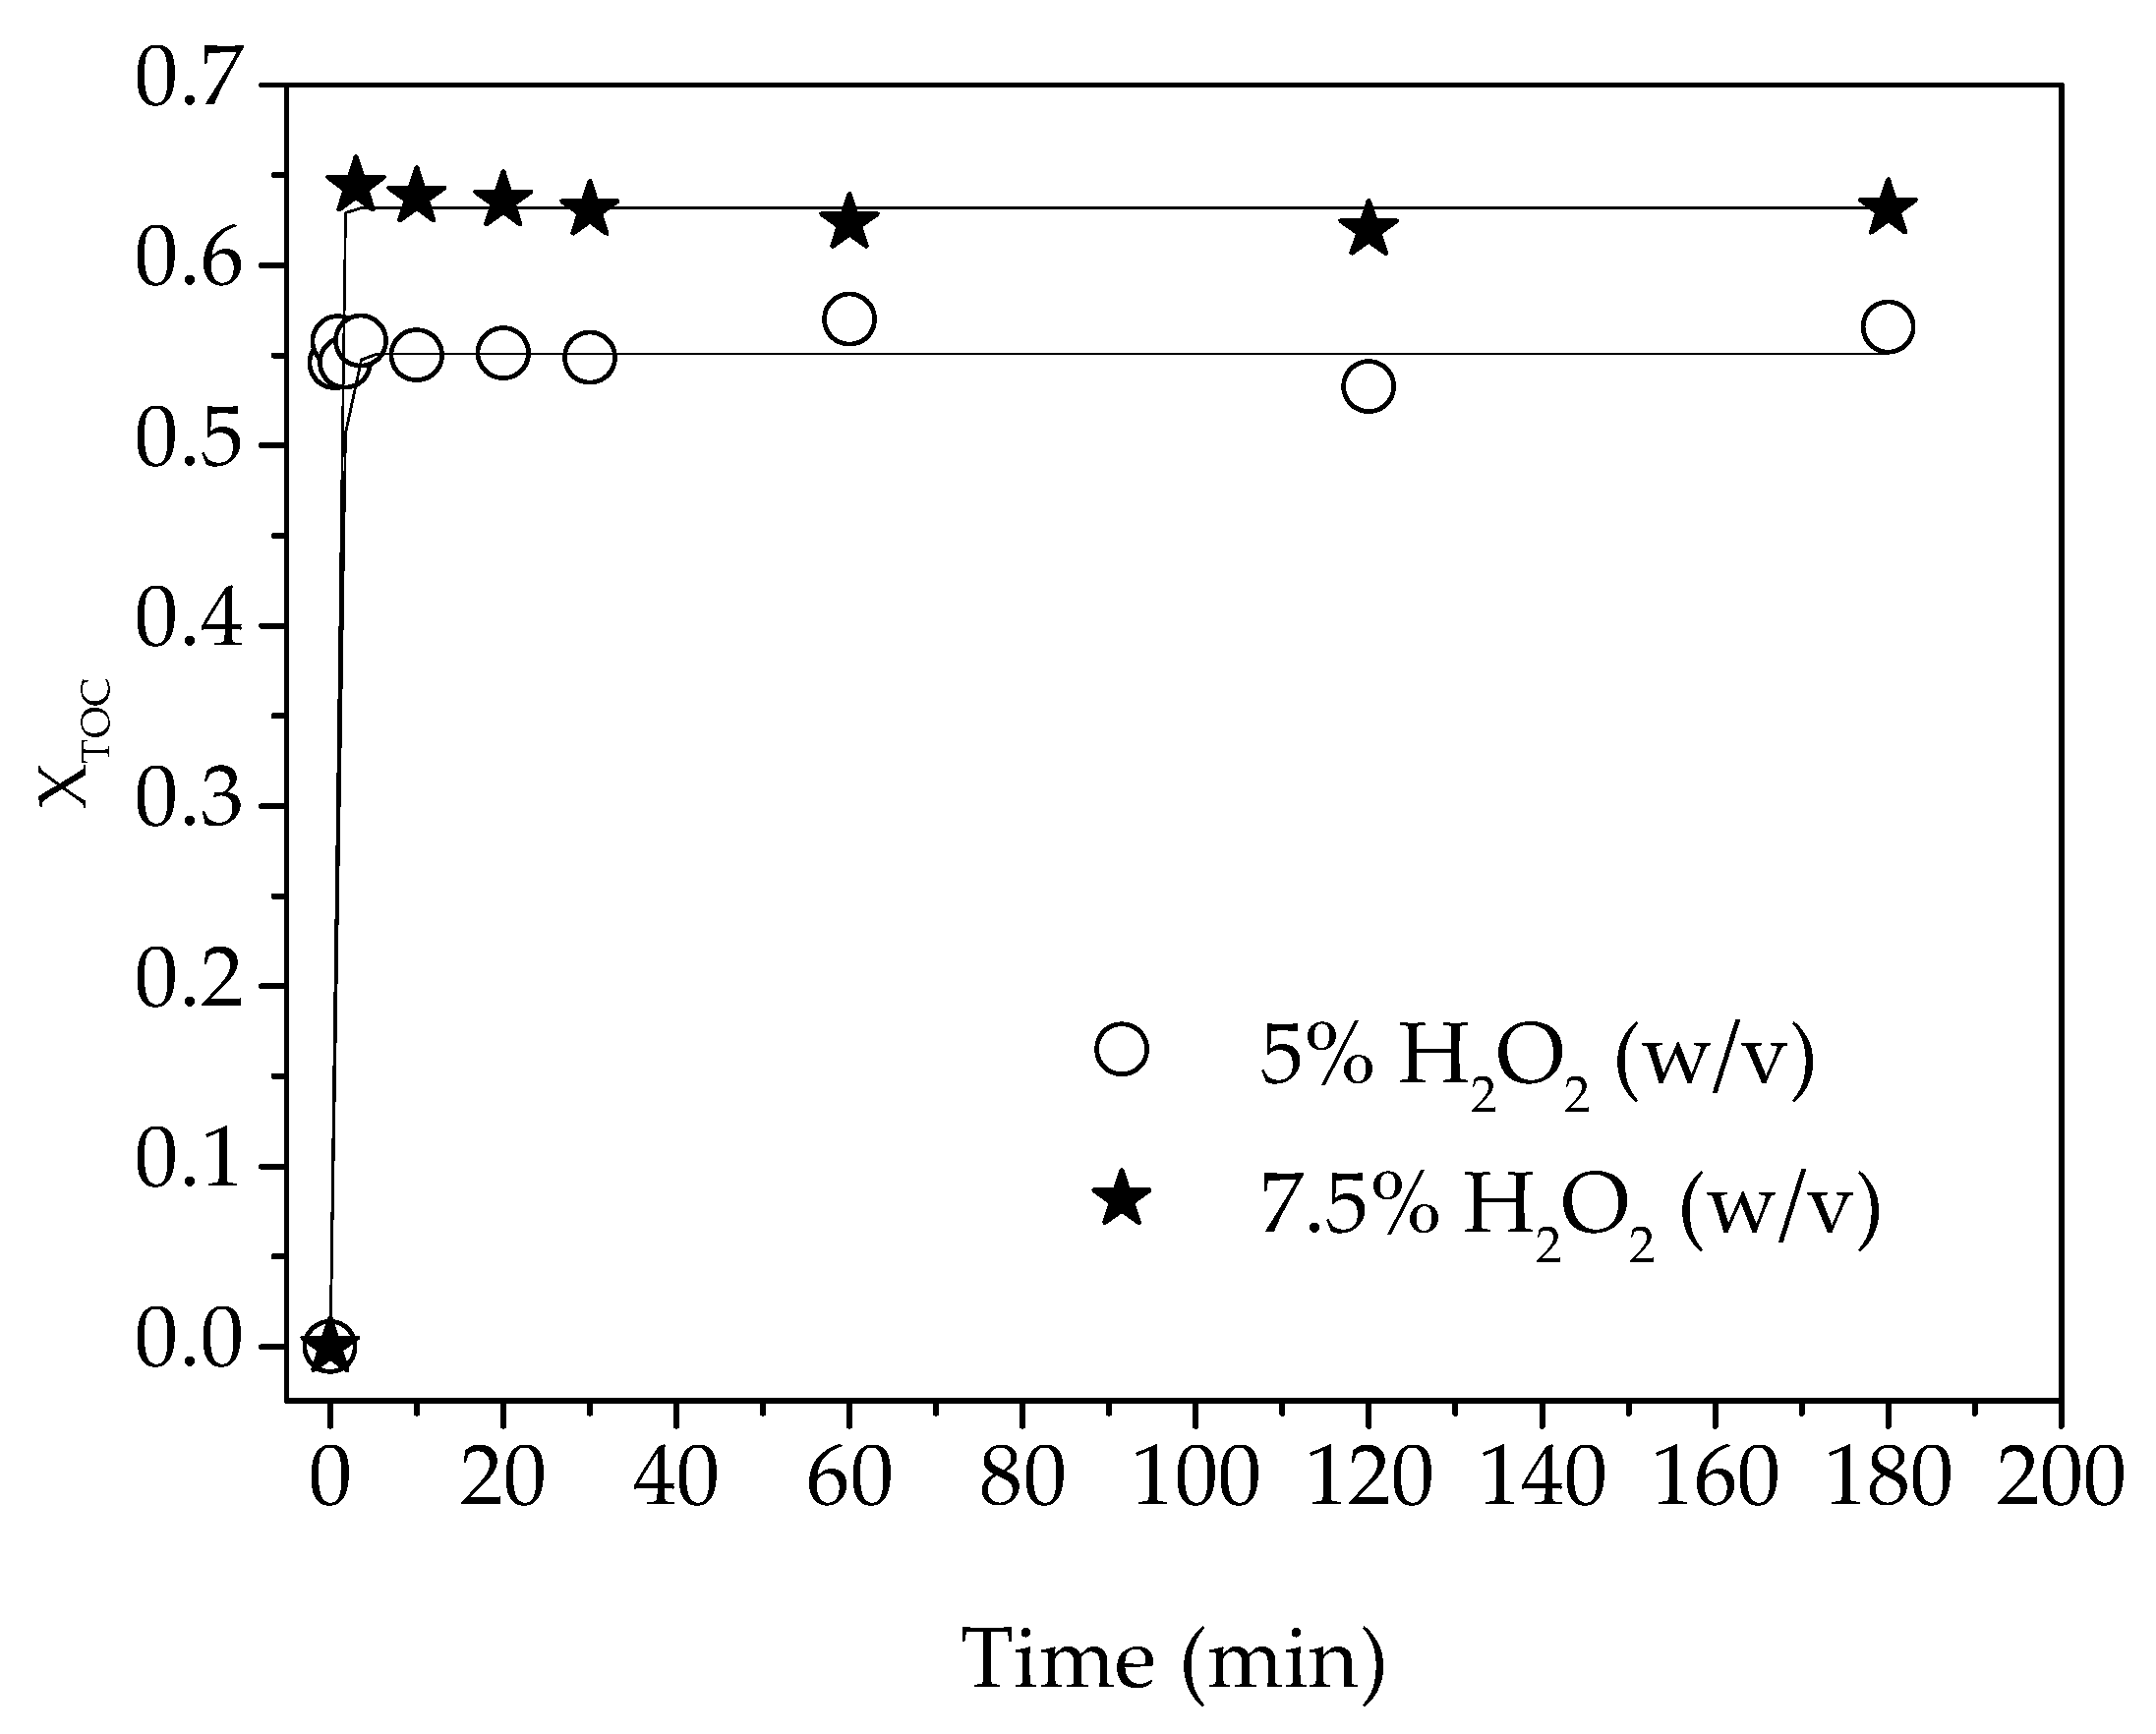
Results showed that catalyst application promotes higher removal percentages than without a catalyst. In this sense, when only photolysis (UV-light) was applied (Figure 1B), the initial organic load is independent of the final removal percentages registered. In addition, Hodaifa et al. [5] developed photo-oxidation of OMW using UV/H2O2 system at similar conditions to that used in this work but without a catalyst (initial COD = 1944.2 mg O2/L, initial H2O2 concentration = 10% (w/v), stirring speed = 150 rpm, T = 20 °C and pH = 3). In this sense, and in order to define the effect of the combination or not among UV light, oxidant and catalyst in the same system, it could be indicated that the removal percentages were increased according to the following sequence UV < UV/H2O2 < UV/FeCl3/H2O2. The final percentages reached for the parameters TC, TOC and TN have been for only UV-light 43.3%, 34.3% and 40.0%, for UV/H2O2 system 42.9%, 38.4% and 45.3% [5] and for the system UV/FeCl3/H2O2, 71.8%, 57.9% and 67.9%, respectively. These resulted were obtained using OMW with similar initial TOC value = 3929 mg/L. Irradiation of OMW with ultraviolet light (UV) leads to faster rates and higher yields of inorganic products. This degradation is due mainly to the photochemistry of Fe(III) present in the OMW, as in Equation (5) [36].
Organic   matter   of   OMW + h ν Products
Fe 3 + complexes go through ligand-to-metal charge transfer (LMCT) excitation, dissociating to give Fe(II) and an oxidized ligand, Lox, [29],
Fe 3 + ( L n ) + h ν Fe 2 + ( L n 1 ) + L ox
The photochemistry of Fe(III) is advantageous to Fenton AOPs because the reduced iron can then react with H 2 O 2 to produce HO (Equation (1)) and because oxidation of the ligand may lead to further degradation of the target pollutant [29,34,35,36]. UV-light can also photolysis H 2 O 2 as in Equation (7):
H 2 O 2 + h ν 2 HO
In the photo-oxidation system of UV/catalyst/H2O2, the removal percentages of the other water quality parameters were determined, such as TN, TPCs and Turbidity (Table 3). TN and Turbidity were not highly affected by the type of catalyst used. In all cases, the removal percentages of TN were in the range of 50% to 70% and the removal percentages of turbidity were in the range of 80% to 90%. An exception was observed in the case of the catalyst Fe(ClO4)3·H2O, where the range registered was from 52% to 88%. However, for TPCs, a clear difference in the efficiency when FeCl3 was used as catalyst was shown. In this case, removal percentages were from 41.6% to 88.4% against 25.0% to 58.0% for the rest of the catalysts used. In the same way, FeCl3 as the catalyst used in the range of 5% to 10% (w/v) registered higher removal percentages for TOC (55.0% and 80.1%) and COD (56.5% and 74.3%), respectively.
Table 4 shows the commercial prices and the application of the different catalysts used in this work. The economic advantage of the use of ferric chloride as a catalyst is an additional benefit.
Taking into account the results obtained (all parameters determined) as well as the economic viewpoint, the best catalyst to be used on the OMWs degradation is FeCl3. In addition, this catalyst is widely used because its different capacities as a coagulant [42], for fouling mitigation in anaerobic membrane reactors [31], for reduction of phosphates and heavy metals in wastewater [45,46], etc.

2.3. Kinetic Study

Figure 6 shows the variation of TOC conversion values of OMW throughout the photodegradation reaction time for the best initial concentration of the hydrogen peroxide (7.5%, w/v) and for other H2O2 concentration (5%, w/v). In previous work [5], it has been demonstrated the effective adjustment of TOC conversion data to the integrated equation of the Lagergren model [51],
x TOC ,   t = x TOC ,   max   ( 1 exp ( k   t ) )
where ‘k’ is the rate constant of pseudo-first order reaction (1/min), ‘XTOC, max’ is the maximum conversion achieved when t = t and ‘XTOC, t’ is the conversion obtained at any time during the photoreaction.
Table 5 shows the kinetic parameters determined by fitting experimental data to Equation (8). The kinetic parameters were determined for the optimal conditions obtained for each catalyst.
As it can be seen, in general and for all the catalysts, the average value of the maximum conversion values achieved was 0.623 ± 0.047. This fact together with the efficiency of FeCl3 in remove TPCs (72%), COD (74.3%) as well as its low price, demonstrate that FeCl3 is the best catalyst for the photo-Fenton treatment of OMW.
Finally, it is important to mention that photo-oxidation represents only one-step in a more complete process for OMW treating. After photo-oxidation, a neutralization unit would be necessary to raise the pH (pH = 6–9) by using a base solution (such as NaOH). Then, a natural sedimentation or assisted sedimentation by flocculation unit would be required to separate and recover the catalyst in Fe ( OH ) 3 form, which could be reused through its recirculation to the oxidation reactor. To remove turbidity after sedimentation unit a filtration through a sand filter or any other filtering body allows the obtaining of treated water for irrigation. In the case that the target of the OMW treatment process is to achieve a treated water for reuse, the addition of an ultrafiltration by using a membrane unit or reverse osmosis unit would be necessary.

3. Materials and Methods

3.1. Chemicals

For the photo-Fenton oxidation, the catalysts used in this study were: Iron (III) chloride (FeCl3) 30% (w/w), Iron (III) sulfate hydrate (Fe2(SO4)3·H2O), Iron (II) sulfate heptahydrate (FeSO4·7H2O), and Iron(III) perchlorate hydrate (Fe(ClO4)3·H2O). All chemicals were purchased from Sigma-Aldrich (Madrid, Spain), except FeCl3, purchased from PanReac S.A (Barcelona, Spain).
Hydrogen peroxide solution (30% w/v) in stable form, Manganese IV oxide and potassium dichromate, 99.5% were purchased from Fisher Scientific (Madrid, Spain). Hydrochloric acid 37% was purchased from Acro organics (Barcelona, Spain). Titanium (IV) oxysulfate-sulfuric acid solution 27–31% H2SO4 was supplied by Fluka Analytical (Madrid, Spain).

3.2. Sampling and Comparative Analysis of OMW
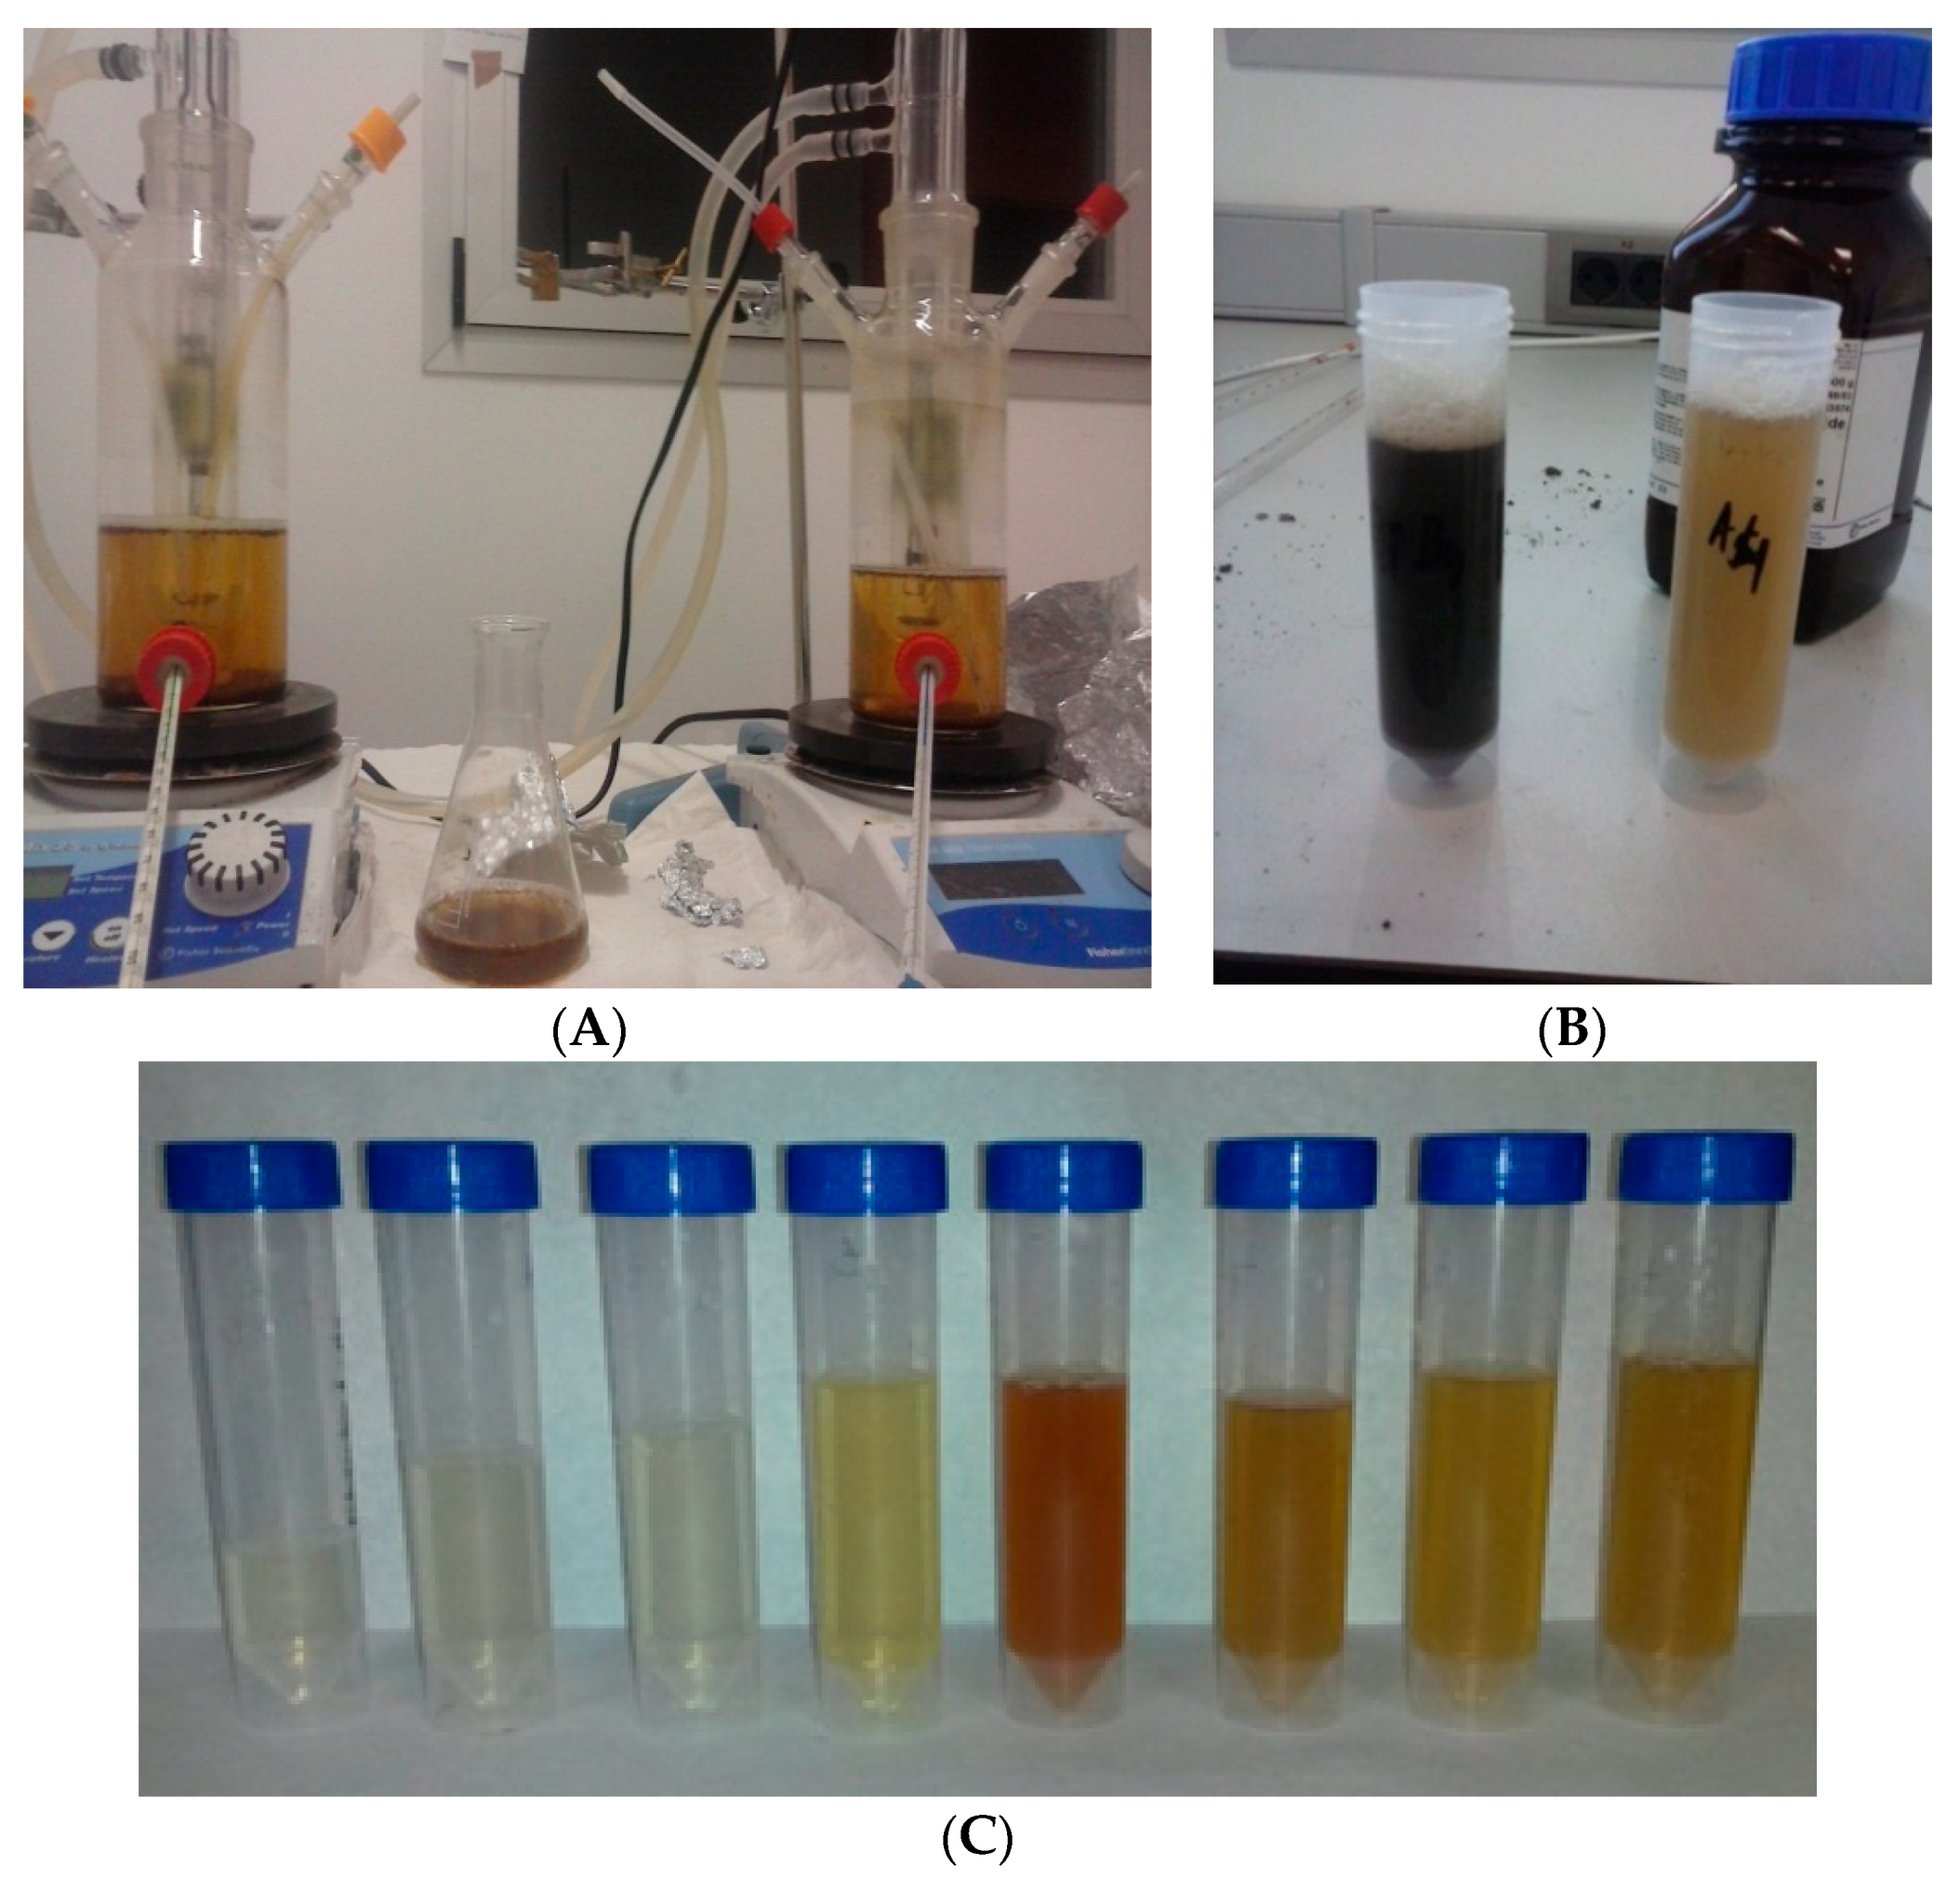
The raw wastewaters used in this work were directly collected during spring months (April–June) from accumulation rafts of four different mills in Seville province (Spain), all of them operating with a two-phase continuous centrifugation process. These wastewaters were the result of mixing olives and olive oil washing wastewaters with all the other wastewaters generated in the mill.

3.3. Methodology

The oxidation reaction was performed in a photo-reactor (1L capacity). In this sense, the catalyst was dissolved in 600 mL of OMW sample and the pH value was adjusted to 3.0 by 1 M HCl [18]. Subsequently, H2O2 solution (at the studied concentration) was added and the immersion ultraviolet lamp was switched on.
The UV-lamp in the photo-reactor was covered by a quartz immersion tube and a quartz cooling jacket. A magnetic stirrer inside the photo-reactor to increase the degree of mixing of the OMW was used, which allows greater access to the UV-light. The UV-lamp used was an immersion lamp, model TQ 150 (standard), No 5600 1725, brand HNG Germany G4 (Hanau, Germany). The dimensions of the UV-lamp were total immersion 384 mm, luminous part 303 mm, the emission center at 44 mm and with a power of 150W. The power of the UV-lamp per surface unit was 10,000 W/m2, which is higher than the maximum power of the sun for an average day (146 W/m2), [52]). The inner photo-reactor temperature was controlled through a quartz-cooling jacket located around the UV-lamp. A portable chiller (Mod. PolyScience, Niles, Illinois, USA) pumped the cooled water through the quartz jacket of the lamp.
The common operating conditions were pH = 3, temperature = 20 °C, stirring rate = 150 rpm and the [Catalyst]/[H2O2] ratio = 0.03. This low ratio used ensures the sensibility of the catalyst to degrade OMW and to avoid false results. In other words, to detect the maximum capacity of each catalyst to degrade the organic matter of OMW. The initial hydrogen peroxide amount necessary for the complete degradation of the organic matter (COD) of OMW was calculated according to the reaction stoichiometry.
For the photoreaction monitoring, 40 mL of effluent were sampled at 3, 10, 20, 30, 60, 120 and 180 min. Four sets of experiments, one set for each catalyst used, were performed. In each experimental set by catalyst, experiments at different H2O2 concentrations (2.5%, 5.0%, 7.5%, 10.0%, 15.0%, 20.0%, and 30.0%, w/v) were performed.

3.4. Analytical Methods

Real OMWs were characterized by measuring the following parameters: pH value, electric conductivity, turbidity, moisture and volatile materials, total solids, organic matter, ashes, chemical oxygen demand (COD), total carbon (TC), total organic carbon (TOC), inorganic carbon (IC), total nitrogen (TN), total phenolic compounds (TPCs), total iron, chloride and sulfates.
The value of pH was measured using a CRISON pH meter, mod. LPG 22.
Electric conductivity was determined directly by a CRISON conductivity meter, GLP31 model.
Turbidity was measured by a Turbidimeter Hanna, mod. HI93703.
The total solids and moisture and volatile materials were determined according to the weight loss of the sample after being placed in an oven, type Memmert UF110 at 105 ± 1 °C.
Ashes were determined by using an oven, type ELF14 of CARBOLITE at 575 ± 5°C.
The percentage of organic matter was calculated as percentage of total solid minus the percentage of ashes.
Chemical oxygen demand (COD) was measured by the photometric determination (620 nm) of the concentration of chromium (III) after 2 h of oxidation with potassium dichromate/sulfuric acid/silver sulfate at 148 °C [53].
Total carbon (TC) represents all the carbon contained in the sample; this includes organic and inorganic carbon (TC = TOC + IC), total organic carbon (TOC) is the organic carbon that is converted into carbon dioxide after oxidation (TOC = TC − IC), inorganic carbon (IC) is the inorganic carbon in a sample that after acidification, turns into carbon dioxide. IC includes all carbonates, bicarbonate and dissolved carbon dioxide (IC = TC − TOC) and total nitrogen (TN) is all nitrogen in the sample, and this includes organic and inorganic nitrogen. Total Carbon and Nitrogen were determined using an analyzer provided by Skalar Company (mod. FormacsHT and FormacsTN, Breda, Netherlands.
Total phenolic compounds (TPCs) was determined by making it react with a derivative thiazol, giving a purple azo dye, which was measured photometrically at 475 nm [54,55].
Total iron ions was determined by reduction of all iron ions to iron ion (II) in a thioglycolate medium with a derivative of triazine. This reaction resulted in a reddish-purple complex that was determined photometrically at 565 nm [54,55].
Sulfates and chloride were determined photometrically at 420 nm and 450 nm, respectively [54,55].

3.5. Calculations and Kinetics

Removal percentages for each parameter were calculated as follows:
% Removal   of   the   parameter = ( Parameter 0 Parameter i ) Parameter 0
where ‘Parameter0’ is the value of the parameter at time equal to 0 (at the beginning of the experiment), and ‘Parameteri’ corresponds to the value of the parameter at any time during the experiment.
For the kinetic study of the organic matter degradation by the photo-Fenton reaction, the TOC parameter was selected due to its high selectivity and sensibility to any change in the organic matter [56]. In this sense, taking into account that the reaction was developed in a batch stirred tank reactor and considering a constant density of the mixture, TOC conversion can be calculated as follows:
X TOC = ( TOC 0 TOC i ) TOC 0
where ‘TOC0′ is the TOC value at t = 0 h (at the beginning of the experiment), ‘TOCi’ is the TOC value at any time during the photoreaction and ‘XTOC’ is the degree of conversion of the organic matter represented on TOC base.
The mathematical models used in this work were adjusted by using OriginPro 8 Program.

4. Conclusions

The photo-Fenton reaction is proposed as a very effective method for treating high-polluted OMW (without dilution) due to its capacity on the degradation of a wide range of compounds. The photoreaction occurs in two stages: first, an instantaneous stage (<4 min), and a second slower stage. This method has a high degradation capacity and high treated wastewater productivity (due to short time for photoreaction), which means small and compact equipment at industrial scale.
On the other hand, among different iron salts tested, FeCl3 was selected as the best catalyst due to its effectiveness, economic price and availability standpoint. This catalyst registered high removal values for COD (60.3%), TOC (63.2%), TN (51.5%), and total phenolic compounds (88.4%), when hydrogen peroxide concentration was used at 7.5% (w/v).
The photodegradation of OMW by photo-Fenton would only be an operating unit integrated in a complete process for the treatment of OMW. In fact, this photo-oxidation unit can be integrated in a treatment process based on physicochemical treatments or in a combination of physicochemical and biological treatments. In the first process, the process sequence can be formed by (1) OMW natural sedimentation by gravity, (2) photo-oxidation, (3) neutralization, (4) sedimentation-flocculation, (5) conventional filtration by sand filters with or without membrane filtration (ultrafiltration or reverse osmosis). In the second process, photo-oxidation can be used to reduce initial organic load and remove microbial growth inhibitory/toxic compounds before the biological treatment or after the biological treatment in order to remove the residual organic load obtained.

5. Patents

Hodaifa, G.; Agabo-García, C. Method for wastewater treatment based on photo-oxidation by ultraviolet light. Patent ES-2673673-B1, 2019.

Supplementary Materials

The following are available online at https://www.mdpi.com/2073-4344/10/5/554/s1, Figure S1: Variation of the TC content of OMW with respect to operating time for different concentrations of H2O2 (• 2.5%,• 5%, • 10%, • 15%, • 20% and • 30%) in the system (Catalyst/UV/H2O2). Common operating conditions: pH = 3, T = 20 °C, stirring speed = 150 rpm and the ratio [FeCl3]/[H2O2] = 0.03.

Author Contributions

Conceptualization, G.H.; methodology, G.H. and C.A.G.; software, G.H. and C.A.G.; validation, G.H., C.A.G. and R.B.; formal analysis, G.H. and C.A.G.; investigation, C.A.G. and G.H.; resources, G.H.; data curation, G.H., C.A.G. and R.B.; writing—original draft preparation, C.A.G.; R.B. and G.H.; writing—review and editing, G.H.; visualization, G.H. and R.B.; supervision, G.H.; project administration, G.H.; funding acquisition, G.H. All authors have read and agreed to the published version of the manuscript.

Funding

This research was funded by Junta of Andalusia and Ministry of Economy and Competitiveness (Spain) “Project: Application of advanced oxidation technologies for treating of washing wastewaters of olive oil and olives, grant number AGR-7092”.

Conflicts of Interest

The authors declare no conflict of interest.

References

  1. International Olive Oil Council. Available online: https://www.internationaloliveoil.org/wp-content/uploads/2020/04/HO-W901-29-11-2019-P.pdf (accessed on 15 May 2020).
  2. Niaounakis, M.; Halvadakis, C.P. Olive Processing Waste Management, Volume 5 Pergamon, 2nd ed.; Elsevier Science: Amsterdam, The Netherlands, 2006; pp. 23–64. [Google Scholar]
  3. Hodaifa, G.; Sanchez, S.; Martínez, M.E.; Orpez, R. Biomass production of Scenedesmus obliquus from mixtures of urban and olive-oil mill wastewaters used as culture medium. Appl. Energy 2013, 104, 345–352. [Google Scholar] [CrossRef]
  4. Hodaifa, G.; Martínez, M.E.; Sanchez, S. Use of industrial wastewater from olive-oil extraction for biomass production of Scenedesmus obliquus. Bioresour. Technol. 2008, 99, 1111–1117. [Google Scholar] [CrossRef]
  5. Hodaifa, G.; Agabo, C.; Moya, A.J.; Pacheco, R.; Mateo, S. Treatment of olive oil mill wastewater by UV-light and UV/H2O2. Int. J. Green Technol. 2015, 1, 46–53. [Google Scholar] [CrossRef] [Green Version]
  6. Bouknana, D.; Hammouti, B.; Salghi, R.; Jodeh, S.; Zarrouk, A.; Warad, I.; Aouniti, A.; Sbaa, M. Physicochemical characterization of olive oil mill wastewaters in the eastern region of Morocco. J. Mater. Environ. Sci. 2014, 5, 1039–1058. [Google Scholar]
  7. Borja, R.; Martin, A.; Alonso, V.; Garcia, I.; Banks, C.J. Influence of different aerobic pretreatments on the kinetics of anaerobic digestion of olive mill wastewater. Water Res. 1995, 29, 489–495. [Google Scholar] [CrossRef]
  8. Caputo, A.C.; Scacchia, F.; Pelagagge, P.M. Disposal of by-products in olive oil industry: Waste-to-energy solutions. Appl. Therm. Eng. 2003, 23, 197–214. [Google Scholar] [CrossRef]
  9. Nickheslat, A.; Mehdi-Amin, M.; Izanloo, H.; Fatehizadeh, A.; Mousavi, S.M. Phenol photocatalytic degradation by advanced oxidation process under ultraviolet radiation using titanium dioxide. J. Environ. Public Health 2013, 2013, 1–9. [Google Scholar] [CrossRef] [Green Version]
  10. Spanish Law 22/2011. Wastes and Polluted Soils. Available online: https://www.boe.es/eli/es/l/2011/07/28/22/con (accessed on 16 May 2020).
  11. Israilides, C.; Vlyssides, A.; Galiatsatou, P.; Iconomou, D.; Arapoglou, D.; Christopoulou, N.; Bocari, M. Methods of integrated management of olive oil mill wastewater (OMW) in the framework of the EU Environmental Quality Standards (EQS). In Proceedings of the VIII International Conference “Protection and Restoration of the Environment”, Chania, Greece, 28 June–1 July 2006; pp. 291–292. [Google Scholar]
  12. Jarboui, R.; Sellami, F.; Kharroubi, A.; Gharsallah, N.; Ammar, E. Olive mill wastewater stabilization in open-air ponds: Impact on clay–sandy soil. Bioresour. Technol. 2008, 99, 7699–7708. [Google Scholar] [CrossRef]
  13. Fernández-Santos Ortiz-Yribas, F.X.; Rodríguez Padilla, L.M.; Cárdenas Fernández, J.; Capítulo, V. Sector de Almazaras de Aceitunas. Incidencias Ambientales y Medidas Correctoras en Sectores Agroalimentarios; Junta Andalucía Conserjería de medio Ambiente: Córdoba, Spain, 1997. [Google Scholar]
  14. Petrovic, M.; Radjenovic, J.; Barcelo, D. Advanced oxidation processes (AOPs) applied for wastewater and drinking water treatment: Elimination of pharmaceuticals. Holist. Approach Environ. 2011, 1, 63–74. [Google Scholar]
  15. Sekine, M.; Salehi, Z.; Tokumura, M.; Kawase, Y. Solar photo-Fenton process for the treatment of colored soft drink wastewater: Decolorization, mineralization and COD removal of oolong tea effluent. J. Environ. Sci. Health A 2012, 47, 2181–2189. [Google Scholar] [CrossRef]
  16. Ebrahiem, E.E.; Al-Maghrabi, M.N.; Mobarki, A.R. Removal of organic pollutants from industrial wastewater by applying photo-Fenton oxidation technology. Arab. J. Chem. 2017, 10, S1674–S1679. [Google Scholar] [CrossRef]
  17. Khoufi, S.; Aloui, F.; Sayadi, S. Treatment of olive oil mill wastewater by combined process electro-Fenton reaction and anaerobic digestion. Water Res. 2006, 40, 2007–2016. [Google Scholar] [CrossRef] [PubMed]
  18. Nieto, M.L.; Hodaifa, G.; Rodríguez, S.; Giménez, J.A.; Ochando, J.M. Degradation of organic matter in olive-oil mill wastewater through homogeneous Fenton-like reaction. Chem. Eng. J. 2011, 173, 503–510. [Google Scholar] [CrossRef]
  19. Chong, M.N.; Sharma, A.K.; Burn, S.; Saint, C.P. Feasibility study on the application of advanced oxidation technologies for decentralised wastewater treatment. J. Clean. Prod. 2012, 35, 230–238. [Google Scholar] [CrossRef]
  20. Kalajdžic, B.B.; Habuda-stanić, M.; Romić, Ž.; Trossmayer, J.J.; Kuleš, M. Removal of natural organic matter from groundwater using Fenton’s process. Glob. NEST J. 2013, 15, 13–20. [Google Scholar]
  21. Wang, N.N.; Zheng, T.; Zhang, G.S.; Wang, P. A review on Fenton-like processes for organic wastewater treatment. J. Environ. Chem. Eng. 2016, 4, 762–787. [Google Scholar] [CrossRef] [Green Version]
  22. Nieto, L.M.; Hodaifa, G.; Vives, S.; Casares, J.A.; Driss, S.B.; Grueso, R. Treatment of olive-mill wastewater from a two-phase process by chemical oxidation on an industrial scale. Water Sci. Technol. 2009, 59, 2017–2027. [Google Scholar] [CrossRef]
  23. Hodaifa, G.; Ochando, J.M.; Vives, S.R.; Ferez, M.A. Optimization of continuous reactor at pilot scale for olive-oil mill wastewater treatment by Fenton-like process. Chem. Eng. J. 2013, 220, 117–124. [Google Scholar] [CrossRef]
  24. Huang, C.P.; Dong, C.; Tang, Z. Advanced chemical oxidation: Its present role and potential future in hazardous waste treatment. Waste Mgmt. 1993, 13, 361–377. [Google Scholar] [CrossRef]
  25. Lu, M.C.; Lin, C.J.; Liao, C.H.; Ting, W.P.; Huang, R.Y. Influence of pH on the dewatering of activated sludge by Fenton’s reagent. Water Sci. Technol. 2001, 44, 327–332. [Google Scholar] [CrossRef]
  26. Lin, S.H.; Lo, C.C. Fenton process for treatment of desizing wastewater. Water Res. 1997, 31, 2050–2056. [Google Scholar] [CrossRef]
  27. Agabo-García, C.; Hodaifa, G. Real olive oil mill wastewater treatment by photo-Fenton system using artificial ultraviolet light lamps. J. Clean. Prod. 2017, 162, 743–753. [Google Scholar] [CrossRef]
  28. García-Ballesteros, S.; Grimalt, J.; Berto, S.; Minella, M.; Laurenti, E.; Vicente, R.; López-Pérez, M.F.; Amat, A.M.; Prevot, A.B.; Arques, A. New route for valorization of oil mill wastes: Isolation of humic-like substances to be employed in solar-driven processes for pollutants removal. ACS Omega 2018, 3, 13073–13080. [Google Scholar] [CrossRef] [PubMed]
  29. Pignatello, J.J.; Oliveros, E.; MacKay, A. Advanced oxidation processes for organic contaminant destruction based on the Fenton reaction and related Chemistry. Crit. Rev. Environ. Sci. Technol. 2006, 36, 1–84. [Google Scholar] [CrossRef]
  30. Gallard, H.; De Laat, J. Kinetic modelling of Fe (III)/H2O2 oxidation reactions in dilute aqueous solution using atrazine as a model organic compound. Water Res. 2000, 34, 3107–3116. [Google Scholar] [CrossRef]
  31. Franch, M.I.; Ayllón, J.A.; Xavier Domènech, J.P. Fe(III) photocatalyzed degradation of low chain carboxylic acids: Implications of the iron salt. Appl. Catal. B Environ. 2004, 50, 89–99. [Google Scholar] [CrossRef]
  32. Maletzky, P.; Bauer, R. The photo-Fenton method-degradation of nitrogen containing organic compounds. Chemosphere 1998, 37, 899–909. [Google Scholar] [CrossRef]
  33. Esteves, B.M.; Rodrigues, C.S.D.; Maldonado-Hódar, F.J.; Madeira, L.M. Treatment of high-strength olive mill wastewater by combined Fenton-like oxidation and coagulation/flocculation. J. Environ. Chem. Eng. 2019, 7, 103252. [Google Scholar] [CrossRef]
  34. Safarzadeh-Amiri, A.; Bolton, J.R.; Cater, S.R. The use of iron in advanced oxidation processes. J. Adv. Oxid. Technol. 1996, 1, 18–26. [Google Scholar] [CrossRef]
  35. Pignatello, J.J. Dark and photoassisted Fe3+-Catalyzed Degradation of chlorophenoxy herbicides by hydrogen peroxide. Environ. Sci. Technol. 1992, 26, 944–951. [Google Scholar] [CrossRef]
  36. Faust, B.C.; Hoigne, J. Photolysis of fe (iii)-hydroxy complexes as sources of oh radicals in clouds, fog and rain. Atmos. Environ. 1990, 24A, 79–89. [Google Scholar] [CrossRef]
  37. Bergendahl, J.A.; Thies, T.P. Fenton’s oxidation of MTBE with zero-valent iron. Water Res. 2004, 38, 327–334. [Google Scholar] [CrossRef] [PubMed]
  38. Mancinelli, R.L.; McKay, C. The evolution of nitrogen cycling. Orig. Life Evol. Biosph. 1988, 18, 311–325. [Google Scholar]
  39. Trigo-Rodriguez, J.M.; Raulin, F.; Muller, C.; Nixon, C. The Early Evolution of the Atmospheres of Terrestrial Planets; Springer: New York, NY, USA, 2013. [Google Scholar]
  40. Hermanson, M.H.; Hites, R.A. Polychlorinated biphenyls in tree bark. Environ. Sci. Technol. 1990, 24, 666–671. [Google Scholar] [CrossRef]
  41. Bamwenda, G.R.; Sayama, K.; Arakawa, H. The effect of selected reaction parameters on the photoproduction of oxygen and hydrogen from a WO3-Fe2+-Fe3+ aqueous suspension. J. Photochem. Photobiol. A 1999, 122, 175–183. [Google Scholar] [CrossRef]
  42. Rana, S.; Suresh, S. Comparison of different Coagulants for Reduction of COD from Textile industry wastewater. Mater. Today Proceed 2017, 4, 567–574. [Google Scholar] [CrossRef]
  43. Dong, Q.; Parker, W.; Dagnew, M. Impact of FeCl3 dosing on AnMBR treatment of municipal wastewater. Water Res. 2015, 80, 281–293. [Google Scholar] [CrossRef]
  44. Guo, X.; Wei, Z.; Wu, Q.; Li, C.; Qian, T.; Zheng, W. Effect of soil washing with only chelators or combining with ferric chloride on soil heavy metal removal and phytoavailability: Field experiments. Chemosphere 2016, 147, 412–419. [Google Scholar] [CrossRef]
  45. Balamane-Zizi, O.; Ait-Amara, H. Study of the simultaneous elimination of phosphates and heavy metals contained in dairy wastewater by a physical-chemical and biological mixed process; consequences on the biodegradability. Energy Procedia 2012, 18, 1341–1360. [Google Scholar] [CrossRef] [Green Version]
  46. Bedia, J.; Monsalvo, V.M.; Rodriguez, J.J.; Mohedano, A.F. Iron catalysts by chemical activation of sewage sludge with FeCl3 for CWPO. Chem. Eng. J. 2017, 318, 224–230. [Google Scholar] [CrossRef]
  47. Sreeja, P.H.; Sosamony, K.J. A comparative study of homogeneous and heterogeneous photo-Fenton process for textile wastewater treatment. Proc. Technol. 2016, 24, 217–223. [Google Scholar] [CrossRef] [Green Version]
  48. Lofrano, G.; Meriç, S.; Belgiorno, V.; Napoli, R.M. Fenton’s oxidation of various-based tanning materials. Desalination 2007, 211, 10–21. [Google Scholar] [CrossRef]
  49. Andreozzi, R.; Longo, G.; Majone, M.; Modesti, G. Integrated treatment of olive oil mill effluents (OME): Study of ozonation coupled with anaerobic digestion. Water Res. 1998, 32, 2357–2364. [Google Scholar] [CrossRef]
  50. Krýsová, H.; Jirkovský, J.; Krýsa, J.; Mailhot, G.; Bolte, M. Comparative kinetic study of atrazine photodegradation in aqueous Fe (ClO4)3 solutions and TiO2 suspensions. Appl. Catal. B Environ. 2003, 40, 1–12. [Google Scholar] [CrossRef]
  51. Lagergren, S.Y. Zur Theorie der sogenannten Adsorption gelöster Stoffe. Kungliga Sven. Vetensk. Handl. 1898, 24, 1–39. [Google Scholar]
  52. Patila, S.; Kumara, N. Sun light transmission through silica optical fibers for lighting: An experimental study. Mater. Today Proc. 2018, 5, 22943–22949. [Google Scholar] [CrossRef]
  53. DIN 38409-41. German Standard Methods for Examination of Water, Waste Water and Sludge; Summary Action and Material Characteristic Parameters (group H); Determination of the Chemical Oxygen Demand (COD) in the Range over 15 mg/L (H41); German Institute for Standardisation (Deutsches Institut für Normung): Berlin, Germany, 1980. [Google Scholar]
  54. ISO 8466-1. Water Quality-Calibration and Evaluation of Analytical Methods and Estimation of Performance Characteristics—Part 1: Statistical Evaluation of the Linear Calibration Function; International Organization for Standardization: Genève, Switzerland, 1990. [Google Scholar]
  55. DIN 38402 A51. German Standard Methods for the Examination of Water, Waste Water and Sludge; General Information (Group A); Calibration of Analytical Methods, Evaluation of Analytical Results and Linear Calibration Functions Used to Determine the Performance Characteristics of Analytical Methods (A 51); German Institute for Standardisation (Deutsches Institut für Normung): Berlin, Germany, 1986. [Google Scholar]
  56. Dubber, D.; Gray, N.F. Replacement of chemical oxygen demand (COD) with total organic carbon (TOC) for monitoring wastewater treatment performance to minimize disposal of toxic analytical waste. J. Environ. Sci. Health A Tox. Hazard. Subst. Environ. Eng. 2010, 45, 1595–1600. [Google Scholar] [CrossRef]
Figure 1. Effect of artificial ultraviolet light on the photodegradation of OMW (photolysis). (A) Variation of TOC value of two different OMW with high (Initial TOC = 3929 mg/L) and low (Initial TOC = 1086 mg/L) organic loads throughout the photodegradation. (B) Variation of the global removal percentages of TOC, TC, IC and TN parameters for OMW with different organic loads. Common operating conditions: pH = 3, T = 20 °C and stirring speed = 150 rpm.
Catalysts 10 00554 g001aCatalysts 10 00554 g001b
Figure 2. Variation of the TC content of OMW with respect to operating time for different concentrations of H2O2 in the system (Catalyst/UV/H2O2). Common operating conditions: pH = 3, T = 20 °C, stirring speed = 150 rpm and the ratio [FeCl3]/[H2O2] = 0.03.
Catalysts 10 00554 g002
Figure 3. Normalized TOC values variation throughout the experiment time for different initial H2O2 concentrations in the system (Catalyst/UV/H2O2). Operating conditions: Catalyst used: FeCl3, initial TOC = 3113 ± 573 mg/L, pH = 3, T = 20 °C, stirring speed = 150 rpm, and [Catalyst]/[H2O2] ratio = 0.03.
Catalysts 10 00554 g003
Figure 4. (A) Experimental device used for the treatment of OMWs by the photo-Fenton system (Catalyst/UV/H2O2) after natural sedimentation. (B) Stopping the photo-Fenton reaction with MnO2. (C) Samples taken along the photodegradation of OMWs. Operating conditions: COD = 6670 mg O2/L; H2O2 concentration used = 10% w/v; pH = 3; T = 20 °C; Agitation rate = 150 rpm and [Fe(ClO4)3·H2O]/[H2O2] ratio = 0.03; operating time = 180 min.
Catalysts 10 00554 g004
Figure 5. Behavior of iron during OMWs treatment by the photo-Fenton reaction. Operating conditions: Initial concentration of the H2O2 solution used = 5.0% (w/v); pH = 3.0; T = 20 °C; agitation rate = 600 rpm and [Fe2(SO4)3 H2O]/[H2O2] ratio = 0.03.
Catalysts 10 00554 g005
Figure 6. Variation of TOC conversion values of OMW throughout the photodegradation reaction time. Operating conditions: Initial concentration of the H2O2 solution used = 5.0% and 7.5% (w/v); pH = 3.0; T = 20 °C; agitation rate = 600 rpm and [FeCl3]/[H2O2] ratio = 0.03. Solid line corresponding to the model adjustment.
Catalysts 10 00554 g006
Table 1. Characterization of raw olive oil mill wastewater (OMW) from different evaporation ponds.
ParametersSeville 1Seville 2Seville 3Seville 4
pH8.67.048.68.63
Electric Conductivity (mS/cm)30.71.51116142
Turbidity (FTU)149134997724
Total Solids (%, w/w)2.320.093511.426.2
Suspended Solids (%, w/w)0.5180.0625-25.06
Organic matter (%, w/w)0.3160.05011.900.177
Ash (%, w/w)2.010.04349.5625.9
Chemical oxygen demand, COD, (mg O2/L)618751118,98138,139
Total phenolic compounds, TPCs, (mg/L)20.07.2189.684.9
Total carbon, TC, (mg/L)371020714,21229,981
Total organic carbon, TOC, (mg/L)290317711,68425,006
Inorganic carbon, IC, (mg/L)80711925284875
Total nitrogen, TN, (mg/L)8712.6391.7928
Total iron (mg/L)48.29.042.3107.6
Chloride (mg/L)8756-11,54410,637
Sulfates (mg/L)545631129921,270
Table 2. Characterization of the representative initial wastewater used in the photocatalyzed experiments.
ParameterValue ± Standard Deviation
pH9.0 ± 0.4
Electric conductivity (mS/cm)37 ± 3
COD (mg O2/L)6454 ± 307
TOC (mg/L)3245 ± 683
TC (mg/L)4060 ± 718
IC (mg/L)814 ± 113
TN (mg/L)104 ± 12
Turbidity (FTU)278 ± 220
Total Phenolic compounds (mg/L)30 ± 9
Total iron, (mg/L)39 ± 55
SO42−, (mg/L)441 ± 219
Chlorine, mg/L10,295 ± 1907
Table 3. Average TC, TOC, TN, COD, TPCs removal percentages determined after OMWs treatment by photo-Fenton at different oxidant concentrations. Operating conditions: pH = 3, T = 20 °C, Agitation rate = 150 rpm, and [Catalyst]/[H2O2] ratio = 0.03.
Parameter%H2O2 (w/v)FeCl3Fe2(SO4)3·H2OFeSO4·7H2OFe(ClO4)3·H2O
%TC2.561.865.365.059.1
561.269.372.170.8
7.570.169.957.969.5
1071.872.571.152.0
1552.540.032.448.8
2052.044.251.049.5
3053.454.053.452.5
%TOC2.546.455.166.451.6
554.254.769.256.8
7.563.262.757.963.3
1057.952.068.344.5
1545.526.538.638.1
2046.134.255.841.6
3043.946.155.047.8
%TN2.557.660.663.860.5
5.059.169.550.952.5
7.551.544.559.446.9
1067.965.169.446.0
1557.650.561.058.6
2098.752.860.059.3
3065.062.359.562.2
%COD2.530.840.954.048.5
556.566.052.770.0
7.560.357.058.038.3
1074.364.261.425.8
1536.747.641.821.4
2020.014.623.416.1
3040.017.614.917.6
%TPCs2.555.339.725.756.8
568.348.736.144.8
7.588.456.352.2-
1072.134.146.145.1
1568.333.4-51.0
2063.531.751.220.0
3041.624.646.024.6
%Turbidity2.580.891.887.587.5
587.890.992.975.0
7.594.899.981.852.9
1083.180.281.251.7
1590.099.895.765.4
2092.894.290.979.2
3094.490.094.466.0
Table 4. Oxidation state and commercial price of the iron use as catalysts.
CatalystOxidation StatePrice/SupplierApplications
FeCl3Fe+338.9 €/kg
Sigma-Aldrich
Wastewater coagulation [42]; reduces membrane fouling in MBRs [43]; removes heavy metals in soils [44]; removes phosphates and heavy metals in water [45]; advanced immobilized oxidation [46].
Fe2(SO4)3·H2OFe+3176.3 €/kg
Honeywell Fluka
Homo and heterogeneous catalysis of wastewater oxidation [47].
FeSO4·7H2OFe+260 €/kg
Sigma-Aldrich
Advanced chemical oxidation [48]; coagulant [42].
Fe(ClO4)3·H2OFe+3394 €/kg
Sigma-Aldrich
Advanced chemical oxidation in OMWs [49]. Synthesis of furans and indoles by photodegradation [50].
Table 5. Kinetic parameters determined for the best operational conditions of each catalyst used. Operational conditions: pH = 3, T = 20 °C, agitation rate = 150 rpm and [Catalyst]/[H2O2] ratio = 0.03.
Catalyst%H2O2XTOC, maxk (min−1)RSS *R2
FeCl37.50.6323.004.17 × 10−40.999
FeCl3100.5830.8412.01 × 10−40.999
Fe2(SO4)3·H2O50.5492.007.92 × 10−40.996
Fe2(SO4)3·H2O7.50.6281.133.61 × 10−50.999
FeSO4·7H2O50.6932.001.16 × 10−30.997
FeSO4·7H2O100.6871.502.36 × 10−30.993
Fe(ClO4)3·H2O50.5781.004.55 × 10−30.983
Fe(ClO4)3·H2O7.50.6361.204.33 × 10−30.985
* Residual sum of squares.

