Article

Enhanced Visible-Light Driven Photocatalytic Activity of Ag@TiO2 Photocatalyst Prepared in Chitosan Matrix

by
Ivana Grčić
1,*,
Andreja Gajović
2,
Milivoj Plodinec
3,
Kristina Šimunković
1,
Hrvoje Ivanković
4 and
Marc-Georg Willinger
5
1
Faculty of Geotechnical Engineering, University of Zagreb, Hallerova aleja 7, HR-42000 Varaždin, Croatia
2
Center of Excellence for Advanced Materials and Sensing Devices, Ruđer Bošković Institute, Bijenička 54, HR-10000 Zagreb, Croatia
3
Fritz-Haber-Institut der Max-Planck-Gesellschaft, Faradayweg 4-6, 14195 Berlin, Germany
4
Faculty of Chemical Engineering and Technology, University of Zagreb, Marulićev trg 19, HR-10000 Zagreb, Croatia
5
ETH Zürich, Auguste-Piccard-Hof 1, 8093 Zürich, Switzerland
*
Author to whom correspondence should be addressed.
Catalysts 2020, 10(7), 763; https://doi.org/10.3390/catal10070763
Submission received: 7 June 2020 / Revised: 26 June 2020 / Accepted: 4 July 2020 / Published: 8 July 2020
(This article belongs to the Special Issue Photocatalysis in the Wastewater Treatment)

Abstract

:
Ag doped TiO2 photocatalysts (Ag@TiO2) were prepared with an aim to extend the absorption range of TiO2 into the visible region, for tentative application under solar irradiation. Photocatalyst synthesized by the novel method using chitosan for reduction of Ag+ to Ag0 nanoparticles was compared to similar catalysts previously reported. The photocatalytic activity of Ag@TiO2 obtained by a simple novel method was evaluated based on degradation of salicylic acid as a model compound. The higher activity under visible irradiation can be attributed to the surface plasmon resonance and suppression of the electron-hole recombination when deposition of Ag nanoparticles on TiO2 was achieved using chitosan. The photocatalysts were characterized by X-ray diffraction (XRD), Raman spectroscopy, transmission electron microscopy (TEM), high resolution TEM (HRTEM), energy dispersive X-ray spectroscopy (EDXS), selected area diffraction (SAED), and diffuse reflectance spectroscopy (DRS). The photochromism of Ag was observed and explained.

Graphical Abstract

1. Introduction

Advanced oxidation processes (AOPs) which involve the generation of highly reactive hydroxyl radicals (HO), have emerged as a promising water and wastewater treatment technology for the degradation of a wide range of organic contaminants [1,2,3]. High toxicity and resistivity to biodegradation of organic compounds like pharmaceuticals, pesticides, and hormones present in municipal and industrial wastewater pose a threat to the environment and human and animal health and may also affect aquatic organisms in an unpredictable way. In recent years, semiconductor photocatalysis has shown a great potential as a low-cost, environmental friendly and sustainable treatment technology to align with the “zero” waste scheme in the water/wastewater treatment. The ability of this advanced oxidation technology to achieve partial or complete mineralization of persistent organic compounds has been widely demonstrated [4,5,6]. Application of solar photocatalysis is particularly interesting [7].
The mechanism of a semiconductor photocatalysis has been thoroughly explained in the literature [8,9]. A large number of semiconductor oxides showed good photocatalytic activity. Among these, nanosized TiO2 is one of the most promising photocatalysts due to its many advantages, such as high photosensitivity, chemical stability, nontoxicity, easy availability, environmental acceptability, and low cost [10,11,12].
Still, there are also some shortcomings appearing during the practical application of TiO2. The band gap energy, e.g., is 3.2 eV for anatase and 3.0 eV for rutile and the light wavelength for such photon energy corresponds to λ < 400 nm. Therefore, TiO2 absorbs radiation of wavelength below the visible range of light spectrum. Thus, in wastewater treatment by TiO2 photocatalysis only UV light could be used. The overall efficiency is significantly reduced under sunlight, which consists of 43% visible and only a 5% UV fraction. Furthermore, the charge carrier recombination rate is high and photogenerated electron–hole pairs easily recombine in femtoseconds, which reduces photocatalytic efficiency [4,6,13].
To overcome these limitations of TiO2, many studies have been carried out to increase the lifetime of the charge carrier and to extend the absorption range of TiO2 into the visible region. These studies involved the addition of various dopants to TiO2 nanoparticles or TiO2 nanocomposites such as metals or metal ions (Fe, Mn, Cu, Zn, Zr, Sb, Sb, and Ce), non-metals (B, C, N, P, and S) [14,15,16,17], noble metals (Ag, Pt, and Pd), [11,17,18,19] and photosensitization of TiO2 with organic dyes, most often phtalocyanine dyes [20]. Among the noble metals used as electron traps, Ag is extremely suitable for industrial application due to its low cost and easy preparation. TiO2 doped with Ag has been a feasible approach to narrow the band gap of TiO2, thereby enhancing its visible light photocatalytic activity. The quantum-sized behavior of Ag nanoparticles has prompted considerable research interest in general. The Ag-doped TiO2 particles has therefore attracted much interest and the different methods of preparation are used, commonly the following methods: sol–gel, deposition–precipitation, photocatalytic deposition, and deposition–precipitation with photoreduction. In [12], the Ag-doped TiO2 photocatalyst was prepared by a sol–gel process. Degradation of organic dye Indigo carmine under visible irradiation indicated that prepared catalyst has the satisfactory photocatalytic efficiency. In [13], Ag/AgCl@TiO2 photocatalyst was prepared by the deposition–precipitation with photoreduction. The photocatalyst exhibited efficient photocatalytic activity for the degradation of 4-chlorophenol and photoreduction of Cr (VI) under visible light irradiation. In [21] Ag/AgBr@TiO2 photocatalyst was prepared by the deposition—precipitation method and photocatalytic deposition method. The catalyst showed high efficiency for the degradation of azo dyes and the destruction of bacteria under visible light irradiation.
This study demonstrates a new simple method for preparing Ag@TiO2 photocatalyst which is more efficient under solar irradiation than widely used commercial TiO2. The reported preparation methods [13,21] were repeated in the frame of this work with the aim to compare the respective efficiencies of above mentioned photocatalysts (hereby marked as S1a–c and S2) with the newly prepared Ag@TiO2 via method involving chitosan (marked as S3). The idea was to evaluate the possible application of different Ag doped catalysts in the photocatalytic wastewater treatment under visible and solar irradiation. A novel method for preparation of Ag@TiO2 from commercial titania was presented. The method was developed according to the preparation of silver composites with chitosan studied by Twu et al. [22]. The advantage of the presented method is the simplicity per se. Ag nanoparticles were prepared on TiO2 surface using basic chitosan suspension as both stabilizer and reductant without any additional chemicals (such as NaBH4) or irradiation. This kind of synthesis presents a facile green method of photocatalysts applicable for large scale production. The method does not require pre-synthesis of TiO2, since it uses commercially available TiO2 (P25) with confirmed photocatalytic activity. The use of toxic solvent is omitted thus presenting an environmentally acceptable solution. The synthesized photocatalysts were characterized and used for the degradation of salicylic acid under visible and simulated solar irradiation. The respective photocatalytic activities were compared with that of commercial non-dopedTiO2 (P25). Salicylic acid (SA) was chosen as a model pollutant since it has been identified as a water pollutant which arises from a number of sources including paper milling, cosmetic industries, and landfill leachate. The destruction of SA is of considerable interest. The SA was listed as a pollutant in precipitation, surface waters (approx. 0.1 μg L−1) and as a constituent of humic material in drinking waters. It may be released to the aquatic environment in wastewater discharges from industry and even sewage treatment facilities [5,23]. In the light of presented results, newly prepared Ag@TiO2 (S3) deserves further research of the surface phenomena applicable in the field of solar photocatalysis and application on a larger scale.

2. Results and Discussion

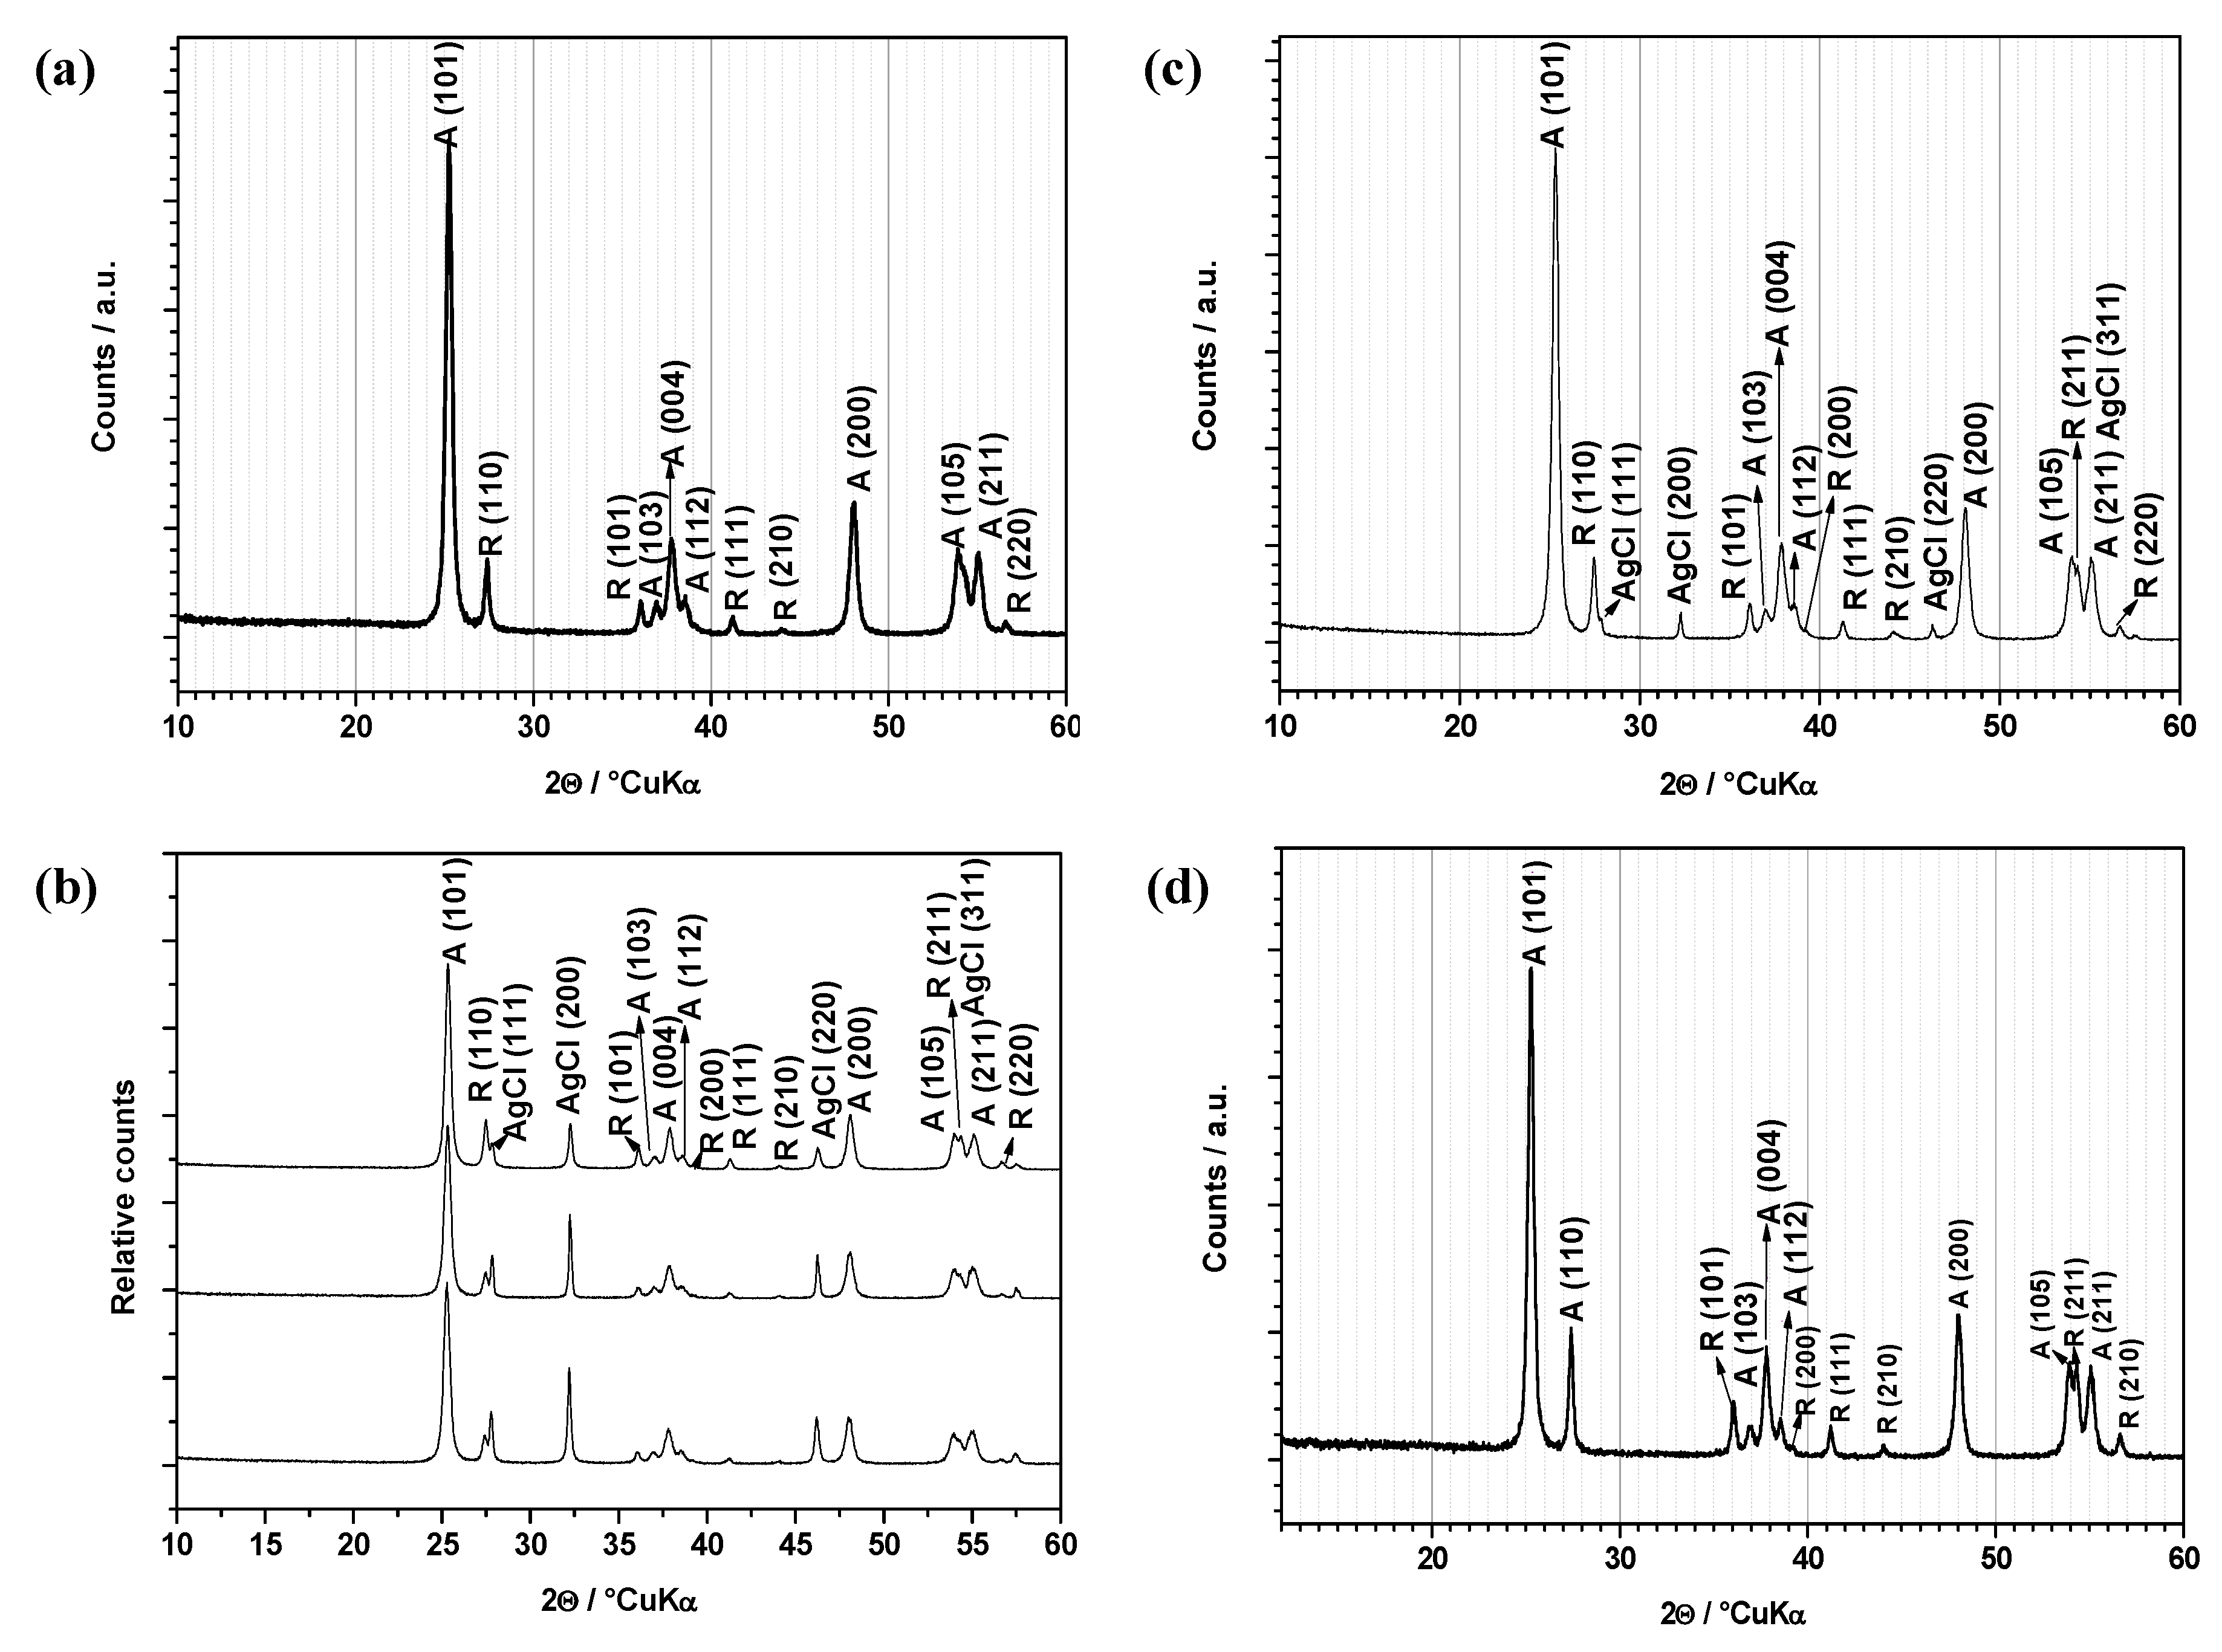
2.1. X-ray Diffraction (XRD) Analysis

Data of performed XRD analysis is given in Figure 1. As it can be observed, all samples contain almost the same proportion of anatase to rutile phase. Photocatalysts prepared by synthesis 1 (S1a, S1b, and S1c), i.e., by deposition–precipitation and photoreduction method using surfactant, contains a certain portion of AgCl on the surface (Figure 1b). Sample S2 contains a negligible portion of AgCl on the surface (Figure 1c). Having in mind unsuccessful reduction to Ag, samples S1a and b were completely excluded from detailed analysis, while photocatalytic activity was checked for S1c (for comparison), S2, and S3 only.
According to the Scherrer equation (Equation (1)), the average crystallite size (Dp) of the anatase and rutile in the powder was calculated from XRD data. Note that β stands for line broadening in radians, θ denotes Bragg angle and λ is an X-ray wavelength.
D p = 0 , 94   λ β ½ c o s θ
In all XRD patterns, the peaks with highest intensities of anatase (101), (004), and (200) were used to evaluate the size of nanoparticles. For size of rutile nanoparticles we used intensities of (110), (101), and (111) peaks. Calculated Dp were 20.2(6), 22.8(7), and 22(1) nm for anatase and 30(1), 30(1), and 33.8(5) for rutile, in S1c, S2, and S3, respectively, which corresponds well with the average crystallite size calculated for pure TiO2 P25 (20.4(7) nm anatase and 31.6(6) nm rutile). Figure 1 indicate that amount of rutile in sample S3 (Figure 1d) is higher than in sample S2 or TiO2 P25. Since only the calcination above 915 °C would lead to definite transformation of anatase to rutile phase, and the highest calcination temperature in this work was 600 °C (sample S3), the peak differences were attributed to the uncertainty of quantitative determination of crystalline phases by XRD.

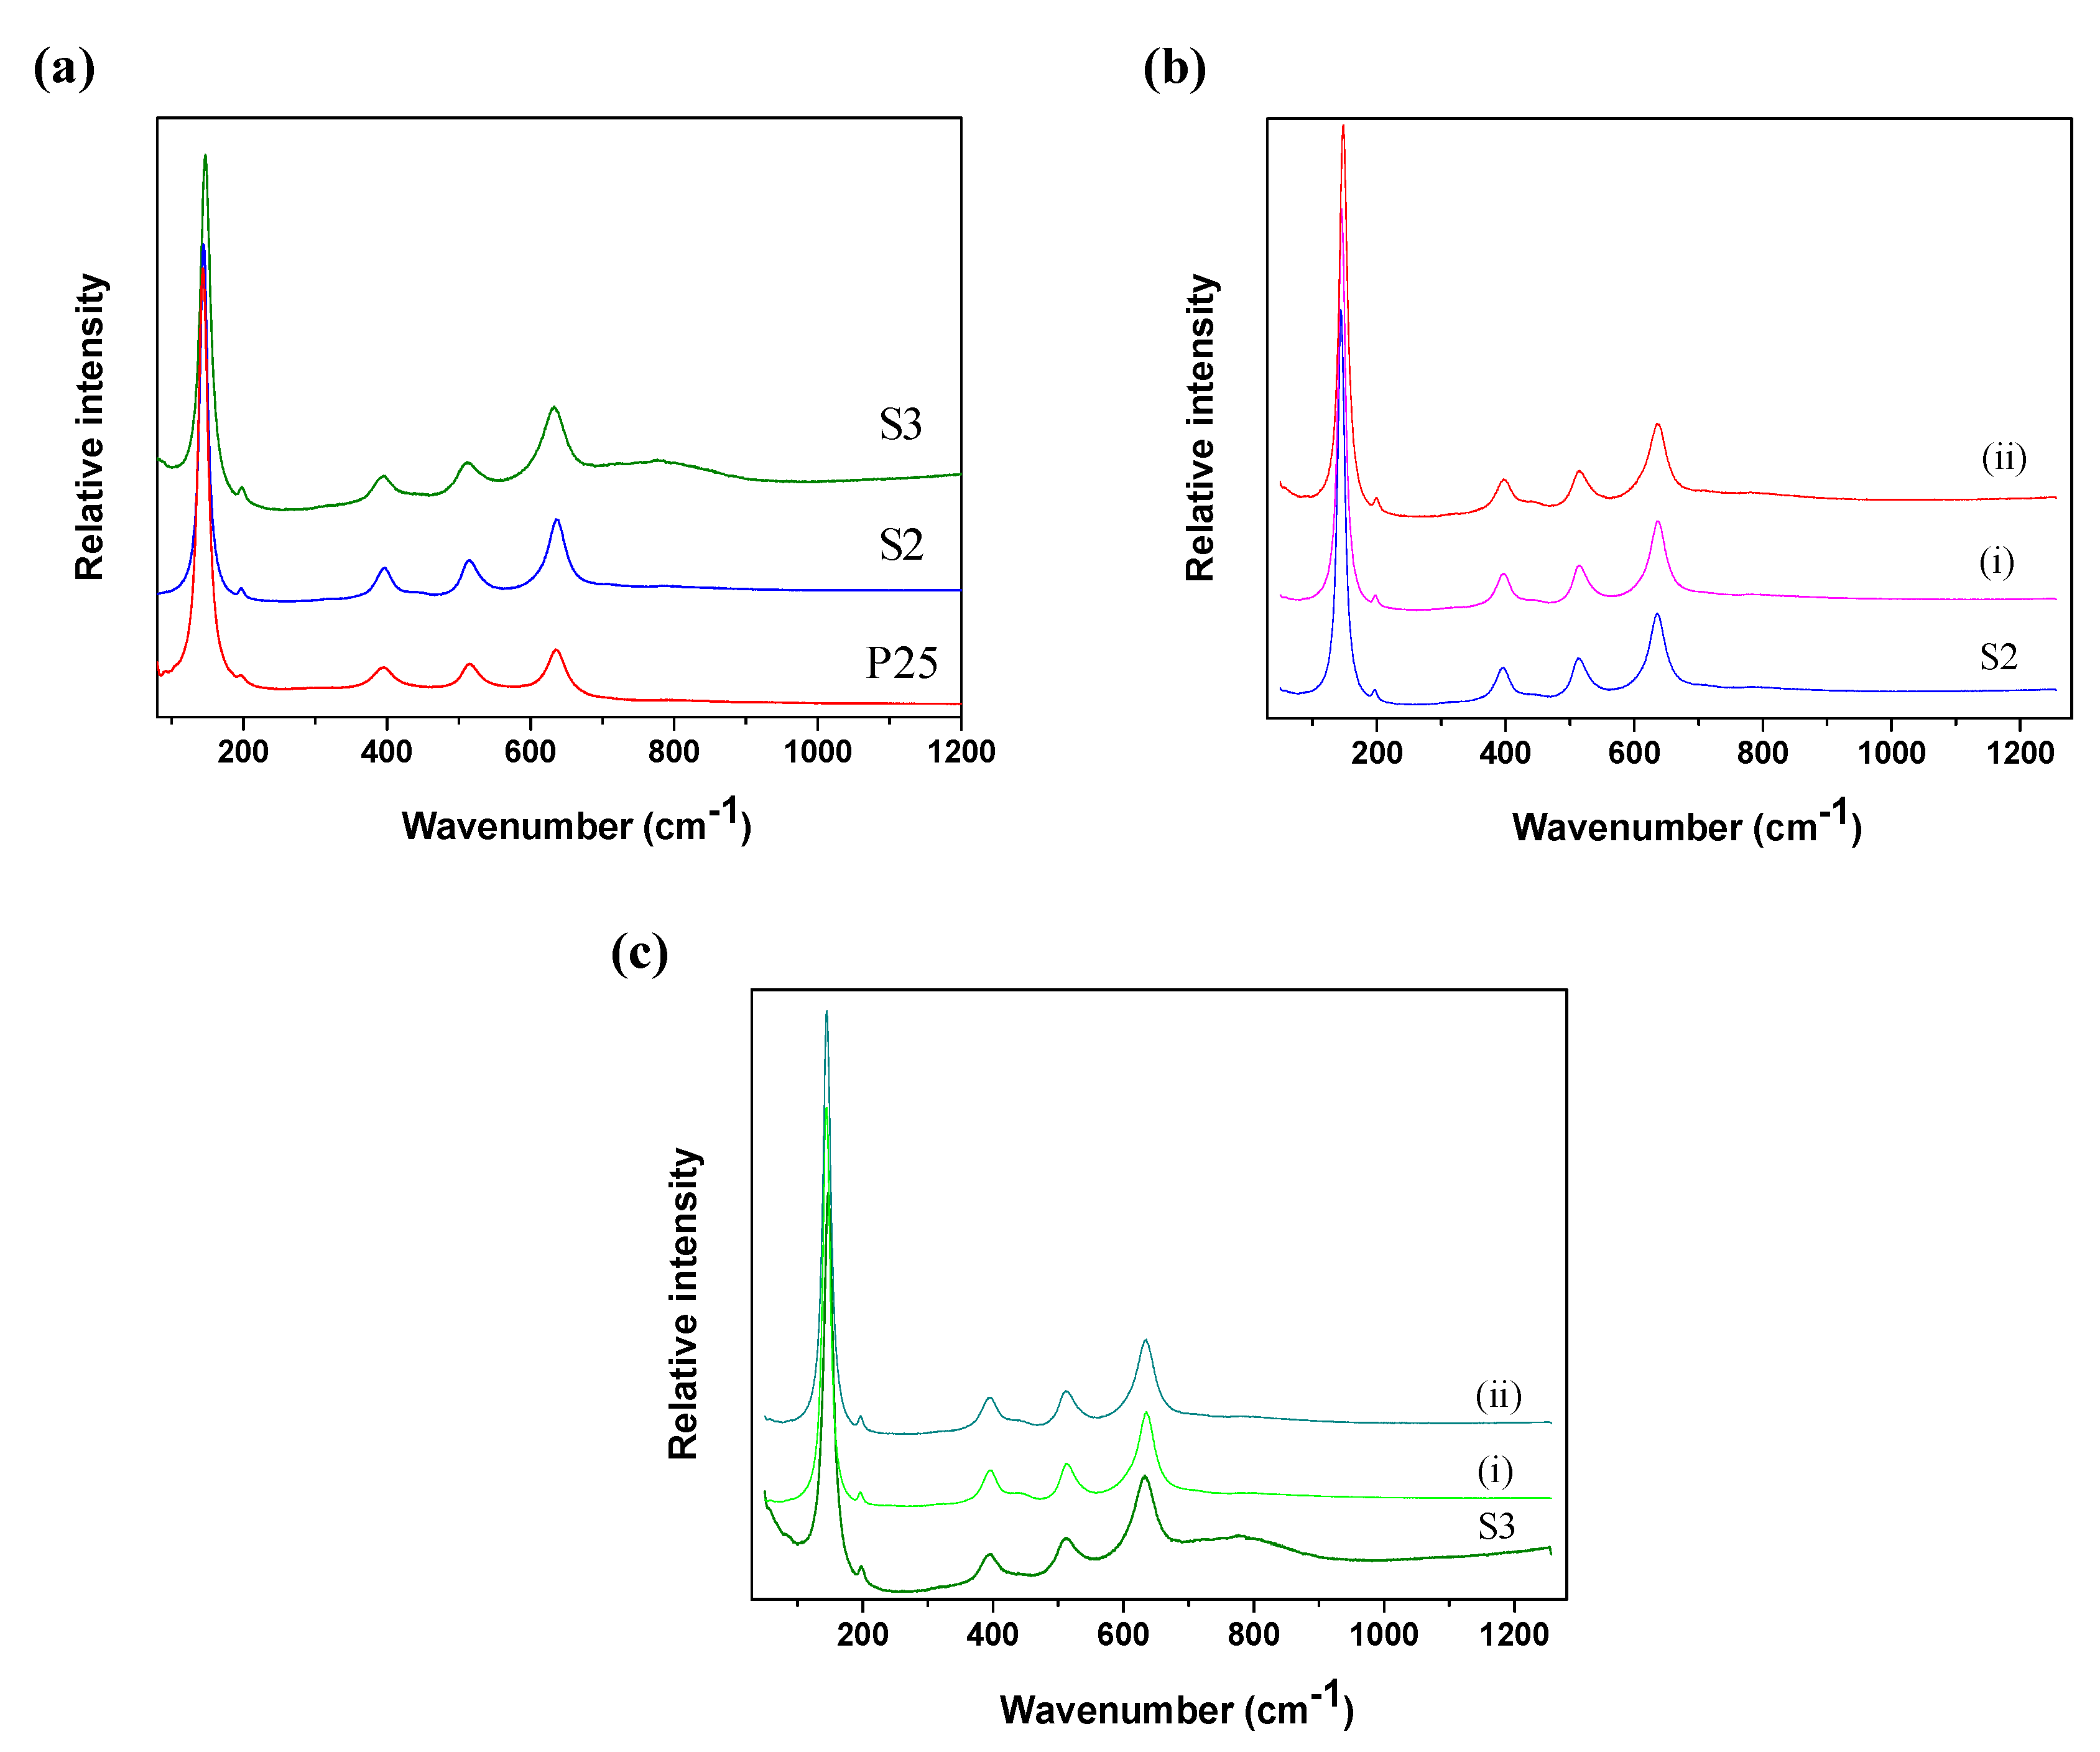
2.2. Raman Spectroscopy Measurements

Raman spectroscopy results for samples S2 and S3 before photocatalytic reactions indicates that all the samples are dominantly in anatase form of TiO2, since all the bands characteristic to anatase (at around 145, 198, 395, 514, and 635 cm−1) were observed in the spectra (Figure 2a). Some small amount of rutile can exist in the sample S2 indicated by band at 440 cm−1 having low intensity (denoted by the arrow). Anatase dominated at least at the surface of the particles since Raman spectroscopy is more sensitive to the surface than to the bulk of the particles [24]. Raman scattering cross section of the anatase phase is larger than that of the rutile. Therefore, in the case of the small amount of rutile in comparison to the anatase in the TiO2 sample it is hard or impossible to observe bands characteristic for rutile.
Sample S2 is recorded by Raman spectroscopy after the photocatalytic reactions that have been performed: (i) using simulated sunlight and (ii) using only visible part of the spectrum (Figure 2b). Raman spectroscopy results indicates that before and after reaction anatase form of TiO2 dominates, since all the bands characteristic to anatase (at around 144, 198, 395, 514, and 635 cm−1) were observed in the spectra while the band of rutile (at 438 cm−1) is hardly visible. The small shift of the anatase band at the 144 cm−1 to the higher wavenumbers in the samples recorded after reactions: to 145 cm−1 for the usage of sunlight (Figure 2b(i)), or to the 147 cm−1 for visible light (Figure 2b(ii)) indicated the decrease of the order in the crystal lattice of the anatase (nano)particles, or the possible formation of the defects.
Starting sample S3 show only anatase Raman bands, while after photocatalytic reaction using sunlight of the spectrum, rutile band of very low intensity at 438 cm−1 was observed (Figure 2c(i)). In the case of using visible part, anatase structure with only a small amount of rutile was observed as well (Figure 2c(ii)).
These results were in contradiction with the XRD results that suggested the highest ratio of rutile in S3 samples. Moreover, the Raman spectra of S3 showed certain baseline fluctuations that could cover the already weak rutile signals. Our findings showed the importance of combination of various methods for evaluation of material properties of a catalysts. In this case, one can conclude that the crystalline composition of TiO2 have not been changed during sample preparation or application.

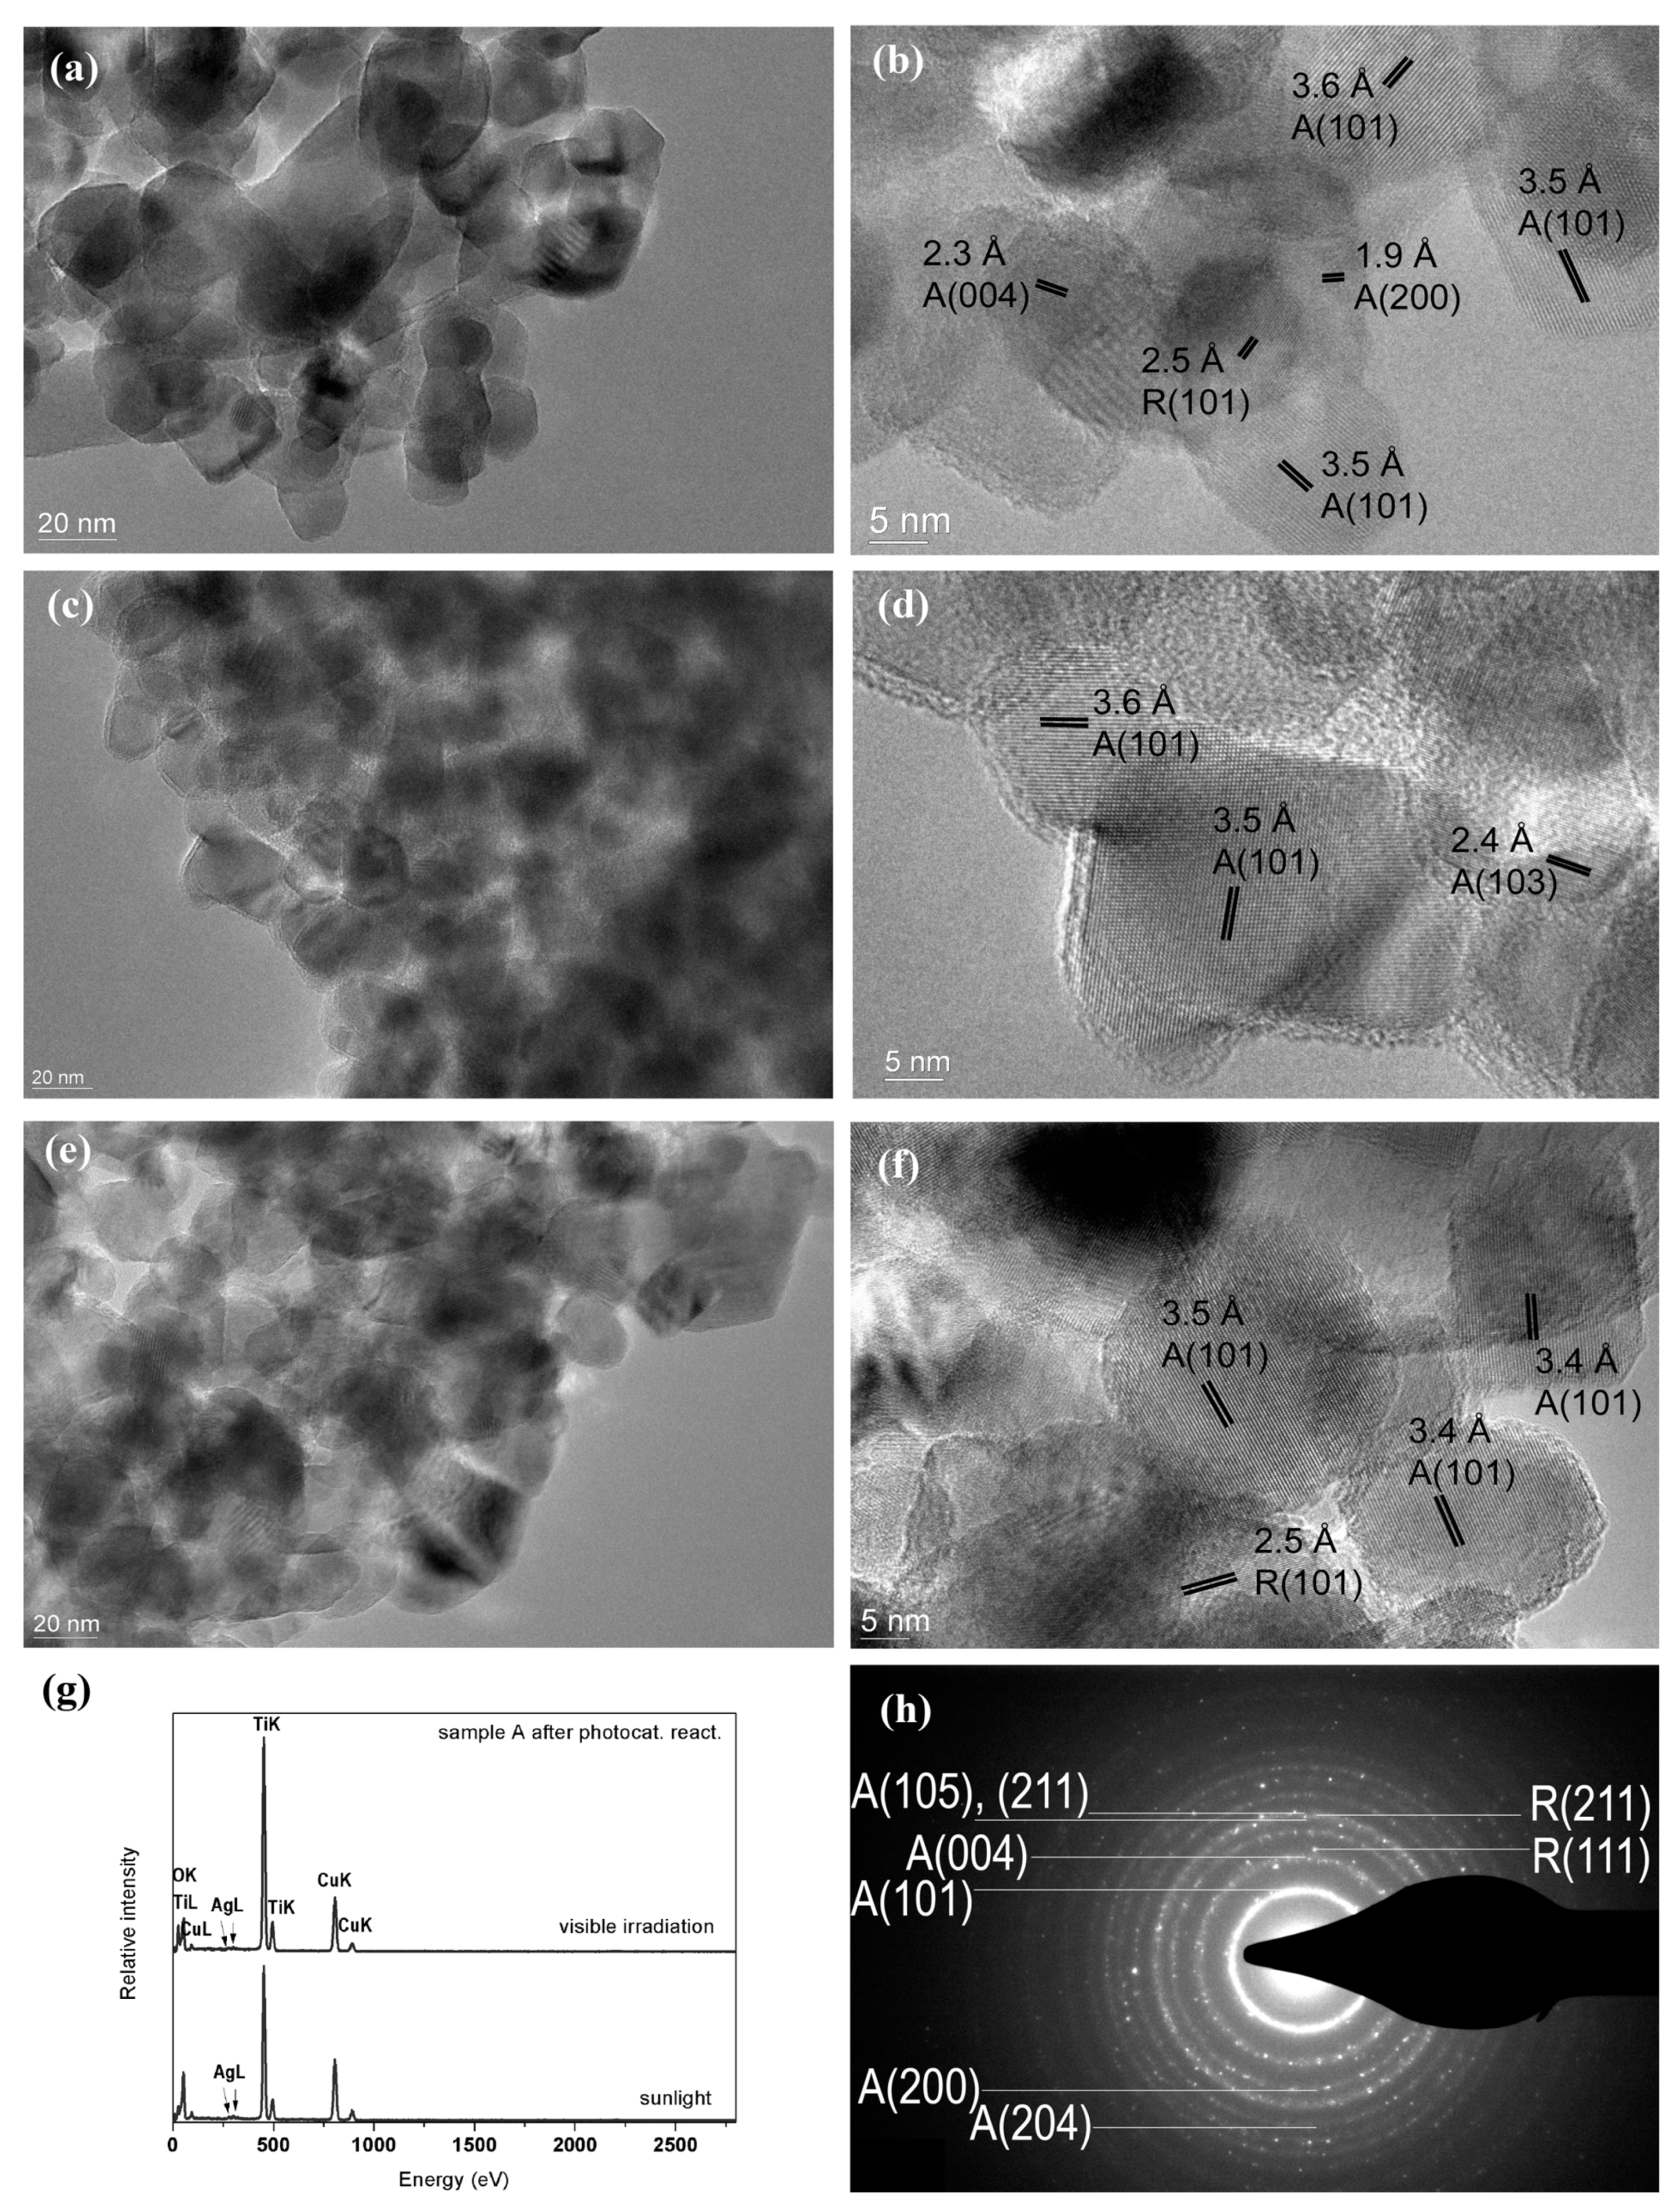
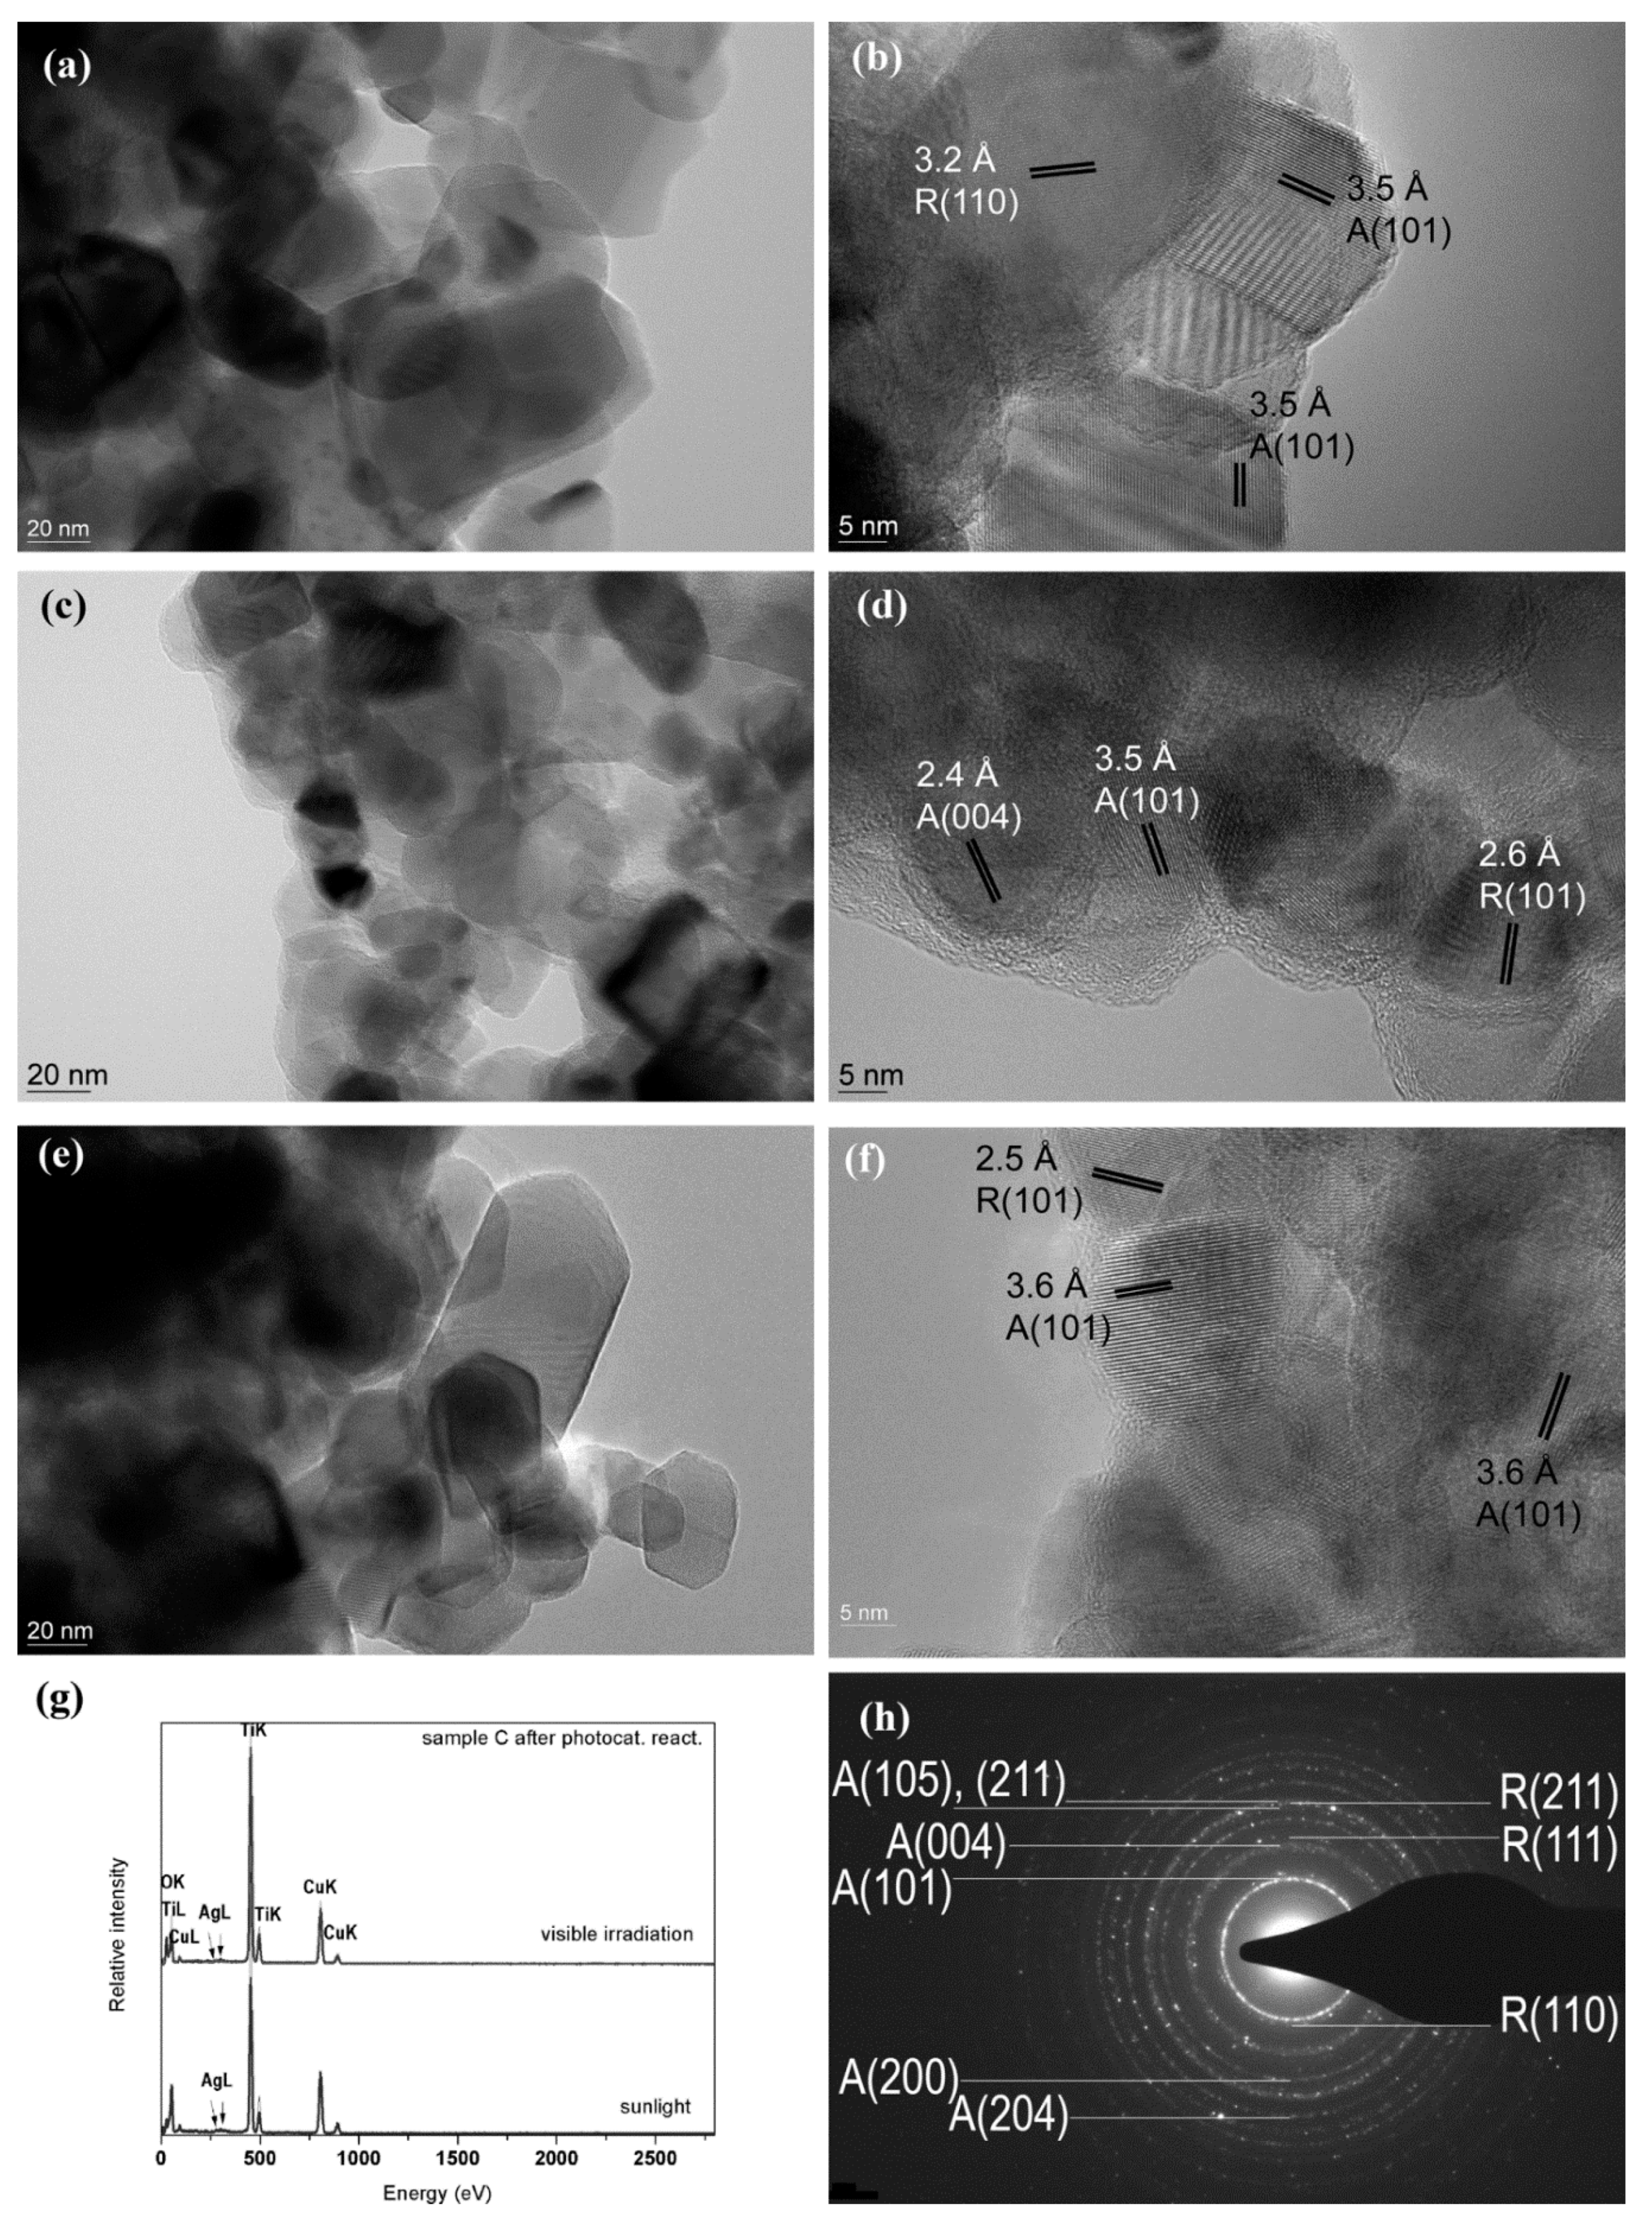
2.3. Study by TEM Techniques

The structural and morphological characterizations of samples S2 and S3 by TEM methods are shown in Figure 3 and Figure 4. TEM images show that the nanocrystals of both S2 and S3 samples are spherical, cubic-like or truncated tetragonal, and the particle size varies from less than 20 nm to about 50 nm in S2, while in S3 somewhat larger particles are also visible. The faces of the crystallites were not well defined, but the lattice fringes observed by HRTEM clearly indicated both anatase and rutile phase of the crystallites. The observed size of the rutile and anatase nanoparticles (Figure 3 and Figure 4) are in good agreement with crystallite sizes of calculated from XRD patterns (Figure 1) for both samples. SAED patterns (Figure 3h and Figure 4h) also consist of anatase and rutile diffraction points connected in the rings characteristic for monocrystalline materials. The number of the reflexes characteristic for the rutile phase is considerably smaller indicated smaller amount of the rutile phase in the sample.
The presence of Ag in small amounts is observed in all analyzed samples before and after photocatalytic reaction by EDXS measurements (Figure 3g and Figure 4g). The average atomic percentage of Ag indicated by multiple EDXS measurements in S2 was (0.5 ± 0.1) at %, while S3 contained somewhat larger amount of silver, (0.7 ± 0.2) at %. However, the nanoparticles of pure Ag were not observed, thus indicating that Ag atoms were inbuilt in crystal lattice of TiO2.
There are considerable differences in TEM images after photocatalytic reaction under sunlight and visible irradiation. After photocatalytic reaction, in the case of S2 samples, an amorphous layer of about one nanometer was observed on the surface of the catalyst after photocatalytic reaction using only visible irradiation (Figure 3d). The formation of this amorphous layer indicates that the products of catalytic reaction were accumulated on the surface of the catalysts. The reason for that accumulation could be incomplete degradation of the model pollutant (SA) under the visible light, so the formation of this amorphous layer could induce the decrease of the catalytic activity in time under only visible part of the irradiation spectrum. Moreover, the crystal structure of the TiO2 particles could be also affected at the surface, which could be inferred from comparison with the Raman spectroscopy measurements. In the Raman spectrum 144 cm−1 band shifting to higher wavenumbers was observed indicating disorder of TiO2 anatase crystal lattice, as was mentioned before.
In the case of catalytic reaction using complete sunlight, the amorphous layer was not formed (or is considerably thinner) at the surface of the S2 catalyst (Figure 3e,f) thus indicating that the reaction was completed when both visible and UV part of the simulate sunlight spectrum were used for photocatalysis.
The formation of the thick amorphous layer is also observed in the case of photocatalysis with only visible irradiation in sample S3 (Figure 4c,d) which points to the accumulation of organics on the surface due to slower degradation as well. However, in the case of S3 sample when simulated sunlight was used for photocatalysis, there were not observed any amorphous layer on the sample surface (Figure 4e,f), thus the best catalytic performance was expected from this sample.
EDXS measurements of both samples after the reactions (Figure 3g and Figure 4g) indicate that the Ag is still present in the samples after catalytic reaction no matter which irradiation was used. Moreover, the crystal structure of TiO2 nanoparticles is also preserved, so still the mixture of anatase and rutile crystallites was observed by SAED after the reactions, which is in accordance with the Raman spectroscopy measurements of the samples after catalytic reactions.

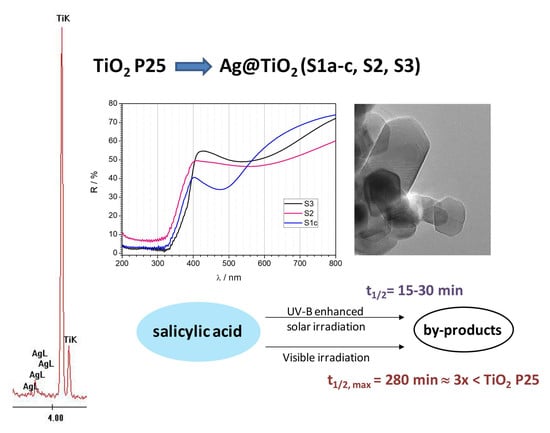
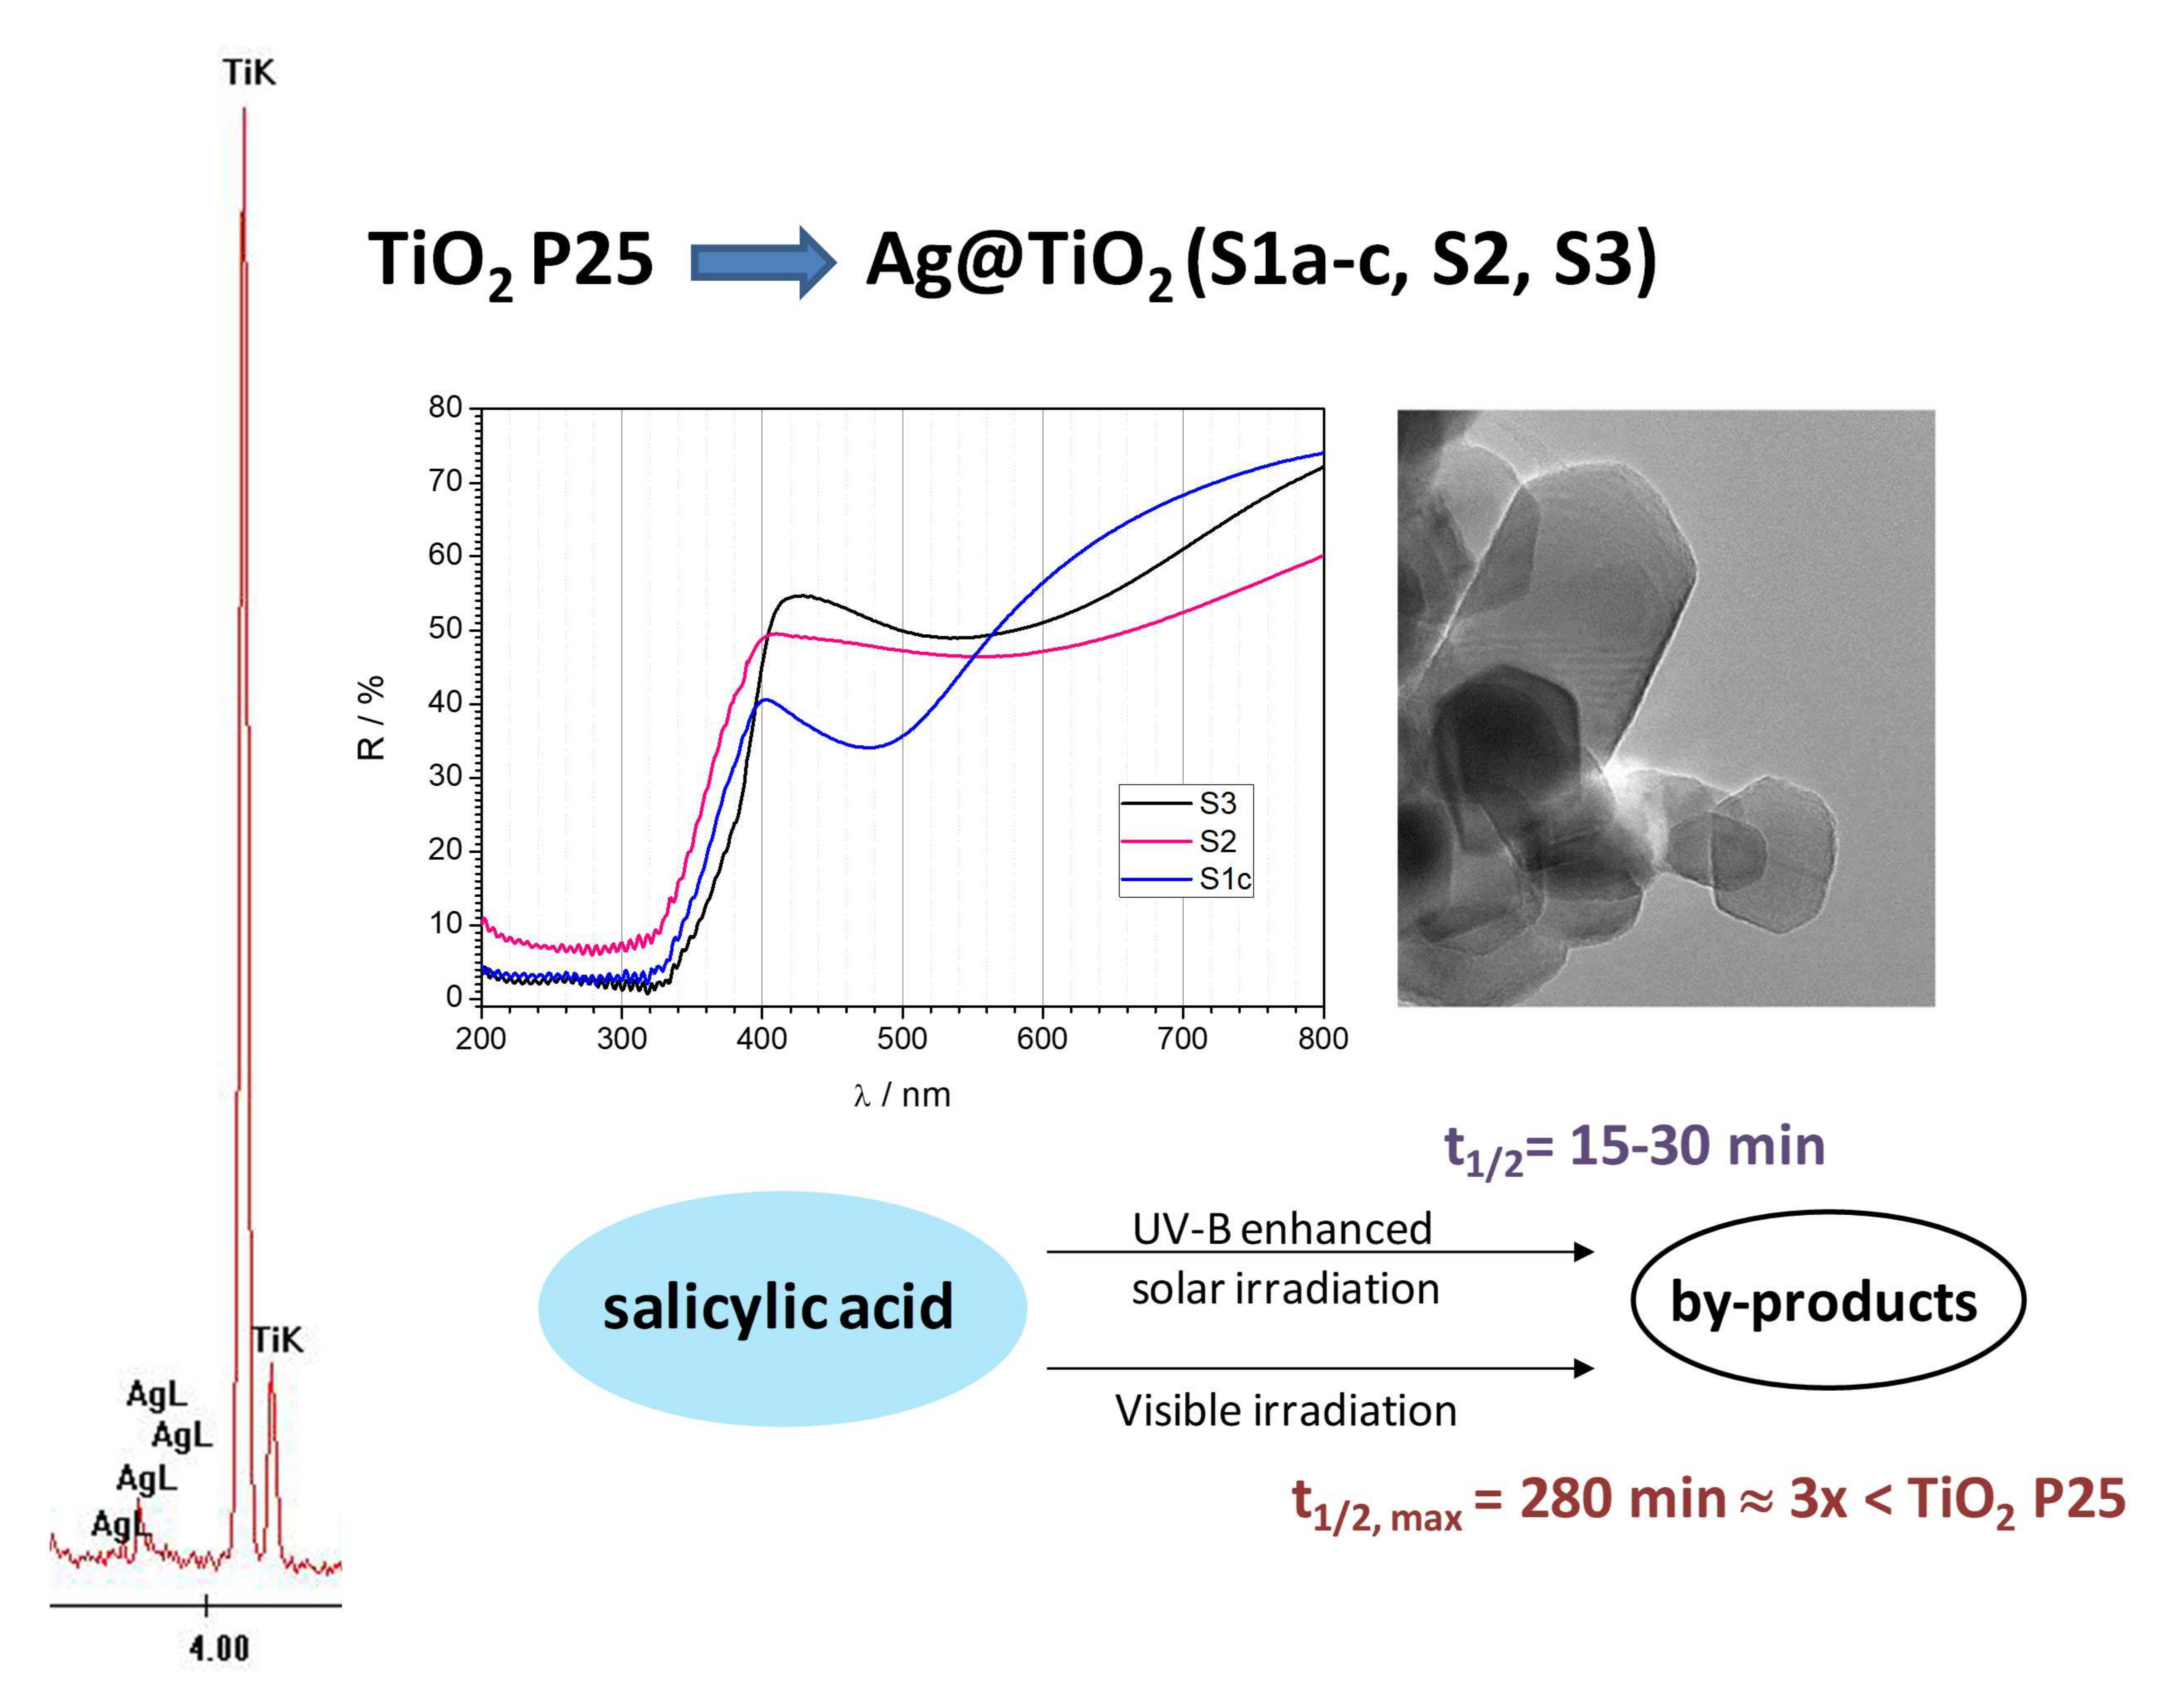
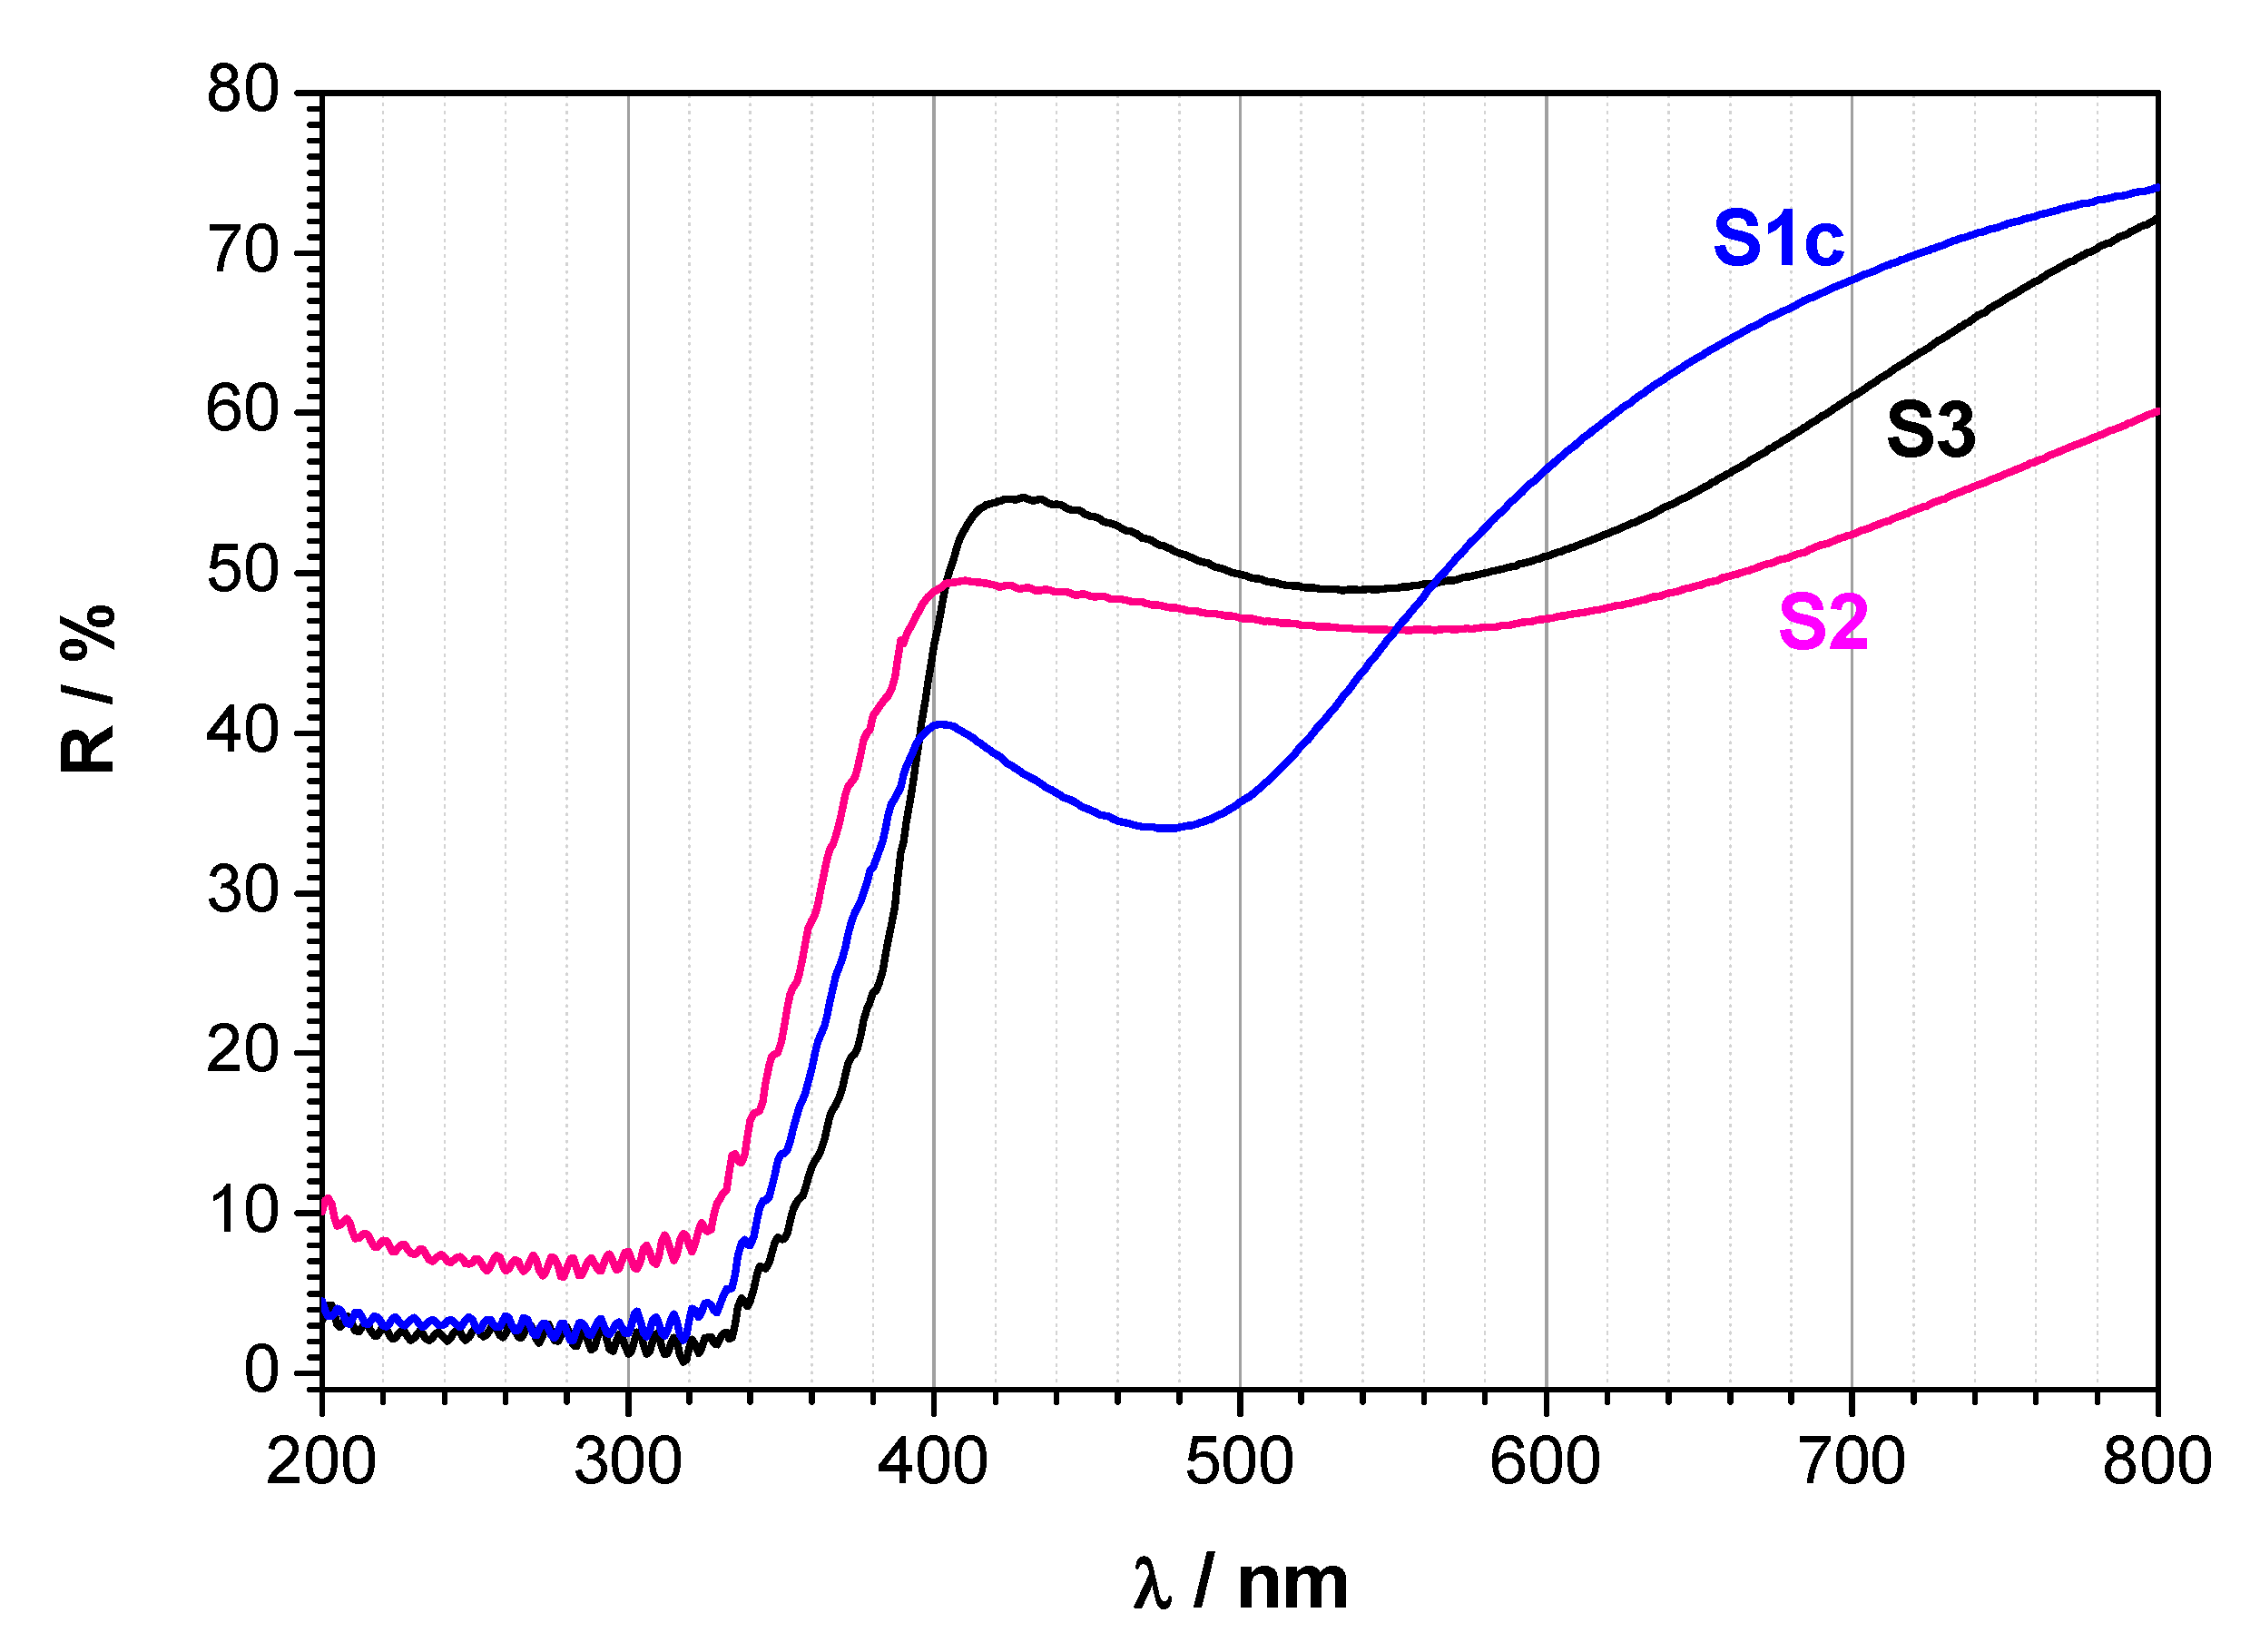
2.4. UV-Vis Diffuse-Reflectance Spectral Analysis

Figure 5 shows the UV–Vis diffuse-reflectance spectra of the as-prepared catalysts. These materials show a strong absorption in the UV region, a characteristic typical of semiconductors. Therefore, strong absorption below 350 nm corresponds with the band gap for TiO2 which comes from difference in position of valence and conductive band in prepared samples (Eg1 in Table 1). The series of Ag@TiO2 photocatalysts also exhibited broad absorption in the region of visible light. The absorption in the visible part should be assigned to surface plasmon resonance of silver nanoparticles, centered at 490–530 nm [12,22]. However, in case of S2 and S3, no nanoparticles were observed by HRTEM. Therefore, the band gap lowering might be due to Ag inbuilt in the crystal structure of TiO2 nanoparticles acting as a dopant in TiO2 semiconductor crystal that form additional energy levels in band gap region of TiO2. The samples S1c, S2, and S3 exhibit a visible light absorption, so corresponding band gaps (Eg2) can be calculated, as denoted in Table 1.
The band gaps are calculated by known procedure [25,26]. According to the Kubelka–Monk theory of diffuse reflectance, the data were transformed using the function Equation (2) versus energy where R∞ is diffuse reflectance.
F(R∞) = (1 − R∞)2/(2R∞)
The data were plotted in the form of Tauc plots as [F(R) × hυ]n versus hυ, where n = 2 for direct transitions and n = ½ for indirect transitions. The value of n = 1/2 was used since both anatase and rutile phase of TiO2 have indirect band gap. The optical band gap sizes were estimated from the onset of absorption, as extrapolated from the line arising section of the curve that intersects with the baseline [25,26] and is listed in Table 1.
All three samples (S1c, S2, and S3) show similar values for band gap transitions in TiO2: 2.86, 2.86, and 2.98 eV, respectively (Table 1). These are the band gaps of TiO2 that were shifted to visible region due to the presence of Ag. The red-shift of the band-gap absorption was expected since it is noticed with metal and non-metal loading of TiO2 [14]. Another transition which was occurred around 1.2 eV could be attributed to the additional energy levels in band gap region of TiO2 due to the Ag that acts as dopant.

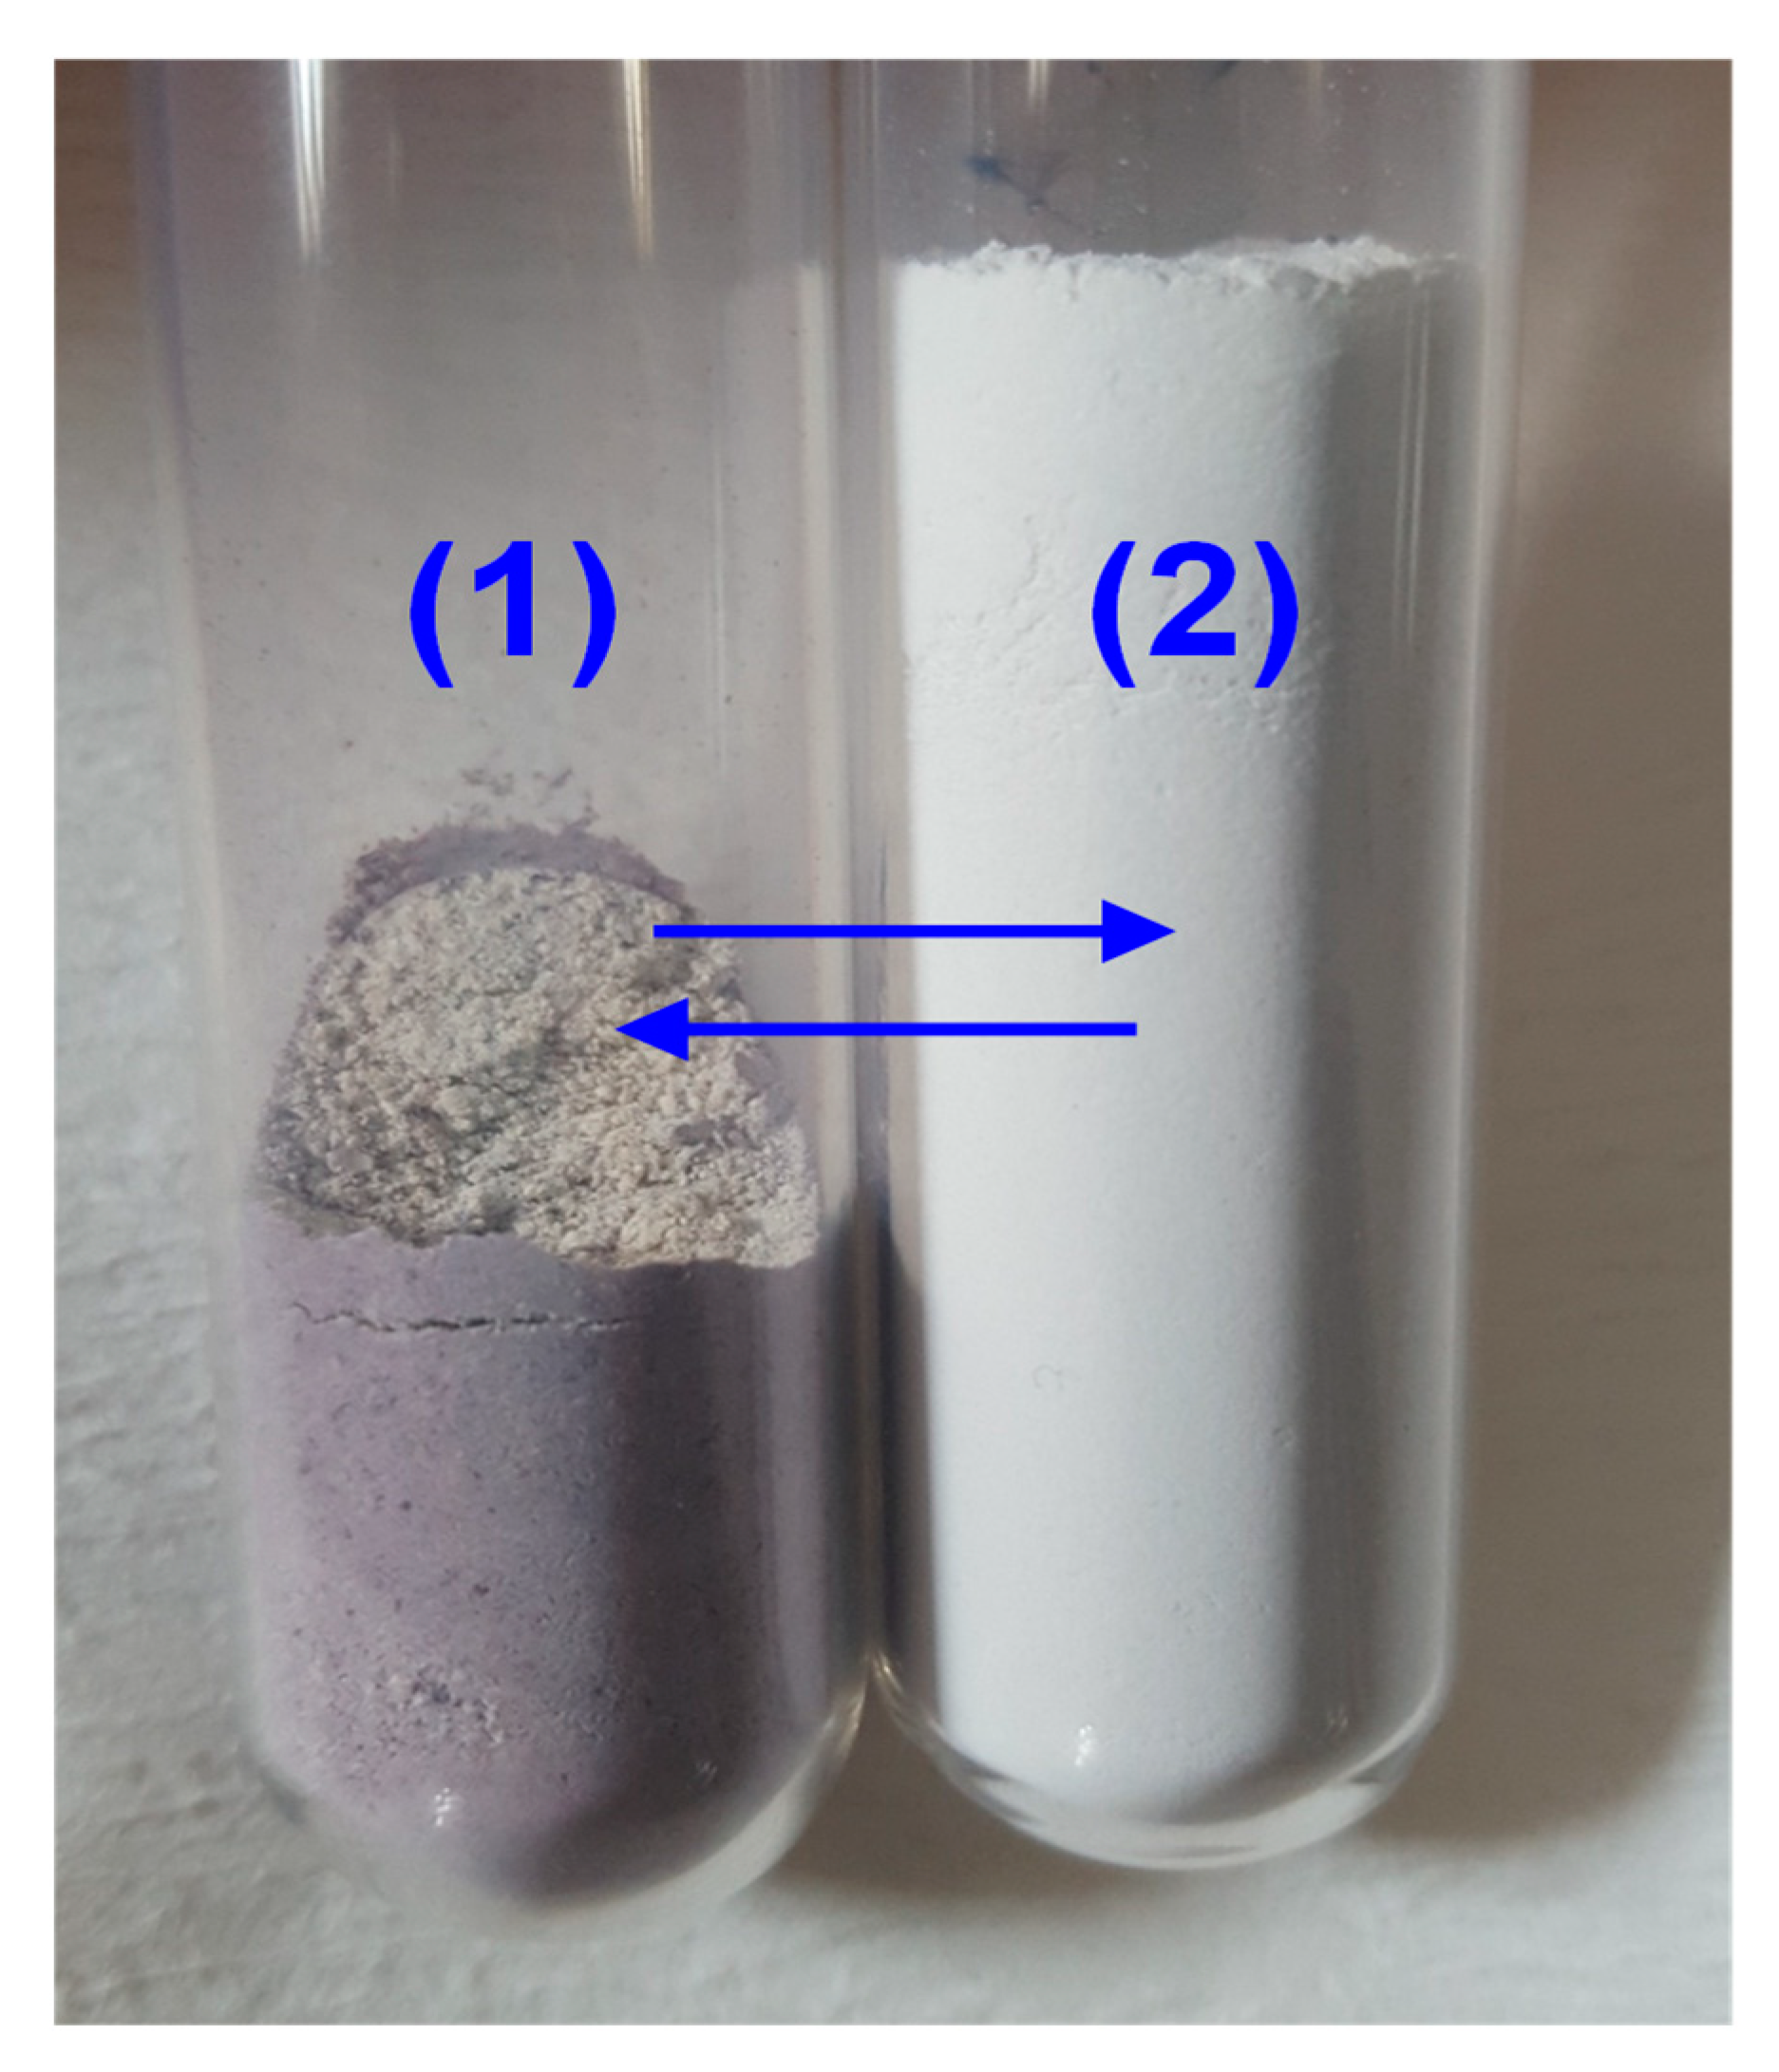
2.5. Detection of Ag Nanoparticles

In TEM images of S3, Ag is not identified as individual crystals, which indicates that Ag might be substituted in TiO2 crystal network. However, cell parameters (calculation not presented) did not show much difference from an undoped TiO2. In literature [27] was reported that only a small number of Ag nanoparticles were found by TEM, and the majority of them were recessed in the TiO2 nanopores. Applied preparation method must have resulted in Ag nanoparticles finely dispersed on TiO2 surface. Growth of Ag nanoparticles in chitosan matrix ensures development of small nanoparticles [22] which can easily enter the TiO2 pores. The latter was expected since only S3 sample retain white color and other Ag doped catalysts were colored from pinkish to grey. It was observed that the color of S3 sample that was kept refrigerated in dark did not change. In contrary, sample that was kept indoor under ambient conditions (room temperature, ambient light, no UV) changed color to greyish-purple after few weeks. However, it was impossible to keep the observed color for possible analysis since it immediately turned back to white after the sample was shaken (Figure 6). The explanation for the observed phenomena, which resembles to photochromism [28] and clearly indicates the presence of Ag in S3 sample, was found in similarity with the two-photon luminescence experiments [29]. Under ambient conditions, only low-intensity visible-NIR irradiation can reach the surface of the sample which after a longer period of exposure corresponds to visible-NIR excitations regularly used in two-photon luminescence experiments. Ag nanoparticle is then excited with “two-photons” and fluorescence emission is observed when return to ground state. On the other hand, TiO2 plays important role in rapid color retrieval. If we assume that excited Ag loses electron (Equation (3)), and that electron freely circle in the TiO2 conduction band, when air rapidly flows through the sample (“shaking” of the sample), oxygen adsorbs on the TiO2 surface and captures the excess electron (Equation (4)). Eventually, superoxide anions recombine rapidly with Ag+ and the white color is observed again.
A g 0 + T i O 2 A g + + T i O 2 ( e )
O 2 + e c b O 2
Justification for a tentative mechanism explaining the observed spontaneous photochromism of S3 sample is found in related researches. In [28], it was reported that interconversion between plasmonic Ag nanoparticles and Ag+ is responsible for reversible color changes in case of multicolor photochromism, and electrons from small Ag nanoparticles are easily injected into TiO2, while O2 acts as electron acceptor for excited nanoparticles [27].
To estimate the emission wavelength from excited particles, observed color was associated with colors from Pantone® color chart and British Standard BS4800 colors. Observed greyish-purple color (Figure 7) matches Pantone PMS 5275 and PMS 5285 and BS4800 22-C-37, all described as blue-magenta shades with approximated corresponding wavelengths (λapprox) from 455 to 469 nm. Obtained λapprox correspond with the reported values absorption of Ag deposited on TiO2 [27,30,31].

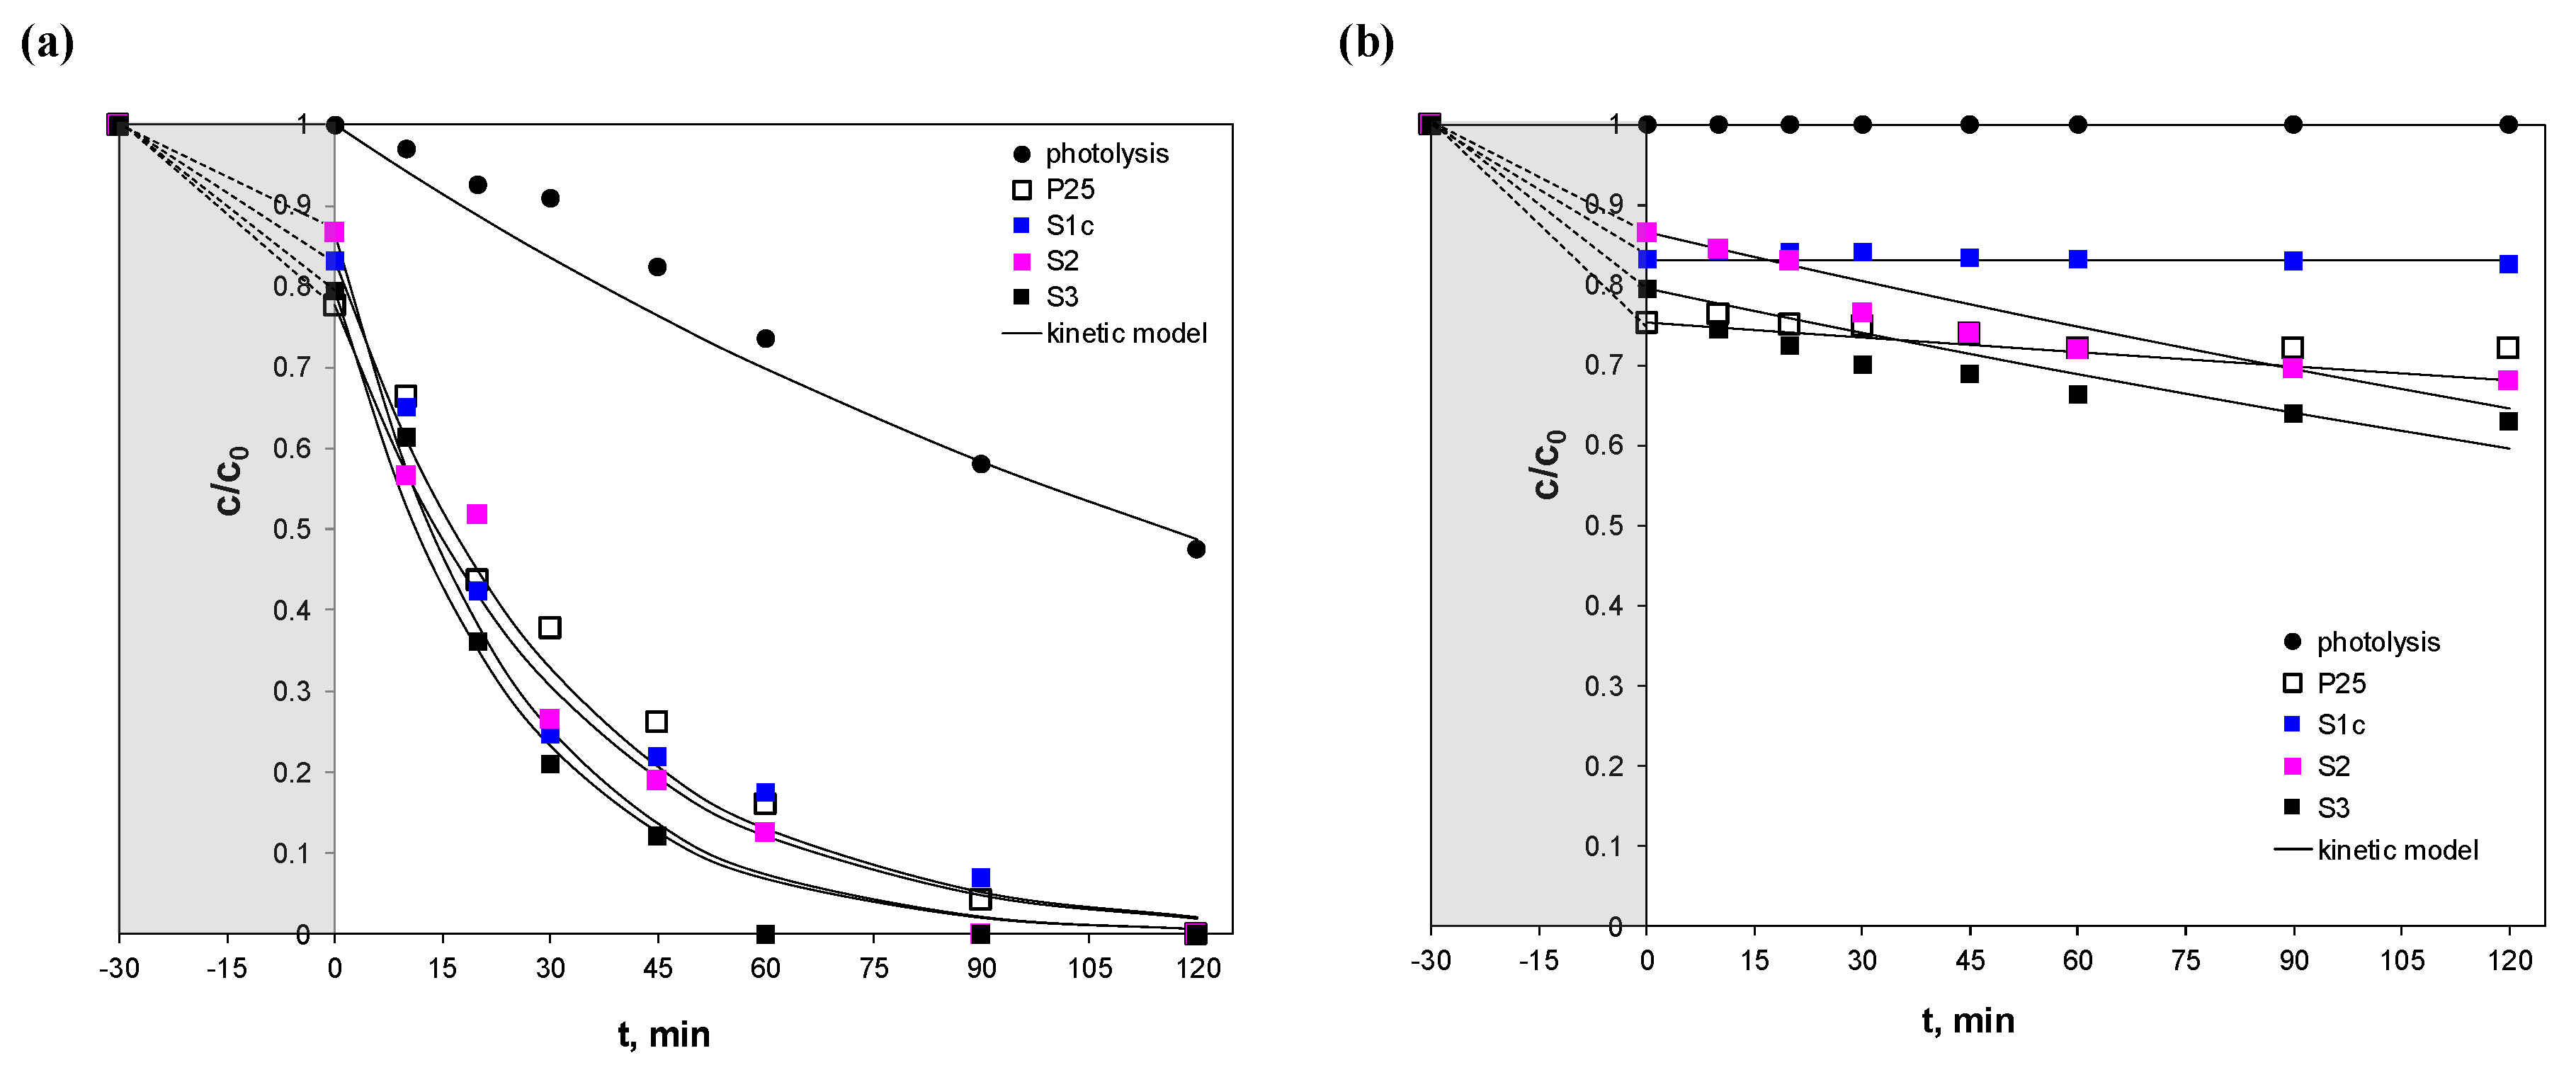
2.6. Photocatalytic Activity

The visible and full solar light driven photocatalytic activity of prepared Ag@TiO2 samples were investigated for the degradation of SA. Figure 7a,b show the kinetics and efficiency of photocatalytic degradation of SA. Commercial TiO2 P25 was tested as a reference. It can be seen that TiO2 did not show photocatalytic activity under visible irradiation and also photocatalyst S1c appeared as inactive, possibly due to residual AgCl on TiO2 surface that absorbed the useful irradiation and block active sites necessary for generation of HO radicals. The photocatalytic activities were observed as follows: S3 ≈ S2 under visible irradiation and S3 > TiO2 P25 ≈ S2 ≈ S1c under solar irradiation. As it can be seen, S3 seemed to be an efficient photocatalyst under both solar and visible irradiation. The complete degradation of SA was achieved for 60 min of irradiation while its activity is increased by about 20% compared to TiO2 P25. Therefore, the best photocatalytic performance of this sample was shown, although the S3 sample has the largest band gap Eg1. The main reason for better performance could be explained by modification made using chitosan. The method is not only facile and environmentally friendly, but the use of the viscous gel-like medium provided an even distribution of Ag throughout the sample. During photocatalytic processes, electrons and holes are excited in TiO2. These electrons and holes can recombine and result in the reduction in the photocatalytic efficiency, if TiO2 is used alone without any modification of it. Since TiO2 is modified, it is expected that presence of Ag could suppress the electron–hole recombination and increase efficiency [32] apart from surface plasmon resonance.
Confirmation for the given explanation on enhanced activity is found in [33,34]. The loading of noble metal nanoparticles on TiO2 surface is one of possible approaches to reduce the high recombination rate process. After the light absorption, the promoted electrons from the valence band into conduction band of semiconductor is subsequently captured by noble metal which have a lower Fermi energy level than the semiconductor, leading to the separation of electron-hole pairs and an increase of the photocatalytic efficiency, particularly under UV irradiation. Instead, under visible light irradiation, the charge carriers in noble metal are injected from the excited plasmonic metal nanostructure into the semiconductor thus reducing the recombination rate process and simultaneously increasing the photocatalytic activity.
The photodegradability of SA was also investigated in the absence of photocatalyst. The SA did not undergo any degradation under visible light (Figure 7b) while under solar light was degraded even around 50% after 2 h as shown in Figure 7a.
The photocatalytic degradation of SA follows the Langmuir–Hinshelwood kinetics model that is typically used for describing degradation kinetics over irradiated photocatalytic films [35]. As the initial concentration of SA is a millimolar solution (0.2 mmol L−1) and its concentration in comparison with the suspended catalysts loading (1 g L−1) is small, the model can be simplified to give a first-order equation (Equation (5)).
d c S A d t = k S A ,   o b s c S A
In the case of full-spectrum solar irradiation with an enhanced UV-B irradiation, the equation accounted rate of photolysis as shown in (Equation (6)).
d c S A d t = ( k p h o t o l y s i s + k S A ,   o b s ) c S A
The kphotolysis and kSA, obs are pseudo-first order rate constants for photolysis and photocatalysis of SA in investigated system, respectively, both given in min−1. Under given conditions, the observed rate constant for photolysis, kphotolysis was 6 × 10⁻³ min−1.
Rate constants were evaluated from Equations (7) and (8) through the linear regression of ln(cSA/cSA,0) vs. Time where cSA is the SA concentration (mgL−1) at a time t (min) and cSA,0 is the initial SA concentration after adsorption (mgL−1).
l n c S A c S A , 0 = k S A ,   o b s t
l n c S A c S A , 0 = ( k p h o t o l y s i s + k S A ,   o b s ) t
The corresponding values of the pseudo-first order rate constant kSA, obs as well as the degradation half-time, t1/2 and the determination coefficient R2 are given in Table 2. The comparison of photocatalytic activity using the simple kinetic model disregarding the catalysts surface area was justified since all catalysts have very similar specific surface areas. Namely, compared to commercial TiO2 P25 whose SBET was 56 m2 g−1, the surface areas of SBET of S1c, S2, and S3 were 45, 47, and 52 m2 g−1, respectively.
The rate of photocatalytic degradation of SA with all used photocatalysts is quite high when artificial solar light was applied and less than half an hour is needed for its half-degradation.
The photocatalytic activity of S2 and S3 was almost the same under visible irradiation. This can be explained by the insignificant difference in net contribution of Ag in the TiO2 lattice. Moreover, both S2 and S3 have an absorption band at 400–700 nm (Figure 5.) that could be assigned to surface plasmon absorption of silver, typically centered at 490–530 nm [21]. The broader band of S2 suggested the larger Ag particles than those in S3. The small particle size and electron sharing phenomena are well described and incorporated in the explanation of the observed spontaneous photochromism (Section 2.5).

3. Materials and Methods

3.1. Preparation of Ag/TiO2 Photocatalysts

The photocatalysts were prepared by the known methods (S1a–c and S2) similar to those described in the literature [13,21], and by a novel method (S3) developed using literature on the preparation of Ag/chitosan composites [22]. The Ag@TiO2 photocatalysts marked as S1a and S1b were prepared by deposition precipitation with photoreduction, S1c was prepared by deposition precipitation and S2 by photocatalytic deposition. Photocatalyst marked as S3 was prepared by a novel method including deposition precipitation and reduction by chitosan. Detailed preparation routes are described in following subsections. In all procedures, TiO2P25 (Evonik, AEROXIDE ®) was used as starting titania material.

3.1.1. Preparation of S1a

TiO2 (0.20 g) and cationic surfactant N, N-Dodecyl-N, and N-dimethylammoniumchloride (hereafter: BARDAC) manufactured by Lonza, Switzerland (0.34 mL) were suspended in Milli-Q water (100 mL) and stirred for 60 min, followed by the addition of AgNO3 (0.1 M, 2.00 mL). The resulting suspension was stirred at room temperature for 60 min and then placed in UV chamber for 20 min. UV chamber consist of four 8 W lamps with emission output at λ = 300 nm. The suspension was filtered and washed with Milli-Q water. The obtained grey powder was dried at 80 °C for 12 h and then calcined at 300 °C for 3 h.

3.1.2. Preparation of S1b

TiO2 (0.20 g) and BARDAC (0.75 mL) were suspended in Milli-Q water (100 mL) and stirred for 60 min, followed by the addition of AgNO3 (0.1 M, 2.00 mL). The resulting suspension was stirred at room temperature for 60 min and then irradiated with ultraviolet lamp (λ = 254 nm, 8 W) for 20 min. The suspension was filtered and washed with Milli-Q water. The obtained greyish-pink powder was dried at 80 °C for 12 h and then calcined at 300 °C for 3 h.

3.1.3. Preparation of S1c

TiO2 (1.00 g) was suspended in Milli-Q water (100 mL) and sonicated for 30 min. After sonication, BARDAC (1.20 mL) was added and suspension was stirred for 30 min, followed by the addition of AgNO3 (0.21 g) and NH4OH (2.30 mL, 25 wt.% NH3). The resulting suspension was stirred at room temperature for 12 h. The product was filtered, washed with distilled water, and dried at 70 °C for 12 h. Finally, the grey powder was calcined under air at 500 °C for 3 h.

3.1.4. Preparation of S2

TiO2 (2.00 g) was suspended in aqueous solution of methanol (4 mL), AgNO3 (0.1 M, 3.80 mL) and NaCl (0.0018 M, 200 mL) in the round-bottom flask of 400 mL. The suspension was purged with a stream of nitrogen and irradiated with UV lamp (λ = 365 nm, 4 W) for 3 h. The product was filtered, washed with distilled water, and dried at 100 °C for 12 h.

3.1.5. Preparation of S3

Chitosan (Aldrich) (0.055 g) was dissolved in acetic acid (0.15 M, 25 mL) and the resulting biogel was added to NaOH aqueous solution (0.13 M, 100 mL). After a short mixing, TiO2 (6.00 g) and AgNO3 (0.13 M, 2.50 mL) were added simultaneously. Stirring was continued for 24 h in the dark. Finally, the suspension was filtered and then calcined at 600 °C for 3 h to eliminate chitosan.

3.2. Catalysts Characterization

The samples were studied by X-ray diffraction (XRD) analysis using a Shimadzu XRD 6000 diffractometer with CuKα radiation. Data were collected over a 2Θ range between 10 and 70° 2Θ in step scan mode with steps of 0.02° and counting time 4 s per step. The identification of crystal phases was done using Joint Committee on Powder Diffraction Standards (JCPDS) card catalogue.
Raman spectroscopy measurements were performed using a Horiba Jobin-Yvon T64000 Raman system (Villeneuve d’Ascq, France) working in micro-Raman configuration. Coherent, Innova 400 (Santa Clara, CA, USA) argon ion laser operating at 514.5 nm was used for excitation. The Raman data were collected in a true backscattering geometry with the aid of a liquid nitrogen-cooled multi-channel charge-coupled device (CCD) detector. Nominal laser power of 20 or 7 mW (depending of the sample) was focused on the samples using a long working distance 50× objective lens with numerical aperture NA = 0.5 (Olympus, Tokyo, Japan).
High resolution transmission electron microscopy (HRTEM) was performed using Philips CM200-FEG transmission electron microscope operated at 200 kV, equipped with energy dispersive X-ray spectroscopy (EDXS) detector Genesis 4000. For the TEM measurements, the samples were first suspended in chloroform by sonication; then, a small drop of the suspension was transferred onto the carbon-coated copper grid. Finally, the grid was dried in air.
The UV–Vis spectra of the prepared samples were obtained using DRS (Shimadzu UV–3101PC) equipped with an integrating sphere. The spectra were recorded at room temperature in the wavelength range of 200–800 nm. BaSO4 was used as a reference. The diffuse reflectance spectra were presented with the reflectance of the “infinitely thick” layer of the solid, R (%).
The BET surface areas were estimated from nitrogen adsorption and desorption isotherm data using an ASAP 2000 apparatus (Micromeritics Corporation). Prior to analysis, samples were degassed (6.6 Pa) at 400 °C to remove any physically adsorbed gases.

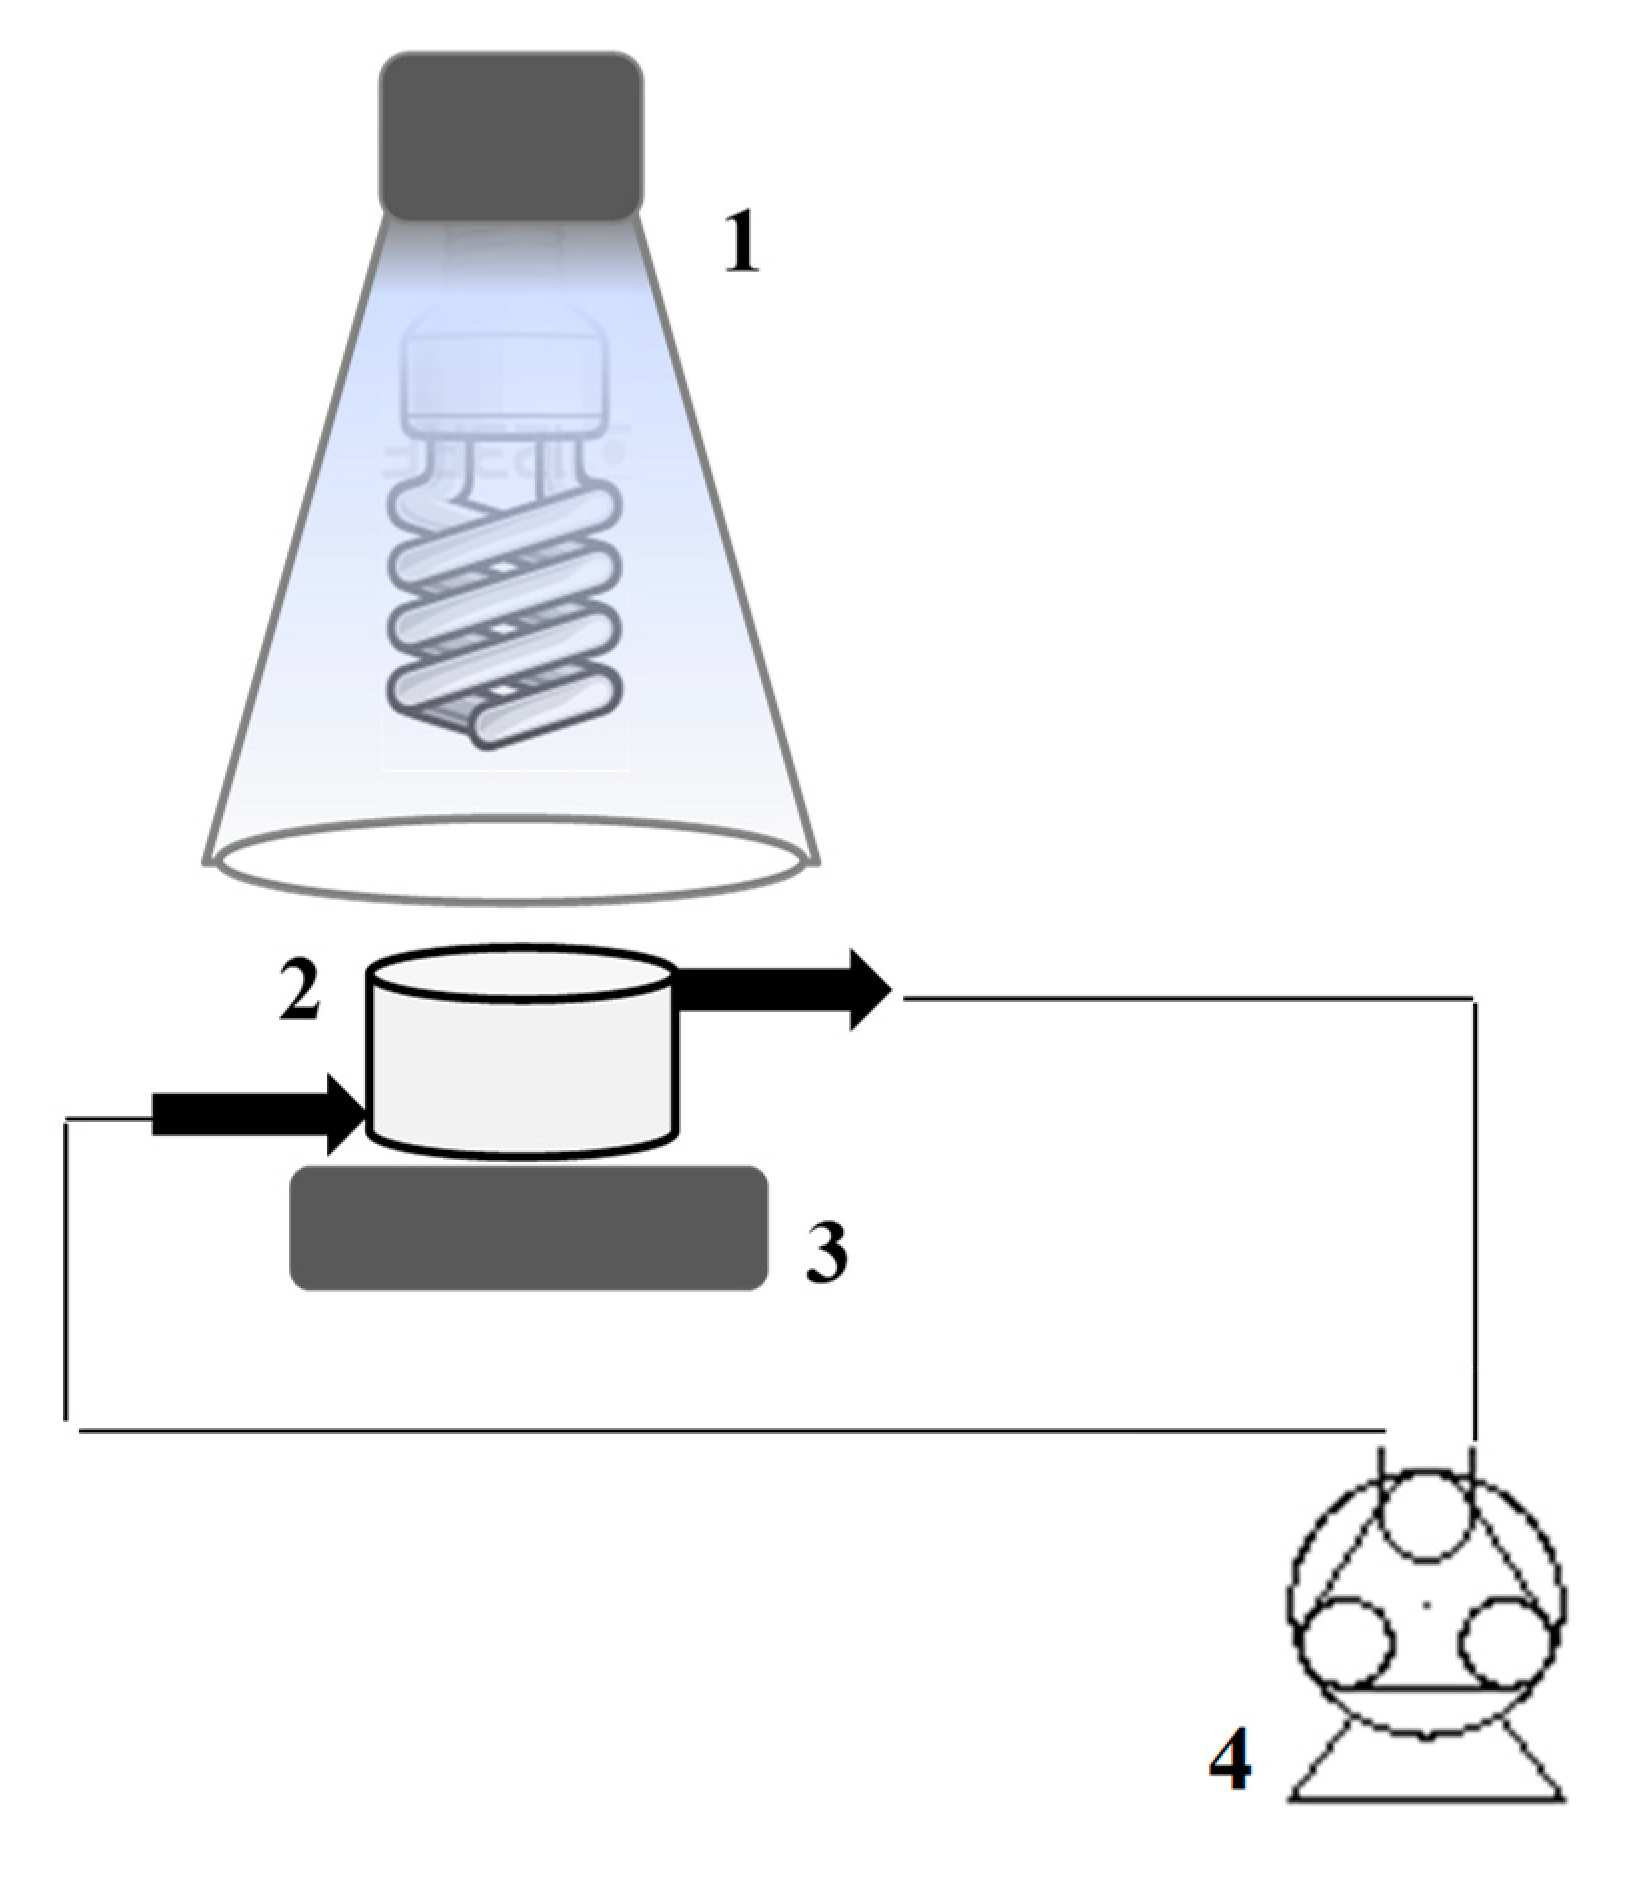
3.3. Photocatalytic Experiments

The photocatalytic activities of the prepared Ag-doped TiO2 photocatalysts were evaluated in terms of degradation of salicylic acid (SA) under solar and visible light. Salicylic acid (p.a. grade) was obtained as a free-of-charge sample from pharmaceutical industry Pliva in Croatia and used without further purification. The aqueous solution of 0.2 mmol L−1 of SA was prepared with distilled water and pH 4 of the solution was measured. Photocatalytic experiments were performed in a flow cell (Figure 8) using a peristaltic pump set at a constant flow rate of 67 mL min−1. Prior to irradiation, photocatalysts (1 g L−1) were suspended in 40 mL of SA solution and homogenized in ultrasonic bath for 5 min and then recirculated in flow cell in the dark for 25 min to get an adsorption/desorption equilibrium. Total sorption time in dark was presented with grey area in Figure 7a,b. During photocatalytic experiments the flow cell was directly irradiated. The sources of irradiation were: (i) full-spectrum compact fluorescent bulb simulating solar spectra with enhanced UV-B irradiation (Exo Terra, 26 W) and (ii) incandescent bulb emitting only visible light (Osram Daylight, 100 W, IUV-B = IUV-A = 0.0 mW cm−2). All experiment were done under ambient conditions: T = 25 ± 2 °C.
The full-spectrum solar bulbs were used to simulate the solar irradiation. Relative intensities over a range of wavelengths from 340 to 640 nm corresponded to the intensities of natural sunlight averaged around in year on northern hemisphere (~45° N). The UV-B intensity of a lamp was slightly higher, mimicking the dessert sunlight. In the case of full-spectrum solar bulb, the overall intensities in UV-B and UV-A region were measured by UVP UVX radiometer, fitted with the corresponding sensors. Given intensities on the cell top (suspension level) were: IUV-B = 2.9 mW cm−2 and IUV-A= 3.4 mW cm−2. At given time intervals the SA concentration was analyzed using HPLC, Shimadzu, with SUPELCO C18 column, length 250 mm, internal diameter 4.6 mm and UV (diode array) detection (DAD) at 303 nm. The analyses were carried out by binary flow elution with mobile phase solvents A and B at a flow rate of 0.6 and 0.4 mL min−1, respectively. Solvent A consisted of 0.5:99.5 (v/v) methanol: 0.1 M phosphoric acid and solvent B was 100% methanol. Experiments were done in triplicated and average results were reported.

4. Conclusions

In this work, a series of Ag@TiO2 photocatalysts were prepared by five different synthetic pathways based on deposition–precipitation, photoreduction, photochemical deposition, and reduction in chitosan biogel. The synthesized photocatalysts were characterized by the means of XRD, Raman spectroscopy, TEM, HRTEM, EDXS, SAED, and UV-vis DRS and their photocatalytic activity was determined using salicylic acid as a model pollutant, chosen due to its persistent presence in the environment.
It was observed that the solar and visible photocatalytic activity of obtained photocatalysts strongly depends on the preparation methods. The rate of photocatalytic degradation of salicylic acid with all used photocatalyst is quite high when solar light was applied and less than half an hour is needed for its half-degradation. Ag@TiO2 prepared by a simple novel method based on reduction of Ag on TiO2 surface in chitosan biogel (sample S3) seems to be the most promising photocatalyst under solar irradiation (about 20% more efficient than TiO2) and deserves further attention. Although the activity under visible irradiation was the same for samples S2 and S3, the synthesis of S3 via chitosan is simple one-pot green synthesis readily available for large-scale production of photocatalysts.
Observed photocatalytic behavior of S3 could be explained by the fact that TiO2 lattice of this photocatalyst contains somewhat higher atomic percentage of silver that form additional energy level in band gap region of TiO2. On the other hand, the presence of Ag nanoparticle on TiO2 surface and inside the pores enhances the absorption in visible part of spectra and suppresses the electron–hole recombination and increase photoactivity. The contribution of Ag in the surface redox reaction was confirmed by spontaneous photochromism of a sample. The study confirmed that only visible part of solar spectra could alone induce the photocatalytic reaction, which is promising from the practical point of view: such catalysts could be used for outdoor applications in areas with lower daily solar irradiance.

Author Contributions

Conceptualization, I.G. and A.G.; validation, A.G. and H.I.; investigation, K.Š., I.G., M.P., and A.G.; resources, I.G., H.I., and A.G.; data curation, I.G., K.Š., and M.-G.W.; writing—original draft preparation, I.G. and A.G.; writing—review and editing, I.G. and A.G.; visualization, I.G.; supervision, A.G. and M.-G.W.; funding acquisition, I.G., A.G. All authors have read and agreed to the published version of the manuscript.

Funding

This research was supported by European Regional Development Fund (ERDF) under the project “Waste & Sun for photocatalytic degradation of micropollutants in water” (OS-Mi), KK.01.1.1.04.0006., and by the Ministry of science and education of Croatia under the project HrZZ-IP-2018-01-5246. Authors acknowledge the Centre of Excellence for Advanced Materials and Sensing Devices, Ruđer Bošković Institute, Zagreb, Croatia, KK.01.1.1.01.0001 and partial support by European Regional Development Fund (ERDF) under the (IRI) project “Improvement of solar cells and modules through research and development” (KK.01.2.1.01.0115).

Conflicts of Interest

The authors declare no conflict of interest. The funders had no role in the design of the study; in the collection, analyses, or interpretation of data; in the writing of the manuscript, or in the decision to publish the results.

References

  1. Horáková, M.; Klementová, Š.; Kříž, P.; Balakrishna, S.K.; Špatenka, P.; Golovko, O.; Hájková, P.; Exnar, P. The synergistic effect of advanced oxidation processes to eliminate resistant chemical compounds. Surf. Coat. Technol. 2014, 241, 154–158. [Google Scholar] [CrossRef]
  2. Thiruvenkatachari, R.; Vigneswaran, S.; Moon, I.S. A review on UV/TiO2 photocatalytic oxidation process. Korean J. Chem. Eng. 2008, 25, 64–72. [Google Scholar] [CrossRef]
  3. Wols, B.A.; Hofman-Caris, C.H.M. Review of photochemical reaction constants of organic micropollutants required for UV advanced oxidation processes in water. Water Res. 2012, 46, 2815–2827. [Google Scholar] [CrossRef] [PubMed]
  4. Chong, M.N.; Jin, B.; Chow, C.W.; Saint, C. Recent developments in photocatalytic water treatment technology: A review. Water Res. 2010, 44, 2997–3027. [Google Scholar] [CrossRef]
  5. Nageswara Rao, A.; Sivasankar, B.; Sadasivam, V. Kinetic study on the photocatalytic degradation of salicylic acid using ZnO catalyst. J. Hazard. Mater. 2009, 166, 1357–1361. [Google Scholar] [CrossRef]
  6. Lu, S.; Wu, D.; Wang, Q.L.; Yan, J.; Buekens, A.G.; Cen, K.F. Photocatalytic decomposition on nano-TiO2: Destruction of chloroaromatic compounds. Chemosphere 2011, 82, 1215–1224. [Google Scholar] [CrossRef]
  7. Malato, S.; Fernández-Ibáñez, P.; Maldonado, M.I.; Blanco, J.; Gernjak, W. Decontamination and disinfection of water by solar photocatalysis: Recent overview and trends. Catal. Today 2009, 147, 1–59. [Google Scholar] [CrossRef]
  8. Parsons, S. Advanced Oxidation Processes for Water and Wastewater Treatment; IWA Publishing: London, UK, 2005. [Google Scholar] [CrossRef]
  9. Nakata, K.; Fujishima, A. TiO2 photocatalysis: Design and applications. J. Photochem. Photobiol. C Photochem. Rev. 2012, 13, 169–189. [Google Scholar] [CrossRef]
  10. Aazam, E.S. Visible light photocatalytic degradation of thiophene using Ag–TiO2/multi-walled carbon nanotubes nanocomposite. Ceram. Int. 2014, 40, 6705–6711. [Google Scholar] [CrossRef]
  11. Mohamed, R.M.; Baeissa, E.S. Preparation and characterisation of Pd–TiO2–hydroxyapatite nanoparticles for the photocatalytic degradation of cyanide under visible light. Appl. Catal. A Gen. 2013, 464–465, 218–224. [Google Scholar] [CrossRef]
  12. Suwanchawalit, C.; Wongnawa, S.; Sriprang, P.; Meanha, P. Enhancement of the photocatalytic performance of Ag-modified TiO2 photocatalyst under visible light. Ceram. Int. 2012, 38, 5201–5207. [Google Scholar] [CrossRef]
  13. Guo, J.-F.; Ma, B.; Yin, A.; Fan, K.; Dai, W.L. Highly stable and efficient Ag/AgCl@TiO2 photocatalyst: Preparation, characterization, and application in the treatment of aqueous hazardous pollutants. J. Hazard. Mater. 2012, 211–212, 77–82. [Google Scholar] [CrossRef] [PubMed]
  14. Bhosale, R.R.; Pujari, S.R.; Muley, G.G.; Patil, S.H.; Patil, K.R.; Shaikh, M.F.; Gambhire, A.B. Solar photocatalytic degradation of methylene blue using doped TiO2 nanoparticles. Solar Energy 2014, 103, 473–479. [Google Scholar] [CrossRef]
  15. Deng, Q.R.; Xia, X.H.; Guo, M.L.; Gao, Y.; Shao, G. Mn-doped TiO2 nanopowders with remarkable visible light photocatalytic activity. Mater. Lett. 2011, 65, 2051–2054. [Google Scholar] [CrossRef]
  16. Chang, S.; Liu, W. The roles of surface-doped metal ions (V, Mn, Fe, Cu, Ce, and W) in the interfacial behavior of TiO2 photocatalysts. Appl. Catal. B Environ. 2014, 156–157, 466–475. [Google Scholar] [CrossRef]
  17. McManamon, C.; Delaney, P.; Morris, M.A. Photocatalytic properties of metal and non-metal doped novel sub 10nm titanium dioxide nanoparticles on methyl orange. J. Colloid Interface Sci. 2013, 411, 169–172. [Google Scholar] [CrossRef]
  18. Ghasemi, S.; Esfandiar, A.; Setayesh, S.R.; Habibi-Yangjeh, A.; Gholami, M.R. Synthesis and characterization of TiO2–graphene nanocomposites modified with noble metals as a photocatalyst for degradation of pollutants. Appl. Catal. A Gen. 2013, 462–463, 82–90. [Google Scholar] [CrossRef]
  19. Suwarnkar, M.B.; Dhabbe, R.S.; Kadam, A.N.; Garadkar, K.M. Enhanced photocatalytic activity of Ag doped TiO2 nanoparticles synthesized by a microwave assisted method. Ceram. Int. 2014, 40, 5489–5496. [Google Scholar] [CrossRef]
  20. Vargas, E.; Vargas, R.; Núñez, O. A TiO2 surface modified with copper(II) phthalocyanine-tetrasulfonic acid tetrasodium salt as a catalyst during photoinduced dichlorvos mineralization by visible solar light. Appl. Catal. B Environ. 2014, 156–157, 8–14. [Google Scholar] [CrossRef]
  21. Hu, C.; Lan, Y.; Qu, J.; Hu, X.; Wang, A. Ag/AgBr/TiO2 Visible Light Photocatalyst for Destruction of Azodyes and Bacteria. J. Phys. Chem. B 2006, 110, 4066–4072. [Google Scholar] [CrossRef]
  22. Twu, Y.-K.; Chen, Y.-W.; Shih, C.-M. Preparation of silver nanoparticles using chitosan suspensions. Powder Technol. 2008, 185, 251–257. [Google Scholar] [CrossRef]
  23. PubChem. Available online: https://pubchem.ncbi.nlm.nih.gov/compound/Salicylic-acid (accessed on 15 May 2020).
  24. Gajović, A.; Furić, K.; Tomašić, N.; Popović, S.; Skoko, Ž.; Musić, S. Mechanochemical preparation of nanocrystalline TiO2 powders and their behavior at high temperatures. J. Alloys Compd. 2005, 398, 188–199. [Google Scholar] [CrossRef]
  25. Kortüm, G. Reflectance Spectroscopy; Springer: Berlin, Germany, 1969. [Google Scholar]
  26. Yu, J.; Kudo, A. Effects of Structural Variation on the Photocatalytic Performance of Hydrothermally Synthesized BiVO4. Adv. Funct. Mater. 2006, 16, 2163–2169. [Google Scholar] [CrossRef]
  27. Ohko, Y.; Tatsuma, T.; Fujii, T.; Naoi, K.; Niwa, C.; Kubota, Y.; Fujishima, A. Multicolour photochromism of TiO2 films loaded with silver nanoparticles. Nat. Mater. 2003, 2, 29–31. [Google Scholar] [CrossRef]
  28. Kazuma, E.; Tatsuma, T. Photoinduced reversible changes in morphology of plasmonic Ag nanorods on TiO2 and application to versatile photochromism. Chem. Commun. R. Soc. Chem. 2012, 48, 1733–1735. [Google Scholar] [CrossRef]
  29. Gong, H.M.; Xiao, S.; Su, X.R.; Han, J.B.; Wang, Q.Q. Photochromism and two-photon luminescence of Ag-TiO2 granular composite films activated by near infrared ps/fs pulses. Opt. Express 2007, 15, 13924–13929. [Google Scholar] [CrossRef]
  30. Herrmann, J.-M.; Tahiri, H.; Ait-Ichou, Y.; Lassaletta, G.; Gonzalez-Elipe, A.R.; Fernandez, A. Characterization and photocatalytic activity in aqueous medium of TiO2 and Ag-TiO2 coatings on quartz. Appl. Catal. B Environ. 1997, 13, 219–228. [Google Scholar] [CrossRef]
  31. Temgire, M.K.; Joshi, S.S. Optical and structural studies of silver nanoparticles. Radiat. Phys. Chem. 2004, 71, 1039–1044. [Google Scholar] [CrossRef]
  32. Hasmath Farzana, M.; Meenakshi, S. Photocatalytic aptitude of titanium dioxide impregnated chitosan beads for the reduction of Cr(VI). Int. J. Biol. Macromol. 2015, 72, 1265–1271. [Google Scholar] [CrossRef]
  33. Kochuveedu, S.T.; Jang, Y.H.; Kim, D.H. A study on the mechanism for the interaction of light with noble metal-metal oxide semiconductor nanostructures for various photophysical applications. Chem. Soc. Rev. 2013, 42, 8467–8493. [Google Scholar] [CrossRef]
  34. DAmato, C.A.; Giovannetti, R.; Zannotti, M.; Rommozzi, E.; Ferraro, S.; Seghetti, C.; Minicucci, M.; Gunnella, R.; Di Cicco, A. Enhancement of visible-light photoactivity by polypropylene coated plasmonic Au/TiO2 for dye degradation in water solution. Appl. Surf. Sci. 2018, 441, 575–587. [Google Scholar] [CrossRef]
  35. Grčić, I.; Papić, S.; Brnardić, I. Photocatalytic Activity of TiO2 Thin Films: Kinetic and Efficiency Study. Int. J. Chem. React. Eng. 2017, 16, 20160153. [Google Scholar] [CrossRef]
Figure 1. X-ray diffraction (XRD) powder patterns of prepared Ag modified TiO2 photocatalysts compared to original TiO2 P25 (a): S1a–c from bottom to top (b), S2 (c), and S3 (d).
Catalysts 10 00763 g001
Figure 2. (a) Raman spectra of the starting samples before photocatalytic reactions: sample S2, and sample S3 compared to TiO2 P25. (b) Comparison of Raman spectra of the sample S2 before photo-catalytic reaction (denoted by S2), after the reactions using simulated sunlight (i) and after reaction using only visible part of the spectrum (ii). (c) Comparison of Raman spectra of the sample S3 before photo-catalytic reaction (denoted by S3), after the reactions using simulated sunlight (i) and after reaction using only visible part of the spectrum (ii).
Catalysts 10 00763 g002
Figure 3. Sample S2: TEM (a) and high resolution transmission electron microscopy (HRTEM) (b) images before photo-catalytic reaction, TEM (c) and HRTEM (d) images after photo-catalytic reaction using only visible part of the spectra, TEM (e) and HRTEM (f) images after photo-catalytic reaction using sun light, energy dispersive X-ray spectroscopy (EDXS) of the sample after photo-catalytic reaction using both visible irradiation and sun light (g) SAED of the sample after photo-catalytic reaction using sun light (h).
Catalysts 10 00763 g003
Figure 4. Sample S3: TEM (a) and HRTEM (b) images before photo-catalytic reaction, TEM (c) and HRTEM (d) images after photo-catalytic reaction using only visible part of the spectra, TEM (e) and HRTEM (f) images after photo-catalytic reaction using sun light, EDXS of the sample after photo-catalytic reaction using sun light (g), SAED of the sample before photo-catalytic reaction (h).
Catalysts 10 00763 g004
Figure 5. UV–Vis diffuse-reflectance spectra of prepared Ag@TiO2 photocatalysts S1c, S2, and S3.
Catalysts 10 00763 g005
Figure 6. S3 sample after few weeks under ambient conditions (1), initial white color of S3 sample return after shaking (2).
Catalysts 10 00763 g006
Figure 7. Kinetics and efficiency of photocatalytic degradation of salicylic acid (SA) under full-spectrum solar irradiation (a) and visible irradiation (b) using TiO2 P25 and Ag@TiO2 photocatalysts under given conditions. The grey areas represent the dark period prior reaction, i.e., time necessary to achieve sorption equilibrium.
Catalysts 10 00763 g007
Figure 8. Scheme of the experimental set-up used for the photocatalytic degradation experiments; 1—irradiation source with reflective surface, 2—photocatalytic cell (dcell = 45 mm, reaction mixture level = 24 mm), 3—magnetic stirrer, and 4—peristaltic pump.
Catalysts 10 00763 g008
Table 1. Band gaps of investigated samples calculated from UV-Vis measurements using formula [F(R) × hυ]1/2 [26].
SampleEg1 (eV)Eg2 (eV)
S1c2.861.19
S22.861.18
S32.981.19
Table 2. The pseudo-first order rate constant (kSA,obs) for the degradation of SA in the flow cell irradiated with simulated solar and visible irradiation.
SampleFull-Spectrum Solar IrradiationVisible Irradiation
kSA,obs (× 103 min−1)t1/2 (min)R2kSA,obs (× 103 min−1)t1/2 (min)R2
TiO2P2522.215–300.97180.838350.9680
S1c25.30.96460.0032310490.9168
S233.40.91252.432850.9568
S335.00.93302.412870.9127

