Article

Preparation of CdS Nanoparticles-TiO2 Nanorod Hererojunction and Their High-Performance Photocatalytic Activity

1
School of New Energy Science and Engineering, Xinyu University, Xinyu 338004, China
2
College of Environment and Chemical Engineering, Nanchang Hangkong University, Nanchang 330063, China
3
Shandong Key Laboratory of Chemical Energy Storage and Novel Cell Technology, Liaocheng University, Liaocheng 252059, China
4
State Key Laboratory of Environmental Criteria and Risk Assessment, Chinese Research Academy of Environmental Sciences, Beijing 100012, China
*
Authors to whom correspondence should be addressed.
These authors contributed equally to this work.
Catalysts 2020, 10(4), 441; https://doi.org/10.3390/catal10040441
Submission received: 25 March 2020 / Revised: 15 April 2020 / Accepted: 17 April 2020 / Published: 19 April 2020
(This article belongs to the Special Issue Photocatalysis in the Wastewater Treatment)

Abstract

:
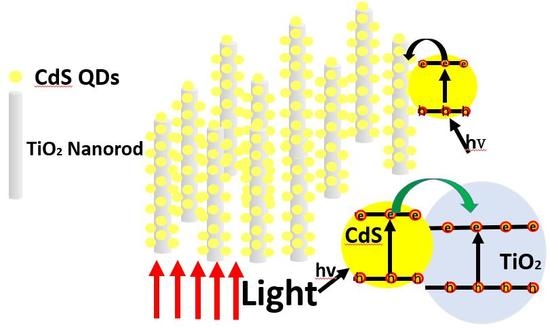
As a new and emerging technology, photocatalytic oxidation is widely used in the fields of sewage treatment and organic pollution control. In this study, CdS nanoparticles were prepared at room temperature by an innovative preparation method, then TiO2 nanorod–CdS nanoparticle heterojunction photocatalysts were prepared using the solvothermal method, with TiCl3 used as the precursor for TiO2 nanorods. This study mainly took advantage of the small size of the CdS nanoparticles in combination with TiO2 nanorods, and the resultant heterojunctions had large specific surface areas, thereby increasing the contact area between the catalysts and the contaminants. In addition, due to the lower band gap energy (2.4 eV) of CdS, the photo response range of the heterojunction photocatalysts was also increased. In an experimental study, through photocatalytic performance tests of the catalysts with different weight ratios, it was found that the TiO2(40%)@CdS composite had the best photocatalytic performance and the highest catalytic rate. BET, SEM, and other tests showed that the specific surface area of the TiO2(40%)@CdS composite was the largest. TiO2 nanorods and CdS particles were uniformly distributed in the composite, and the optical response range was extended to the visible light region.

Graphical Abstract

1. Introduction

The photocatalytic activity of titanium dioxide (TiO2) was discovered in 1972 [1]; since then, TiO2 as a novel photocatalytic material has attracted extensive attention. Many excellent characteristics have been discovered by researchers, such as its non-toxicity, non-polluting behavior, low cost, and high catalytic efficiency [2]. Because of these excellent properties, TiO2 is widely applied in various areas related to environmental protection [3,4,5,6,7]. For example, TiO2 has been used to treat wastewater that contains organic pollutants such as dyes, pesticides, and petroleum pollutants, and even waters containing heavy metal pollutants. Moreover, if TiO2 is prepared as a photocatalytic decontamination coating, the nitric oxide (NOx) in the atmosphere [8,9], sulfur oxide [10,11] and other pollutants such as halogenated hydrocarbons [12,13], aldehydes [14], and polycyclic aromatic hydrocarbons from automotive exhaust gas can be absorbed and degraded [15,16]. TiO2 also shows a good performance in light-sensitive solar cells [17] and biomedical devices [18]. In addition, nano-TiO2 has broad applications in many aspects such as sterilization, degradation, deodorization, self-cleaning and energy storage [19,20,21,22,23]. However, TiO2 has a bandgap of 3.2 eV, and can only respond to ultraviolet light, which only accounts for 5% of sunlight. Therefore, the red shift of the wavelength of the absorption wave via the modification of TiO2 is an important method for improving the photocatalytic performance of TiO2.
Therefore, many studies have been undertaken to build heterojunctions with specific morphologies and enhanced specific surface areas for extending the visible light absorption and, as a result, the photocatalytic activities of the heterojunctions were usually superior to that of bare TiO2. Kavil et al. fabricated a TiO2–CdS photocatalyst with nano heterostructures via the hydrothermal method and the catalyst TiO2–CdS 10, with 10 wt% CdS content, acquired a higher photocatalytic activity towards the degradation of methyl orange (MO) than that of the bare TiO2 [24]. Yang et al. prepared CdS/TiO2 heterojunctions with porous structures, which exhibited enhanced catalytic degradation capacity towards organic dyes including Methyl Orange (MO) and Rhodamine B (RhB)—in particular, the degradation rate of MO reached 95% in 120 min [25]. Furthermore, more recently, a hydrolysis–hydrothermal calcined method was proposed for the synthesis of three-dimensional porous CdS/TiO2, which displayed high activity in the degradation process of MO under visible light [26]. The photocatalytic activities of the CdS/TiO2 heterojunctions are influenced by many factors including the crystal composition, the micromorphology, the specific surface area, the band gap and the energy levels, etc. However, the catalytic activity of these catalysts is not satisfactory, and there is still a high demand for the improvement of the catalytic activity through the optimization of the synthesis methods [27,28].
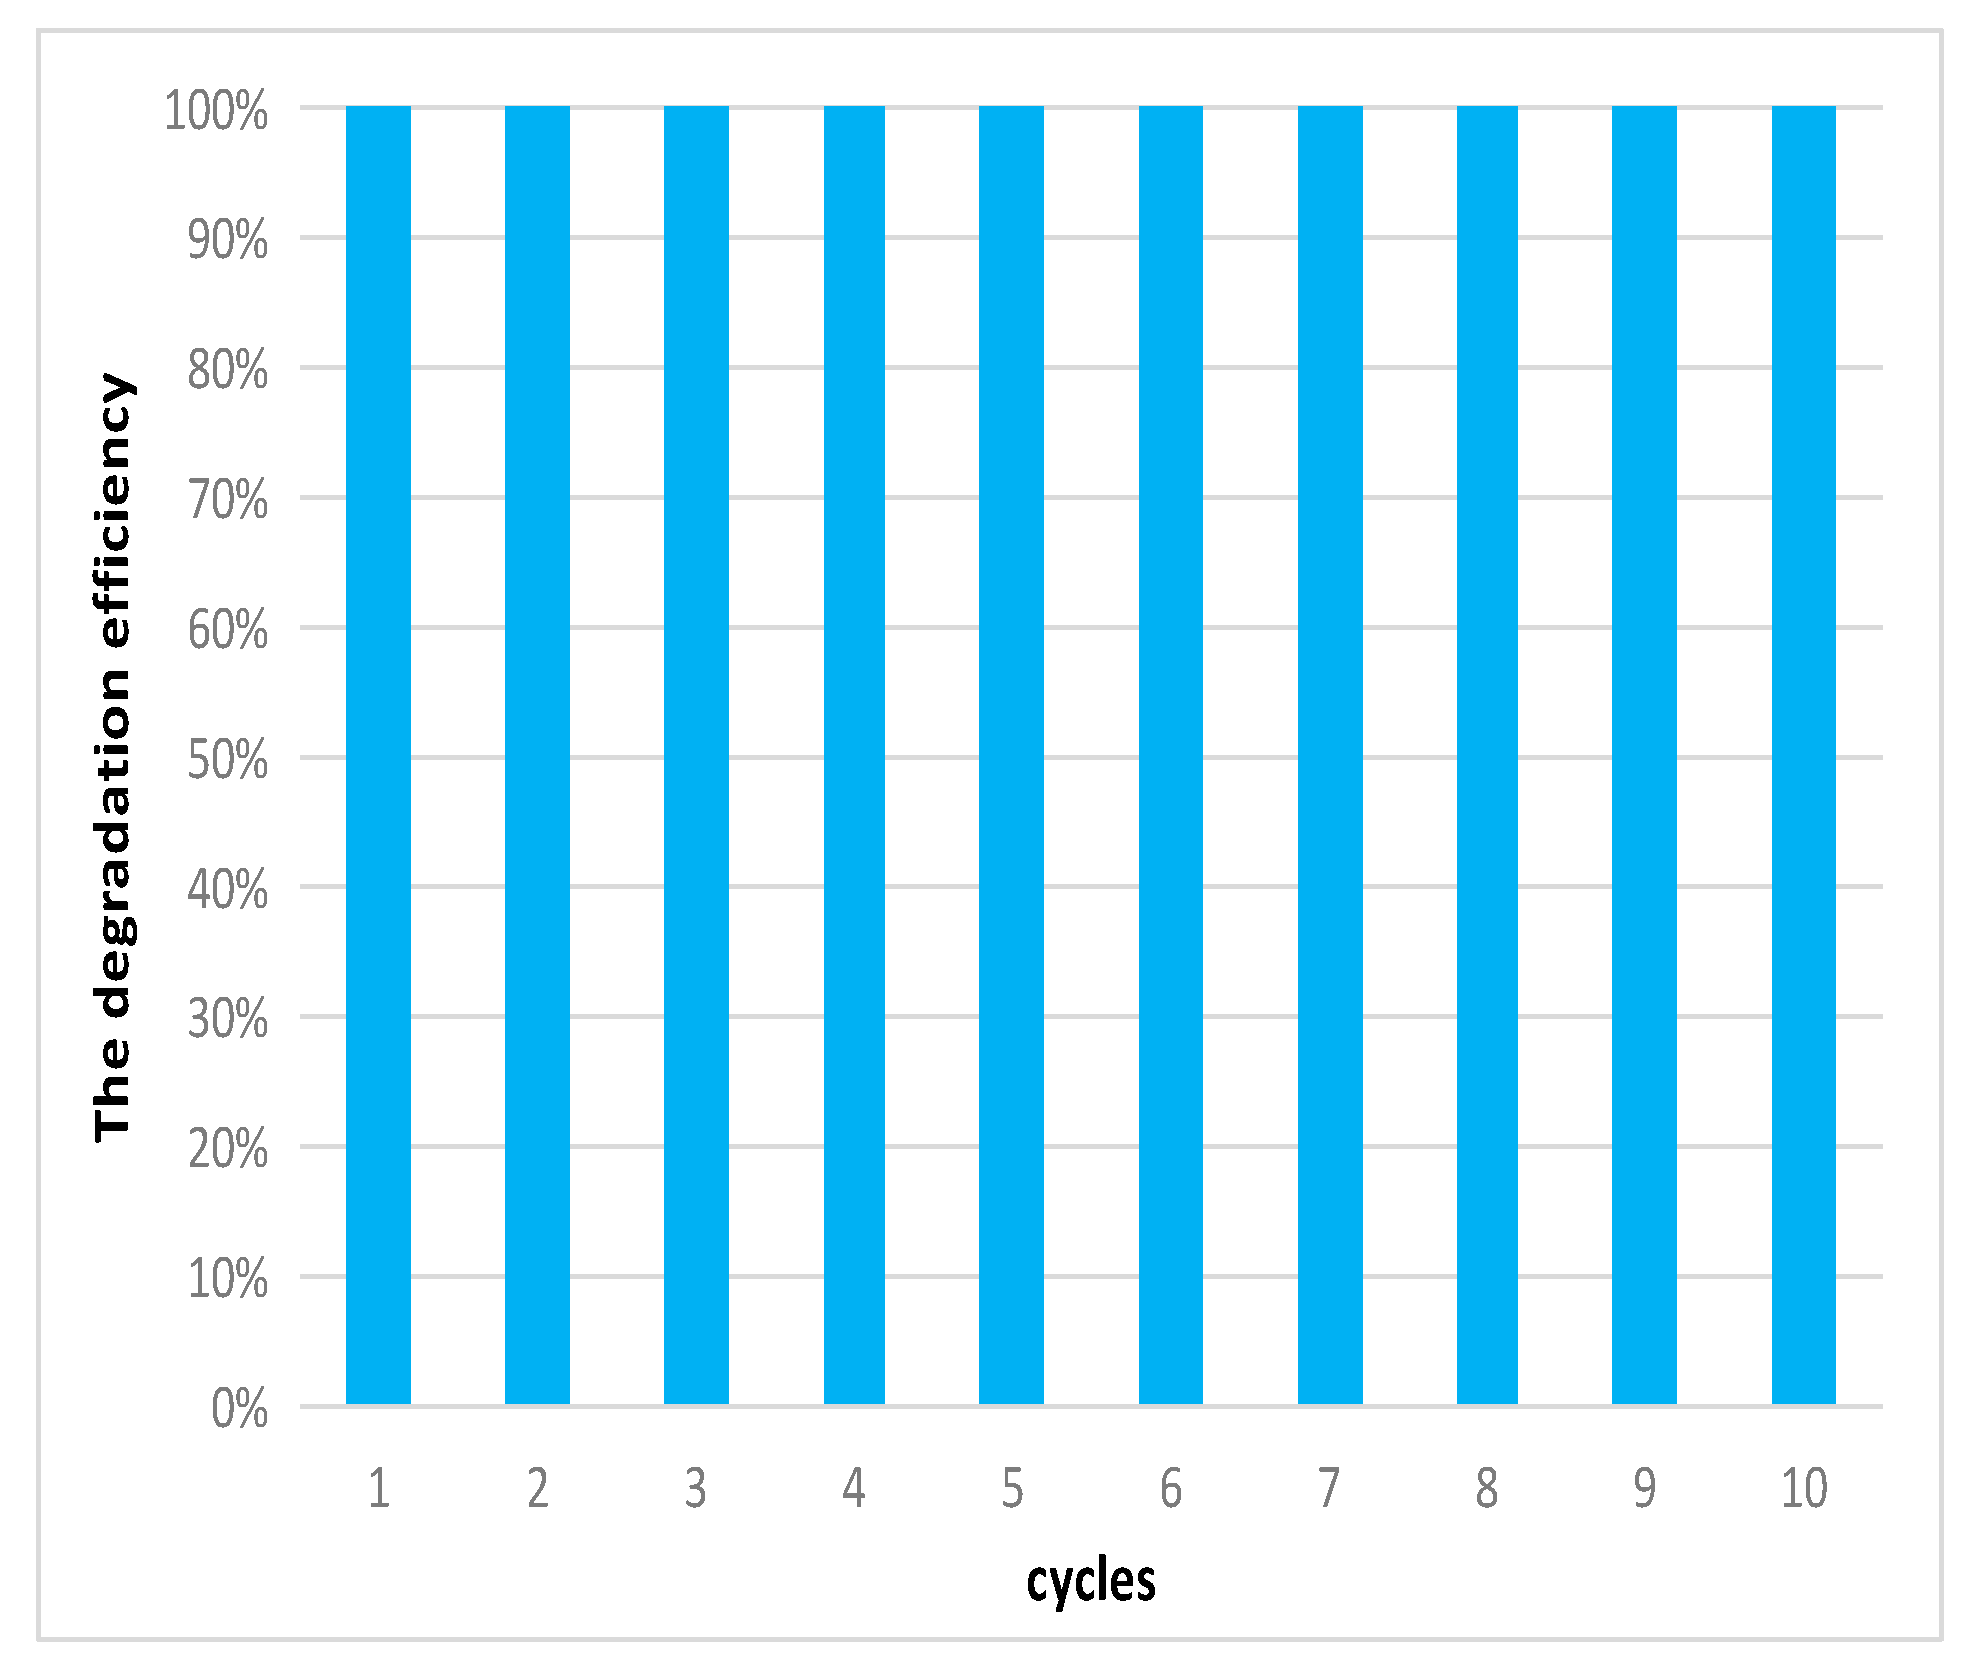
This paper describes the preparation of a heterojunction catalyst consisting of TiO2 nanorods with CdS nanoparticles. Because of the unstable chemical properties of CdS, it is difficult to prepare nanoparticles at high temperatures. In this study, an innovative preparation method was introduced to successfully prepare CdS nanoparticles by adjusting the rate of CdS precipitation at room temperature. A composite of TiO2 nanorods and CdS nanoparticles was prepared in the presence of a surfactant from CdS nanoparticles and TiCl3 by the solvothermal method. The CdS nanoparticle has a lower bandgap of 2.4 eV, as well as a smaller size, which has a compatible energy level with that of TiO2. In the present study we prepared the TiO2 nanorod/CdS nanoparticle heterojunction photocatalyst with excellent photocatalytic performance. Methyl orange solution could be completely degraded by the prepared catalyst within 40 min. It maintained a high recycling performance with the repeated degradation of methyl orange over 10 times, with the degradation rate remaining at 100%.

2. Results and Discussion

2.1. Surface Morphology Characterization

SEM images showed that there were connected nanoparticles on the surface of the TiO2(20%)@CdS composite material, with a weight content of 20% TiO2. These particles were likely to be TiO2 or CdS nanoparticles. No nanorod structure was formed and the accumulation between nanoparticles was strong (Figure 1a), resulting in its low specific surface area. In the composites of TiO2(30%)@CdS, nanoparticles were partially attached on the surface of the nanorods and aggregated with each other to form nanoparticle agglomerates (Figure 1b).This showed that there were nanorods in the composite, but with a more obvious accumulation. In Figure 1c, for the TiO2(40%)@CdS composite, the rod-like structure and the granular material were uniformly integrated. The configuration of the composite nanorods was symmetrical, the length was homogenous, and the size of the nanoparticles was uniform, and there were good recombinations between TiO2 nanorods and CdS nanoparticles. Figure 1d verified that the agglomeration of the TiO2(50%)@CdS composite was very obvious, and many large particle agglomerates were observed.
TEM images demonstrated that the coexistence of nanoparticles and nanorods was found on the TiO2(40%)@CdS composite (Figure 2a), in which CdS nanoparticles were uniformly distributed on the surface TiO2 nanorods (Figure 2b). TEM images clearly showed that the morphology of TiO2 is nanorods with a length and width of 200 nm and 20 nm, respectively. The form of CdS is nanoparticles with the length ranging from 10 nm to 30 nm. HRTEM images (Figure 2c–d) indicated that the TiO2 nanorods were the anatase type, which can be concluded due to the lattice fringe of the HRTEM image, where a lattice distance of 0.346 nm corresponds with the {001}crystal face of anatase. The CdS nanoparticles were the wurtzite type. The distance between the crystal faces was 0.35 nm, obtained by the lattice fringe of the HRTEM image, which agrees with the {002} crystal face of wurtzite. More importantly, CdS nanoparticles were loaded on the TiO2 nanorods, resulting in a structure which is similar to an interface.
In summary, among the as-prepared nano-composites, TiO2(30%)@CdS and TiO2(40%)@CdS composites were successfully prepared, but there were differences in the shape and size of the composites. The difference could be further confirmed from the diversified performance of the photocatalytic properties of the composites in the following dye degradation experiments.

2.2. Crystal Structure Characterization

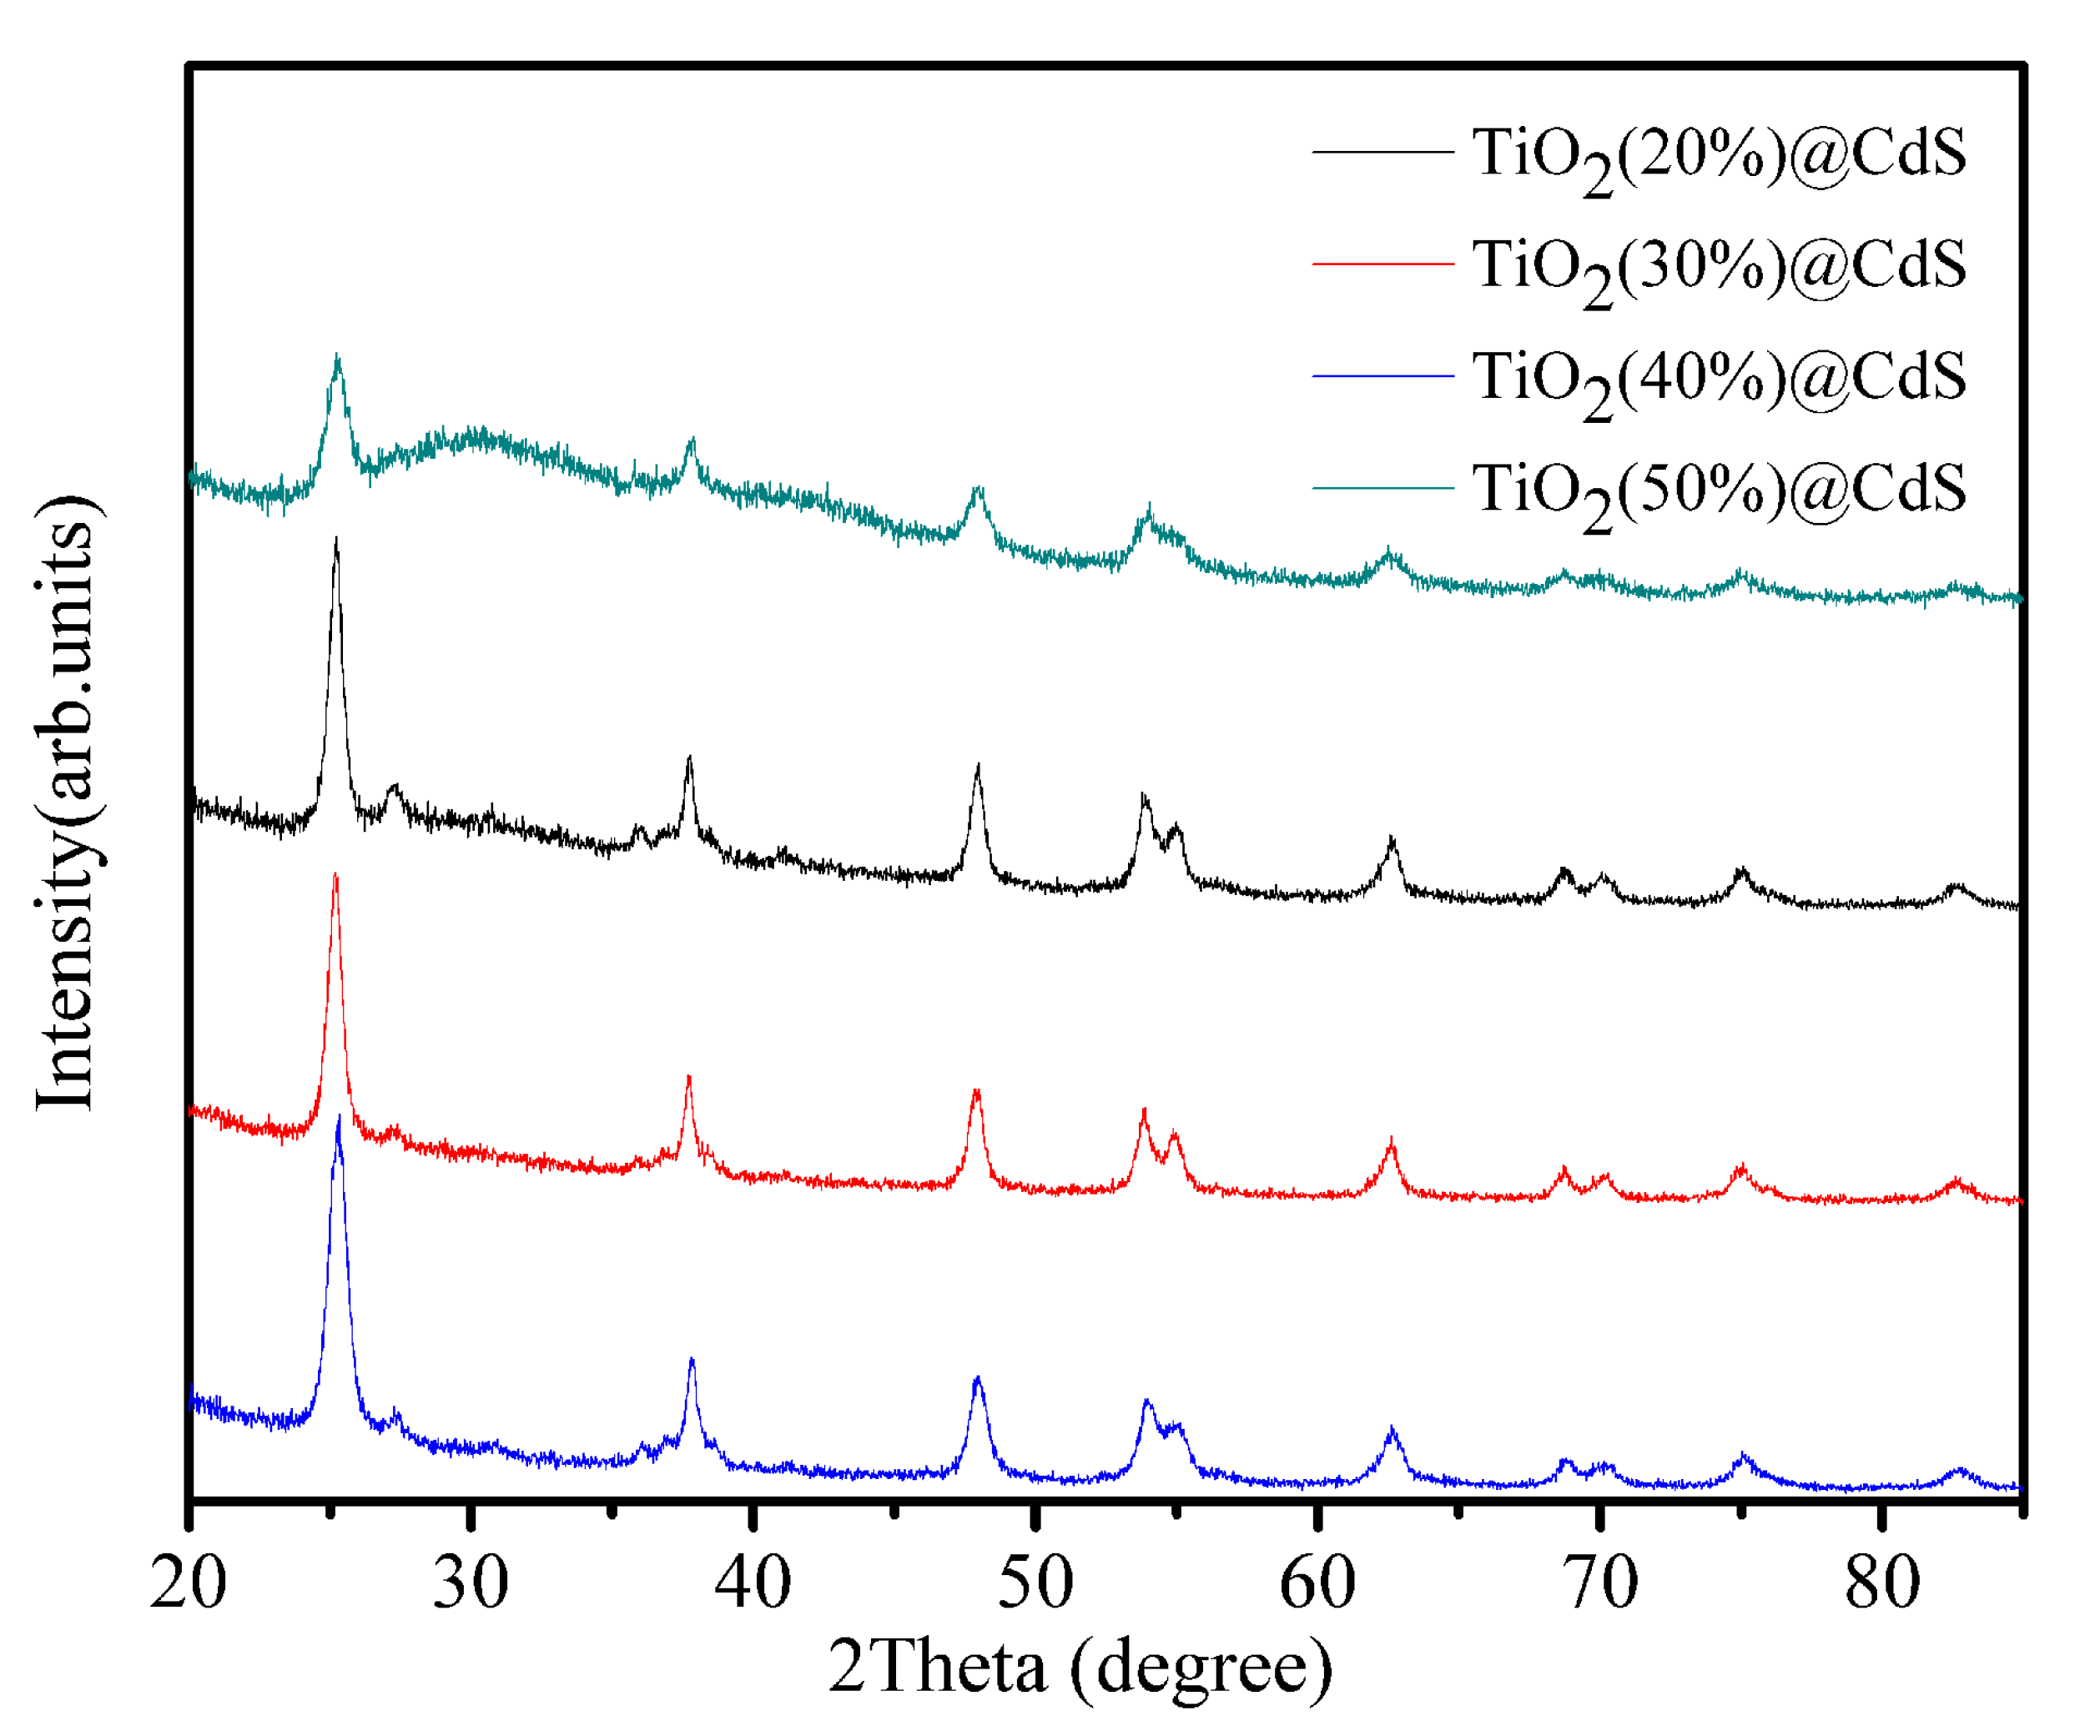
As can be seen from Figure 3, all the composites with different TiO2 percentage concentrations have the same series of characteristic peaks corresponding to the two-theta angles 25.13°, 25.30°, 36.05°, 37.89°, 40.93°, 47.82°, 53.87°, 55.05°, 62.61°, 68.83°, 70.52°, and 75.00°. According to the XRD standard spectrum line of cadmium sulfide crystals [29], there are three characteristic peaks and their respective two-theta angles are 25.05° (100), 47.98° (103) and 52.13° (220), respectively. However, according to the XRD standard spectrum line of titanium dioxide, there are more corresponding peaks. These characteristic peaks have their corresponding two-theta angles at 27.51° (110), 36.06° (101), 39.23° (201), 54.33° (211), 56.69° (220), 62.77° (002), 69.04° (221), 69.90° (307). According to these existing characteristic peaks of TiO2, there are two kinds of crystal types of titanium dioxide, including the anatase crystal form and the rutile crystal form. The anatase crystal form is dominant, and the rutile crystal form is of little importance. The sharpness of the XRD peaks reflects the degree of crystallinity of the crystals, the sharper the XRD peaks are, the better the crystallinity of the material is. Figure 3 shows that the crystallization effect of the TiO2 (50%)@CdS was the worst, and the crystal structure was classified as a looser type, which might be unfavorable for photocatalytic activity. The TiO2(40%)@CdS composite had a sharp peak in the XRD pattern with few impurity peaks, indicating that the crystalline state was better, which might explain the photocatalytic performance of the catalyst.
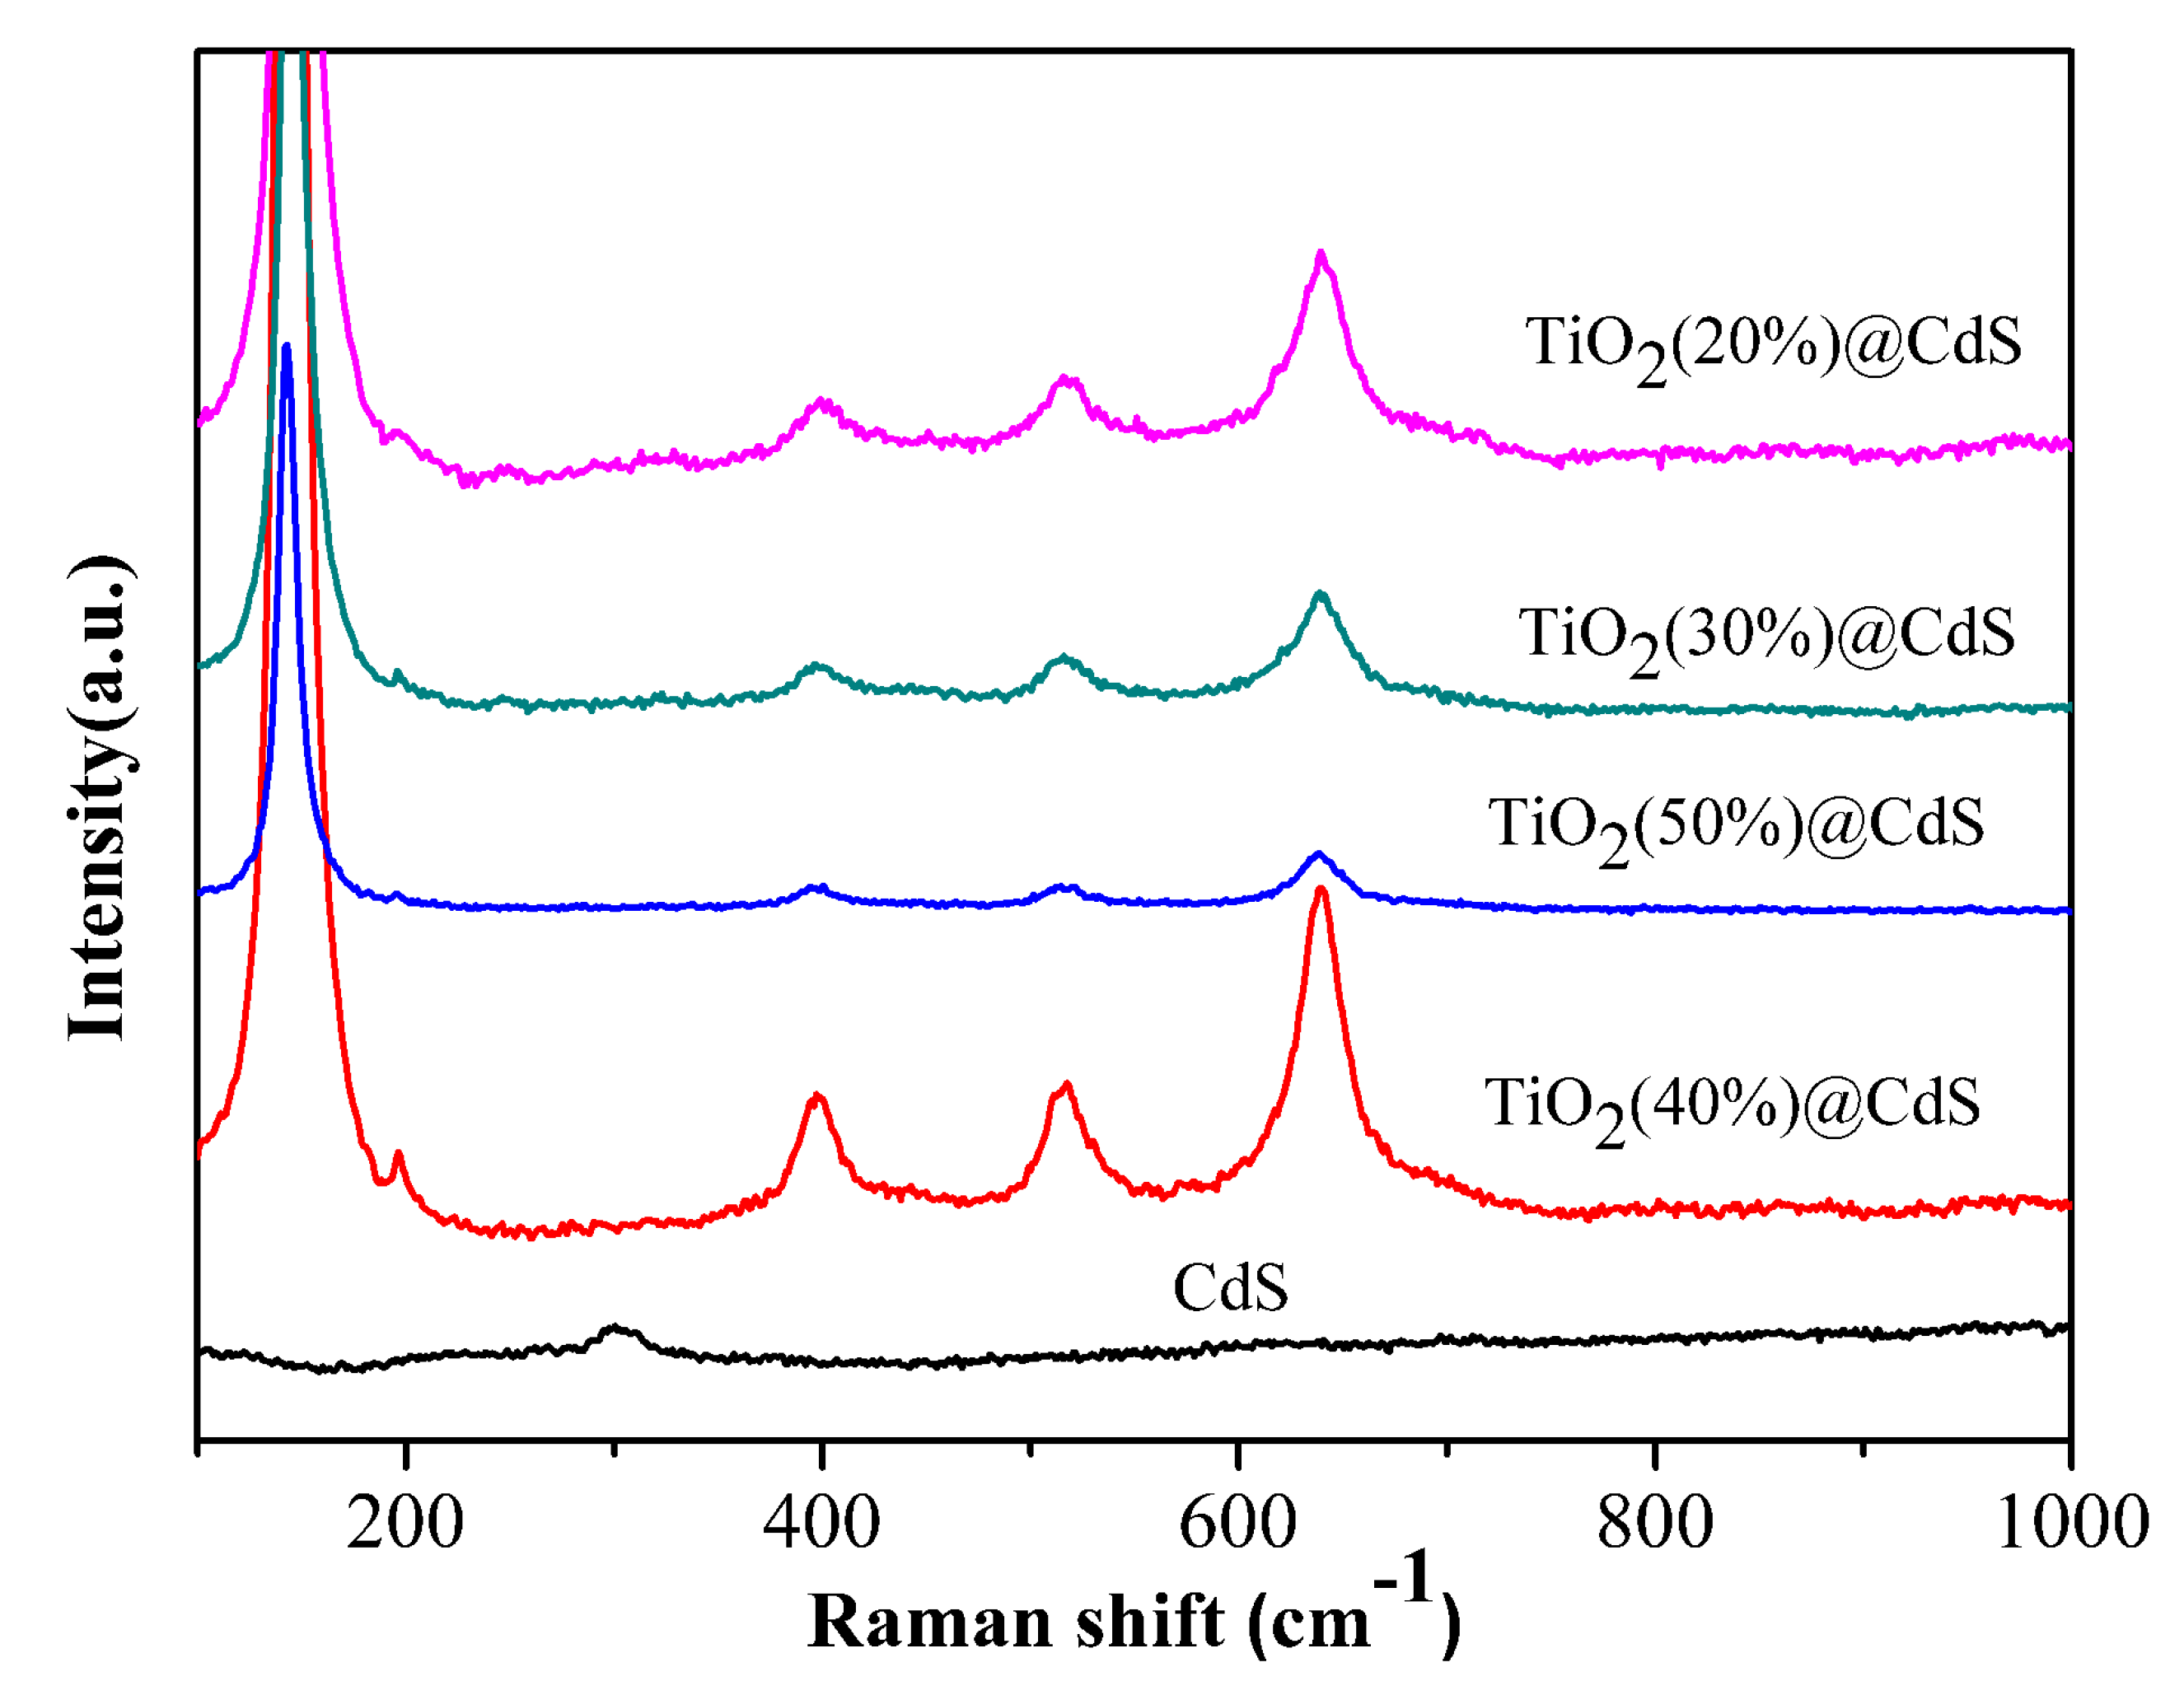
Figure 4 shows the FT–Raman spectroscopy of the TiO2 nanorod–CdS nanoparticle with different TiO2 contents. The peaks with Raman shifts at 135 cm−1, 396 cm−1, 515 cm−1, and 641 cm−1 represent the presence of rutile TiO2 (A1g + 2B1g + 31g) [30]. The peaks with Raman shifts at 300 cm−1, 600 cm−1, and 900 cm−1 are the characteristic Raman peaks of CdS nanoparticles [31]. It is apparent that the abovementioned peaks are all present and have the most high peak intensities for TiO2(40%)@CdS than that of other composites with other TiO2contents, which suggested that both of the TiO2 nanorods and CdS nanoparticles maintained their unique crystal structures and coexisted in the composite, which supports the exertion of their synergistic effect in photocatalytic degradation.

2.3. Test of Absorption Performance

For the CdS nanoparticle, the maximum wavelength of the absorption is located at 500 nm in the ultraviolet-visible diffuse reflectance spectrum; after that, the absorption curve drops sharply, and there is almost no absorption. The 2.11 eV of the bandgap energy for the CdS nanoparticle was obtained according to an onset absorption wavelength of 588 nm. Compared to the CdS bulk material (2.4 eV), the bandgap energy of the CdS nanoparticles was reduced due to the reduction in the particle sizes. However, when the wavelength was increased to more than 500 nm, the absorption effect sharply decreased, which is one of the reasons why it has limited practical applications. The onset absorption wavelengths of the TiO2 nanorod–CdS nanoparticle composites were 428 nm, 435 nm, 486 nm, and 442 nm, respectively, for the composites with 20%, 30%, 40% and 50% TiO2 contents. The corresponding bandgap energies were 2.89 eV, 2.85 eV, 2.55 eV and 2.81 eV, respectively. The absorption spectrum of the TiO2(40%)@CdS was maintained at a higher level on average, in the range of 400 nm to 780 nm wavelengths, which was better than other composites with 20%, 30%, and 50% TiO2 contents. Specifically, the above data suggest that the TiO2 (40%)@CdS composite was efficient as photocatalyst in visible and infrared regions. From the data in Figure 5, it was found that the formation of the composites that recombined with TiO2 nanorods and CdS nanoparticles enlarged the range for photo-absorption and, among them, the TiO2(40%)@CdS composite was the best light absorbent. Based on these results, it is reasonable to suggest that the composite has the best ability for the photocatalytic degradation of pollutants, such as organic dyes.

2.4. Photocurrent Test

From Figure 6, it can be seen that the photocurrent intensity of the CdS nanoparticle is the lowest, and the photocurrent is attenuated by more than half after 600 s, which suggests that the photocurrent stability of the CdS particles was the worst. Of all the composites, the TiO2(40%)@CdS composite had the highest photocurrent, which was followed by the composites with 30%, 50% and 20% TiO2 contents, respectively. As the illumination time increased to 400 s or more, the intensities of the photocurrents gradually became stable, then the approximate steady state of the photocurrent began to appear.
The speeds and intensities of the currents generated by the composites varied along with the variance in TiO2 contents. Figure 6 also shows that both the current generation speed and the magnitude of the photocurrent of the TiO2(30%)@CdS composite was slightly inferior to that of the TiO2(40%)@CdS composite. The reason for the above fact was that that the CdS nanoparticles did not bind tightly with the TiO2 nanorods. Furthermore, the photocurrent intensities of the TiO2(20%)@CdS and TiO2(50%)@CdS composites were much weaker than those of the composites of TiO2(30%)@CdS, which might be attributed to the lack of TiO2 nanorods in the structures, which make it difficult to form a tightly bound TiO2 nanorod–CdS nanoparticle [32]. As a result, this limited the further enhancement of the photocurrent performance.

2.5. BET Test

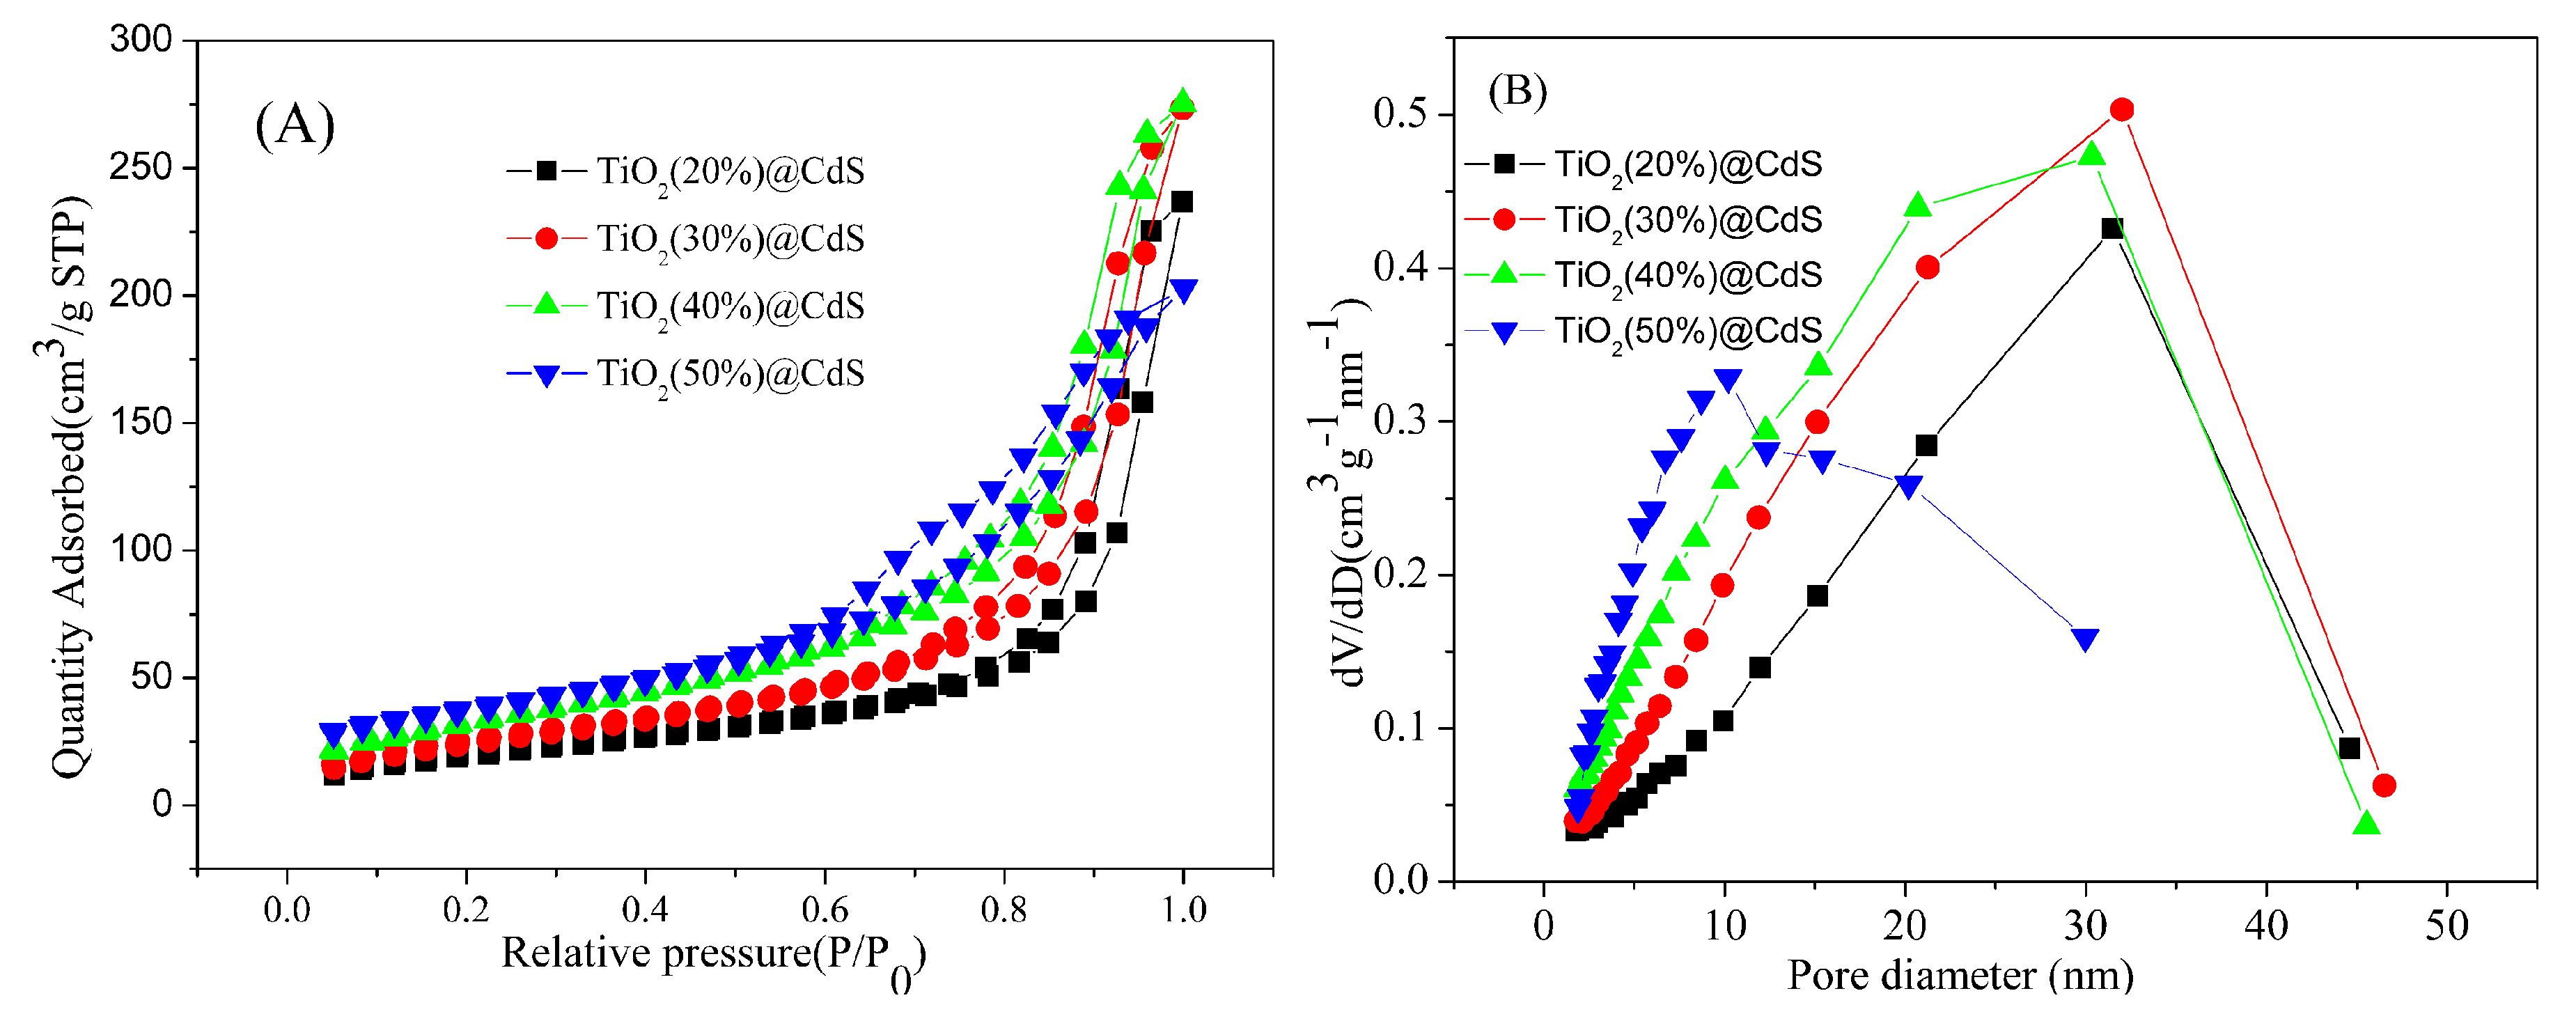
Figure 7 shows the N2 adsorption–desorption isothermal curves and pore size distribution of the TiO2 nanorod–CdS nanoparticle composites. From Figure 7A, it was observed that the nitrogen adsorption–desorption isotherms of TiO2(20%)@CdS and TiO2(50%)@CdS composites primarily adapted to the type IV isotherm line, which is often accompanied by the mesoporous capillary condensation phenomenon [33]. An isotherm curve was formed by the mesoporous solid and there were differences between the adsorption curve and the desorption curve, which meant that a hysteresis loop could be observed. According to the International Union of Pure and Applied Chemistry(IUPIC), the isotherm hysteresis loop of the TiO2(40%)@CdS composite agreed with the H1-type hysteresis loop, which is relatively parallel and nearly vertical. The H1 hysteresis loop often suggests that a material with this type of curve is composed of holes of a uniform size and regular shape. The adsorption–desorption isotherm of the composite is either a type IV isotherm or a type V isotherm. In particular, at low pressure, the characteristics of the isotherm line conform to the V type isotherm, while, at high pressure, the characteristics of the isotherm line conform to the type IV isotherm. As a result, though there were lots of pores in the rod-like construction of TiO2(30%)@CdS, its pore size distribution uniformity and pore–channel connectivity were inferior to that of the TiO2(40%)@CdS composite. Among all of four composites, the TiO2(30%)@CdS composite had the smallest specific surface area, the largest pore size, and its morphology was less uniform than that of the TiO2(40%)@CdS composite. The nitrogen adsorption–desorption isotherms of the TiO2(20%)@CdS nanoparticle and TiO2(50%)@CdS composites did not fit to both of the type IV or type V isotherms. This type of isotherm was consistent with their irregular morphologies, and also revealed the poor connectivity of the channels, and the inhomogeneous pore size distribution in the two composites with the TiO2 contents of 20% and 50% [34]. The low efficiencies of both TiO2(20%)@CdS and TiO2(50%)@CdS composites are verified by their photocatalytic performance.
Table 1 shows that the TiO2(40%)@CdS composite has the maximum specific surface area and the minimum pore volume among the four composites, which might have contributed to the formation of the ideal optimal space configuration of the catalyst between the nanoparticles and the nanorods. It simultaneously reduced the agglomeration effect between the CdS nanoparticle and the TiO2 nanorods.

2.6. Photocatalytic Performance

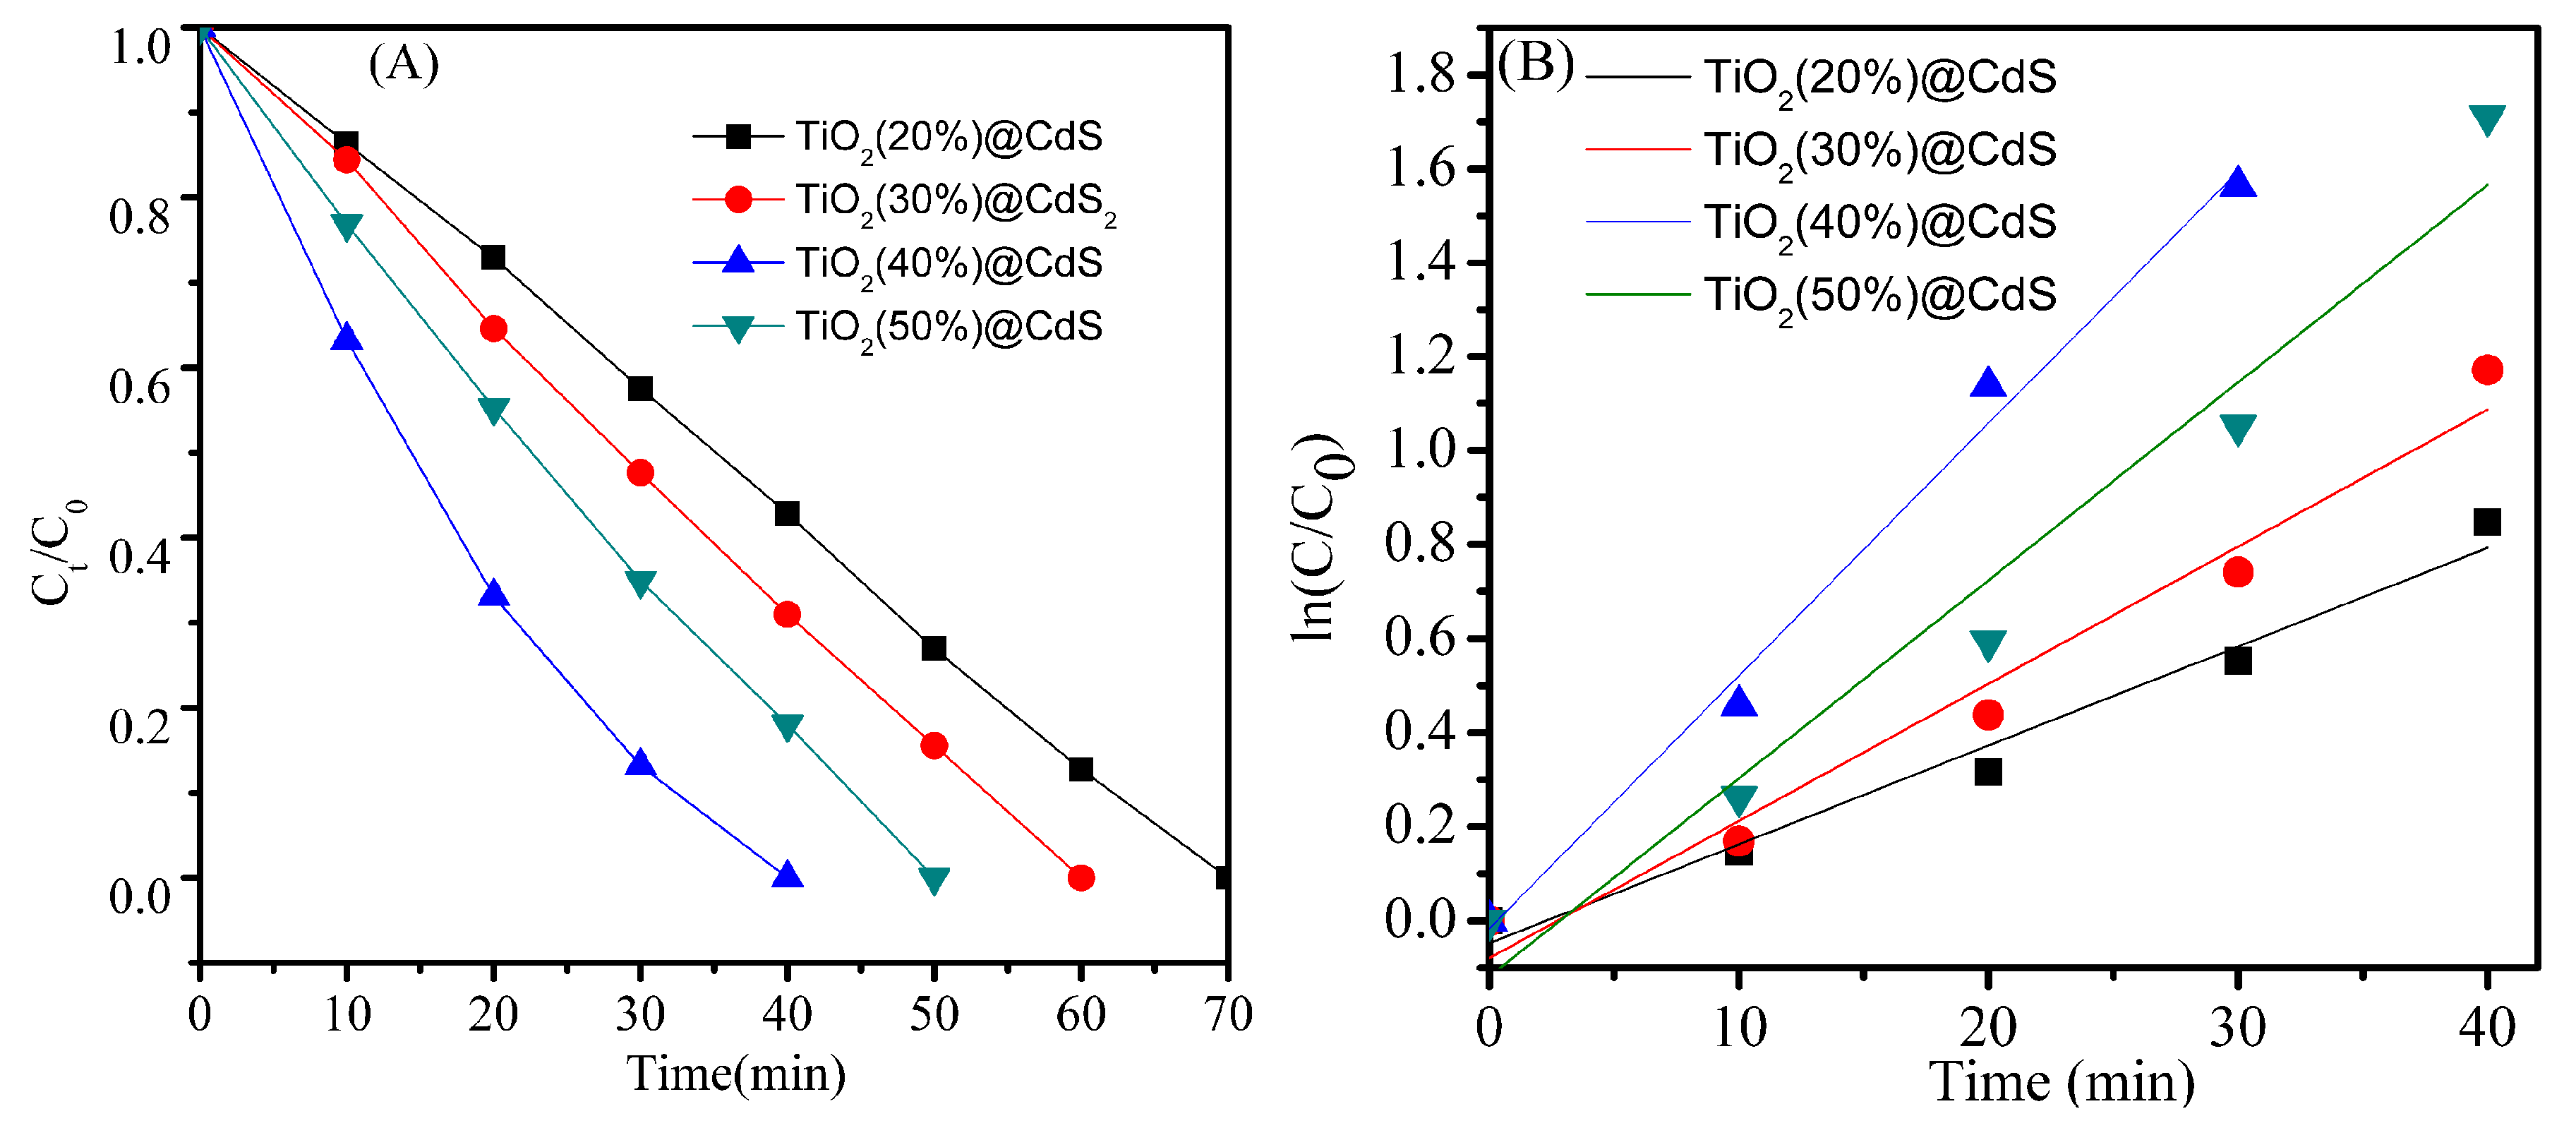
As is illustrated in Figure 8, the adsorption efficiencies of the as-prepared composites for methyl orange under the darkness condition were essentially the same. In the photodegradation reaction with 50 mg of the catalyst, 50 mg/L of methyl orange solution was completely decolorized by the TiO2(40%)@CdS composite after 40 min. The absorption intensities of the dye were monitored by utilizing a UV-vis spectrophotometer. After 30 min, the degradation rate of TiO2(40%)@CdS composite proved to be rapid and nearly constant; after that, the degradation rate slowed up slightly due to a decrease in the dye concentration (Figure 8a). For the TiO2(50%)@CdS composite, a time interval of about 60 min was required for the complete removal of the dye, and the degradation rate in the first 50 min was slightly faster than that in the last 10 min. The time required for the complete decomposition of the dye was more than 70 min for both of the TiO2(30%)@CdS and the TiO2(20%)@CdS composite, with the degradation rate of the former composite being slightly higher (Figure 8A). The reaction kinetics of the degradation of the dye by the presence of the catalytic composites could be evaluated from the linear relationship between the ln(Ct/C0) vs. time. Figure 8B showed that there were good linear relationships between the ln(Ct/C0) vs. time [32], revealing the characteristics of the pseudo-first order reaction kinetics. According to the slopes of the above lines, it was apparent that TiO2(40%)@CdS possessed the best degradation performance, and it was followed by TiO2(50%)@CdS, TiO2(30%)@CdS and TiO2(20%)@CdS, respectively.
Furthermore, in order to evaluate the stability and retention of the photocatalytic abilities of the catalyst, it was used and reused several times, and the results are recorded in Figure 9. The cycling performance of the TiO2(40%)@CdS composite was evaluated in detail. In this experiment, the dye of MO was added in batches, while the catalyst remained unchanged. After the solution became clear, another batch of MO dye was added and the cycle was repeated. Ten cycles of the experiments were conducted to evaluate the persistence of the catalyst.
As shown in Figure 9, the TiO2(40%)@CdS showed excellent stability due to the retention of its 100% degradation efficiency, even after 10 cycles. This long-term cycling performance indicates that adsorption of dye on the catalyst surface did not affect its subsequent catalytic degradation ability.
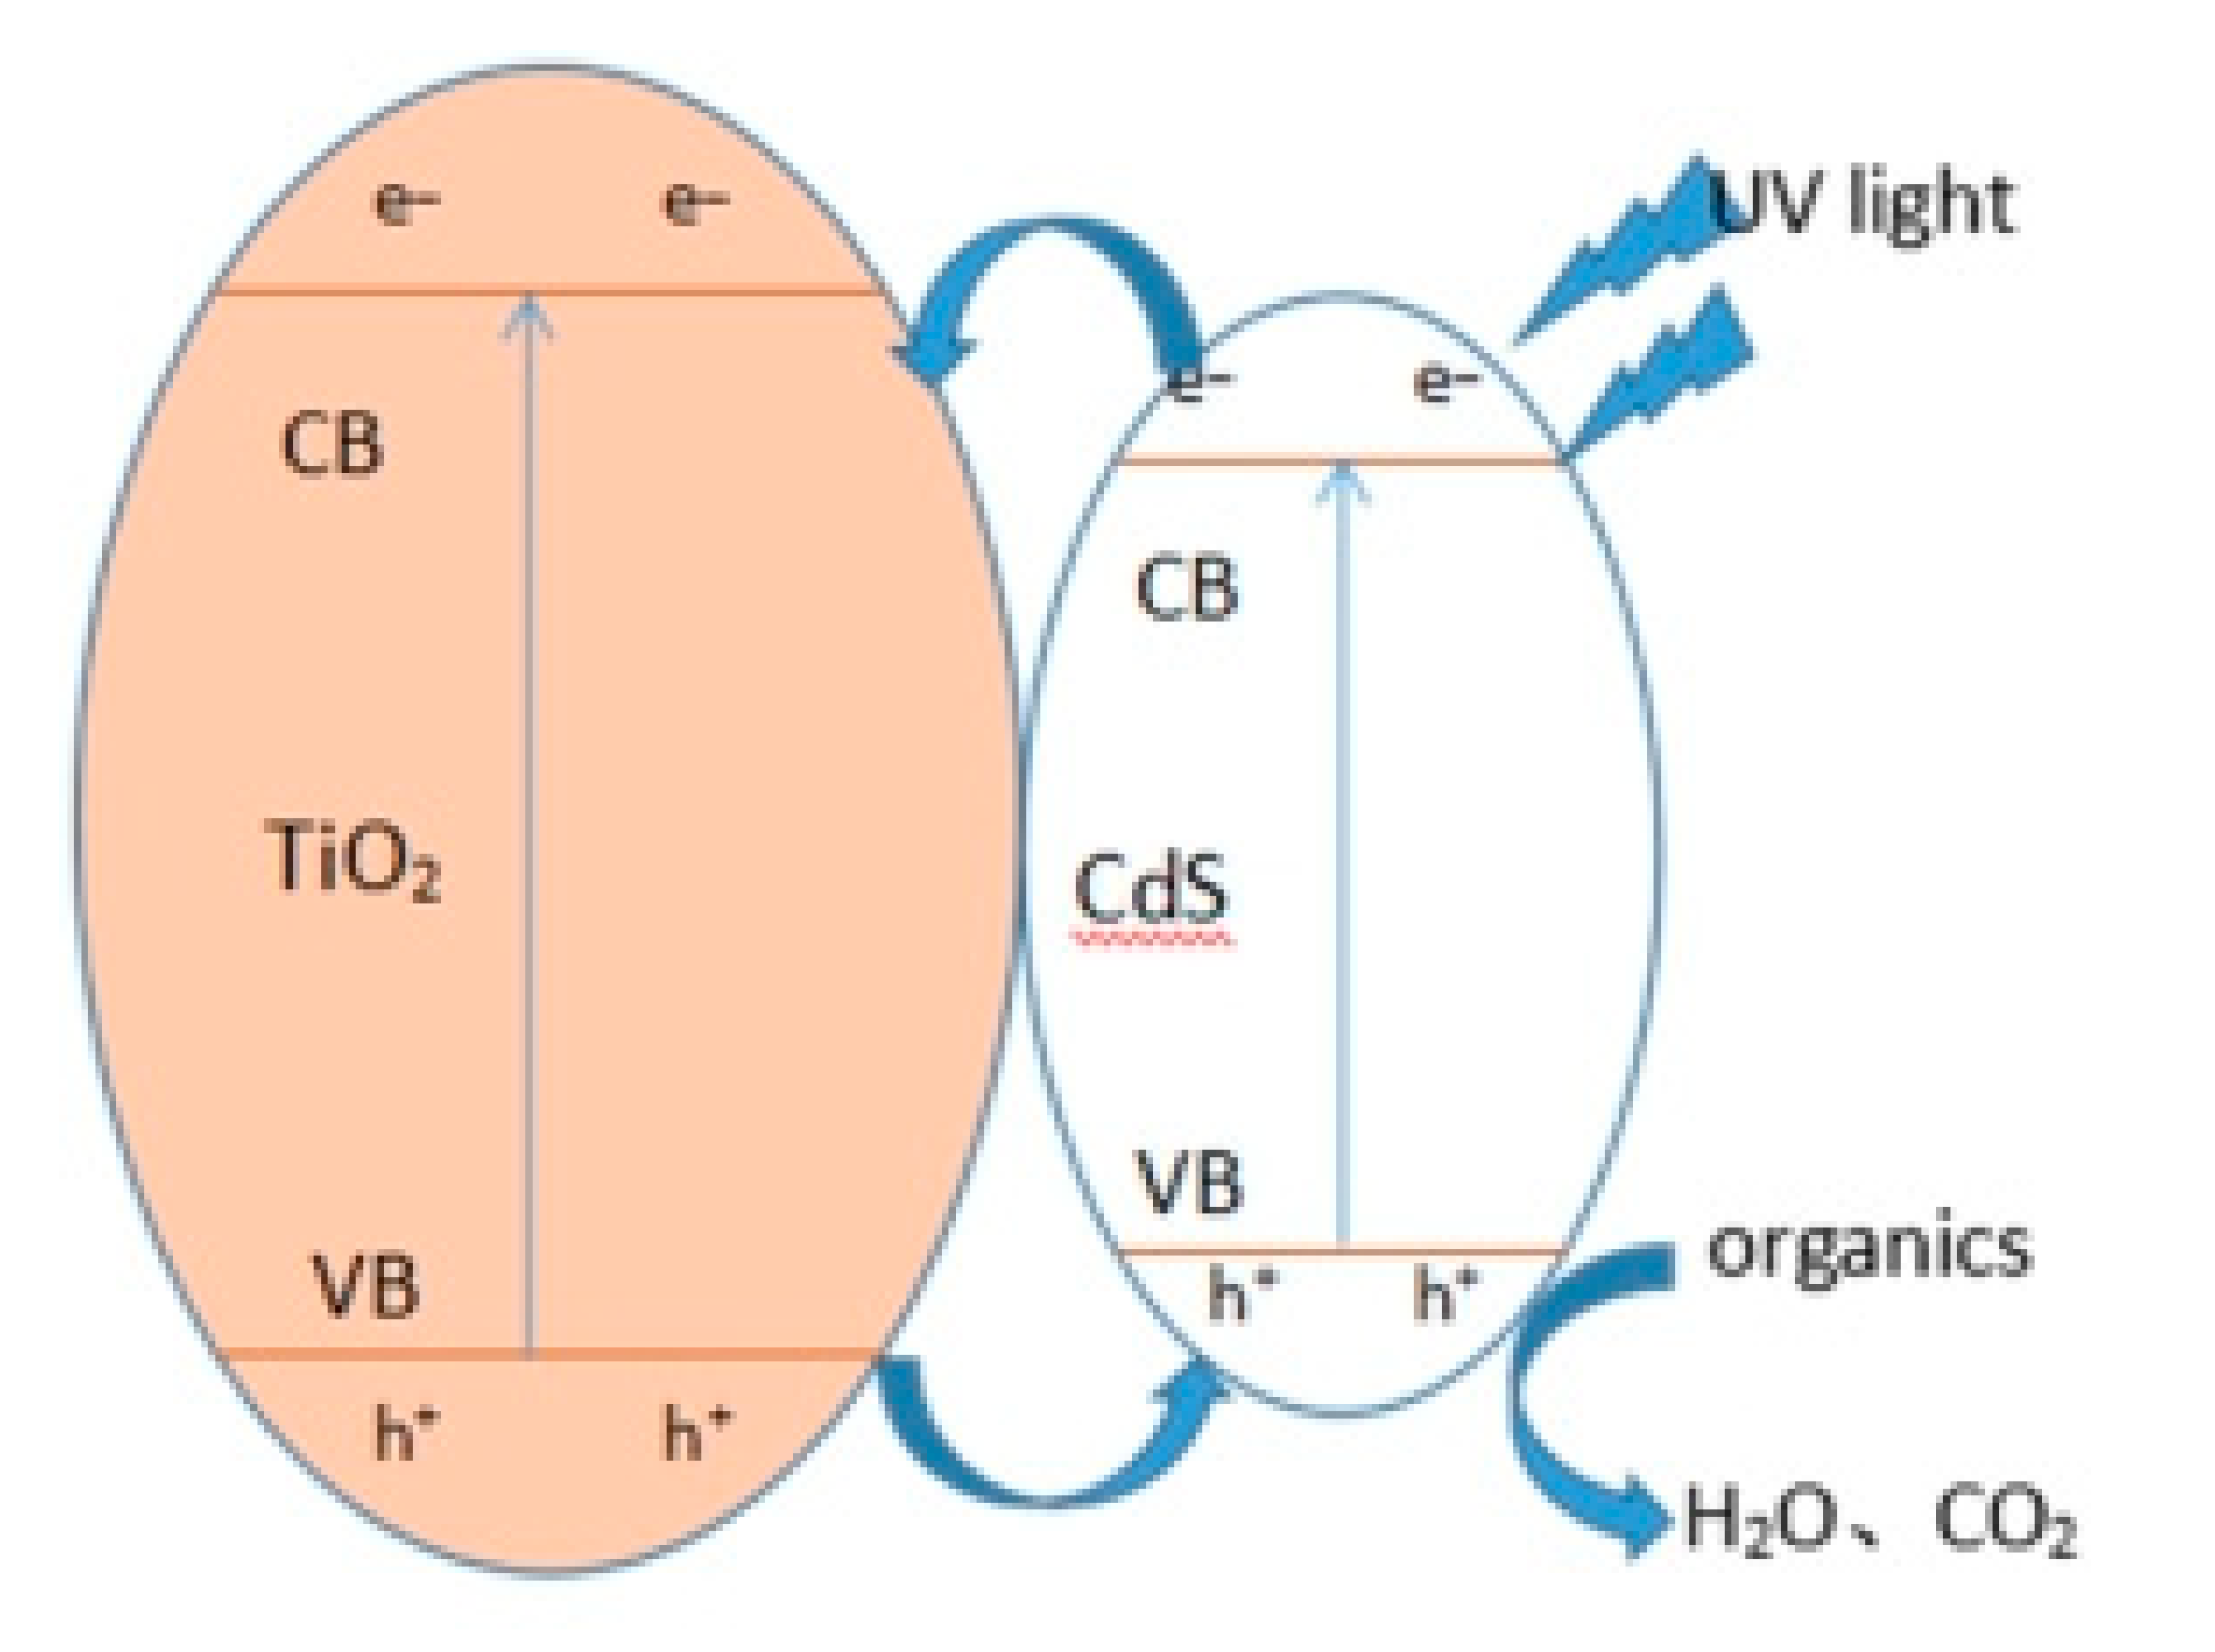
As discussed above, the TiO2(40%)@CdS was a mutual complex, which was formed by CdS nanoparticles and TiO2 nanorod (Figure 10). Moreover, CdS nanoparticles uniformly adhered onto the surface of the TiO2 nanorods, and a compact structure was formed between the two components [34,35]. Due to the low band gap of the CdS nanoparticles (2.11 eV), the photogenerated electrons could be transferred from the value band of CdS nanoparticles to the conduction band of the TiO2 nanorods, and thus the band gap energy of the as-prepared composite was reduced in order to promote the degradation of the dye (Figure 10).

3. Materials and Methods

3.1. Preparation of the Composite of TiO2 Nanorods and CdS Nanoparticles

3.1.1. Equipment and Reagents

Equipment: Heat collector magnetic stirrer with constant temperature (DF-101S Guang Zheng Medical Instrument Co. Ltd., Shanghai, China), desktop high speed centrifuge (TG16-WS XiangYi Centrifuge Instrument Company, Changsha, China), electronic balance (CP225D Yuhua Instrument Co., Ltd., Gongyi, China),vacuum drying oven (DZF-6050 Shanghai Boxun Industrial Co., Ltd., Shanghai, China), magnetic stirrer (90 Shanghai Huxi Analysis Instrument Factory, Shanghai, China), 300 W xenon lamp power(PLS-SXE300 Beijing Perfect Light Technology Co., Ltd., Beijing, China).
Reagent: Sodium sulfide (Na2S·9H2O, AR), ammonium hydroxide (NH3·H2O, AR), sulfuric acid (H2SO4 98%, AR), potassium permanganate (KMnO4, AR), hydrogen peroxide (H2O2,AR), cetyltrimethylammonium bromide (CTAB, AR), n-amyl alcohol(C5H12O, AR), n-hexane (C6H14, AR), titanium trichloride (TiCl3, AR), ethanol (C2H6O, AR, Xilong Scientific Co. LTD., Shantou, China).

3.1.2. Experimental Procedure

Preparation of CdS nanoparticles: an 0.05M CdCl2 solution was obtained by dissolving 1.1442 g of CdCl2·5H2O in a 100 mL volumetric flask, which was referred to as solution A.A total of 50 mL of 5% aqueous ammonia solution was obtained by diluting the 10 mL of 25% ammonia water with the additional 40 mL of deionized water, which was designated as solution B. A total of 25 mL of the solution A and 20 mL of solution B were mixed in a beaker and then transferred to a 100 mL volumetric flask. Furthermore, at the same time, a white flocculent precipitate appeared in the volumetric flask; the pH of the solution was determined to be about 11.Then, 0.0752g of Na2S·9H2O was placed in a beaker, dissolved in a small amount of water, transferred into a 100 mL volumetric flask, and then a 3.13 mM Na2S solution was obtained. The white flocculent precipitate and 3.13 mM Na2S solution were mixed together and vigorously stirred for 30min, and a yellow precipitate was obtained. It was washed with water and centrifuged (three times), and then the resulting precipitate was dried in a vacuum oven at 60 °C for one day.
Preparation of TiO2 nanorod–CdS nanoparticle composites: a total of 5.8 g of CTAB was dissolved in a mixture solution of 10 mL of n-pentanol and 60 mL of n-hexane. The beaker was sealed with cling film and the solution was stirred to obtain liquid A. A total of 10 mg of the above CdS nanoparticles and 10 mLof deionized water was mixed to formed a dispersion solution, which was liquid B. Liquid B was slowly added to liquid A and the mixture solution was vigorously stirred at room temperature for 30 min to form liquid C. Then, a certain amount of TiCl3 (0.032 mM, 0.054 Mm, 0.084 mM and 0.127 mM) solution was added to liquid C solution and magnetically stirred. The resultant liquid was then transferred to a 100 mL Teflon-lined stainless steel autoclave and placed in an oven at 200 °C for 6 h. The resulting product was centrifuged and washed with deionized water and alcohol several times, and was finally placed in a vacuum oven to dry for one day. The final product was named TiO2(x%)@CdS composite, x = 20, 30, 40, 50.

3.2. Characterization of Physical Performance

X-ray powder diffraction (XRD, Rigaku, RINT 2000, CuKα emission line λ = 0.15418 nm) was used for the analysis of the phase and textural properties of the sample. The microstructure and lattice structure of the sample were determined using scanning electron microscopy (SEM, JSM-6700F, (JEOL, Tokyo, Japan). A UV-visible Diffuse Reflectance Spectrophotometer was used to test the spectral absorption of the samples with an Integrating Sphere (DRS, DUV3700, Shimadzu, Kyoto, Japan), using BaSO4 as the background material.

3.3. Characterization of the Photocatalytic Activities of the Catalysts

A total of 50 mL of 50 mg/L methyl orange solution was placed in a beaker. Furthermore, 50 mg of the photocatalyst material was added in into the beaker, with magnetite stirring in the dark for 30 min in order to maintain the adsorption/desorption balance of methyl orange on the catalyst surface [36]. Furthermore, 3 mL of the solution was sampled from the beaker and then centrifugated, and the concentration of the remaining MO was determined as C0 by a UV-vis spectrophotometer. After the photocatalytic degradation reaction was initiated, aliquots (3 mL) of the solution were sampled at every 10 min interval, and were centrifuged to remove the photocatalyst particles for UV-vis measurements. The vertical distance between the light source and the beaker was 5 cm, and the temperature of the beaker was kept at 25 °C, with cooling water flowing in a circulating constant temperature jacket. The light intensity was adjusted to 30 mW/cm2 during the photocatalytic degradation reaction. The blank test without the presence of the photocatalyst was also conducted to distinguish the degradation of the dye. The remaining concentration of the dye was monitored by measuring the maximum absorbance at 463 nm for MO through a UV-Vis spectrophotometer (UV-2550, Shimadzu, Kyoto, Japan). The sampling operation was repeated until the color of the solution did not change. The solution in the tube was measured with a visible light spectrophotometer for absorbance. Different photocatalysts (different ratios of CdS nanoparticles to TiO2 nanorods) were tested according to the above steps. A catalytic degradation map was drawn based on the absorbance, and the performances of the catalysts were compared. The durability of the photocatalyst TiO2(40%)CdS was also evaluated in the cyclic degradation of MO by TiO2(40%)CdS. The specific operation steps are as follows: a total of 0.05 g of TiO2(40%)CdS was added to 50 mL of MO solution (50 mg/L), and the photocatalytic degradation reaction was conducted as the method described above, and the reaction time for each run was set to 120 min. After each run of the degradation reaction, the TiO2(40%)CdS sample was recovered from the solution by centrifugation and rinsed with distilled water once. Then, the TiO2(40%)CdS was reused in the next round of the experiments, which were conducted under the same conditions.

4. Conclusions

In this study, a novel method for preparing CdS nanoparticles was introduced. CdS nanoparticles were prepared at room temperature, and a reaction was then triggered with TiCl3, using a solvothermal treatment to prepare TiO2(x%)@CdS. The contents of TiO2 in the composites have a crucial influence on the tuning of the morphologies of the obtained composites. The composite structures in which nanoparticles uniformly grew on nanorods to form composites were mainly attributed to the differences between nanoparticle and nanorod sizes. Nanorods controlled the mutual aggregation of nanoparticles, resulting in a large specific surface area for the as-prepared composites, which was beneficial to strengthen the contact between the compound and the contaminants and, consequently, improved the decolorization rate due to the utilization of light during the process of photocatalysis. Photocatalytic experiments were designed to meet the need to select an optimal ratio compound. It was found that the TiO2(40%)@CdS composites were the ideal candidates with the highest photocatalytic properties. SEM images clearly showed that CdS nanoparticles were uniformly distributed on the TiO2 nanorods, a result which could only be obtained nanorods with content of 40% TiO2. The band gap energy of the TiO2(40%)@CdS composite was the lowest (2.55 eV) of all the as-prepared composites, which is good for extending the range of the photo response. The cyclic degradation evaluation of methyl orange demonstrated that the TiO2(40%)@CdS composite was sufficiently stable, and the photocatalytic properties and cycle performance were excellent. This study produced a good photocatalyst with outstanding photocatalytic properties and provided a feasible solution for the degradation of organic pollutants in water.

Author Contributions

Conceptualization, J.S.; methodology, Y.X. and F.Z.; formal analysis, J.S., Y.X. and S.R. Investigation, J.S. and Y.X.; data curation, F.W. and J.Z. (Jinsheng Zhao) ; ; Visualization, D.Z.; writing—original draft preparation, J.S.; writing—review and editing, Y.X., and J.Z. (Jinsheng Zhao); visualization, J.Z. (Jinbing Zhang); supervision, L.W. All authors have read and agreed to the published version of the manuscript.

Funding

This research was funded by the National Natural Science Foundation of China (No. 51664047, 21667019), the Key Project of Natural Science Foundation of Jiangxi Province (No. 20171ACB20016), the Jiangxi Province Major Academic and Technical Leaders Cultivating Object Program (No. 20172BCB22014), the Science and Technology Department of Jiangxi Province (No. 20181BCB18003 and 20181ACG70025), the Key Laboratory of Photochemical Conversion and Optoelectronic Materials, TIPC, CSA (No. PCOM201906), and the Key Project of Science and Technology Research of the Jiangxi Provincial Department of Education (No. DA201602063, GJJ191044, GJJ191058), the Aviation Science Foundation of China (No. 2017ZF56020), and Fujian Key Laboratory of Measurement and Control System for of Shore Environment (No. S1-KF1703). Thanks to Edward C. Mignot, Shandong University, for linguistic advice.

Conflicts of Interest

The authors declare no conflict of interest.

References

  1. Murgolo, S.; Franz, S.; Arab, H.; Bestetti, M.; Falletta, E.; Mascolo, G. Degradation of emerging organic pollutants in wastewater effluents by electrochemical photocatalysis on nanostructured TiO2 meshes. Water Res. 2019, 164, 114920. [Google Scholar] [CrossRef] [PubMed]
  2. Linsebigler, A.L.; Lu, G.; Yates, J.T. Photocatalysis on TiO2 surfaces: Principles, mechanisms, and selected Results. Chem. Rev. 1995, 95, 735–758. [Google Scholar] [CrossRef]
  3. Cabrera-Rein, A.; Martínez-Piernas, A.B.; Yannis, B.; Xekoukoulotakis, N.P.; Agüera, A.; Pérezbd, J.A. TiO2 photocatalysis under natural solar radiation for the degradation of the carbapenem antibiotics imipenem and meropenem in aqueous solutions at pilot plant scale. Water Res. 2019, 166, 115037. [Google Scholar] [CrossRef] [PubMed]
  4. Tang, H.; Prasad, K.; Sanjines, R.; Schmid, P.E.; Levy, F. Electrical and optical properties of TiO2 anatase thin films. J. Appl. Phys. 1994, 75, 2042–2047. [Google Scholar] [CrossRef]
  5. Burda, C.; Lou, Y.; Chen, X.; Samia, A.C.; Stout, J.; Gole, J.L. Enhanced nitrogen doping in TiO2 nanoparticles. Nano Lett. 2003, 3, 1049–1051. [Google Scholar] [CrossRef]
  6. Antonelli, D.M.; Ying, J.Y. Synthesis of hexagonally packed mesoporous TiO2 by a modified sol-gel method. Angew. Chem. Int. Edit. 1995, 34, 2014–2017. [Google Scholar] [CrossRef]
  7. Kovacic, M.; Papac, J.; Kusic, H.; Karamanis, P.; Bozic, A.L. Degradation of polar and non-polar pharmaceutical pollutants in water by solar assisted photocatalysis using hydrothermal TiO2-SnS2. Chem. Eng. J. 2020, 382, 122826. [Google Scholar] [CrossRef]
  8. Huang, R.; Zhang, S.L.; Ding, J.; Meng, Y.H.; Zhong, Q.; Kong, D.S.; Gu, C.J. Effect of adsorption properties of phosphorus-doped TiO2 nanotubes on photocatalytic NO removal. J. Colloid. Interf. Sci. 2019, 553, 647–654. [Google Scholar] [CrossRef]
  9. Zhang, S.B.; Zhao, Y.C.; Yang, J.P.; Zhang, J.Y.; Zheng, C.G. Fe-modified MnOx/TiO2 as the SCR catalyst for simultaneous removal of NO and mercury from coal conbustion flue gas. Chem. Eng. J. 2018, 348, 618–629. [Google Scholar] [CrossRef]
  10. Kazemi, M.L.; Sui, R.H.; Clark, P.D.; Marriott, R.A. Catalytic combustion of Claus tail gas: Oxidation of sulfur species and CO using gold supported on lanthanide-modified TiO2. Appl. Cataly A Gen. 2019, 578, 117256. [Google Scholar] [CrossRef]
  11. Lin, F.; Zhang, Y.N.; Wang, L.; Zhang, Y.L.; Wang, D.G.; Yang, M.; Yang, J.H.; Zhang, B.Y.; Jiang, Z.X.; Li, C. Highly efficient photocatalytic oxidation of sulfur-containing organic compounds and dyes on TiO2 with dual cocatalysts Pt and RuO2. Appl. Catal. B Environ. 2012, 127, 363–370. [Google Scholar] [CrossRef]
  12. Pei, X.L.; Jiang, C.J.; Chen, W. Enhanced hydrolysis of 1,1,2,2-tetrachloroethane by multi-walled carbon nanotube/TiO2 nanocomposites: The synergistic effect. Environ. Pollut. 2019, 255, 113211. [Google Scholar] [CrossRef] [PubMed]
  13. Wang, Y.Y.; Yang, C.Z.; Chen, A.; Pu, W.H.; Gong, J.Y. Influence of yolk-shell Au@TiO2 structure induced photocatalytic activity towards gaseous pollutant degradation under visible light. Appl. Catal. B Environ. 2019, 251, 57–65. [Google Scholar] [CrossRef]
  14. Elfalleh, W.; Assadi, A.A.; Bouzaza, A.; Wolbert, D.; Kiwi, J.; Rtimi, S. Innovative and stable TiO2 supported catalytic surfaces removing aldehydes under UV-light irradiation. J. Photoch. Photobio A Chem. 2017, 343, 96–102. [Google Scholar] [CrossRef]
  15. Zhang, G.; Gao, M.; Tian, M.; Zhao, W.F. In situ hydrothermal preparation and photocatalytic desulfurization performance of graphene wrapped TiO2 composites. J. Solid. State. Chem. 2019, 279, 120953. [Google Scholar] [CrossRef]
  16. Pozo-Antonio, J.S.; Dionísio, A. Self-cleaning property of mortars with TiO2 addition using real diesel exhaust soot. J. Clean. Prod. 2017, 161, 850–859. [Google Scholar] [CrossRef]
  17. Chai, W.M.; Zhu, W.D.; Chen, D.D.; Chen, D.Z.; Xi, H.; Chang, J.J.; Zhang, J.C.; Zhang, C.F.; Hao, Y. Combustion-processed NiO/ALD TiO2 bilayer as a novel low-temperature electron transporting material for efficient all-inorganic CsPbIBr2 solar cell. Sol. Energy 2020, 203, 10–18. [Google Scholar] [CrossRef]
  18. Wang, J.M.; Zhang, C.; Yang, Y.Q.; Fan, A.L.; Chi, R.F.; Shi, J.; Zhang, X.Y. Poly (vinyl alcohol) (PVA) hydrogel incorporated with Ag/TiO2 for rapid sterilization by photoinspired radical oxygen species and promotion of wound healing. Appl. Surf. Sci. 2019, 494, 708–720. [Google Scholar] [CrossRef]
  19. Yu, Z.C.; Wang, S.; Han, L.; Niu, Y.L. Photocatalytic property of nanostructured S doped TiO2 films prepared by the micro plasma method. Rare. Metal. Mat. Eng. 2015, 44, 1629–1632. [Google Scholar]
  20. Xie, Y.; Wu, J.; Sun, C.Y.; Ling, Y.; Li, S.Q.; Li, X.; Zhao, J.S.; Yang, K. La2O3-modified graphite carbon nitride achieving the enhanced photocatalytic degradation of different organic pollutants under visible light irradiation. Mater. Chem. Phys. 2020, 246, 122846. [Google Scholar] [CrossRef]
  21. Ren, Y.F.; Li, W.T.; Cao, Z.H.; Jiao, Y.P.; Xu, J.J.; Liu, P.; Li, S.; Li, X. Robust TiO2 nanorods-SiO2 core-shell coating with high-performance self-cleaning properties under visible light. Appl. Surf. Sci. 2020, 509, 145377. [Google Scholar] [CrossRef]
  22. Baena-Moreno, F.M.; Rodriguez-Galán, M.; Vega, F.; Alonso-Farinãs, Vilches Arenas, L.F.; Navarrete, B. Carbon capture and utilization technologies: A literature review and recent advances. Energy Source Part A 2019, 41, 1403–1433. [Google Scholar] [CrossRef]
  23. Ibrahim, H.; Ilinca, A.; Perron, J. Energy storage systems-characteristics and comparisons. Renew. Sust. Energy. Rev. 2008, 12, 1221–1250. [Google Scholar] [CrossRef]
  24. Kavil, J.; Alshahrie, A.; Periyat, P. CdS sensitized TiO2 nano heterostructures as sunlight driven photocatalyst. Nano Struct. Nano Objects 2018, 16, 24–30. [Google Scholar] [CrossRef]
  25. Yang, G.D.; Yang, B.L.; Xiao, T.C.; Yan, Z.F. One-step solvothermal synthesis of hierarchically porous nanostructured CdS/TiO2 heterojunction with higher light photocatalytic activity. Appl. Surf. Sci. 2013, 283, 402–410. [Google Scholar] [CrossRef]
  26. Du, Y.B.; Zhang, L.; Ruan, M.; Niu, C.G.; Wen, X.J.; Liang, C.; Zhang, X.G.; Zeng, G.M. Template-free synthesis of three-dimensional porous CdS/TiO2 with high stability and excellent visible photocatalytic activity. Mater. Chem. Phys. 2018, 212, 69–77. [Google Scholar] [CrossRef]
  27. Liu, Y.Y.; Xie, Y.; Ling, Y.; Jiao, J.L.; Li, X.; Zhao, J.S. Facile construction of a molybdenum disulphide/zinc oxide nanosheet hybrid for an advanced photocatalyst. J. Alloys Compd. 2019, 778, 761–767. [Google Scholar] [CrossRef]
  28. Zeng, D.D.; Yang, L.M.; Zhou, P.P.; Hu, D.S.; Xie, Y.; Li, S.Q.; Jiang, L.S.; Ling, Y.; Zhao, J.S. Au-Cu alloys deposited on titanium dioxide nanosheets for efficient photocatalytic hydrogen evolution. Int. J. Hydrogen Energy 2018, 43, 15155–15163. [Google Scholar] [CrossRef]
  29. Han, J.; Su, H.L.; Dong, Q.; Zhang, D.; Ma, X.X.; Zhang, C.F. Patterning and photoluminescence of CdS nanocrystallites on silk fibroin fiber. J. Nanopart. Res. 2010, 12, 347–356. [Google Scholar] [CrossRef]
  30. Wang, H.H.; Zhang, N.; Cheng, G.; Guo, H.; Shen, Z.W.; Yang, L.; Zhao, Y.S.; Alsaedi, A.; Hayat, T.; Wang, X.K. Preparing a photocatalytic Fe doped TiO2/rGO for enhanced bisphenol A and its analogues degradation in water sample. Appl. Surf. Sci. 2020, 505, 144640. [Google Scholar] [CrossRef]
  31. Shkir, M.; Ashraf, I.M.; Alfaify, S.; EI-Toni, A.M.; Ahmed, M.; Khan, A. A noticeable effect of Pr doping on key optoelectrical properties of CdS thin films prepared using spray pyrolysis technique for high-performance photodetector applications. Ceram. Int. 2020, 46, 4652–4663. [Google Scholar] [CrossRef]
  32. Sun, C.Y.; Xu, Q.H.; Xie, Y.; Ling, Y.; Jiao, J.L.; Zhu, H.H.; Zhao, J.S.; Liu, X.M.; Hu, B.; Zhou, D. High-efficient one-pot synthesis of carbon quantum dots decorating Bi2MoO6 nanosheets heterostructure with enhanced visible-light photocatalytic properties. J. Alloys Compd. 2017, 723, 333–344. [Google Scholar] [CrossRef]
  33. Fu, H.H.; Yang, L.M.; Hu, D.S.; Yu, c.; Ling, Y.; Xie, Y.; Li, S.Q.; Zhao, J.S. Titanium dioxide nano-heterostructure with nanoparticles decorating nanowires for high-performance photocatalysis. Int. J. Hydrogen Energ. 2018, 43, 10359–10367. [Google Scholar] [CrossRef]
  34. Tu, H.; Li, D.; Yi, Y.; Liu, R.; Wu, Y.; Dong, X.Y.; Shi, X.W.; Deng, H.B. Incorporation of rectorite into porous polycaprolactone/TiO2 nanofibrous mats for enhancing photocatalysis properties towards organic dye pollution. Compos. Commun. 2019, 15, 58–63. [Google Scholar] [CrossRef]
  35. Wu, J.; Xie, Y.; Ling, Y.; Dong, Y.Y.; Li, J.; Li, S.Q.; Zhao, J.S. Synthesis of flower-like g-C3N4/BiOBr and enhancement of the activity for the degradation of bisphenol A under visible light irradiation. Front. Chem. 2019, 7, 649. [Google Scholar] [CrossRef] [PubMed]
  36. Zhu, H.Y.; Jiang, R.; Xiao, L.; Liu, L.; Cao, C.H.; Zeng, G.M. CdS nanocrystals/TiO2/crosslinked chitosan composite: Facile preparation, characterization and adsorption-photocatalytic properties. Appl. Surf. Sci. 2013, 273, 661–669. [Google Scholar] [CrossRef]
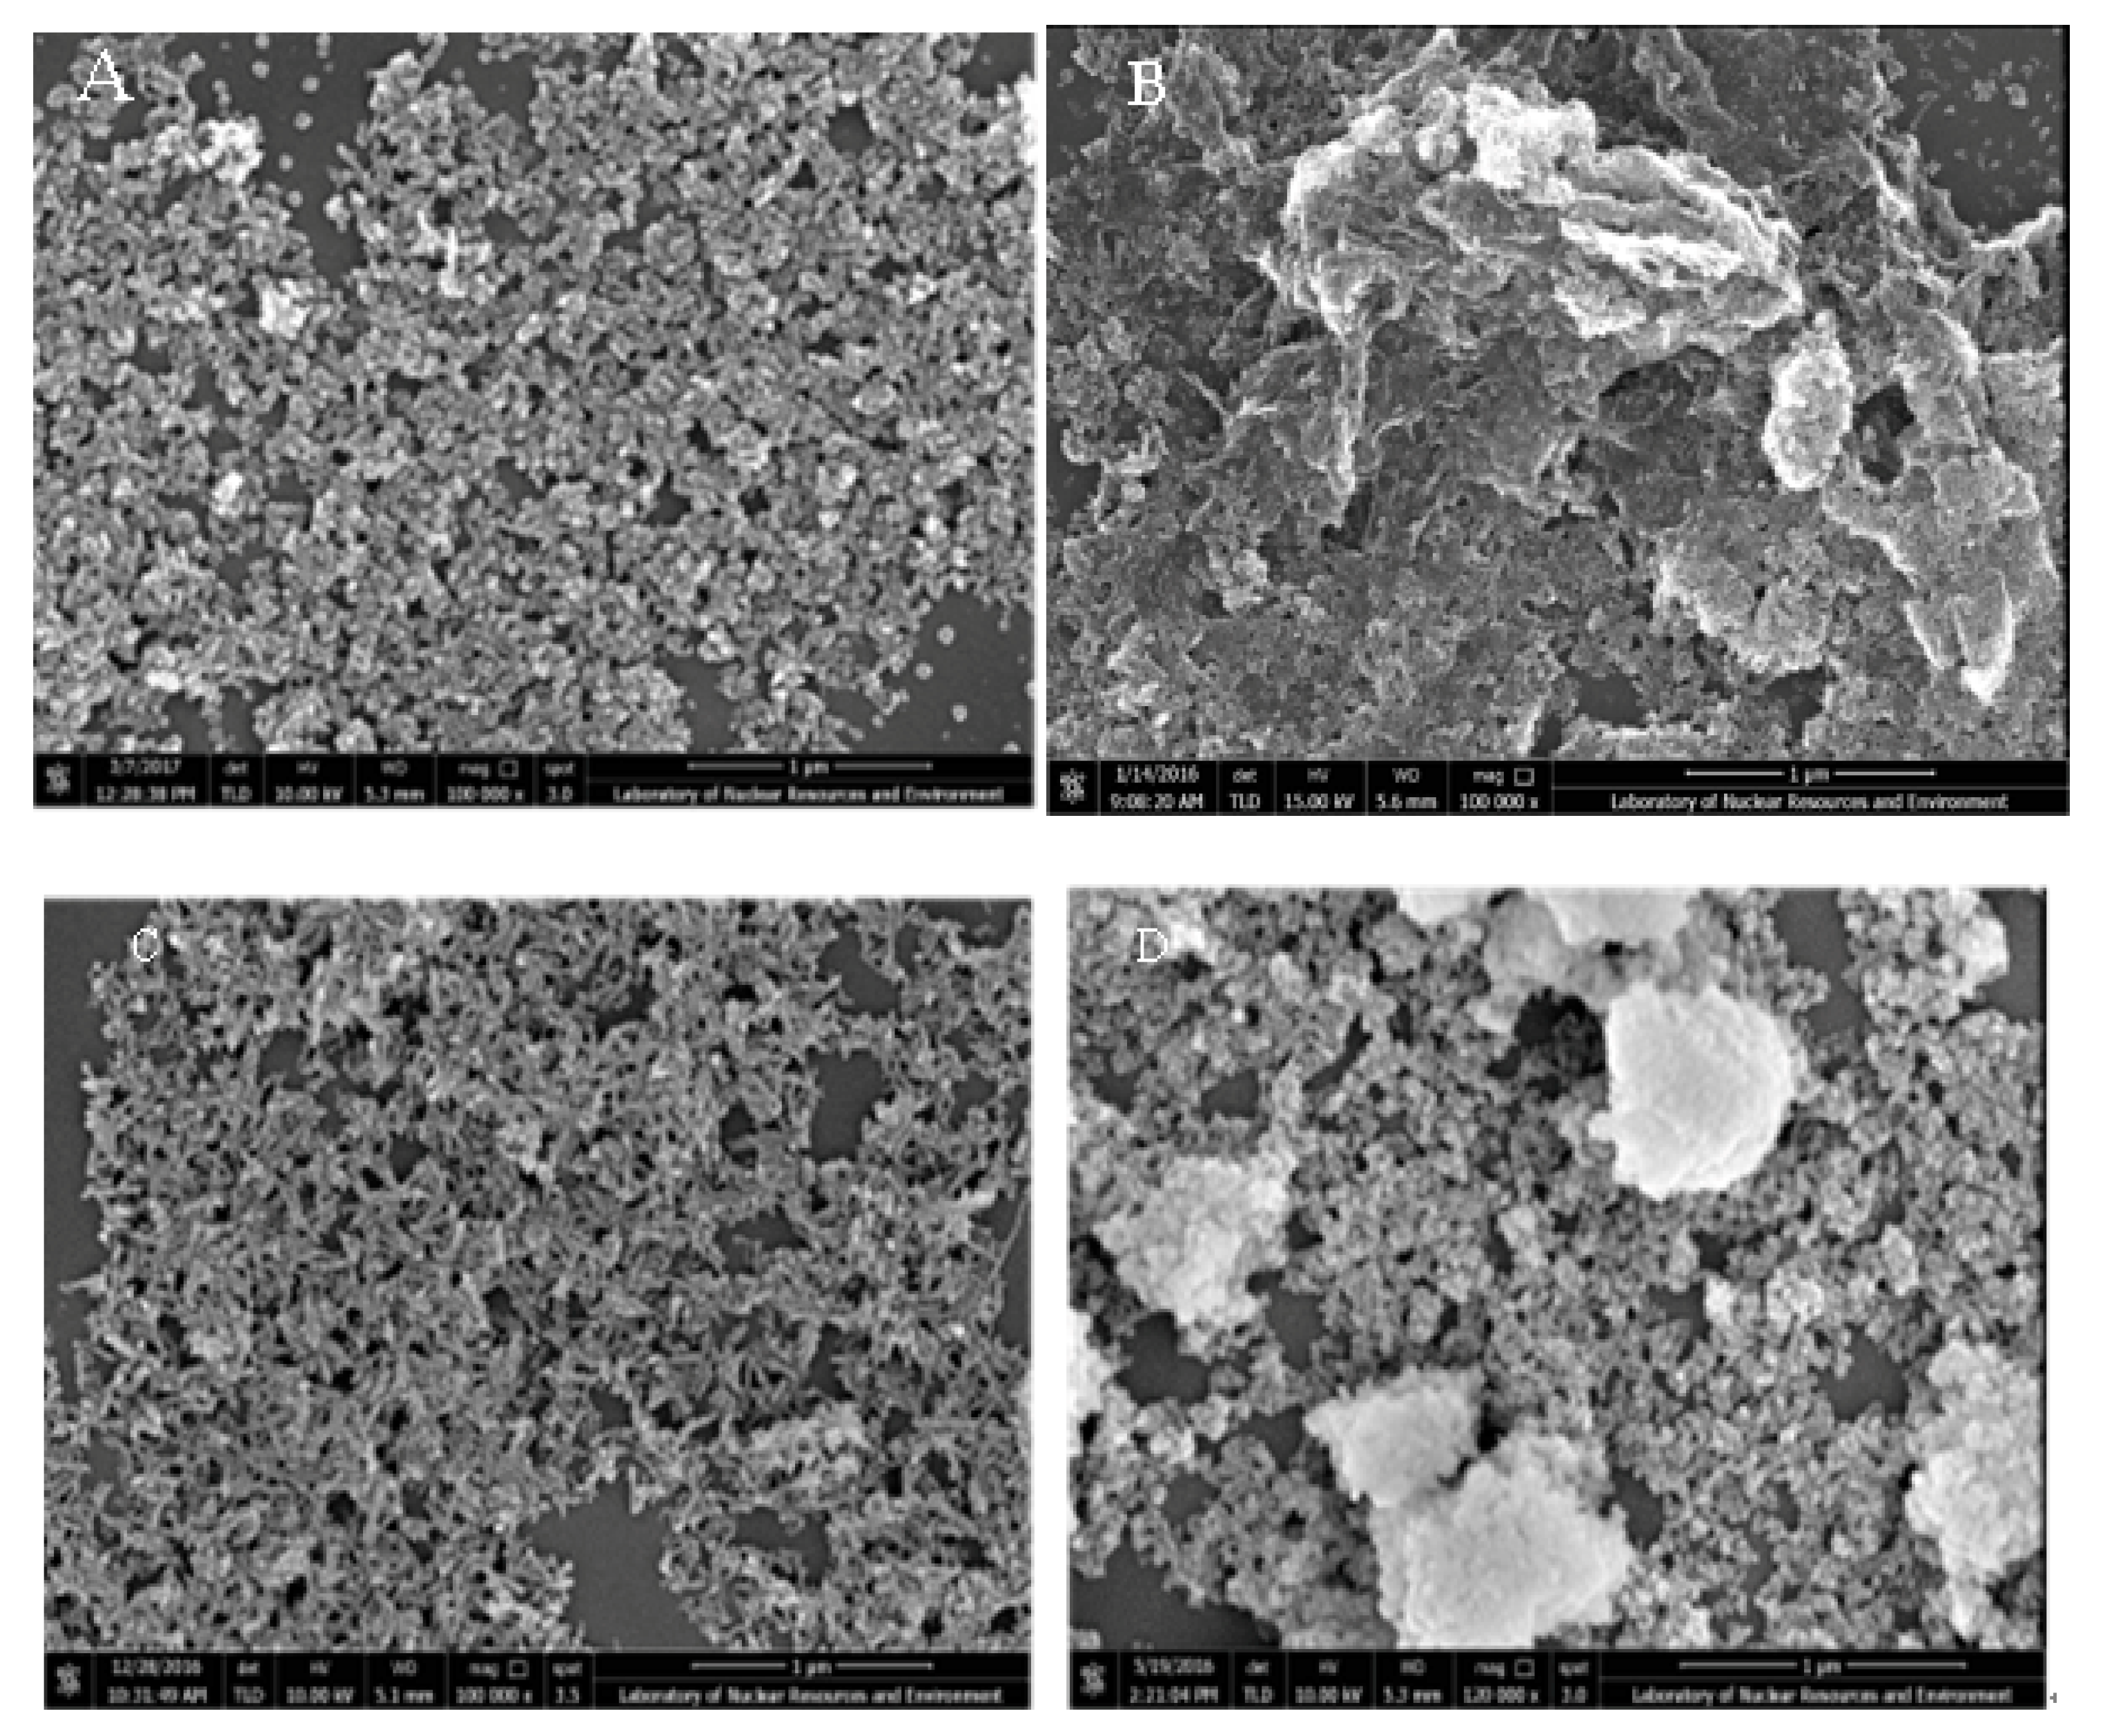
Figure 1. SEM image of (A) TiO2(20%)@CdS composite; (B) TiO2(30%)@CdS;(C) TiO2(40%)@CdS; (D) TiO2(50%)@CdS.Magnification: ×100,000, and the samples were sprayed with gold before measurement.
Catalysts 10 00441 g001
Figure 2. TEM patterns of TiO2(40%)@CdS composites(ad).
Catalysts 10 00441 g002
Figure 3. XRD pattern of TiO2 nanorod–CdS nanoparticles.
Catalysts 10 00441 g003
Figure 4. Raman pattern of TiO2 nanorod–CdS nanoparticle composites.
Catalysts 10 00441 g004
Figure 5. UV-visible diffuse reflectance spectra of TiO2 nanorod–CdS nanoparticle composites and the CdS nanoparticles.
Catalysts 10 00441 g005
Figure 6. Photocurrent response curve of TiO2 nanorod–CdS nanoparticle composites.
Catalysts 10 00441 g006
Figure 7. N2 adsorption–desorption isothermal graphs (A) and pore size distribution (B) of TiO2(20%)@CdS,TiO2(30%)@CdS, TiO2(40%)@CdS, and TiO2(50%)@CdS composites.
Catalysts 10 00441 g007
Figure 8. (A) Photocatalytic degradation of methyl orange of TiO2 nanorod–CdS nanoparticle composites; (B) first order kinetic equation of TiO2 nanorod–CdS nanoparticle composites.
Catalysts 10 00441 g008
Figure 9. Cyclic degradation of MO by the catalyst of TiO2(40%)@CdS under light irradiation with a reaction time of 120 min for each cycle.
Catalysts 10 00441 g009
Figure 10. Mechanism of photodegradation.
Catalysts 10 00441 g010
Table 1. Specific surface are and pore volume of the sample.
Project Type SizeBET Surface Area (m2/g)Pore Size (nm)
TiO2(40%)@CdS 61.435.5
TiO2(30%)@CdS53.642.7
TiO2(40%)@CdS107.514.6
TiO2(50%)@CdS86.525.7