Article

Investigation of the Synergistic Effect of Sonolysis and Photocatalysis of Titanium Dioxide for Organic Dye Degradation

1
Materials Architecturing Research Center, Korea Institute of Science & Technology, 5 Hwarang-ro 14-gil, Seongbuk-gu, Seoul 02792, Korea
2
Department of Mechanical Engineering, Korea University, Anam-dong 5-ga, Seongbuk-gu, Seoul 02841, Korea
3
Department of Nuclear Engineering, Missouri University of Science and Technology, Rolla, MO 65409, USA
4
Photocatalysis International Research Center, Tokyo University of Science, 2641 Yamazaki, Noda-shi, Chiba 278-8510, Japan
5
Department of Mechanical and Control Engineering, Handong Global University, 558 Handong-ro, Buk-gu, Pohang-si 37554, Korea
6
Department of Nanomaterials Science and Engineering, Korea University of Science and Technology, 217 Gajeong-ro Yuseong-gu, Daejeon 34113, Korea
*
Authors to whom correspondence should be addressed.
Catalysts 2020, 10(5), 500; https://doi.org/10.3390/catal10050500
Submission received: 12 April 2020 / Revised: 28 April 2020 / Accepted: 29 April 2020 / Published: 2 May 2020
(This article belongs to the Special Issue Recent Advances in TiO2 Photocatalysts)

Abstract

:
Herein, we report the effect of sonoluminescence and an initial dye concentration on the sonophotocatalysis of TiO2 for the degradation of eosin B, a textile dye. We first investigated the light illuminated during ultrasound irradiation (sonoluminescence) by photographic images, a radical indicator (luminol), and photoluminescence spectra of the detection range of 300–1050 nm. Next, we examined the synergistic effect of sonolysis on photocatalysis by comparing the dye degradation of sonophotocatalysis to that of individual contributions of sonolysis and photocatalysis. Since it was found that the synergist effect is highly engaged with a dye concentration and sonication power, we conducted the comparison test in different concentrations of eosin B (5 and 20 mg/L) and ultrasound powers (35.4, 106.1, and 176.8 W/cm2). When the concentration of dyes was low, negative synergistic effects were found at all ultrasound powers, whereas at the high concentration, positive synergistic effects were observed at high ultrasound power. This difference in synergistic effects was explained by the influence of ultrasound on dynamics of dye adsorption on the TiO2 surface.

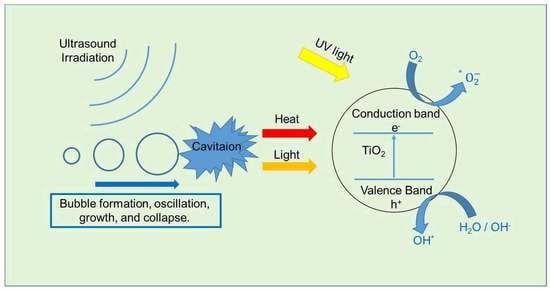
Graphical Abstract

1. Introduction

With industrial development, wastewater treatment has become very important. Especially, increasing amounts of organic substances dissolved in water, such as dyes, chlorinated organics, and antibiotics, have emerged as a serious problem and hence the need for development of advanced oxidation processes (AOPs) has dramatically increased. Among several AOPs, oxidative catalytic reactions such as the Fenton process (a Fe2+-mediated catalytic reaction of H2O2 conversion to a hydroxyl radical (OH·)) and photocatalysis, ozone-based oxidations, H2O2-based oxidations, UV-based photoreactions, and ultrasound-based sonolysis are considered as promising [1]. In addition, hybrid AOPs, which combine more than one process, such as UV irradiation combined with Fenton reaction (photo-Fenton), ultrasound irradiation combined with Fenton reaction (sono-Fenton), and ultrasound irradiation combined with photocatalysis (sonophotocatalysis), have been successfully applied [2,3,4].
The mechanism of most AOPs involves the formation of OH· radicals, a powerful oxidant with its oxidation potential of 2.8 eV, but ways of its generation vary by different AOPs, from sonolysis of water to activation of oxidants, such as H2O2 and ozone [5,6]. In general, sonolysis undergoes by OH· radicals, which are generated by ultrasonic irradiation of water. During the ultrasonic irradiation of water, micro-bubbles form, oscillate, grow and collapse (generally called as acoustic cavitation), by which a locally concentrated energy strong enough to dissociate water vapor to OH· radicals and hydrogen atoms arises [7]. Under proper conditions, hot spots, where the concentrated energy occurs, have temperatures of about 5000 K and pressures of about 1000 atm [7]. Therefore, sonolysis can be used to not only break down hard substances, but also decompose large organic molecules into small fragments [8,9].
Sonocatalysis refers to the case whereby sonolytic degradation of organic pollutants increases by the addition of solid materials. Representative examples of such materials are Al2O3, ZnO, and TiO2 [10]. The mechanism of sonocatalysis is not fully understood but a general consensus is that the solid catalyst supplies nucleation sites for cavity bubble formation and thereby enhances cavitation [10].
Photocatalysis is one of powerful AOPs, which involves organic or inorganic semiconductor catalysts. Those catalysts can be excited by light to make electrons (e) and holes (h+) in their conduction (CB) and valence bands (VB), respectively. The charge carriers created on the surface of catalysts can form radicals, such as OH· and O2 by reacting with water and oxygen. The radical species have a strong oxidative/reductive power to break down organic molecules to H2O and CO2. Most-widely used photocatalysts are metal-oxide based nanomaterials, such as ZnO, WO3 and TiO2, since they are highly stable and made of earth-abundant and environmentally benign elements [11].
The abovementioned sonophotocatalysis is a hybrid AOP process, which utilizes sonolysis coupled with heterogeneous photocatalysis. A review paper reported by Mahamuni and Adewuyi, which deals with AOPs by ultrasound and its hybrid processes, nicely demonstrated an industrial cost comparison of sonolysis alone and its hybrid processes for wastewater treatment [12]. They reported that the cost of treatment for ultrasound is very high but those for hybrid processes can be much lower.
It has been argued that there is a synergistic effect when sonolysis is combined with photocatalysis, and light generated by sonolysis during cavitation (called sonoluminescence) is responsible for the synergistic effect [13]. Photocatalysts are semiconductors which are excited by the absorption of light energy larger than their bandgaps. Ideally, when a large bandgap semiconductor like TiO2 (bandgap = 3.2 eV) and ZnO (bandgap = 3.3 eV) [11] is used for sonophotocatalysis, sonoluminescence light corresponding to the UV region can contribute to its activity increase, and thereby the synergistic effect can be realized [14]. In addition, common photocatalysts are metal oxide nanoparticles, which often function as sonocatalysts by boosting cavitation by ultrasound. Therefore, applying ultrasound to a photocatalysis process can simultaneously enhance photocatalytic and sonolytic activities [13].
Recent studies report the use of photocatalysts with a reduced bandgap for sonophotocatalysis to increase the absorption of sonoluminescence and immobilization of sonocatalysts on a metal oxide support to enhance the cavitation effect. For instance, Yao et al. synthesized novel heterojunction composites of N and Ti3+-doped TiO2 and BiOBr for the sonophotocatalytic degradation of organic dyes [15]. The composite showed an extended absorption to visible light, and enhanced sonocatalytic performance, which is 1.81 times larger than that of bare TiO2. Soltani et al. reported ZnO-biosilica nanocomposites and their use for sonocatalysis of a textile dye [16]. ZnO nanoparticles were prepared and immobilized on biosilica support by ultrasound irradiation and the resulting supported catalyst showed a degradation efficiency of 77.8% when it was used for the sonocatalysis of methylene blue, which is higher than that of ZnO nanoparticles (53.6%). The authors explained that the enhanced activity is attributed to increased sonoluminescence and cavitation.
In this study, we became interested in the influence of sonoluminescence on sonophotocatalysis. Although there are many papers and reviews deliberating the phenomenon of sonoluminescence and its contribution to sonocatalysis and sonophotocatalysis processes, studies which show no synergistic effect of sonoluminescence on those processes still exist [17,18,19]. We choose commercial TiO2 nanoparticles (P25) as a catalyst since it is the most widely used for both sonocatalysis and sonophotocatalysis [10,11] and eosin B for an organic dye because it is an extensive and important chemical dye in textile [20]. We attempted to analyze sonoluminescence by camera images and photoluminescence spectra for reaction position, intensity, and wavelength, which was then connected to occurrence of OH· radicals by a radical indicator. The synergy effect of sonolysis on photocatalysis was also examined in different dye concentrations with a control of ultrasound power. By applying this method, it is expected to increase the understanding of the sonoluminescence and the mechanism of the sonophotocatalysis phenomenon, which is difficult to analyze due to various reactions occurring simultaneously.

2. Results and Discussion

2.1. Analysis of Sonoluminescence

As mentioned before, several studies have reported that sonoluminescence is related to the synergy effect [15,16]. To understand the synergy, sonolysis and sonoluminescence should be analyzed to elucidate the complex phenomena of sonophotocatalysis. We examined sonoluminescence by light images and then by photoluminescence (PL) spectroscopy. In Figure 1, a schematic diagram of our experimental set-up for sonoluminescence measurement by a photomultiplier tubes (PMT) detector is depicted. A horn-type ultrasound generator (Branson, Digital Sonifier 450) with a max. power of 400 W and a frequency of 20 kHz was used and output power was controlled to be 10%, 30%, and 50%, each of which accounts for 35.4, 106.1, and 176.8 W/cm2 power, respectively, when the exact horn tip size (12.5 mm) is considered [7]. A glass reactor was equipped with a water jacket, which was cooled by a chiller of which temperature was set to be 10 °C ± 1.5. Since oxygen is known to degrade cavitation efficiency, water solution was degassed with Ar gas for 5 min before the measurement [21].
Sonoluminescence generated in pure water was too weak to be observed by bare eyes for all three power outputs (P = 10%, 30%, and 50%) so that photographic images were obtained by a continuous collection of light for 1 min, which are shown in Figure 2 (left images). According to previous studies, sonoluminescence is responsible for OH· radical centers around the wavelength of 310 nm and spans to visible light [22], which explains why the observed color was bluish white. When the ultrasound power was l0%, sonoluminescence occurred in a standing wave pattern throughout the reactor (Figure 2a, left image). The regularity, which is observed at the peak of each standing wave, is related to the frequency of ultrasound and the size of the reactor. As the ultrasound intensity increases to 30% and 50%, the standing wave disappeared and the luminescence concentrated at the ultrasonic horn tip (Figure 2b,c, left images). However, luminescence intensities became much stronger and the shapes of luminescence appeared different. It is because intensities and shapes of sonoluminescence are known to rely on many different factors, such as the kinds of saturated gas, presence of additives, power and frequency of ultrasound, etc. [17,23].
We used an aqueous solution of luminol to locate the formation zone of radicals by ultrasound since the observation of sonoluminescence by bare eyes was limited due to its weak signal. Luminol (C8H6N3O2Na) is a chemical that exhibits chemiluminescence (luminescence occurred by a chemical reaction) [24]. When it reacts with an appropriate oxidizing agent (e.g., OH· radicals), it emits a blue light, so it is been used to detect radicals generated by ultrasound [25]. With luminol, it was much easier to locate zones of radical formation, where blue color appears in the right images of Figure 2, and they match well with those of sonoluminescence. With the 10% ultrasound intensity, band-type chemiluminescence arose at the top and middle regions (Figure 2a right image), but as the intensity increased, it appeared around the horn tip (Figure 2b,c, right images). Similar to sonoluminescence, the intensity of chemiluminescence became stronger as the ultrasound intensity increased but area of chemiluminescence appeared larger than that of sonoluminescence. The difference in the area results from different lifetime of ach luminescence. A mean lifetime of sonoluminescence by cavitation has been estimated as only 50~200 picoseconds [26] while that of OH· radicals is reported to be a few nanoseconds in water [27], and hence OH· radicals can diffuse further. In addition, luminol can diffuse even further once it reacts with OH· radicals, during which it continues to glow. The half-life of chemiluminescence of luminol can be from several minutes to hours [28]. With a low intensity of ultrasound such as 35.4 W/cm2 in our system, one can anticipate that sonolysis occurs throughout the reactor with a low degree of cavitation, but with a higher intensity of ultrasound, the region that sonolysis can occur reduces but cavitation grows stronger.
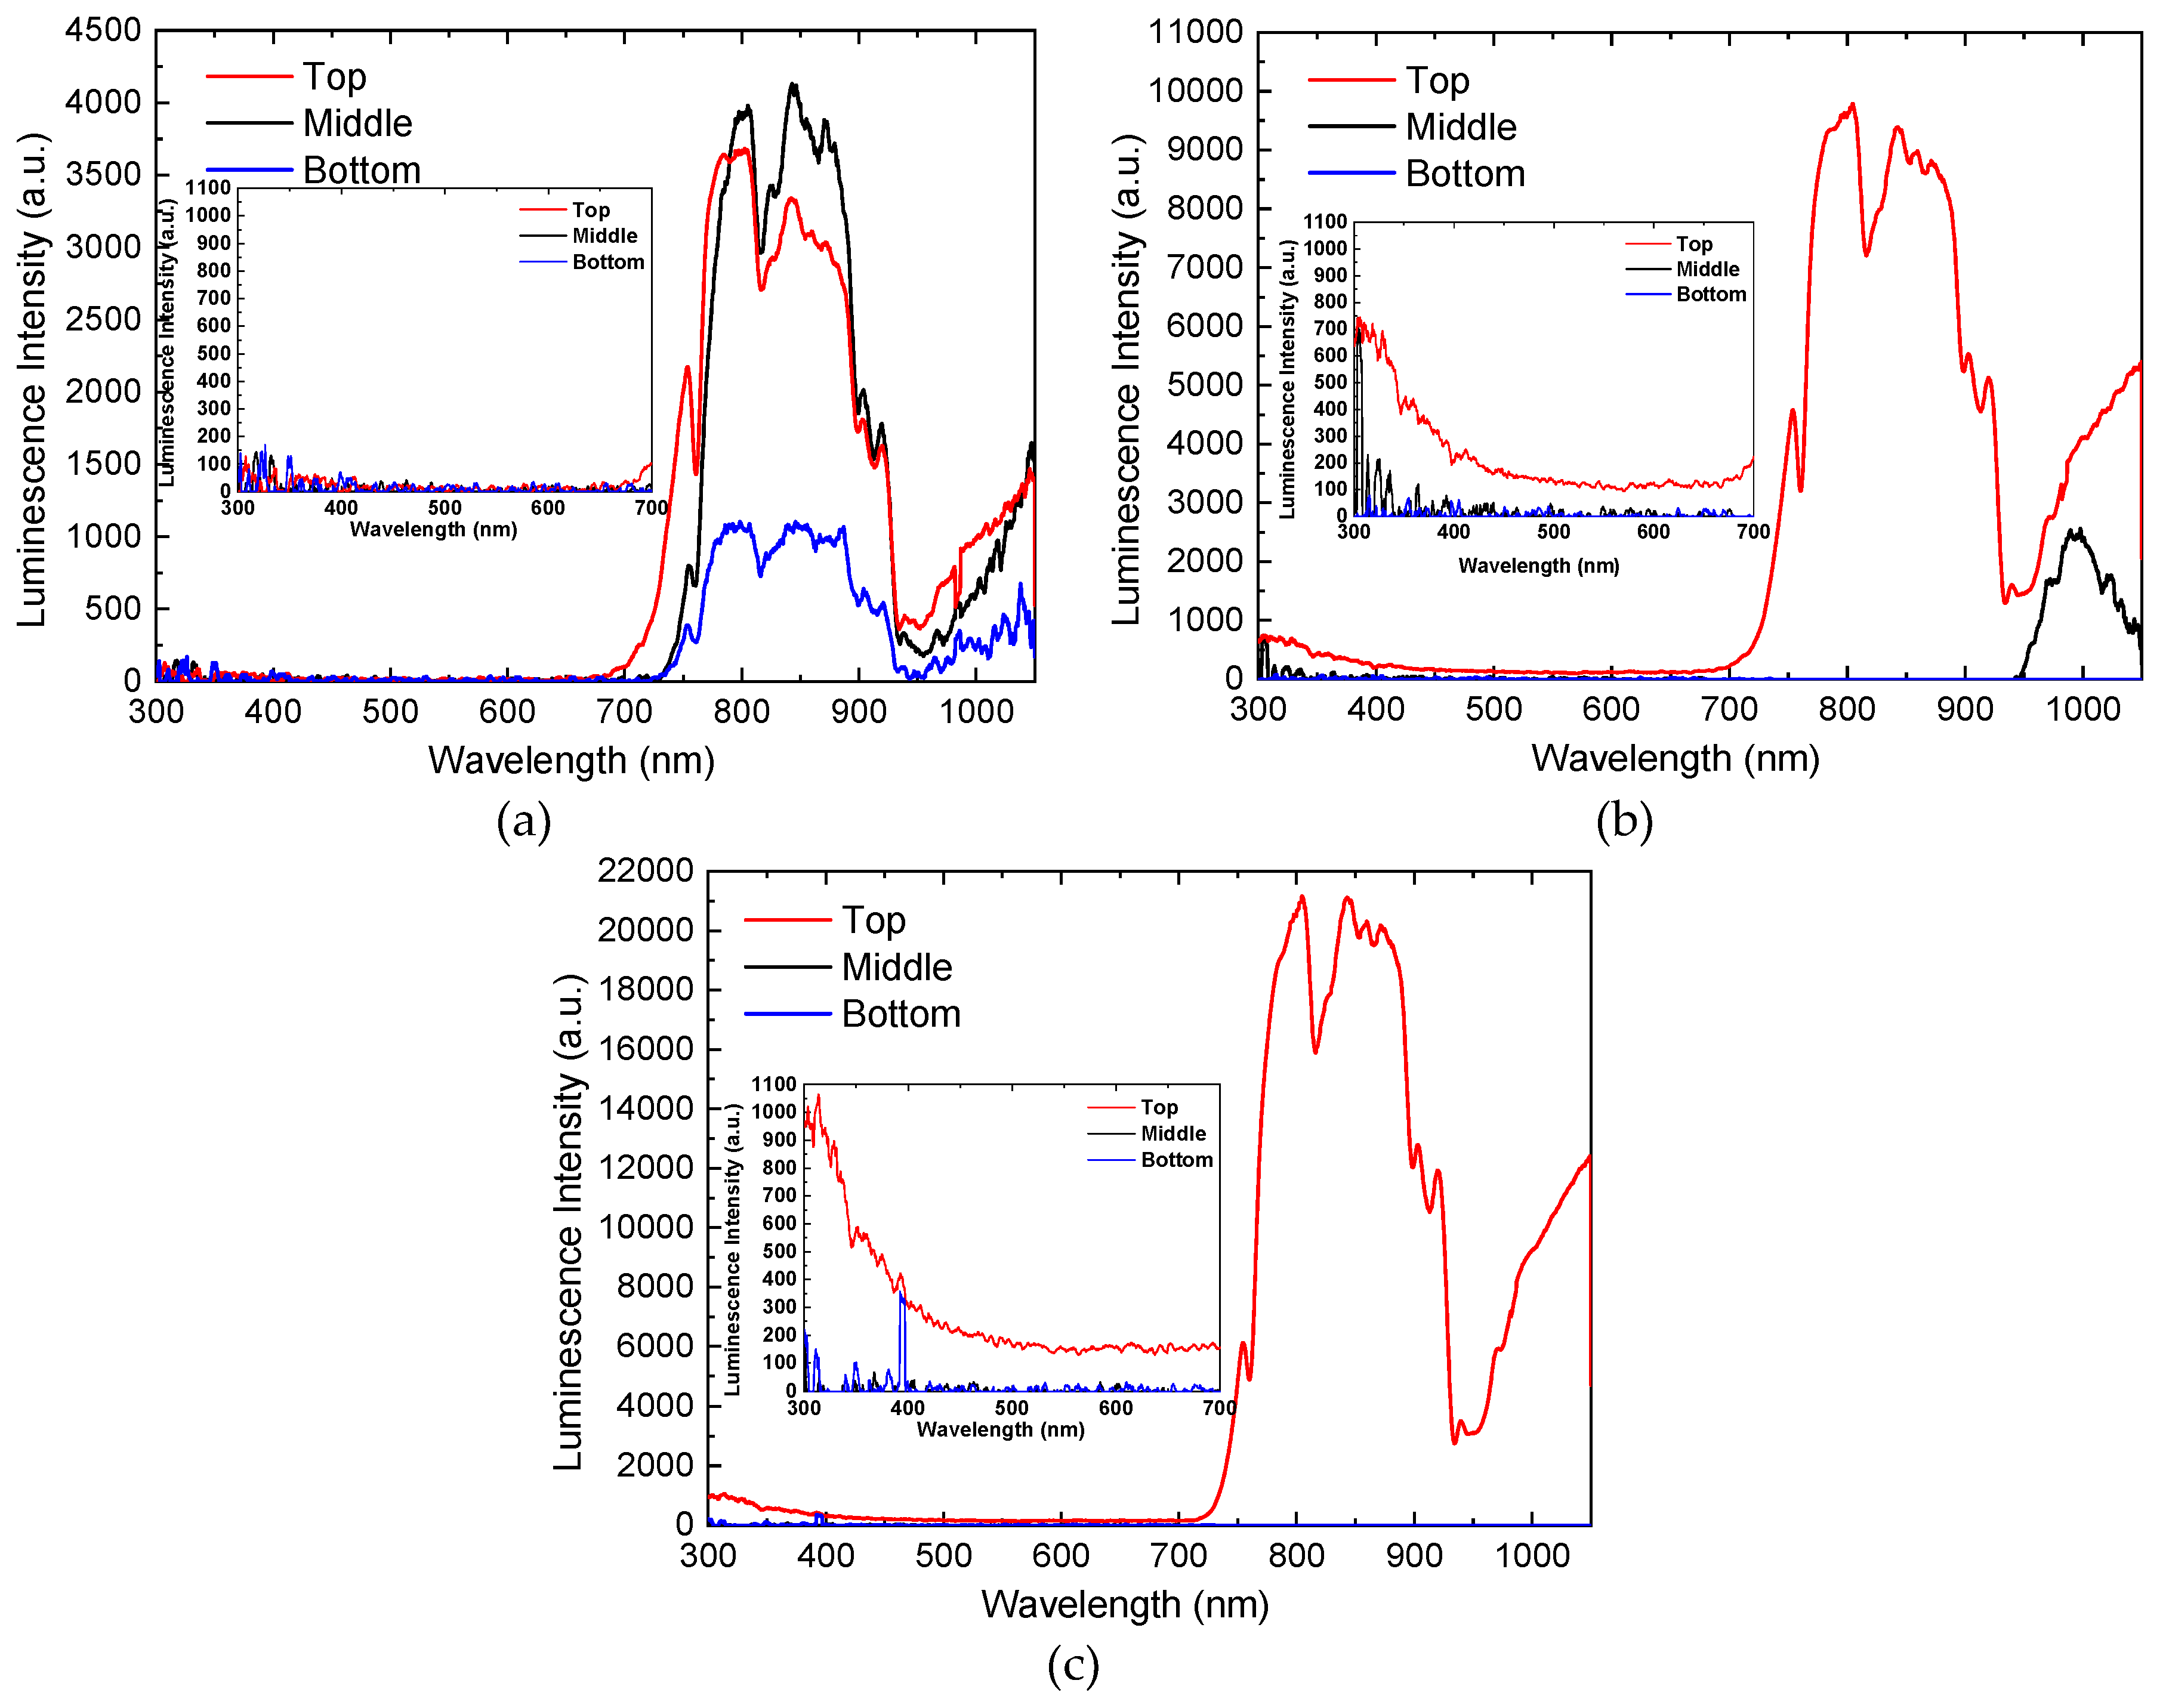
We then analyzed the sonoluminescence by PL spectroscopy using as a PMT detector, which can record the light signal from 300–1050 nm wavelength (Figure 1). We divided the reactor zone into three regions, namely top, middle, and bottom, and measured the luminescence intensity of those regions with different ultrasound power outputs (P = 10%, 30%, and 50%) (Figure 3). An inset in each figure is a PL spectrum of UV to visible range (300~700 nm) only. With the power output of 10%, little PL signal was found in the UV to visible range but a strong PL was found in near-IR (NIR) range, above 700 nm, for all three reactor zones while stronger NIR signals were detected from top and middle zones than that from bottom zone (Figure 3a), which matches well with photographic images of sono- and chemi-luminescence in Figure 2a. A deep concave region centered at ~950 nm was observed for all NIR PL, which is due to water in the reactor. It is well understood that water has a strong absorption of light in the NIR region [29]. When the ultrasound power outputs were increased to 30% and 50%, the NIR PL at the top zone became much stronger, reaching 2.8 and 5.4 times of PL observed at the top with the output of 10%, respectively (Figure 3b,c). As expected from Figure 2b,c, no or little PL was observed at the middle and bottom zones for both 30% and 50% outputs. PL in the UV and visible range (see inset spectra) appeared for power outputs of 30% and 50%, but only the top zones exhibited meaningful PL spectra, reaching 700 and 1000 luminescence values (a.u.) at the wavelength of 300 nm. However, this PL intensity is much lower than that of NIR, covering only ~5%. By this PL measurement, it became obvious that sonoluminescence occurs mostly in NIR range, and its intensity increases almost linearly to the ultrasonic power output. It was noted that PL in UV appears only when enough ultrasonic power is applied.

2.2. Sonolysis of Eosin B

Sonolysis of eosin B in an aqueous solution was conducted in the same condition that was used for the sonoluminescence measurement (Figure 1). At the concentration of 5 mg/L, eosin B degraded dramatically during the first 10 min after input of ultrasound, then the degradation proceeded slowly (Figure 4). The initial degradation of eosin B showed an almost linear relationship with ultrasound intensities but at the end of irradiation (t = 60 min), the ultrasound intensity of 10% showed much lower degradation than the higher intensities (49%, 78%, and 88% at P = 10%, 30%, and 50%, respectively), which indicates that sonolysis occurs more efficiently when high ultrasonic power is concentrated in a small area rather than spread throughout the reactor forming a standing wave. When TiO2 nanoparticles (P25) were added into the eosin B solution in darkness to examine its sonocatalytic activity, degree of the eosin B degradation was found almost unchanged at all ultrasound power outputs (P = 10%, 30%, and 50%), inferring that at this level of dosage (0.1 mg/mL), influence of TiO2 in sonolysis is marginal. Since it is known that the sonocatalytic activity of TiO2 varies with its dosage amounts, and is intrinsically much less than that of ZnO at a same dosage level [18], the dosage amount needs to be higher, e.g., 0.25 mg/mL or above to exhibit a meaningful contribution as a sonocatalyst [17]. In addition, it is considered that sonoluminescence generated by the ultrasonic cavitation was not strong enough to stimulate the photocatalytic activity of TiO2 since TiO2 absorbs light only below 380 nm [11], but the sonoluminescence intensity in this range is very low as shown in Figure 3. Therefore, in our ultrasound system, neither sonocatalytic influence of TiO2 nor photocatalytic activation by sonoluminescence was exhibited at a detectable level.

2.3. Influence of Sonolysis on Photocatalytic Activity of TiO2

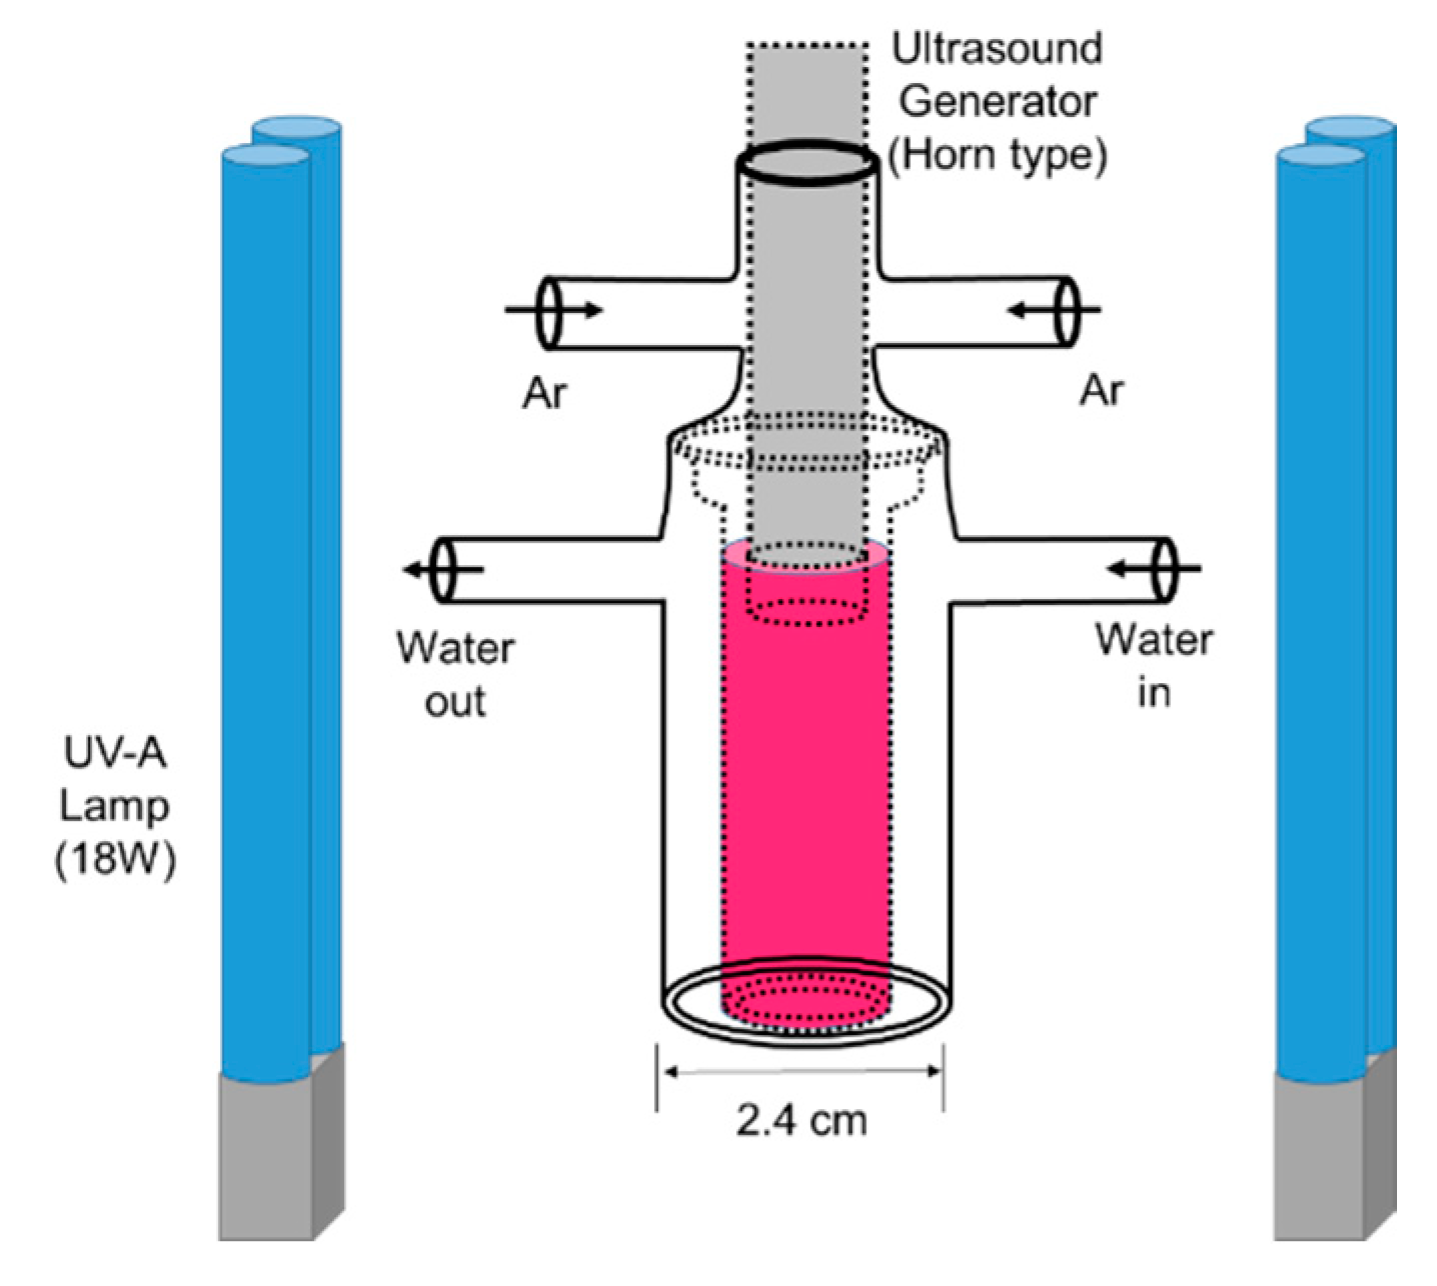
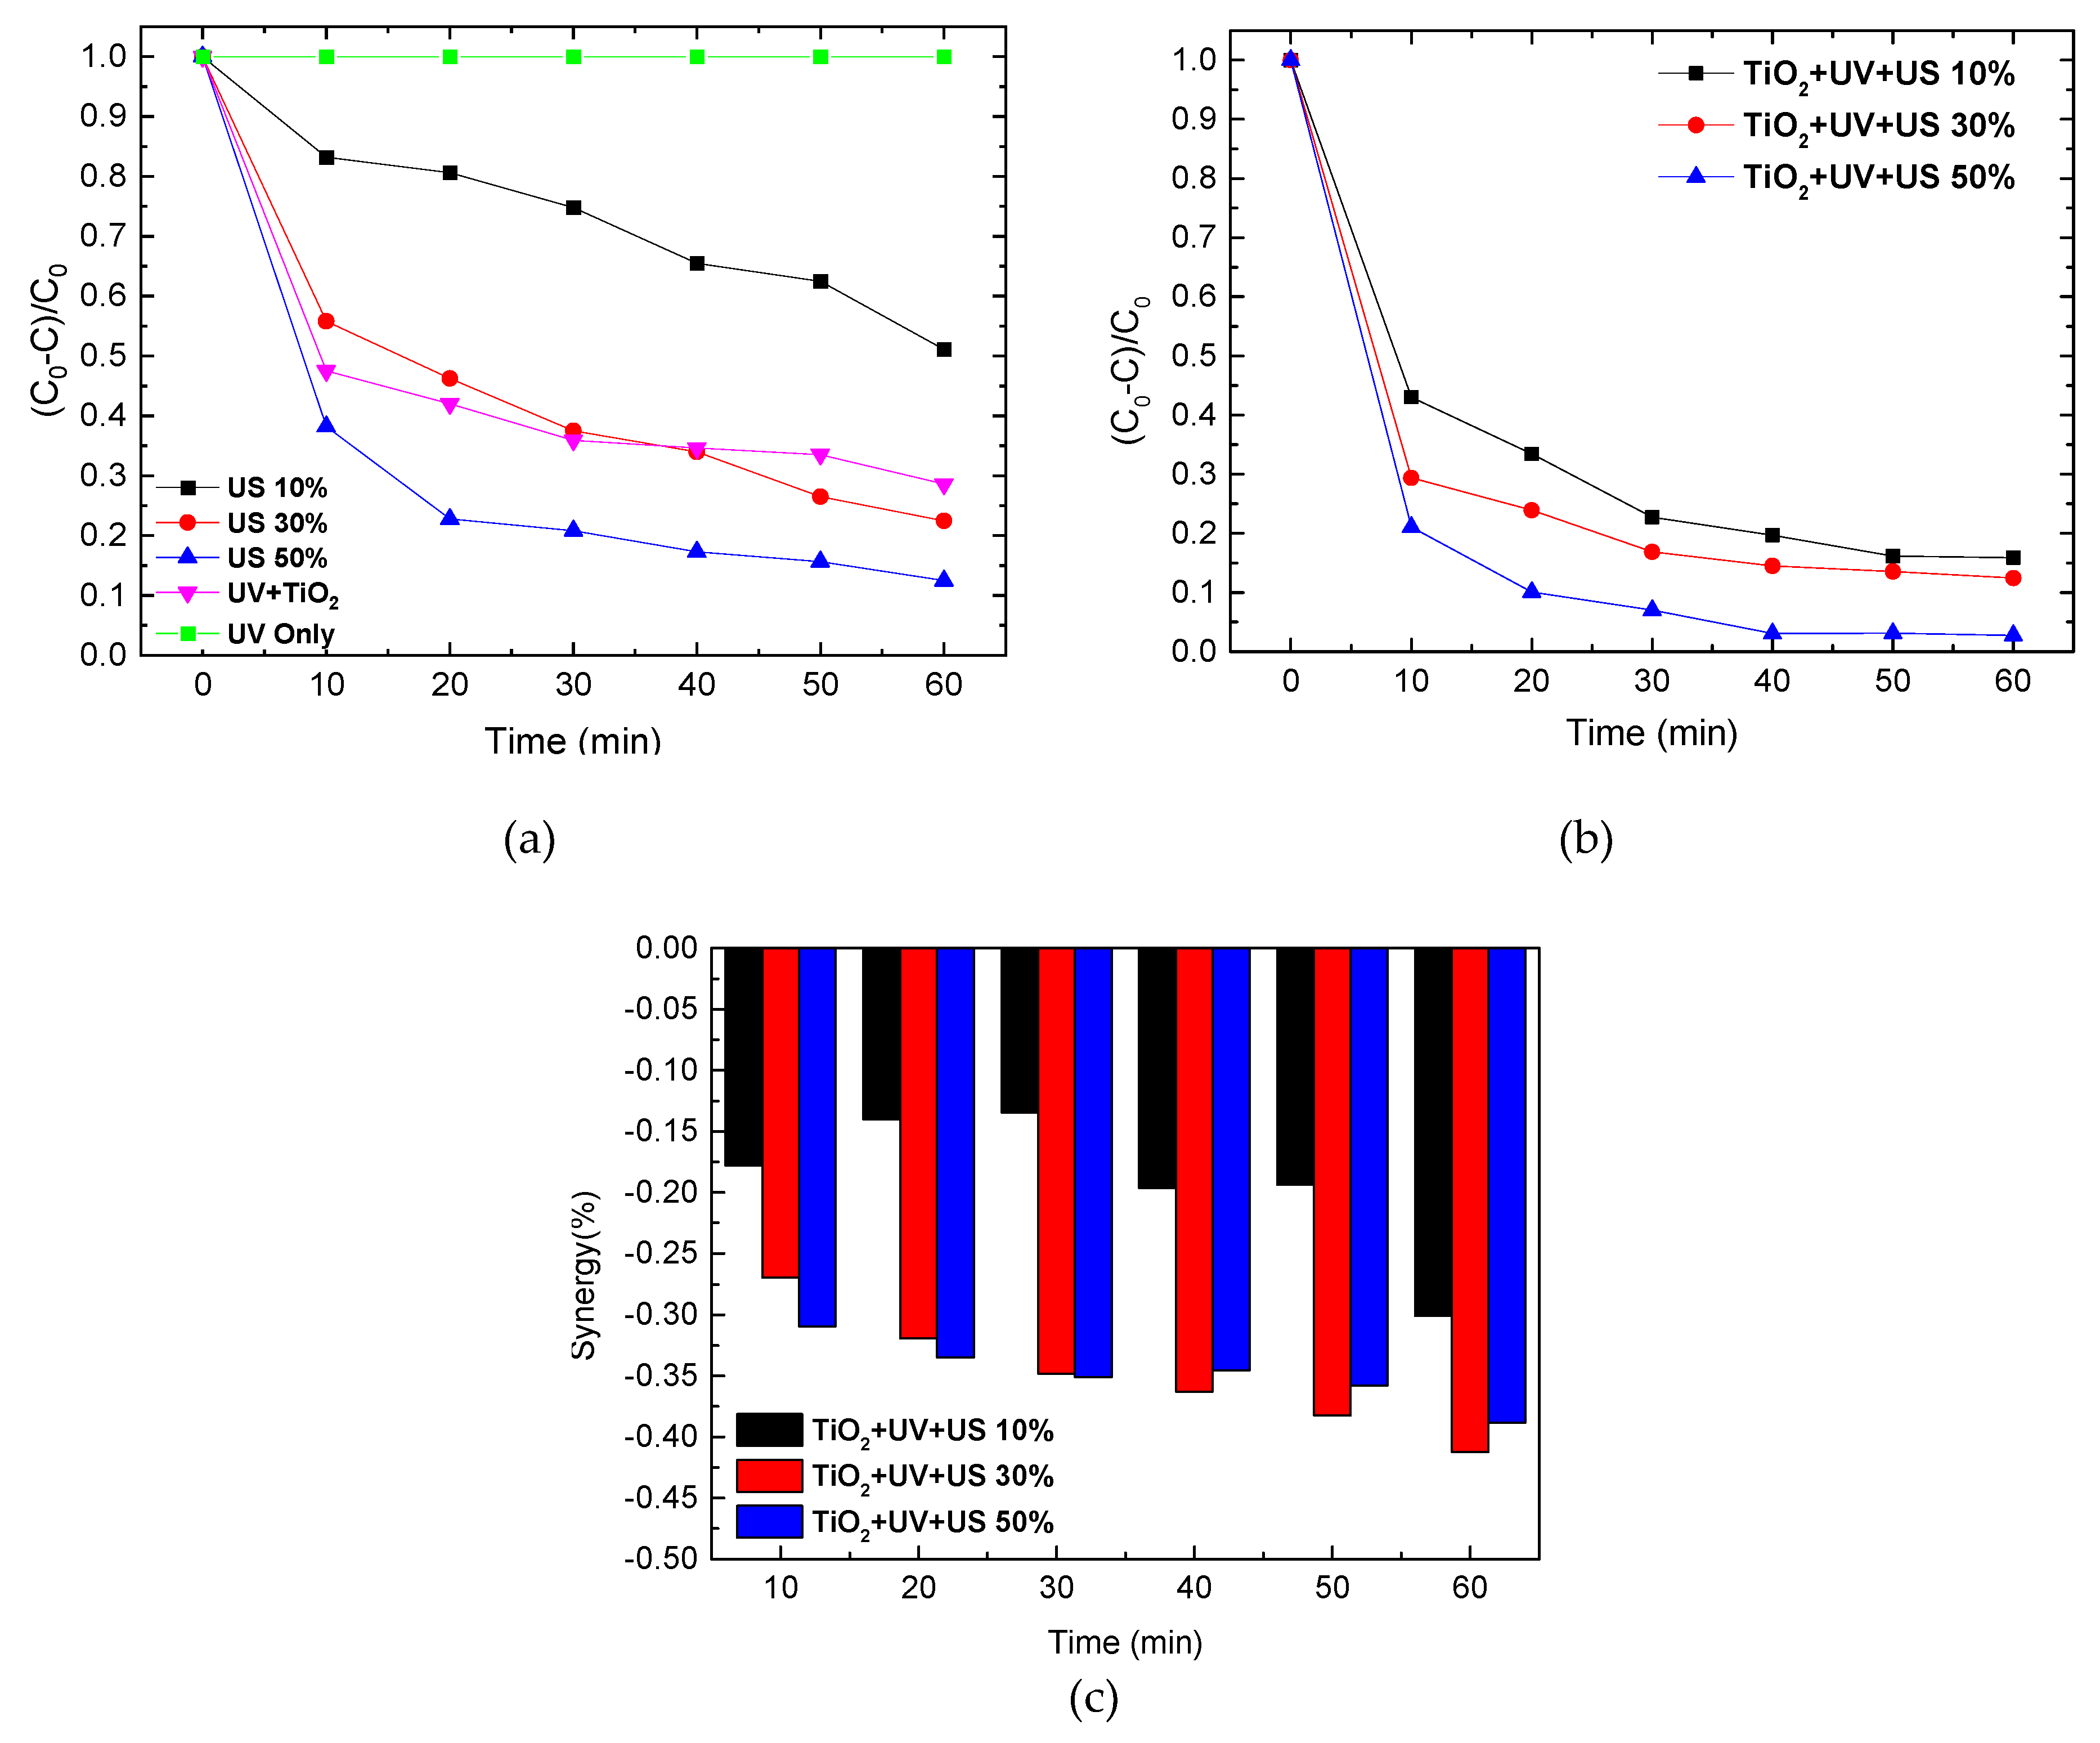
To study sonophotocatalytic activity of TiO2, we first analyzed photocatalytic activity of TiO2. An instrumental set-up for the analysis is depicted in Figure 5 (for photocatalysis, no ultrasound generator was used). TiO2 nanoparticles in a dosage of 0.1 mg/mL was dispersed in an aqueous solution of eosin B at a concentration of 5 mg/L. The colloidal mixture was stirred in darkness for 30 min to achieve an adsorption–desorption equilibrium of dyes on TiO2 surface prior to commencement of photocatalysis. For UV irradiation, two 18-W UV-A lamps were used as vertically aligned with the reactor (Figure 5). The photocatalytic activity was monitored for 60 min and the degradation efficiency was plotted as a function of time in Figure 6a. Unlike the sonocatalytic activity shown in Figure 4, the photocatalytic activity of TiO2 was found significant, reaching 70% degradation of eosin B within 60 min of UV irradiation, although the same low dosage was applied. It should be noted that no photolysis (degradation of dyes by light) of eosin B was observed under our experimental condition. When compared to sonolysis with different power outputs, the photocatalysis was similar to sonolysis with a power output of 30% (Figure 6a).
When ultrasound was coupled with the photocatalysis of TiO2, the degradation efficiency increased significantly at all three power outputs, as shown in Figure 6b. The low decomposition by sonolysis at the power output of 10% was dramatically improved, showing increased decomposition degree from 17% to 57% within 10 min of reaction. With the power outputs of 30% and 50%, the decomposition degree increased from 45% to 70% and 62% to 79% within 10 min, respectively. To quantify the synergetic effects of sonolysis and photocatalysis, we used the calculation suggested by Molhokar et. al, as in Equation (1) [18]. Each value of synergetic effect was obtained and plotted as a bar graph in Figure 6c. Interestingly, all sonophotocatalytic reactions showed negative effects regardless of reaction time and ultrasound power.
Synergy   Effect ( % ) = ( Decolorization   obtained with   sonophotocatalysis ) [ ( Decolorization   obtained with   sonolysis ) + ( Decolorization   obtained with   photocatalysis ) ] [ ( Decolorization   obtained with   sonolysis ) + ( Decolorization   obtained with   photocatalysis ) ] × 100
In fact, Molhokar et al. have been arguing that there is no synergy between sonolysis and photocatalysis [17,18]. In their paper published in 2011 [17], they examined the influence of sonoluminescence on sonophotocatalysis using surface active solutes for microbubbles [30] to scavenge OH∙ radicals but enhance sonoluminescence in the presence of TiO2 and found that the sonoluminescence does not activate TiO2. Although their results should be considered with care because those surface active solutes also adsorb on the surface of TiO2, inhibiting its interaction with dyes, we agree that the influence of sonoluminescence on sonophotocatalysis is negligible. To compare the light intensity of sonoluminescence to that of a UV lamp we used, we carried out a measurement of light intensity coming from the UV lamp under the same condition applied in our photocatalysis. There are many approximations since the UV light intensity was too high to be measured by our PMT detector, but a rough range of its intensity was calculated between 1000 and 10,000 times of that of sonoluminescence. Therefore, even if there is the photocatalytic degradation of dyes by sonoluminescence, its influence would hardly exceed 0.1% of that by external light sources.
Besides the weak sonoluminescence, the negative synergetic effects are attributed to the unfavorable effect of ultrasound to the heterogeneous photocatalysis—desorption of dyes from the surface of photocatalysts by its intense shock waves, reducing the probability of dye-photocatalysts interaction [18,19]. This argument also supports the less negative synergistic effect found with a lower ultrasonic power, P = 10% (black bar graphs in Figure 6c). Furthermore, increased turbidity caused by the ultrasonic dispersion of TiO2 can be another reason for the negative synergistic effect especially in the later stage of degradation since it inhibits the efficient transmission of UV light to the medium. Agreeing well with this hypothesis, the extent of negative synergistic effects for all power outputs grew larger towards the end of reaction when turbidity is more severe by accumulated fragmentation of TiO2. Considering that the unfavorable desorption of dyes by ultrasound, thereby low probability of dye-TiO2 interaction, is the major reason for the negative synergistic effect, we further investigated the synergistic effect in higher dye concentrations.
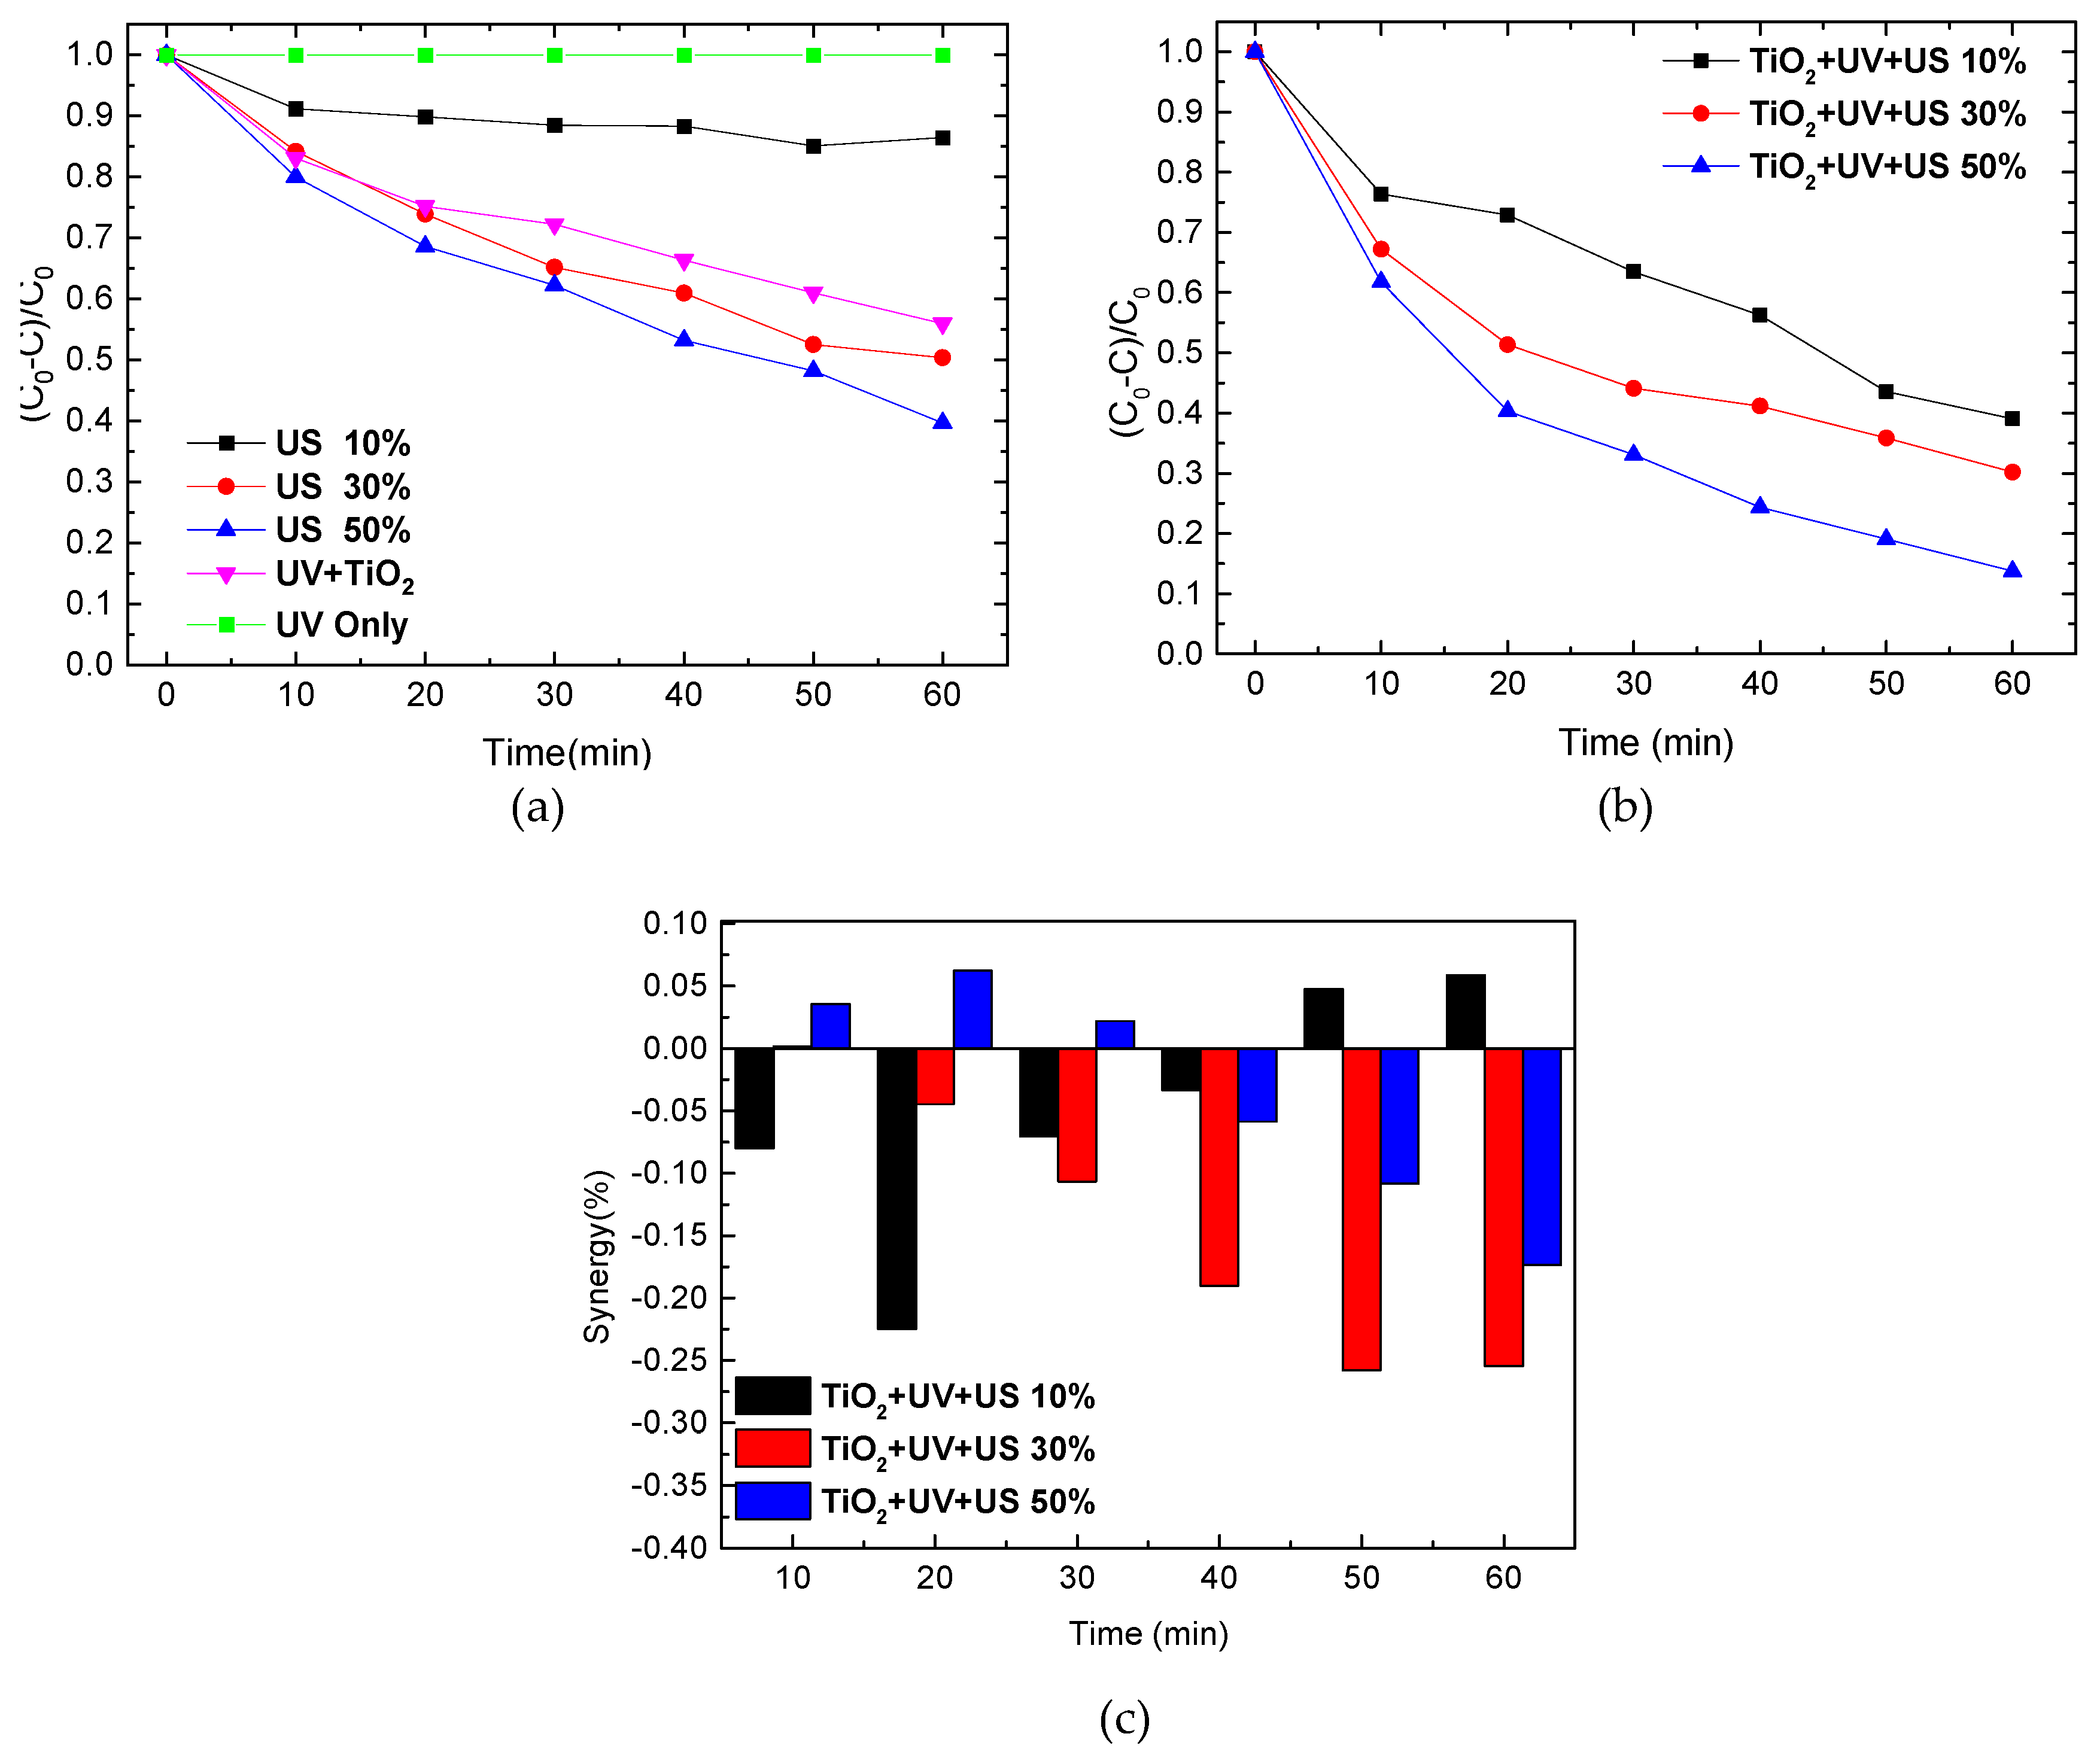
We fixed all conditions same but increased the eosin B concentration 4 times, to be 20 mg/L. Figure 7a represents the eosin B degradation by sonolysis and photocatalysis. Although degradation rates were retarded for all reactions due to the increased dye amount, the order of activities was quite similar to that in Figure 6a. When ultrasound was coupled with the photocatalysis of TiO2, the degradation efficiency increased significantly at all three power outputs, as shown in Figure 7b. The degradation by sonophotocatalysis within 20 min at the power outputs of 30% and 50% was almost twice as high as that by sonolysis alone, and the increase was even larger at the power output of 10% (from 11% to 27%). The synergistic effects at this high concentration of dyes were plotted as a bar graph in Figure 7c. Noticeable positive synergistic effects were observed with the power output of 50% within 30 min of reaction, while a zero synergistic effect was found with the power output of 30% within 10 min, both of which turned to negative as the reaction proceeded towards the end. Interestingly, an opposite trend was found with the power output of 10%, whereby a negative synergistic effect in the beginning turned to positive towards the end. As mentioned earlier, when cavitation occurs by ultrasound, shock waves are generated, which can interfere with the dye adsorption on TiO2 surface. Although such influence is detrimental to the photocatalytic activity of TiO2, especially when the dye concentration is low, it can play an important role in the detachment of excess dyes when the dye concentration is high. It is well known that there is an optimal concentration of dyes for heterogeneous photocatalysis because when the concentration is too low, the diffusion of dyes to the surface of photocatalyst becomes a rate limiting step whereas when it is too high, significant adsorption of dyes on the surface of photocatalyst occurs inhibiting light transmission to the photocatalyst and OH∙ radical formation. Therefore, in some cases of sonophotocatalysis, a negative effect is observed, and in other cases, a positive effect is seen. In the case of a high concentration of dyes, photocatalysis can greatly benefit from ultrasound since its shock waves can detach excess dyes on the surface of a photocatalyst and restore its activity. We consider that the positive synergistic effects found in Figure 7c ascribes to the acoustic activation of TiO2 as it removes excess dyes attached on it, which also explains why synergy becomes more positive with the higher power output. This argument also correlates with the changes of synergistic effects from positive to negative towards the end since the dye concentration keeps decreasing as the sonophotocatalytic reaction proceeds. Hence, the dye adsorption is no longer a problem towards the end of the reaction.
Regarding the interesting synergy pattern found at the power output of 10%, we have not found a good explanation, but the negative synergistic effects found in the early stage of reaction can be explained by intensity of cavitation that is too low to activate the TiO2 surface, which is anticipated by the low sonoluminescence signal in Figure 3a. Yet, the specific mechanism of sonophotocatalysis, especially with low ultrasound power, is not well elucidated and requires more research.

3. Methods

3.1. Chemicals and Instruments

Eosin B (0.1% aqueous solution, 1 g/L concentration) and luminol (C8H6N3O2Na) were purchased from Sigma Aldrich Co. (Darmstadt, Frankfurter, Germany) and TiO2 nanoparticles (P25) was purchased from Evonik (Essen, Germany). All aqueous solutions were made with doubly distilled water. A horn type ultrasound generator (Branson, Digital Sonifier 450, Danbury, CT, USA) with a power of 400 W and a frequency of 20 kHz was used for ultrasound irradiation. Degradation of eosin B was monitored using a UV-vis spectrophotometer (Varian, UV-vis Cary 100, Palo Alto, CA, USA). A centrifuge (hanil, combi 514R, Gimpo, Gyeonggi-do, Korea) was used to separate the catalyst from the solution after each reaction. Luminescence was recorded for 10 min in a darkroom by a camera (Canon, EOS 80D, Ota, Tokyo, Japan), of which the f value is 1.4 at ISO 3200. Photoluminescence spectra were measured by a PSI fluorometer (PSI Trading, PLPLE-500, Suwon, Gyeonggi-do, Korea) equipped with an optical cable and a PMT detector whose detection range covers 300–1050 nm. For the measurement of photoluminescence by ultrasound, the optical cable was installed to make a close contact with the outer surface of the reactor as shown in Figure 1. For the measurement of light intensity from a UV lamp (UV-A (18W)), we placed a light attenuator of 0.1% and a glass reactor filled with water between the UV lamp and PMT detector and calculated the intensity value in our experimental set-up, by estimating measured intensities in a series of distances from the light source.

3.2. Sonoluminescence

Sonoluminescence analysis were conducted with a control of power outputs (P) of 10, 30 and 50%, which equal to 35.4, 106.1, and 176.8 W/cm2, respectively, considering the horn tip size of 12.5 mm [31]. Since the ultrasound irradiation generates heat, the reactor was water cooled and temperature was maintained to be 10 °C ± 1.5 °C. pH was monitored after several sono-reactions and was 5.9 on average. Ar gas was supplied during all sono-reactions to induce strong cavitation [21]. Ar pressure was kept constant at 1.2 bar and the ultrasound irradiation was initiated after 5 min degassing with Ar gas. Luminol (10 mM) was used to obtain blue light images of radicals, which are generated by aminophthalate, a decomposed product of luminol by OH· radicals.

3.3. Sonolysis, Photocatalysis and Sonophotocatalysis of Eosin B

All sono- and photo-reactions were conducted in a glass reactor (22 mm (h), 80 mm (l)) equipped with a cooling jacket to minimize the influence of heat. Aqueous solutions of eosin B in two different concentrations, 5 and 20 mg/L, were prepared by diluting the 0.1% original solution and used for organic dye degradation. For photocatalysis, two UV-A (18 W) lamps were used, with a vertical set-up as shown in Figure 5. and 30 mL of the eosin B solution was used in each reaction. A low dosage of TiO2, 3 mg (0.1 mg/mL), was used for each reaction to minimize the influence on viscosity and number of generated bubbles [18,19]. Before the commencement of sono- and photo-catalysis, TiO2 particles were stirred in the eosin B solution for 30 min in darkness to achieve adsorption–desorption equilibrium on TiO2 surface. During photocatalysis, stirring was performed at 500 rpm to evenly disperse TiO2 nanoparticles. After each run, the colloidal solution was centrifuged at 13,500 rpm for 10 min to separate particles from solution, and absorption changes of eosin B were analyzed by a UV-vis spectrophotometer. Each run was repeated at least three times and an average absorption value was used to calculate the degradation efficiency.

4. Conclusions

We systematically analyzed the occurrence of sonoluminescence and sonolysis of eosin B along with the intensity of ultrasound and found that sonolysis occurs more efficiently when high intensity ultrasonic power is concentrated in a small area than spread throughout the reactor forming a standing wave. We also observed that the light intensity of sonoluminescence is high in the NIR range but extremely low in the UV range so that it will barely excite photocatalysts. In our reaction system, the synergistic effects of sonophotocatalysis were found to rely a lot on the dye concentration. At the concentration of 5 mg/L, all synergistic effects were found negative whereas at the concentration of 20 mg/L, positive synergistic effects were shown in the early stage of reaction with the high ultrasound power. It was concluded that the positive synergy can be ascribed to the ultrasound effect on the detachment of excess dyes on TiO2 surface. We were able to explain most synergistic effects we found based on dynamics of dye adsorption and desorption, except the positive synergistic effects shown with a low ultrasound power towards the end of reaction.

Author Contributions

Conceptualization and Methodology, Y.C., S.H. and J.Y.L.; Formal Analysis and Data Curation, S.K..; Writing—Original Draft Preparation, D.L., Y.C., B.D. and S.K.; Writing—Review & Editing, and Supervision, J.C. and S.-H.C.; Project Administration and Funding Acquisition, S.-H.C. All authors have read and agreed to the published version of the manuscript.

Funding

This research was funded by the Technology Innovation Program of the Ministry of Trade, Industry & Energy of South Korea, grant number [#10052730] and KIST institutional funding, grant number [#2E30710].

Conflicts of Interest

The authors declare no conflicts of interest.

References

  1. Oturan, M.A.; Aaron, J.J. Advanced Oxidation Processes in Water/Wastewater Treatment: Principles and Applications. A Review. Crit. Rev. Environ. Sci. Technol. 2014, 44, 2577–2641. [Google Scholar] [CrossRef]
  2. Adewuyi, Y.G. Sonochemistry in environmental remediation. 1. Combinative and hybrid sonophotochemical oxidation processes for the treatment of pollutants in water. Environ. Sci. Technol. 2005, 39, 3409–3420. [Google Scholar] [CrossRef] [PubMed]
  3. Madhavan, J.; Kumar, P.S.S.; Anandan, S.; Zhou, M.; Grieser, F.; Ashokkumar, M. Ultrasound assisted photocatalytic degradation of diclofenac in an aqueous environment. Chemosphere 2010, 80, 747–752. [Google Scholar] [CrossRef] [PubMed]
  4. Chakma, S.; Moholkar, V.S. Physical mechanism of sono-Fenton process. AIChE J. 2013, 59, 4303–4313. [Google Scholar] [CrossRef]
  5. Asghar, A.; Raman, A.A.A.; Daud, W.M.A.W. Advanced oxidation processes for in-situ production of hydrogen peroxide/hydroxyl radical for textile wastewater treatment: A review. J. Clean. Prod. 2015, 87, 826–838. [Google Scholar] [CrossRef] [Green Version]
  6. Reuter, F.; Mettin, R. Mechanisms of single bubble cleaning. Ultrason. Sonochem. 2016, 29, 550–562. [Google Scholar] [CrossRef]
  7. Suslick, K.S.; Didenko, Y.; Fang, M.M.; Hyeon, T.; Kolbeck, K.J.; McNamara, W.B.; Mdleleni, M.M.; Wong, M. Acoustic cavitation and its chemical consequences. Philos. Trans. R. Soc. A 1999, 357, 335–353. [Google Scholar] [CrossRef]
  8. Skorb, E.V.; Fix, D.; Shchukin, D.G.; Möhwald, H.; Sviridov, D.V.; Mousa, R.; Wanderka, N.; Schäferhans, J.; Pazos-Pérez, N.; Fery, A. Sonochemical formation of metal sponges. Nanoscale 2011, 3, 985–993. [Google Scholar] [CrossRef]
  9. Cravotto, G.; Gaudino, E.C.; Cintas, P. On the mechanochemical activation by ultrasound. Chem. Soc. Rev. 2013, 42, 7521–7534. [Google Scholar] [CrossRef] [Green Version]
  10. Qiu, P.; Park, B.; Choi, J.; Thokchom, B.; Pandit, A.B.; Khim, J. A review on heterogeneous sonocatalyst for treatment of organic pollutants in aqueous phase based on catalytic mechanism. Ultrason. Sonochem. 2018, 45, 29–49. [Google Scholar] [CrossRef]
  11. Hoffmann, M.R.; Martin, S.T.; Choi, W.; Bahnemann, D.W. Environmental applications of semiconductor photocatalysis. Chem. Rev. 1995, 95, 69–96. [Google Scholar] [CrossRef]
  12. Mahamuni, N.N.; Adewuyi, Y.G. Advanced oxidation processes (AOPs) involving ultrasound for waste water treatment: A review with emphasis on cost estimation. Ultrason. Sonochem. 2010, 17, 990–1003. [Google Scholar] [CrossRef] [PubMed]
  13. Adewuyi, Y.G. Sonochemistry in environmental remediation. 2. Heterogeneous sonophotocatalytic oxidation processes for the treatment of pollutants in water. Environ. Sci. Technol. 2005, 39, 8557–8570. [Google Scholar] [CrossRef] [PubMed]
  14. Lops, C.; Ancona, A.; Di Cesare, K.; Dumontel, B.; Garino, N.; Canavese, G.; Hérnandez, S.; Cauda, V. Sonophotocatalytic degradation mechanisms of Rhodamine B dye via radicals generation by micro-and nano-particles of ZnO. Appl. Catal. B Environ. 2019, 243, 629–640. [Google Scholar] [CrossRef] [PubMed]
  15. Yao, Y.; Sun, M.; Yuan, X.; Zhu, Y.; Lin, X.; Anandan, S. One-step hydrothermal synthesis of N/Ti3+ co-doping multiphasic TiO2/BiOBr heterojunctions towards enhanced sonocatalytic performance. Ultrason. Sonochem. 2018, 49, 69–78. [Google Scholar] [CrossRef]
  16. Soltani, R.D.C.; Jorfi, S.; Ramezani, H.; Purfadakari, S. Ultrasonically induced ZnO-biosilica nanocomposite for degradation of a textile dye in aqueous phase. Ultrason. Sonochem. 2016, 28, 69–78. [Google Scholar] [CrossRef]
  17. Balaji, C.; Moholkar, V.S.; Pandit, A.B.; Ashokkumar, M. Mechanistic investigations on sonophotocatalytic degradation of textile dyes with surface active solutes. Ind. Eng. Chem. Res. 2011, 50, 11485–11494. [Google Scholar] [CrossRef]
  18. Chakma, S.; Moholkar, V.S. Investigation in mechanistic issues of sonocatalysis and sonophotocatalysis using pure and doped photocatalysts. Ultrason. Sonochem. 2015, 22, 287–299. [Google Scholar] [CrossRef]
  19. Gogate, P.R.; Pandit, A.B. Sonophotocatalytic reactors for wastewater treatment: A critical review. AIChE J. 2004, 50, 1051–1079. [Google Scholar] [CrossRef]
  20. Mahdavi, R.; Talesh, S.S.A. Enhancement of ultrasound-assisted degradation of Eosin B in the presence of nanoparticles of ZnO as sonocatalyst. Ultrason. Sonochem. 2019, 51, 230–240. [Google Scholar] [CrossRef]
  21. Rooze, J.; Rebrov, E.V.; Schouten, J.C.; Keurentjes, J.T. Dissolved gas and ultrasonic cavitation—A review. Ultrason. Sonochemistry 2013, 20, 1–11. [Google Scholar] [CrossRef] [PubMed]
  22. Didenko, Y.T.; Pugach, S.P. Spectra of Water Sonoluminescence. J. Phys. Chem. 1994, 98, 9742–9749. [Google Scholar] [CrossRef]
  23. Ji, R.; Pflieger, R.; Virot, M.; Nikitenko, S.I. Multibubble Sonochemistry and Sonoluminescence at 100 kHz: The Missing Link between Low- and High-Frequency Ultrasound. J. Phys. Chem. B 2018, 122, 6989–6994. [Google Scholar] [CrossRef] [PubMed]
  24. Luminol. Available online: https://en.wikipedia.org/wiki/Luminol (accessed on 8 January 2020).
  25. McMurray, H.N.; Wilson, B.P. Mechanistic and spatial study of ultrasonically induced luminol chemiluminescence. J. Phys. Chem. A 1999, 103, 3955–3962. [Google Scholar] [CrossRef]
  26. Crum, L.A.; Mason, T.J.; Reisse, J., Suslick. Sonochemistry and Sonoluminescence; Kluwer Academic Publishers: Dordrecht, The Netherlands, 1999; pp. 225–246. [Google Scholar]
  27. Janzen, E.G.; Kotake, Y.; Hinton, R.D. Stabilities of Hydroxyl Radical Spin Adducts of Pbn-Type Spin Traps. Free Radic. Biol. Med. 1992, 12, 169–173. [Google Scholar] [CrossRef]
  28. Khan, P.; Idrees, D.; Moxley, M.A.; Corbett, J.A.; Ahmad, F.; von Figura, G.; Sly, W.S.; Waheed, A.; Hassan, M.I. Luminol-based chemiluminescent signals: Clinical and non-clinical application and future uses. Appl. Biochem. Biotechnol. 2014, 173, 333–355. [Google Scholar] [CrossRef] [Green Version]
  29. Electromagnetic Absorption by Water. Available online: https://en.wikipedia.org/wiki/Electromagnetic_absorption_by_water (accessed on 23 February 2020).
  30. Ashokkumar, M.; Grieser, F. The effect of surface active solutes on bubbles in an acoustic field. Phys. Chem. Chem. Phys. 2007, 9, 5631–5643. [Google Scholar] [CrossRef]
  31. Rayaroth, M.P.; Aravind, U.K.; Aravindakumar, C.T. Sonochemical degradation of Coomassie Brilliant Blue: Effect of frequency, power density, pH and various additives. Chemosphere 2015, 119, 848–855. [Google Scholar] [CrossRef]
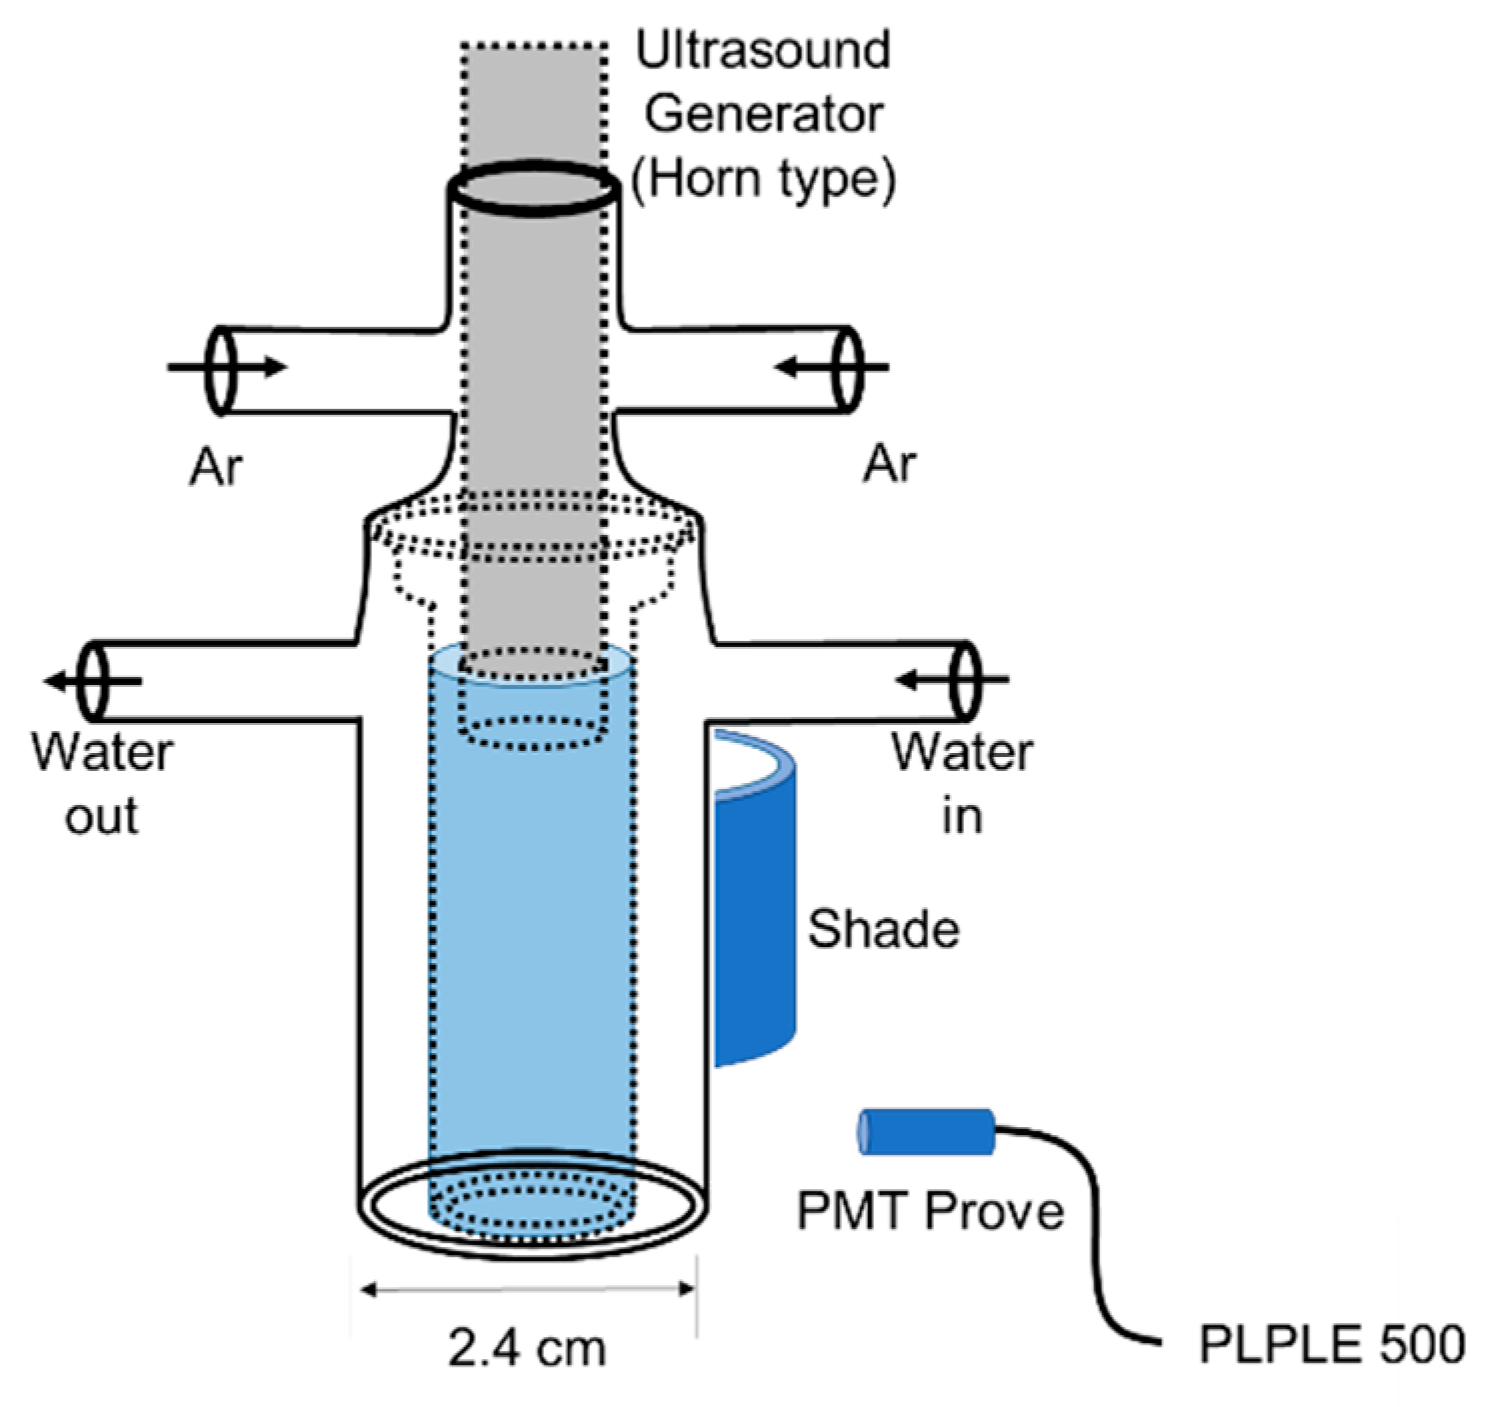
Figure 1. Experimental set-up for sonoluminescence measurement by a PMT detector.
Catalysts 10 00500 g001
Figure 2. Photographic images of sonoluminescence (left images) and chemiluminescence (right images) in water at different ultrasound power outputs (P), (a) 10, (b) 30, and (c) 50%.
Catalysts 10 00500 g002
Figure 3. PL spectra of sonoluminescence recorded at three different zones of the ultrasound reactor (top (red line), middle (black line), and bottom (blue line)) with P = (a) 10, (b) 30, and (c) 50%. Inset spectra are UV to visible light range only.
Catalysts 10 00500 g003
Figure 4. Eosin B degradation as a function of time by sonolysis with and without TiO2 at different ultrasound power outputs (P = 10, 30, and 50%) in darkness.
Catalysts 10 00500 g004
Figure 5. Experimental set-up for sonophotocatalysis of TiO2 for eosin B degradation.
Catalysts 10 00500 g005
Figure 6. Eosin B (5 mg/L) degradation as a function of time (a) by sonolysis (US), photolysis (UV only), and photocatalysis with TiO2 (UV + TiO2); (b) by sonophotocatalysis with TiO2 (TiO2 + UV + US) at different ultrasound power outputs (P = 10, 30, and 50%); and (c) synergistic effect (%) calculated by dye degradation by sonophotocatalysis versus that by individual contributions of sonolysis and photocatalysis, at different ultrasound power outputs (P = 10, 30, and 50%).
Catalysts 10 00500 g006
Figure 7. Eosin B (10 mg/L) degradation as a function of time (a) by sonolysis (US), photolysis (UV only), and photocatalysis with TiO2 (UV + TiO2); (b) by sonophotocatalysis with TiO2 (TiO2 + UV + US) at different ultrasound power outputs (P = 10, 30, and 50%); and (c) synergistic effect (%) calculated by dye degradation by sonophotocatalysis versus that by individual contributions of sonolysis and photocatalysis, at different ultrasound power outputs (P = 10, 30, and 50%).
Catalysts 10 00500 g007