Article

Enhancement of Photocatalytic Oxidation of Glucose to Value-Added Chemicals on TiO2 Photocatalysts by A Zeolite (Type Y) Support and Metal Loading

by
Kamonchanok Roongraung
1,2,
Surawut Chuangchote
3,4,* and
Navadol Laosiripojana
1,2
1
The Joint Graduate School of Energy and Environment, King Mongkut’s University of Technology Thonburi (KMUTT), 126 Prachauthit Rd., Bangmod, Thungkru, Bangkok 10140, Thailand
2
Center for Energy Technology and Environment, Ministry of Education, Bangkok 10140, Thailand
3
Department of Tool and Materials Engineering, Faculty of Engineering, King Mongkut’s University of Technology Thonburi (KMUTT), 126 Prachauthit Rd., Bangmod, Thungkru, Bangkok 10140, Thailand
4
Research Center of Advanced Materials for Energy and Environmental Technology (MEET), King Mongkut’s University of Technology Thonburi (KMUTT), 126 Prachauthit Rd., Bangmod, Thungkru, Bangkok 10140, Thailand
*
Author to whom correspondence should be addressed.
Catalysts 2020, 10(4), 423; https://doi.org/10.3390/catal10040423
Submission received: 29 February 2020 / Revised: 28 March 2020 / Accepted: 29 March 2020 / Published: 13 April 2020
(This article belongs to the Special Issue Recent Advances in TiO2 Photocatalysts)

Abstract

:
TiO2-based photocatalysts synthesized by the microwave-assisted sol-gel method was tested in the photocatalytic glucose conversion. Modifications of TiO2 with type-Y zeolite (ZeY) and metals (Ag, Cu, and Ag-Cu) were developed for increasing the dispersion of TiO2 nanoparticles and increasing the photocatalytic activity. Effects of the TiO2 dosage to zeolite ratio (i.e., TiO2/ZeY of 10, 20, 40, and 50 mol %) and the silica to alumina ratio in ZeY (i.e., SiO2:Al2O3 of 10, 100, and 500) were firstly studied. It was found that the specific surface area of TiO2/ZeY was 400–590 m2g−1, which was higher than that of pristine TiO2 (34.38 m2g−1). The good properties of 20%TiO2/ZeY photocatalyst, including smaller particles (13.27 nm) and high surface area, could achieve the highest photocatalytic glucose conversion (75%). Yields of gluconic acid, arabinose, xylitol, and formic acid obtained from 20%TiO2/ZeY were 9%, 26%, 4%, and 35%, respectively. For the effect of the silica to alumina ratio, the highest glucose conversion was obtained from SiO2:Al2O3 ratio of 100. Interestingly, it was found that the SiO2:Al2O3 ratio affected the selectivity of carboxylic products (gluconic acid and formic acid). At a low ratio of silica to alumina (SiO2:Al2O3 = 10), higher selectivity of the carboxylic products (gluconic acid = 29% and formic acid = 32%) was obtained (compared with other higher ratios). TiO2/ZeY was further loaded by metals using the microwave-assisted incipient wetness impregnation technique. The highest glucose conversion of 96.9 % was obtained from 1 wt. % Ag-TiO2 (40%)/ZeY. Furthermore, the bimetallic Ag-Cu-loaded TiO2/ZeY presented the highest xylitol yield of 12.93%.

Graphical Abstract

1. Introduction

Nowadays, biomass is an important feedstock that can be used for chemical production. The main advantage of biomass is zero CO2 emission [1]. The biomass has three main components, which are cellulose, hemicellulose, and lignin. Glucose is a sugar monomer in the structure of cellulose that is one of biomass derivatives. Recently, many researches into glucose conversion are extensively studied in oxidation reactions to obtain high value products (e.g., gluconic acid, arabinose, xylitol, etc.). The synthesis of high value products from biomass can be performed via platform molecules, which can be used as building blocks for biorefinery. From a previous study of platform molecules, gluconic acid was found to be the one of important building blocks for the medical, foodstuff, and fuel industries, which can be produced via oxidation of glucose [2]. Chemicals can be generally produced from many technologies, such as fermentation [3] and the Fischer-Tropsch process [4]. Conversely, they required high-energy consumption, operated under high-pressure-temperature condition, and there are many steps to produce chemicals. Photocatalysis is one of green synthesis can produce chemicals in one step at mild conditions. It can be described as the acceleration of a chemical reaction by light with a semiconductor catalyst to oxidize or reduce substances into photocatalytic-derived products. In addition, this process can be considered as an environmentally friendly method [5]. From many different photocatalysts, titanium dioxide (TiO2) is a promising photocatalyst for several applications, such as organic pollutants degradation [6], production of hydrogen [7], and dye sensitized solar cells [8]. Its advantages are highly oxidative, chemically stable, inexpensive, and nontoxic [9]. However, there are some disadvantages of bare TiO2, such as high agglomeration, difficulty to separate or recycle from the solution, and a high energy band gap. This disadvantage results in a smaller effective surface area, and subsequently causes lower photocatalytic activity. Low selectivity is another limitation in TiO2 photocatalysts. Among several researches, the addition of supports such as silica (SiO2), alumina (Al2O3), or zeolite for TiO2 dispersion has been studied, due to it is an interesting method for increasing photocatalytic activity [10,11,12,13]. Among them, zeolite is a suitable support, because it has unique structure, uniform pores, and a high surface area. Colmenares J.C., et al. [14] synthesized TiO2 supported on zeolite that can increase the selectivity of photocatalysts in glucose conversion for producing gluconic acid and glucaric acid compared with pristine TiO2 and commercial Evonik P-25. To our knowledge, no prior study has examined the optimal dosage of TiO2 on zeolite and the effect of the ratio of SiO2 to Al2O3 in zeolite structure for increasing photocatalytic activity. In addition, the loading of metals into TiO2 nanoparticles is one of techniques to improve TiO2 properties, such as reducing the energy band gap. Metal ion-loading into TiO2 has been widely studied. Inexpensive metals, e.g. Ag, are ones of the interesting metals. It was reported that Ag dopant effectively increases the photocatalytic activity of TiO2 photocatalysts [15]. In this work, TiO2 was synthesized by the microwave-assisted sol-gel method and modified with zeolite supports for improving the dispersion and selectivity of the photocatalyst in photocatalytic glucose conversion. The effects of TiO2 dosages on zeolite and ratios of SiO2 to Al2O3 on photocatalytic activities were studied. Moreover, TiO2/ZeY was modified by metal loading using microwave-assisted incipient wetness impregnation for reducing the energy band gap. The effect of metal (Ag) contents were studied for optimizing the suitable conditions to get the highest photocatalytic glucose conversion.

2. Results and Discussion

2.1. Effect of Ratio of TiO2 to ZeY

2.1.1. Characterizations

The effect of TiO2 dosages on ZeY (TiO2/ZeY) (varying as 10, 20, 40, and 50 mol %) on the physical and chemical properties of the samples was studied via a number of characterizations. Figure 1 shows the SEM images of surface morphology of ZeY, TiO2, and TiO2/ZeY photocatalysts. It was found that the characteristic morphology of ZeY changed with increasing TiO2 content, because TiO2 was dispersed on the ZeY surface [16,17]. The particle size of TiO2/ZeY was found to increase with increasing TiO2 content (see Table 1). At low TiO2 contents, a small particle size was found, due to TiO2 being well dispersed on the ZeY surface, while the accumulation of TiO2 nanoparticles on the ZeY surface was found at high TiO2 contents (see Figure 1b–e) compared with pristine TiO2 (Figure 1f).
Figure 2 shows XRD patterns of TiO2, TiO2/ZeY (with different TiO2 to ZeY ratios) and ZeY (SiO2:Al2O3 = 100). For the TiO2 sample, the diffraction peaks of anatase were observed at 2θ of 25.4°, 37.5°, 48.2°, 54.0°, 55.0°, and 62.7°, and the diffraction peak of rutile appeared at 27.5°. For ZeY, the samples with different ratios of SiO2:Al2O3 (10, 100 and 500) have similar patterns, where a main peak of ZeY appeared at 27.5°, as shown in Figure S1 [18]. This peak of ZeY overlaps with that of rutile TiO2 (i.e., (110) rutile). For TiO2/ZeY, the characteristic peaks of TiO2 were clearly observed and the intensity of the peaks was found to increase, whereas ZeY peaks intensity decreased, with increasing amount of TiO2.
The crystal phase and crystallite sizes of prepared photocatalysts are presented in Table 1. It was found that TiO2/ZeY has smaller crystallite sizes compared with pristine TiO2. The crystallite size in the samples was smaller when the percentage of ZeY increased. From Table 1, it could be explained that the good dispersion of Ti4+ precursor on high amounts of ZeY content could inhibit the anatase crystal growth by reduction of nuclei formation on the support during sol-gel synthesis [19]. In addition, the results from specific surface areas showed that TiO2/ZeY had higher specific surface areas compared to pristine TiO2. This could imply that ZeY helped to improve the surface area, because of the general high surface area of ZeY (590.76 m2g−1). It could indicate that the surface area of TiO2/ZeY relatively decreased with an increasing amount of TiO2 loaded onto the support, because TiO2 was dispersed on the surface of ZeY [20]. Moreover, it could confirm that TiO2 particles cannot form inside the pores of ZeY, because the pore size of ZeY (3.90 nm) was smaller than the diameters of the TiO2 particles (10.40 nm). Previous studies in our group have established that TiO2 fabricated by a surfactant assisted technique has high surface area, resulting in high photocatalytic oxidation of glucose and high product yields [16]. It could imply that surface area is one of the important properties for increasing the photocatalytic activity. So ZeY-supported TiO2 with high surface area obtained in this state was hypothesized to enhance the photocatalytic performance for conversion of glucose.

2.1.2. Photocatalytic Glucose Conversions

The photocatalytic oxidation of glucose on TiO2 and TiO2/ZeY (10, 20, 40 and, 50 mol %), and selectivity toward organic compounds under UV irradiation were studied. Figure 3 shows photocatalytic glucose conversions and product yields over TiO2 and TiO2/ZeY at various amounts of TiO2 on ZeY. The result indicated that the glucose conversion of glucose slightly increased by increasing the irradiation time to 120 min. The highest photocatalytic activity of glucose conversion achieved was 75%, using a 20%TiO2/ZeY photocatalyst (1 g L−1) (Figure 3c). This photocatalytic glucose conversion is higher than the highest conversion reported in our previous work (62.28% from TiO2 synthesized by CTAB-assisted sol-microwave method) [16]. In comparison to TiO2 with a support, the highest photocatalytic glucose conversion in this work is also higher than the previous work (49% from TiO2 with zeolite type Y support) [14]. The good dispersion of TiO2 on the ZeY support caused the result of high performance of photocatalyst. High TiO2 contents on the support (40%TiO2/ZeY and 50%TiO2/ZeY) led to the agglomeration of TiO2 on the catalyst surface, resulting in lower photocatalytic conversions of glucose (Figure 3d,e).
The organic compounds found in the converted solution were divided in two groups, i.e., (1) carboxylic (gluconic acid and formic acid,) and (2) aldehyde (arabinose and xylitol) products. The yields of the main products obtained from the use of 20%TiO2/ZeY at 120 min were 9% gluconic acid, 35% formic acid, 26% arabinose, and 4% xylitol, as shown in Figure 3c. A number of researchers presented pathway conversions of glucose to these value-added chemicals. Colmenares et al. [21] and Chong et al. [22] described the steps of glucose converting to gluconic acid and arabinose, respectively, but xylitol was not found in the proposed reactions. Thus, based on the findings, the glucose conversion in this work follows the reaction pathway with xylitol [23]. The pathway can be explained using three main reactions, including (1) photocatalytic oxidation of glucose for production of gluconic acid, (2) productions of aldopentose (arabinose) and carboxylic products (i.e., formic acid) from the conversion of gluconic acid through photocatalytic decarboxylation, and (3) photocatalytic decomposition of glucose to xylitol. The amount of gluconic acid was found to slightly decrease after 60 min, which supports this proposed pathway.

2.2. Effect of Ratio of SiO2:Al2O3 in ZeY

Glucose conversions via 20%TiO2/ZeY at different ratios of SiO2:Al2O3 in ZeY (10, 100, and 500) were carried out for 120 min under UV irradiation. The selectivity of gluconic acid over 20%TiO2/ZeY at different ratios of SiO2:Al2O3 is shown in Figure 3f. It can be seen that the ratio of SiO2:Al2O3 in ZeY affects the photocatalytic oxidation of glucose. The highest glucose conversion over 20%TiO2/ZeY was obtained at the SiO2:Al2O3 ratio (mol:mol) of 100.
Acid strength and acidity (acid amount) affect catalytic properties in several catalysts. The TiO2/ZeY with the ratio of SiO2:Al2O3 higher than 10 shows a stronger acid strength property [24]. The increase in acid strength resulted in an increase in photocatalytic conversion, although the rate of reaction is known to decrease at too high an acid strength, because of the excess of H+ (to SiO2:Al2O3 ratio of 500) (result not shown here). For acidity, the temperature programmed desorption of ammonia (NH3-TPD) values of ZeY with SiO2:Al2O3 ratios of 10 and 500 are 1.1 and < 0.1 mmol g−1, respectively (data from TOSOH Corporation, Japan). It results in the TiO2/ZeY at SiO2:Al2O3 ratio of 10 showing more yield and selectivity of functional carboxylic acid chemicals (i.e., gluconic acid, 29%) than that at SiO2:Al2O3 ratio of 100 and 500 (11% and 10%, respectively) (Figure 3f). Moreover, it would be come from the Al2O3 content in the zeolite structure. TiO2/ZeY with higher Al2O3 content contains more negative charges in the zeolite structure. Thus, TiO2/ZeY with a low SiO2:Al2O3 ratio has more framework cations in its structure.

2.3. Effect of Metal (Ag, Cu, and Bimetallic Ag-Cu) Loading on TiO2 (40%)/ZeY

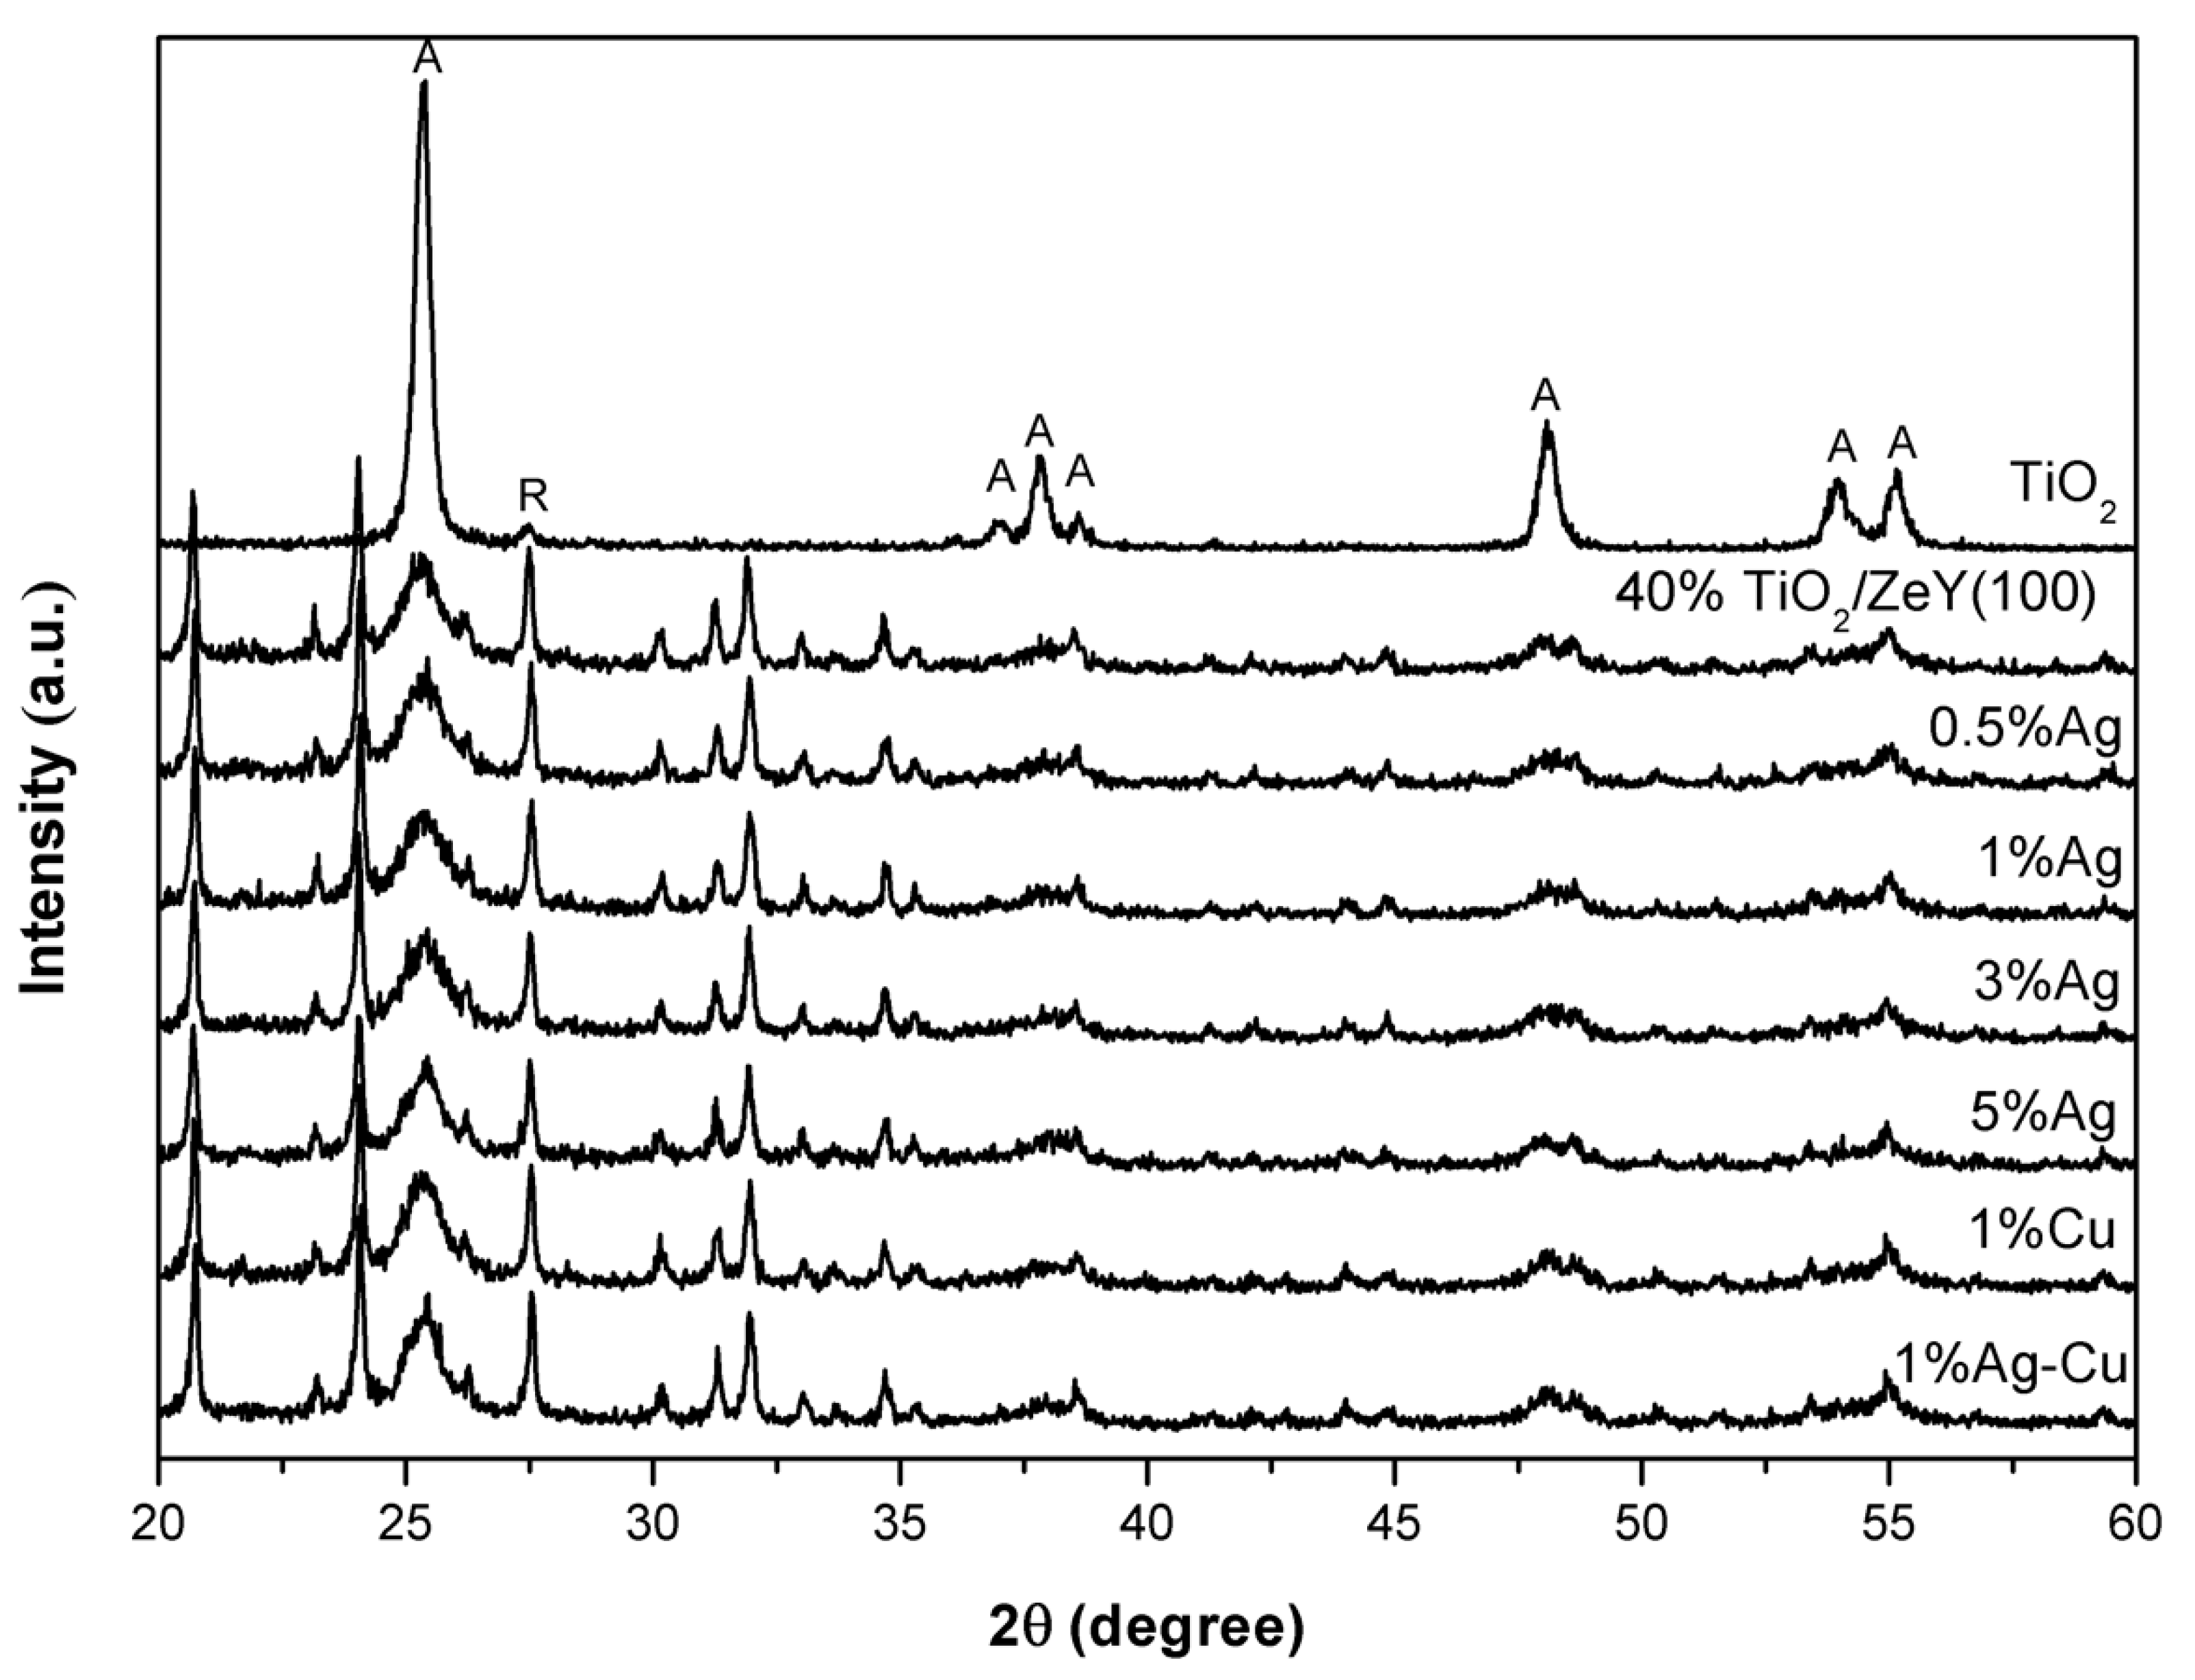
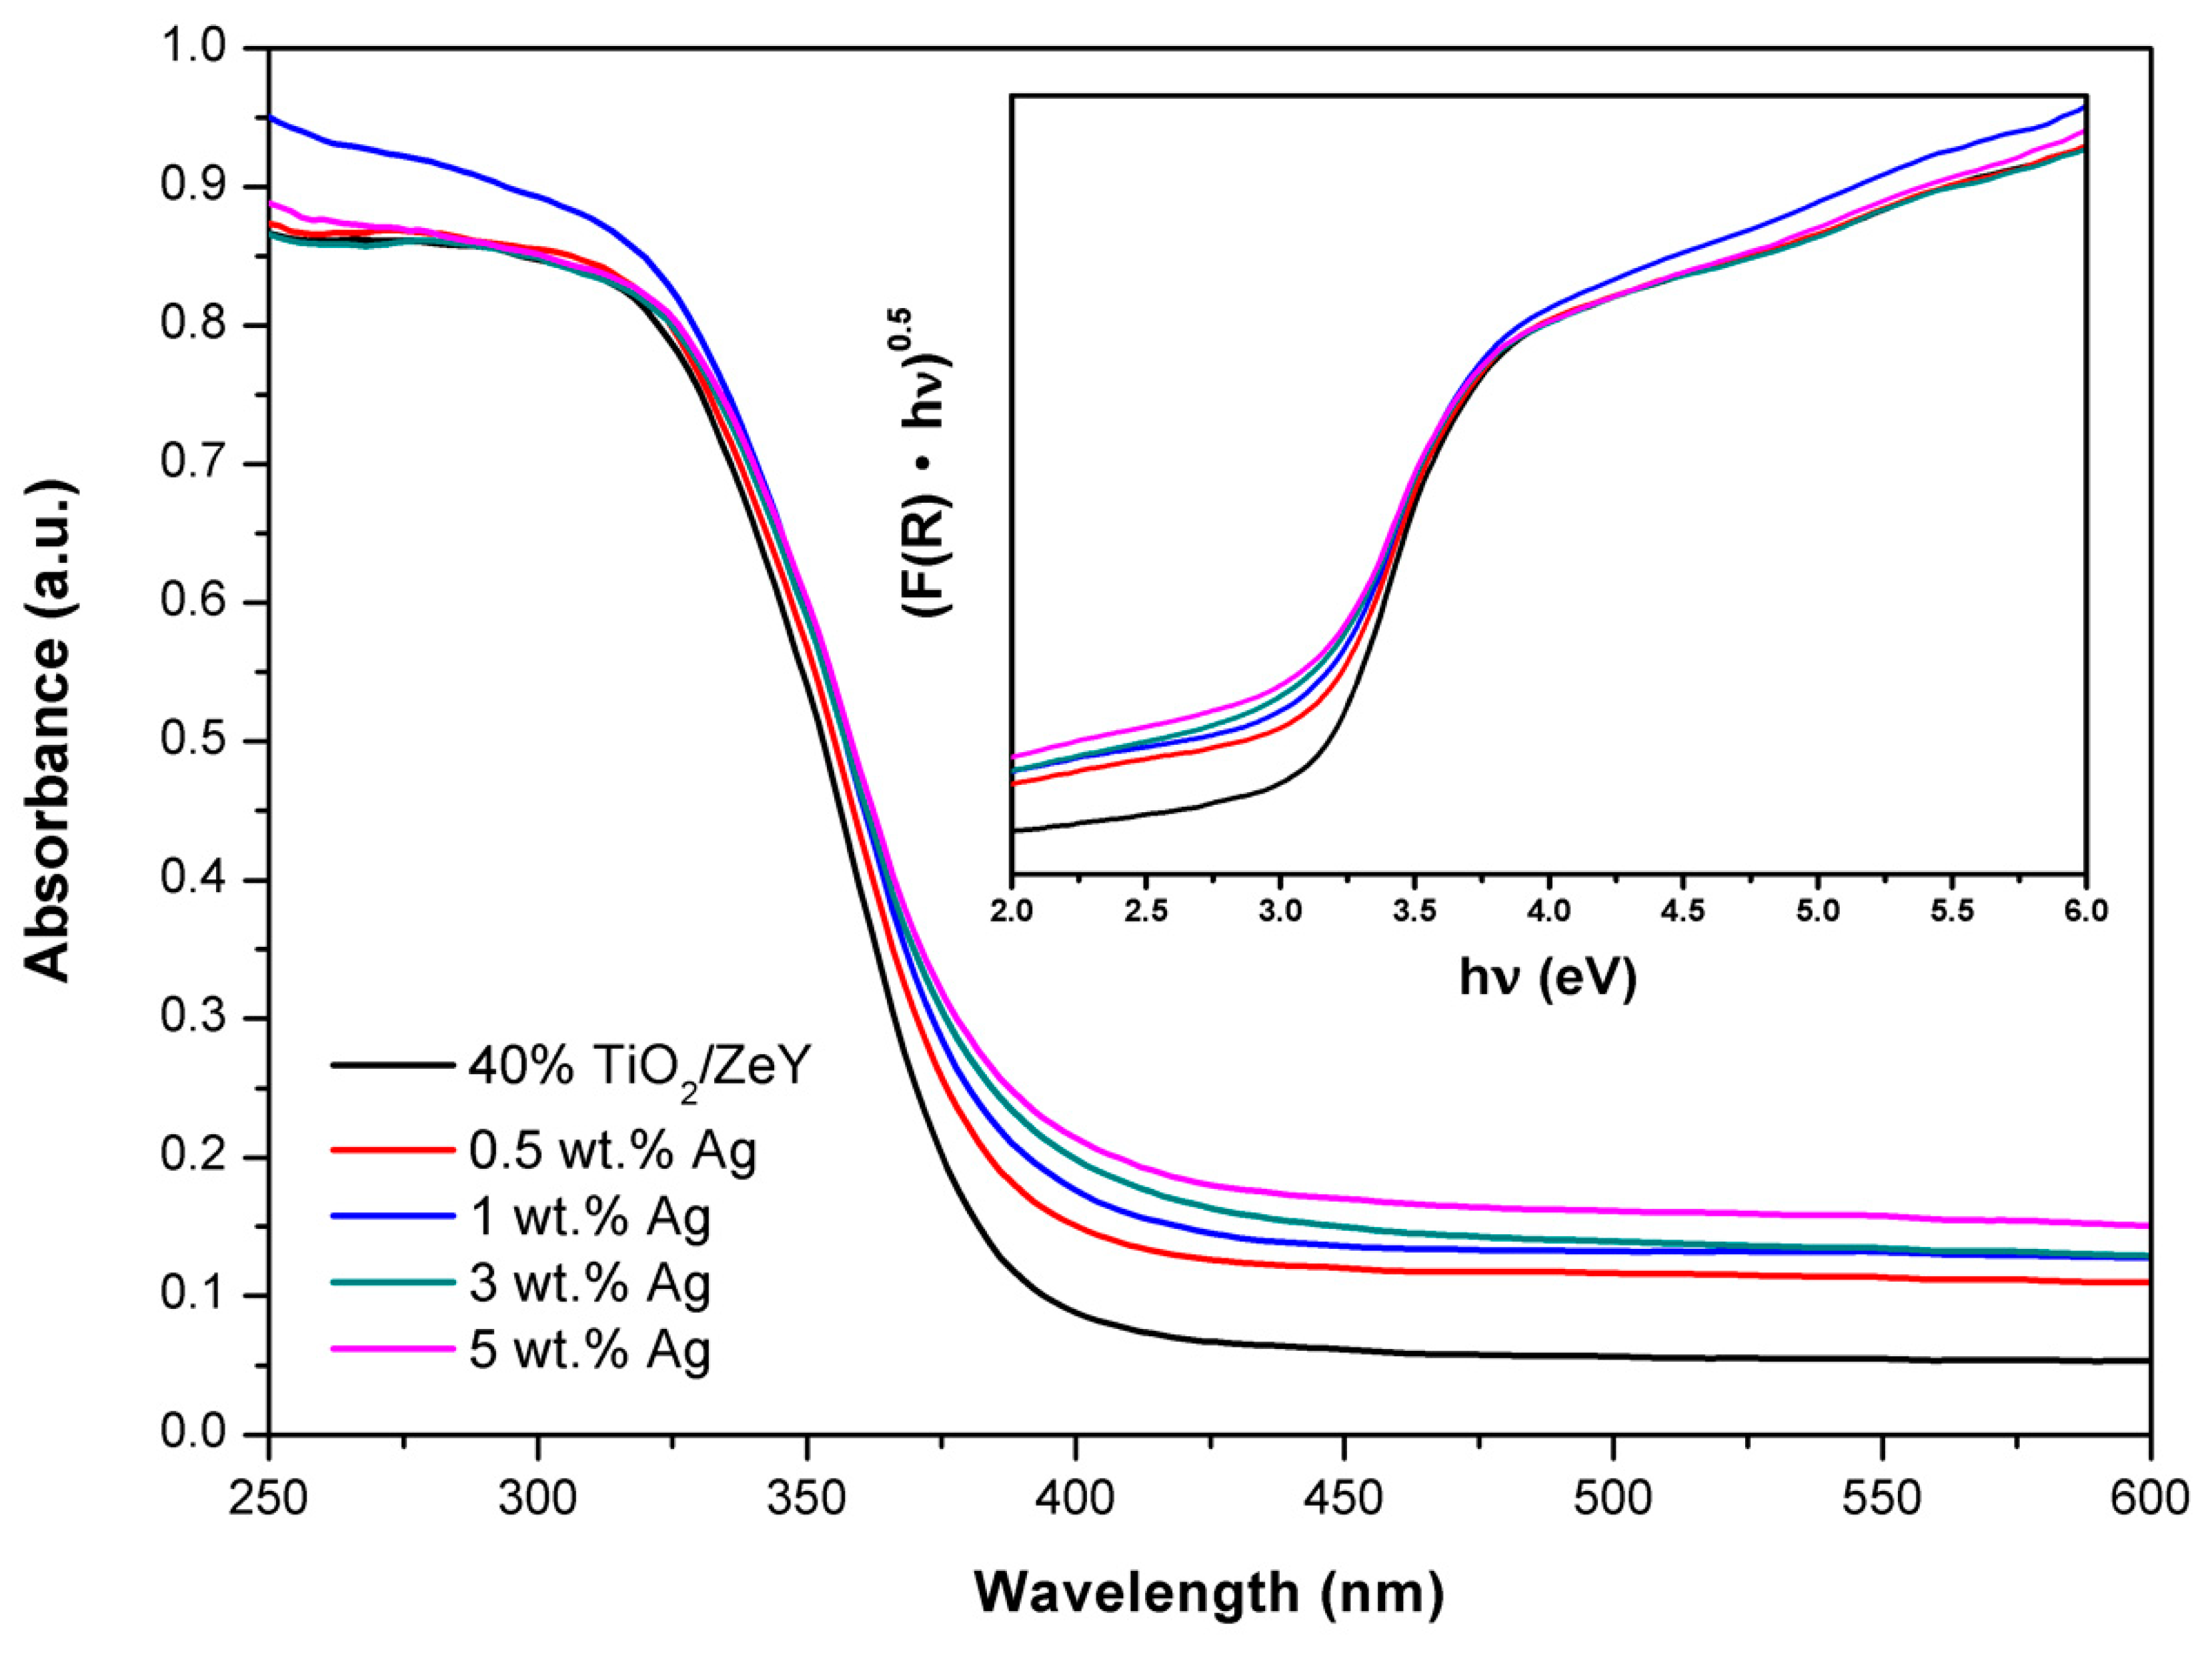
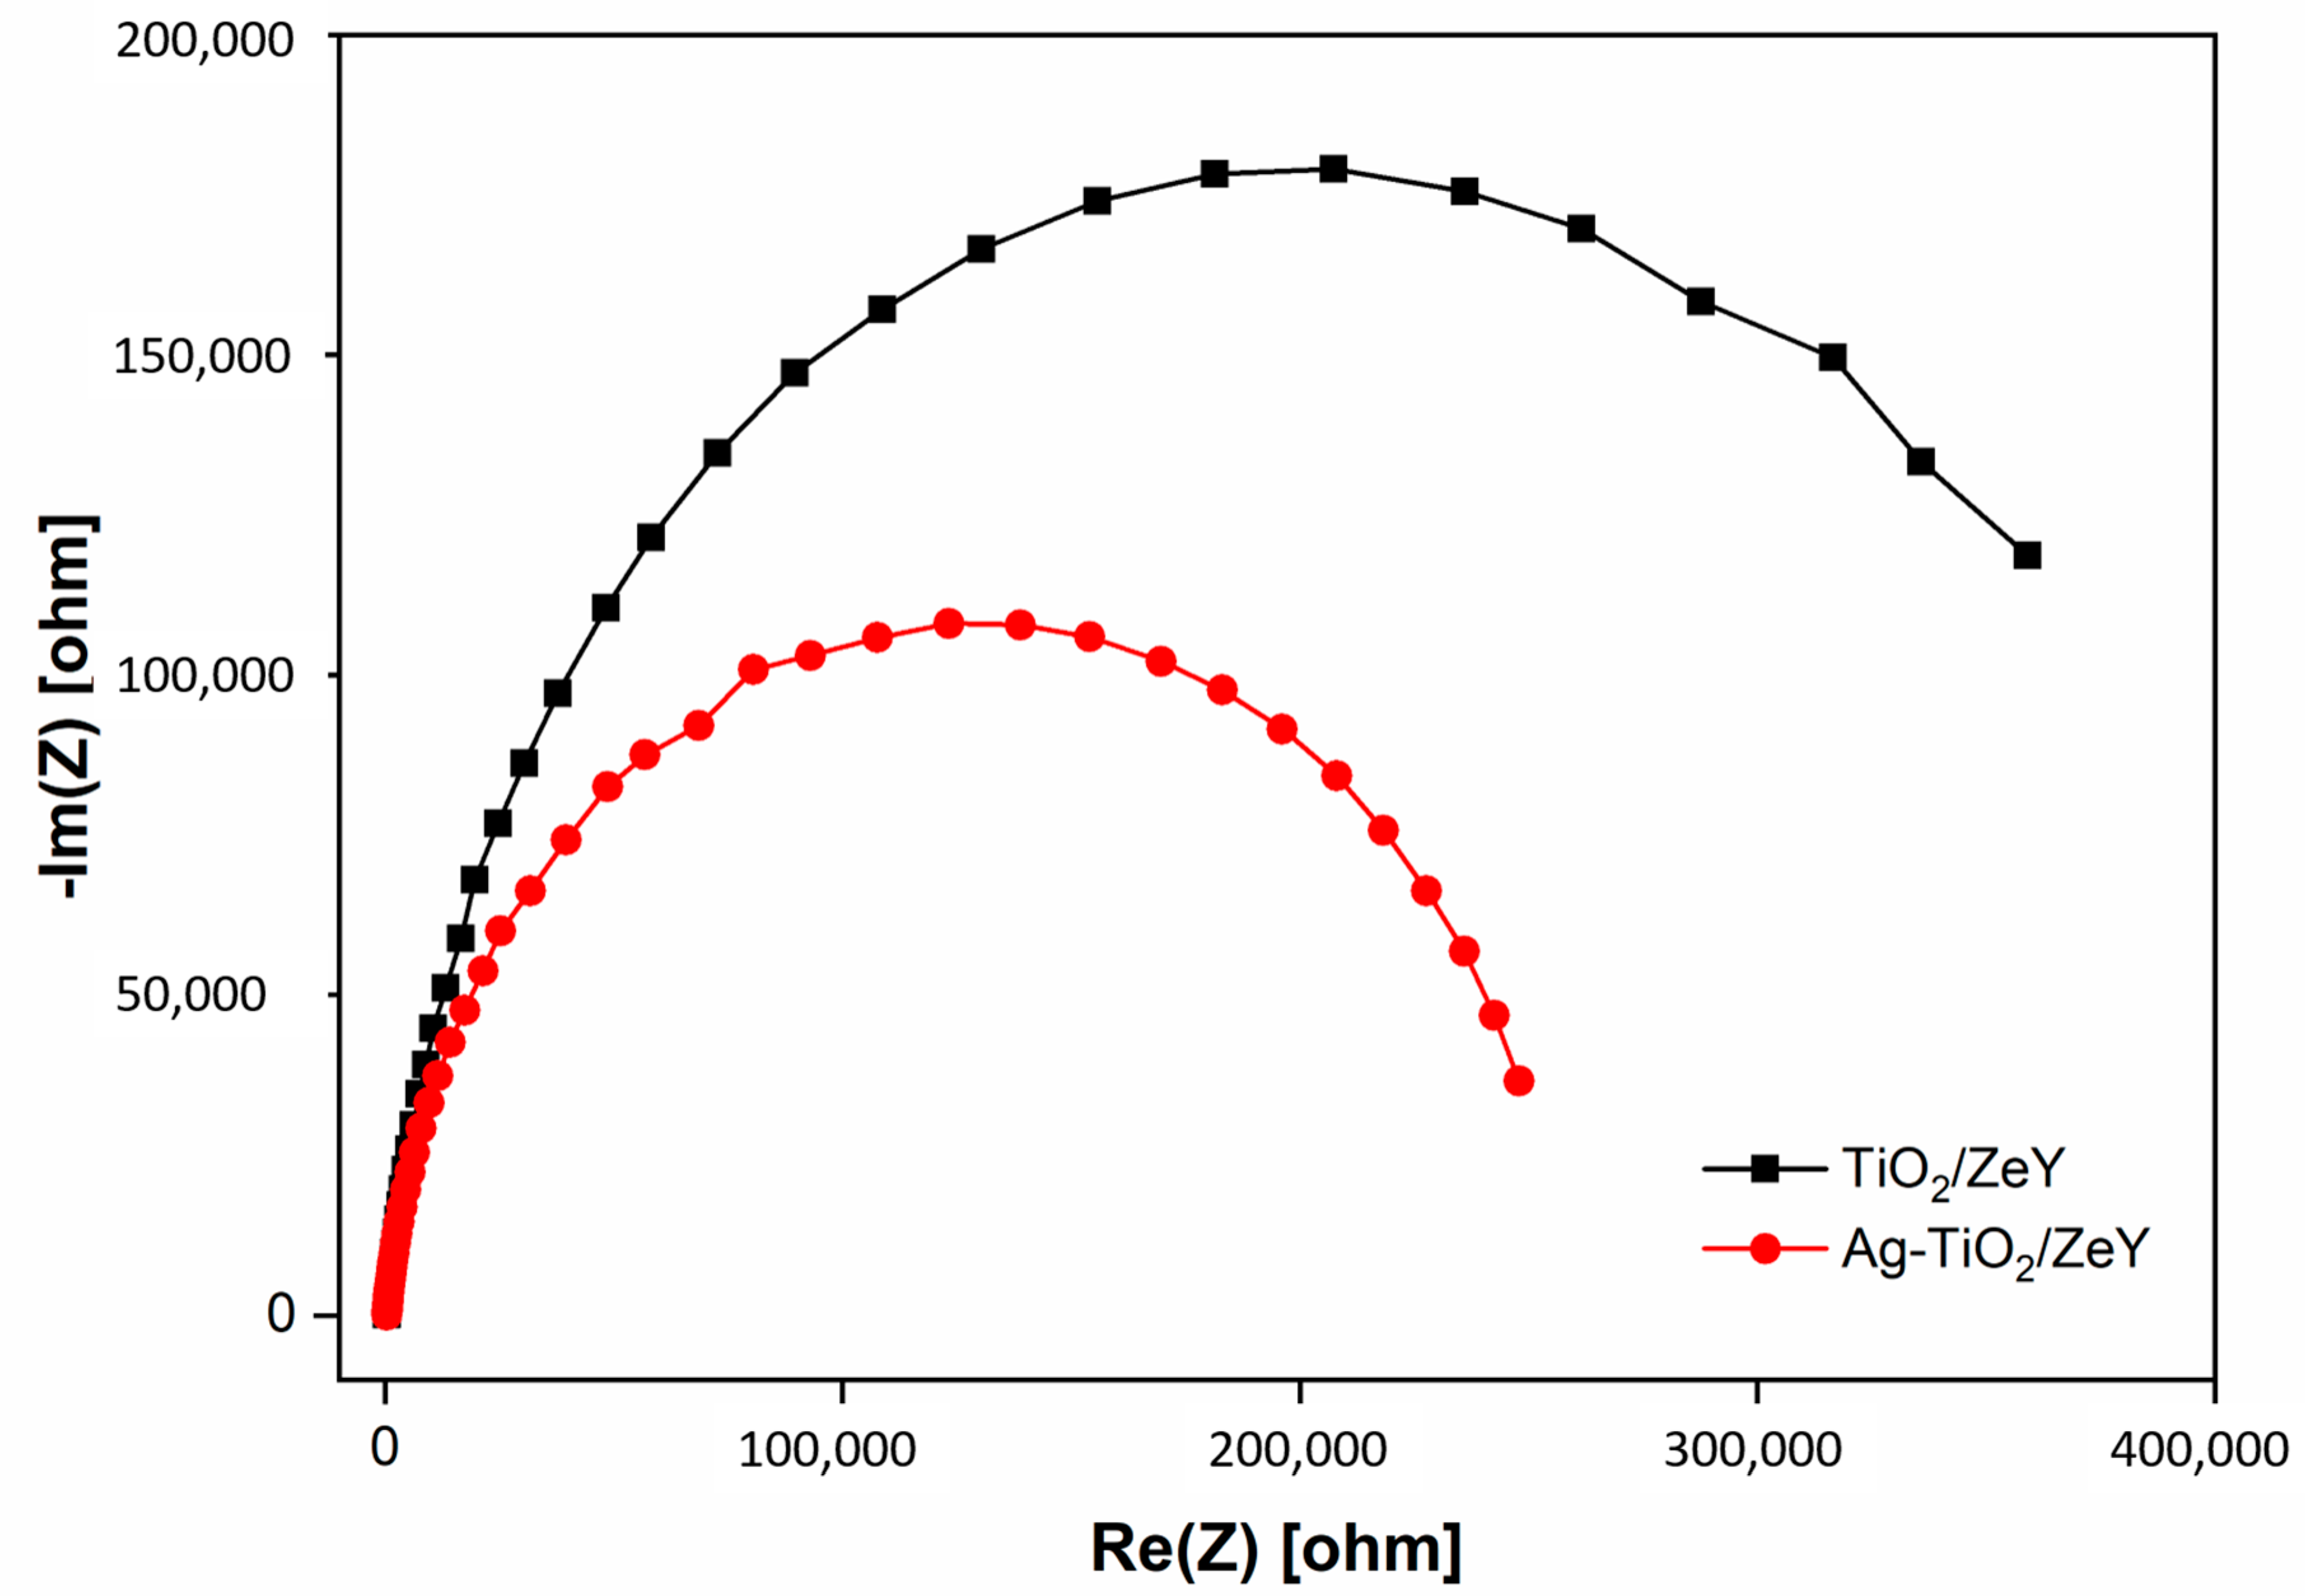
2.3.1. Characterizations

It was found that surface morphology of TiO2 (40%)/ZeY changed after Ag loading, but the particle of Ag on the surface of TiO2/ZeY could not be clearly observed (Figure S2). To confirm the Ag content contained on the catalyst surface, Ag-TiO2 (40%)/ZeY were determined by EDS. The peaks of Ag were observed at 3 keV (Figure S2G), which can confirm that Ag nanoparticles had been deposited onto the surface of TiO2. For 1 wt. % Cu and 1 wt. % Ag-Cu on TiO2 (40%)/ZeY SEM images, the same morphology compared with Ag-TiO2 (40%)/ZeY was observed. The EDS analyses of all catalysts are presented in Table 2. From these data the amount of metal is not directly equal to actual loading, because EDS analysis represents only surface concentration. This is because many parameters, such as layer thickness, metal cluster size, and surface coverage, also strongly influence EDS analysis. The Ag content relatively increased with increasing Ag loading in catalyst preparations. The appearance of Ag in TiO2 can be confirmed by X-ray photoelectron spectroscopy (XPS, Kratos Axis Ultra DLD). The binding energies of Ag 3d at a binding energy of 367.7 eV assigned to Ag2O was observed (result not shown here). Based on previous works, Ag2O was used as a co-catalyst for increasing photocatalytic activity, because it can reduce charge recombination. The electrons can be excited to a conduction band of TiO2, and the hole can be left at the valence band of Ag2O, leading it to promote an interfacial electron transfer [25,26,27]. XRD patterns of TiO2 (40%)/ZeY (unloaded); and 0.5, 1, 3, and 5 wt. % Ag loading on TiO2 (40%)/ZeY are illustrated in Figure 4. All photocatalysts presented the strong diffraction peaks of anatase at 25.4°. The characteristic peaks of Ag and Cu are not obviously observed on the XRD patterns. This phenomenon may be ascribed to the Ag, Cu, and Ag-Cu, which were loaded at a content below the detection limitation of instrument or high dispersion of metals on the surface of TiO2/ZeY [28]. It was observed that the crystallite size of anatase decreased after the loading of Ag on TiO2 (40%)/ZeY (Table S1). It indicates that loaded Ag affected in increase of anatase phase in TiO2, due to the rearrangement of titanium and oxygen ions in anatase grain boundaries, which would be greatly disturbed by the silver ions. The transferring of materials in anatase grains increased energy for the movement of anatase grain boundary, resulting in slower grain growth [29]. But at a 5 wt. % Ag loaded sample, the crystallite size was larger than unloaded ones. It could be explained that the greater Ag content over TiO2/ZeY surface enhanced the growth of the crystallite size. So the crystallite size increased with higher Ag content [30]. In addition, both of Cu-loaded TiO2/ZeY and Ag-Cu-loaded TiO2/ZeY increased anatase crystal phase. It indicated that Cu and bimetallic Ag-Cu inhibited phase transformation from anatase to rutile. The phenomena occurred due to the incorporation of Cu and bimetallic Ag-Cu into the TiO2 lattice. Cu2+ (0.73 Å) and Ti4+ (0.64 Å) have a similarity in the ionic radius, so the Cu ions can substitutionally replace Ti ions in the TiO2 lattice, and might exist in the form of Ti-O-Cu: three elements around the anatase crystallites, which possibly inhibited the transformation to the rutile phase [31].
The specific surface area and pore volumes of TiO2/ZeY, 1 wt. % Ag-TiO2/ZeY, and 3 wt. % Ag-TiO2/ZeY are tabulated in Table S2. The specific surface area was slightly decreased (from 494.57 to 480.41 m2g−1) after the loading of the Ag ion. It could be explained that the successful loading of the Ag could be achieved through the incipient wetness impregnation method on the surface of TiO2/ZeY. The pore volume of samples increased with increasing Ag content, due to the high dispersion of Ag on surface of TiO2/ZeY. The effect of Ag loading content on the absorption threshold and the band gap energy of TiO2 were also examined by UV-visible diffuse reflectance spectroscopy.
The optical absorbance spectra of pure TiO2 (40%)/ZeY, 0.5 wt. % Ag-TiO2 (40%)/ZeY, 1 wt. % Ag-TiO2 (40%)/ZeY, and 3 wt. % Ag-TiO2 (40%)/ ZeY are shown in Figure 5. The absorption edge of 0.5 wt. % Ag-TiO2 (40%)/ZeY, 1 wt. % Ag-TiO2 (40%)/ZeY, and 3 wt. % Ag-TiO2 (40%)/ZeY shifted to a longer wavelength in the UV–vis region, indicating that Ag loaded TiO2/ZeY broadened the absorption edge of TiO2. The band gap energy of TiO2 (40%)/ZeY, 0.5 wt. % Ag-TiO2 (40%)/ZeY, 1 wt. % Ag-TiO2 (40%)/ZeY, 3 wt. % Ag-TiO2 (40%)/ZeY, and 5 wt. % Ag-TiO2 (40%)/ZeY were 3.00, 2.89, 2.82, 2.74, and 2.68 eV, respectively, as shown in Table 3. It implied that when the Ag loading content increased, the absorption edge shifted towards a longer wavelength, which affected the decrease of the band gap. The shortening of the band gap may induce TiO2/ZeY more photocatalytic activity, due to the decrease of the yield of photogenerated electron-hole pairs [14]. The UV-visible diffuse reflectance spectra of 1 wt. % Cu-TiO2/ZeY and 1 wt. % Ag-Cu-TiO2/ZeY are shown in Figure S3. The absorption spectra of Cu and Ag-Cu loaded TiO2/ZeY show the same results as Ag-TiO2/ZeY. The values of Eg for 1 wt. % Cu-TiO2/ZeY and 1 wt. % Ag-Cu-TiO2/ZeY were 2.78 and 2.91 eV, respectively, as shown in Table 3. In addition, the inducing impurity energy level by loading metal (Cu and Ag) affects the separation of electron-hole pairs. As the valence band of Cu2+ based metal oxide is lower than that of Ti4+ based TiO2, so Cu loaded TiO2 will induce oxygen vacancies, which act as the active sites, and can also capture the holes to restrain the recombination of hole-electron pairs [32].
The electrochemical impedance spectra (EIS) of TiO2/ZeY and Ag-TiO2/ZeY are shown in Figure 6. It was found that the Ag-TiO2/ZeY displays a smaller semicircular diameter compared with unloaded (TiO2/ZeY). It can be concluded that Ag can improve the electronic conductivity and increase the charge separation, leading to improvement in photocatalytic activity [33].

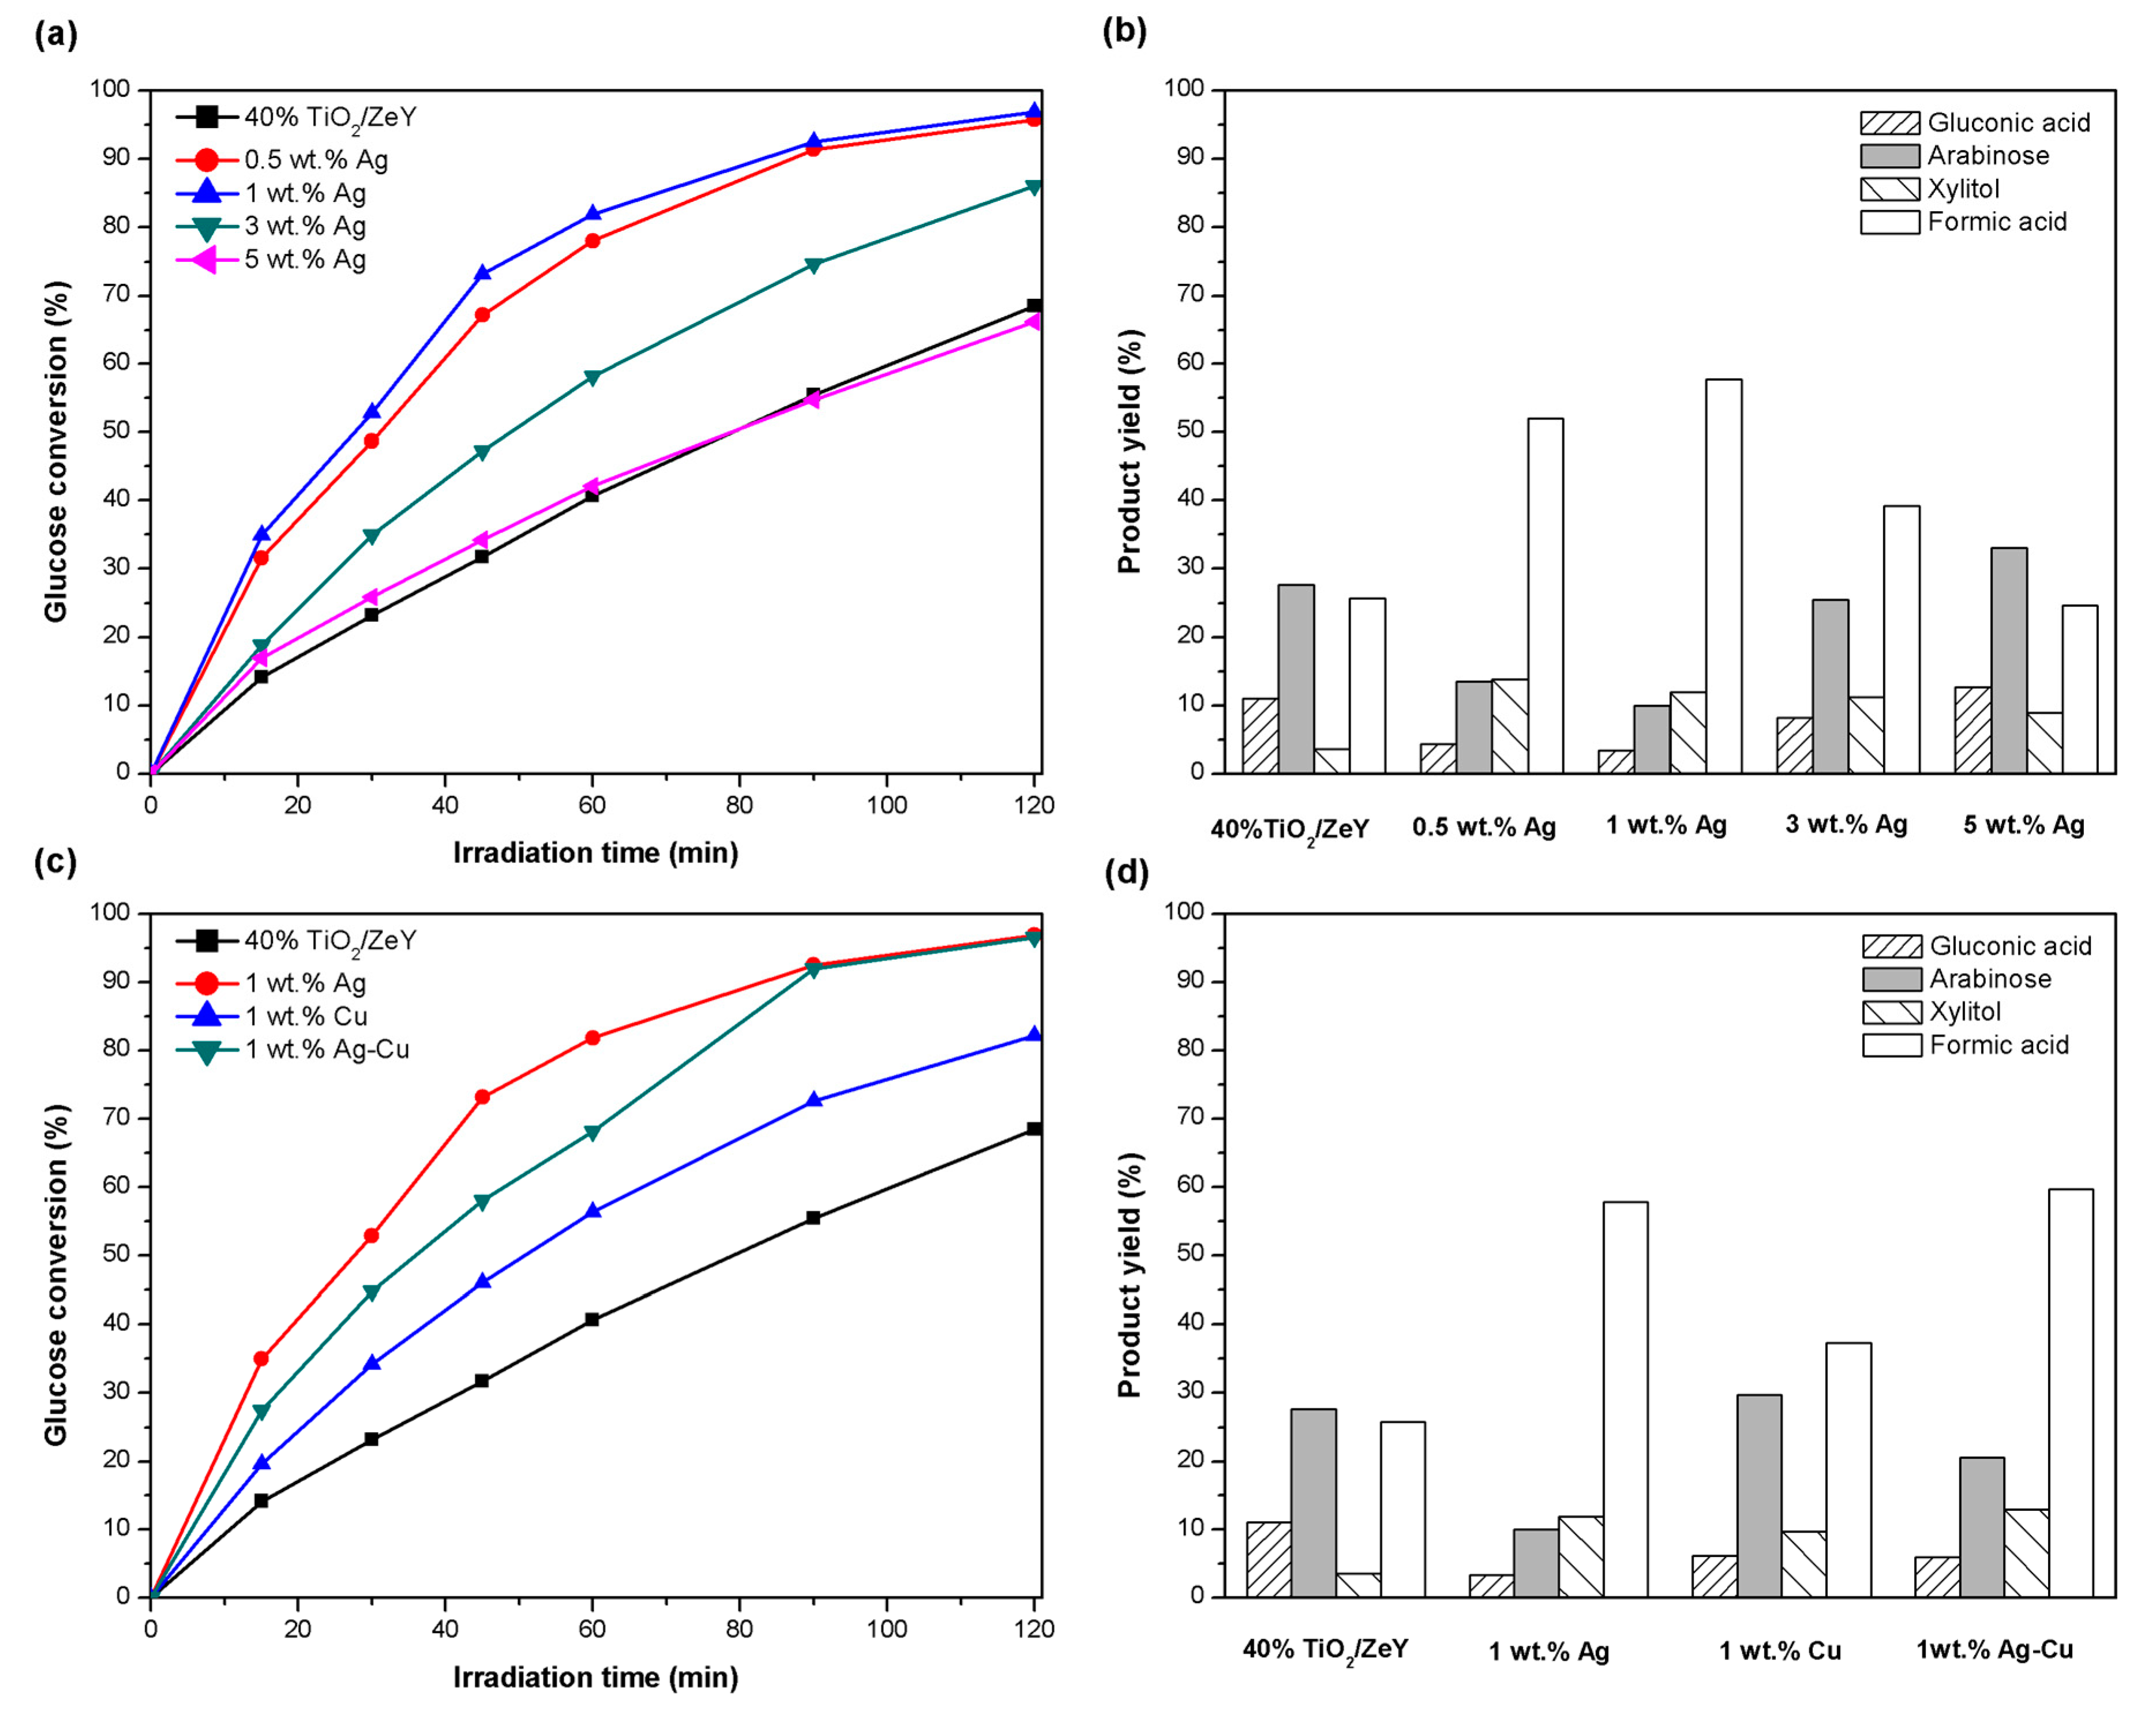
2.3.2. Photocatalytic Conversion of Glucose

Glucose conversions on Ag-TiO2/ZeY based catalysts were carried out for 120 min. The photocatalytic activity of TiO2/ZeY and Ag-TiO2/ZeY catalysts with an Ag loading content of 0.5, 1, 3, and 5 wt. % are shown in Figure 7a, and the maximum yields of products are shown in Figure 7b. The result indicated that after 120 min irradiation time, four organic compounds were produced: xylitol, gluconic acid, arabinose, and formic acid. The highest glucose conversion of 96.90% and the yield of gluconic acid, arabinose, xylitol, and formic acid of 3.43%, 9.97%, 11.87%, and 57.79, respectively, were obtained from 1 wt. % Ag-TiO2 (40%)/ZeY. It indicated that a high surface area (487.53 m2g−1), mixed phase of anatase and rutile (anatase:rutile = 42% to 58%), small crystallite size (11.81 nm), and small band gap (3.08 eV) of 1 wt. % Ag-TiO2 (40%)/ZeY could promote high photocatalytic activity. The small band gap facilitated the increase of photogenerated electron-hole pairs and easier electron transfer. It was reported that an Ag dopant could be inserted into the TiO2 lattice as an impurity state, over the valance band and below the conduction band of TiO2. For a photocatalytic reaction of glucose under mercury lamp irradiation, electrons in the valence band were excited to Ag impurity state, left holes in the valence band, and after that these electrons transferred from impurity state to conduction band. Ag impurity state like intermediate band that electrons stay there for a short time, and then transferred again facilitated the photoactivity in the visible light region [34]. On the other hand, 5 wt. % TiO2 (40%)/ZeY enhanced the lowest glucose conversion, because high Ag loading might close some active sites of catalysts, resulting in low photocatalytic activity. This result can confirm by turnover number (TON) and turnover frequency (TOF) of Ag-TiO2/ZeY. Higher Ag contents, lower TONs and TOFs were obtained (e.g., TOFs of 50.40 h−1 and 3.57 h−1 for 0.5%Ag-TiO2/ZeY and 5%Ag-TiO2/ZeY, respectively, as shown in Table S3). Furthermore, Ag might defect into the TiO2 lattice, resulting in too many oxygen vacancies in the lattice [33]. Oxygen vacancies act as recombination centers of generated electron-hole pairs, resulting in decreased photocatalytic activity [35].
The photocatalytic activity of Ag-Cu-TiO2 compared with Ag-TiO2 and Cu-TiO2 catalysts are shown in Figure 7c. It was found that glucose conversions on 1 wt. % Cu-TiO2/ZeY and 1 wt. % Ag-Cu-TiO2/ZeY were achieved at 82.23% and 94.71%, respectively. Among them, 1 wt. % Cu-TiO2/ZeY showed the lowest glucose conversion. The maximum yields of products: xylitol, gluconic acid, arabinose, and formic acid were 12.93%, 5.92%, 20.49%, and 59.73%, respectively. When compared with the unloaded sample (TiO2 (40%)/ZeY), 1 wt. % Cu-TiO2 still presented a higher glucose conversion, because Cu-loaded samples have a smaller band gap than TiO2/ZeY, so the electron can transfer from the conduction band of TiO2/ZeY to metallic copper ion. This result facilitates the charge separation, and hence enhances the photocatalytic performance of TiO2/ZeY. In a previous work, Jin et al. [36] used a precious bimetallic catalyst (Pt/Pd) to modify TiO2 for increasing the selectivity of glucaric acid and co-products (such as tartronic and oxalic acids). The improved selectivity to glucaric acid (S = 44%) was reported from Pt/Pd-TiO2 in glucose oxidation (compared with monometallic catalysts, S = 4%) [36]. In this work, the bimetallic Ag-Cu were studied for the purpose of increasing the efficiency of photoconversion of glucose. The bimetallic 1 wt. % Ag-Cu loaded TiO2/ZeY present a higher glucose conversion (94.71%) than 1 wt. % Cu loaded TiO2/ZeY. The yields of gluconic acid, arabinose, xylitol, and formic acid obtained were 5.91%, 20.49%, 12.93%, and 59.73%, respectively (Figure 7d). Moreover, the xylitol yield of 12.93% from bimetallic Ag-Cu loaded TiO2/ZeY was the highest value in this work, which was corresponded to the highest product selectivity of 13.65%. This work presents both monometallic (Ag-TiO2, and Cu-TiO2) and bimetallic (Ag-Cu-TiO2) catalysts, which enhance the high performance of catalysts for photocatalytic glucose conversion.

3. Materials and Methods

3.1. Photocatalyst Preparation

3.1.1. TiO2/ZeY Photocatalyst

Zeolite type Y (ZeY) (SiO2:Al2O3 = 10, 100, and 500) provided by the Tosoh Corporation (Tokyo, Japan) was used as a support. TiO2 particles were prepared with the microwave-assisted sol-gel technique. Titanium (IV) butoxide (Sigma-Aldrich, Queenstown, Singapore) and acetylacetone (Sigma-Aldrich, Queenstown, Singapore) were mixed by stirring for 3 min. Then, isopropyl alcohol (80 ml) was dropped in the mixture solution with constant stirring [37]. After that, ZeY was added in the prepared mixture under constant stirring for 10 min. The TiO2 hydrosol was heated for 4 min by microwave irradiation (Whirlpool, 970W, 2.45 GHz, Michigan, MI, USA) to accelerate the TiO2 gel formation, followed by drying in a hot-air oven at 80 °C for 24 h. Finally, TiO2/ZeY powder was calcined at 500 °C for 2 h.

3.1.2. Metal-TiO2/ZeY Photocatalyst

The metal-loaded TiO2 catalysts were prepared by aqueous incipient wetness impregnation of TiO2 using metal ion salts, Ag(NO3) and Cu(NO3)2·3H2O, as the precursors for Ag and Ag-Cu loading, respectively. Accordingly, a solution of metal ion salts in distilled water was stirred, and then added into TiO2 (40%)/ZeY. The solvent was treated with microwave irradiation (40% power) for 4 min (Whirlpool, 2.45 GHz, 970W, Michigan, MI, USA). The 0.5, 1, 3, and 5 wt. % of metal ions were introduced as the dopant. The samples were then dried in an oven at 80 °C overnight and then calcined at 400 °C for 4 h.

3.2. Photocatalyst Characterizations

The crystal phases and crystallite sizes of the synthesized TiO2 photocatalyst ware determined by the X-ray powder diffraction (XRD) technique using an XRD spectrometer (Rigaku RINT 2100, Tokyo, Japan) with Cu Kα radiation (λ = 0.15418 nm, 40 kV). The scanning angle of 2θ was from 10 to 80°, with a scanning speed of 0.05° s−1. The XRD results were used to identify the crystal phases of prepared catalysts. The crystallite size of catalysts was calculated using the Scherrer equation (Equation (1)) [38].
D = K λ β c o s θ
where D is crystallite size, K is a coefficient (0.94), λ is X-ray wavelength, β is intensity of the full width at half maximum of the peak, and θ is diffraction angle [39]. The percentage of anatase (A) was calculated using Equation (2).
A ( % ) = 100 [ 1 + 1.265 ( I R + I A ) ]
where IR is intensity of the rutile (110) peak and IA is intensity of the reflection of the anatase (101) phase.
A scanning electron microscopy (SEM) (Hitachi SU-6600, Tokyo, Japan) was employed to observe the surface morphologies and determine particle sizes of photocatalysts. The average particle sizes of synthesized catalysts were calculated with 50 measurements from SEM images.
Specific surface area, pore size, and pore volume were obtained by the measurement of N2 physisorption analysis (BEL, Osaka, Japan, BELSORP 18) via Brunauer–Emmett–Teller (BET) and Barrett−Joyner−Halenda (BJH) methods.
To estimate the band gap energies (Eg), the Kubelka–Munk function (F(R)) was considered (Equation (3)).
F ( R ) =   α s = ( 1 R ) 2 2 R
where R is reflectance from diffuse reflectance spectrum, α is absorption coefficient, and s is scattering factor. The scattering factor is wavelength independent, while (R) is proportional to the absorption coefficient. The optical band gaps (Eg) were determined according to Equation (4).
( F ( R ) h υ ) 1 n = k ( h υ E g )
where is photon energy (h is Planck constant and ν is frequency of electromagnetic waves), k is energy-independent constant, and the exponent n is determined by the type of transition. In this work, the optical band gap is best described by an indirect allowed transition (n = 2). Thus, the optical band gap can be determined by plot (F(R)·hν)0.5 versus , and extrapolating the linear regression into the axis [40,41].
Electrochemical impedance spectra (EIS) were performed by a Versa STAT4 potentiostat instrument (Tennessee, TN, USA). Potassium chloride (KCl) solution with the concentration of 0.1 M was used as an electrolyte. A bias voltage of −0.20 V was used to drive the photogenerated electron transfers from a working electrode to a platinum electrode.

3.3. Photocatalytic Conversion

Photocatalytic conversion was performed in a double-walled glass reactor (Pyrex) under irradiation of UV (mercury lamp, 400 W, λmax = 365 nm). A cooling water system was used for controlling the temperature in this reaction. The initial glucose concentration was set as 1 g/L in a 10:90 v/v of distilled water and acetonitrile mixture [15]. Prior to staring the photocatalytic experiment, the system was constantly stirred under dark conditions for 30 min to make a homogenous dispersion of the photocatalyst in the solution. The reaction time for photocatalytic glucose conversion was 120 min. Since the reactions were performed under the open system, the gas-phase products were not detected. The liquid products from glucose conversion were analyzed by high-performance liquid chromatography (HPLC) technique (Shimadzu LC-20AD, (Kyoto, Japan), equipped with an Aminex HPX-87H column (Bio-Rad, 300 × 7.8 mm), and a refractive index detector (RID-10A)). The separation was operated under a temperature of 60 °C at a constant flow rate of 0.5 mL/min, using a sulfuric acid solution (5 mM) as a mobile phase [16]. Glucose conversion, product yield, product selectivity, turnover number, and turnover frequency were calculated according to Equations (5)–(9), respectively.
Glucose   conversion   ( % ) = The   intitial   concentration   of   glucose The   concentration   of   glucose   at   i   time The   intitial   concentration   of   glucose × 100
Product   yield   ( % ) = The   concentration   of   product   at   i   time The   intitial   concentration   of   glucose × 100
Product   selectivity   ( % ) = The   amount   of   product   i The   total   amount   of   products × 100
Turnover   number   ( TON ) = Mole   of   glucose   consumed Mole   of   Ag TiO 2 / ZeY   catalyst
Turnover   frequency   ( TOF )   ( h 1 ) = TON Time   of   reaction

4. Conclusions

TiO2 particles were prepared by microwave assisted sol-gel technique and mixed with ZeY support for dispersion of the particles. TiO2/ZeY photocatalysts were successfully used as photocatalysts for producing value-added chemicals via the photocatalytic conversion of glucose. Well dispersed TiO2 particles on surface of the support can be observed in 20%TiO2/ZeY at the SiO2:Al2O3 ratio of 100. This catalyst was found to be the best photocatalyst to achieve the highest glucose conversion of 75%. Unique properties of photocatalysts, i.e., a high specific surface area (524.41 m2g−1), small anatase crystallite size (13.27 nm), and small particle size (1 µm) cause high photocatalytic activity, resulting in greater glucose conversion. Four organic compounds, i.e., gluconic acid, formic acid, arabinose, and xylitol, were found as the main products from photocatalytic glucose conversion. The yields of products were 9%, 35%, 26%, and 4%, respectively. Moreover, the low ratio of SiO2:Al2O3 was significantly affected by the selectivity of the carboxylic products. At the ratio of SiO2:Al2O3 of 10, the highest selectivity of gluconic acid (29%) and formic acid (32%) were achieved. The modification of TiO2/ZeY by metal loading were carried out by microwave-assisted incipient wetness impregnation method. The highest glucose conversion of 96.9% were obtained from 1 wt. % Ag-TiO2(40%)/ZeY, which was the sample that provided the smallest anatase crystallite size (11.81 nm), the highest SBET (487.5 m2g−1), low band gap (2.82 eV), and mixed anatase-rutile phase (42:58). The 1 wt. % Cu-TiO2/ZeY and bimetallic loaded samples, i.e., 1 wt. % Ag-Cu-TiO2/ZeY, were synthesized for comparison with 1 wt. % Ag-TiO2/ZeY. Among them, the bimetallic 1 wt. % Ag-Cu-TiO2/ZeY presented a higher glucose conversion (94.71%) than 1 wt. % Cu loaded TO2/ZeY (82.23%). In addition, the bimetallic Ag-Cu-TiO2/ZeY presented the highest of xylitol yield (12.93%), compared with the other samples.

Supplementary Materials

The following are available online at https://www.mdpi.com/2073-4344/10/4/423/s1, Figure S1: XRD patterns of TiO2 (20%)/ZeY and ZeY with different SiO2:Al2O3 ratios; Figure S2: SEM images (30000×) of (A) TiO2 (40%)/ZeY, (B) 0.5 wt. % Ag, (C) 1 wt. % Ag, (D) 3 wt. % Ag, (E) 1 wt. % Cu, and (F) 1 wt. % Ag-Cu on TiO2 (40%)/ZeY; and (G) EDS spectrum of 1 wt. % Ag TiO2 (40%)/ZeY; Figure S3: UV-vis diffuse reflectance spectra of 1% Ag-, 1% Cu-, and 1% Ag-Cu-loaded TiO2 (30%)/ZeY (70%), the inset shows plots of (F(R)hυ)0.5 versus of the catalysts; Table S1: Summary of crystal phases and crystallite sizes of Ag-loaded TiO2 (40%)/ZeY prepared by incipient wetness impregnation with microwave assistance (A = anatase, R = rutile); Table S2: Specific surface areas (SBET), pore volumes (Vp), and pore diameters of TiO2/ZeY and (1% and 3%) Ag-loaded TiO2 (40%)/ZeY; Table S3: Turnover number (TON) and turnover frequency (TOF) of Ag-TiO2/ZeY (with different Ag contents) and Ag-Cu-TiO2/ZeY.

Author Contributions

Conceptualization, S.C.; methodology, K.R.; software, K.R.; validation, K.R., and S.C.; formal analysis, K.R.; investigation, K.R.; resources, K.R.; data curation, K.R.; writing—original draft preparation, K.R.; writing—review and editing, S.C.; visualization, S.C.; supervision, S.C. and N.L.; project administration, S.C.; funding acquisition, S.C. All authors have read and agree to the published version of the manuscript.

Funding

This research was funded by Thailand Science Research and Innovation (TSRI, Grant Numbers RSA6180085 (S.C.) and RTA6280003 (N.L.)), Japan Science and Technology Agency (JST) under Collaboration Hubs for International Research Program (CHIRP) within the framework of the Strategic International Collaborative Research Program (SICORP), and National Science and Technology Development Agency (NSTDA) (project no. P-18-50775).

Acknowledgments

The author (K.R.) would like to acknowledge Petchra Pra Jom Klao Doctoral scholarship of King Mongkut’s University of Technology Thonburi (KMUTT) and The Joint Graduate School of Energy and Environment (JGSEE).

Conflicts of Interest

The authors declare no conflict of interest.

References

  1. Fisk, C.A.; Morgan, T.; Ji, Y.; Crocker, M.; Crofcheck, C.; Lewis, S.A. Bio-oil upgrading over platinum catalysts using in situ generated hydrogen. Appl. Catal. A 2009, 358, 150–156. [Google Scholar] [CrossRef]
  2. Colmenares, J.C.; Magdziarz, A.; Bielejewska, A. High-value chemicals obtained from selective photo-oxidation of glucose in the presence of nanostructured titanium photocatalysts. Bioresour. Technol. 2011, 102, 11254–11257. [Google Scholar] [CrossRef] [PubMed]
  3. Ghosh, D.; Dasgupta, D.; Agrawal, D.; Kaul, S.; Adhikari, D.K.; Kurmi, A.K.; Negi, M.S. Fuels and chemicals from lignocellulosic biomass: An integrated biorefinery approach. Energy Fuels 2015, 29, 3149–3157. [Google Scholar] [CrossRef]
  4. Luque, R.; de la Osa, A.R.; Campelo, J.M.; Romero, A.A.; Valverde, J.L.; Sanchez, P. Design and development of catalysts for Biomass-To-Liquid-Fischer–Tropsch (BTL-FT) processes for biofuels production. Energy Environ. Sci. 2012, 5, 5186–5202. [Google Scholar] [CrossRef]
  5. Nakata, K.; Fujishima, A. TiO2 photocatalysis: Design and applications. J. Photochem. Photobiol. C 2012, 13, 169–189. [Google Scholar] [CrossRef]
  6. Chong, M.N.; Jin, B.; Chow, C.W.; Saint, C. Recent developments in photocatalytic water treatment technology: A review. Water Res. 2010, 44, 2997–3027. [Google Scholar] [CrossRef] [PubMed]
  7. Gomathisankar, P.; Noda, T.; Katsumata, H.; Suzuki, T.; Kaneco, S. Enhanced hydrogen production from aqueous methanol solution using TiO2/Cu as photocatalysts. Front. Chem. Sci. Eng. 2014, 8, 197–202. [Google Scholar] [CrossRef]
  8. Cheng, G.; Akhtar, M.S.; Yang, O.B.; Stadler, F.J. Structure modification of anatase TiO2 nanomaterials-based photoanodes for efficient dye-sensitized solar cells. Electrochim. Acta 2013, 113, 527–535. [Google Scholar] [CrossRef]
  9. Schneider, J.; Matsuoka, M.; Takeuchi, M.; Zhang, J.; Horiuchi, Y.; Anpo, M.; Bahnemann, D.W. Understanding TiO2 photocatalysis: Mechanisms and materials. Chem. Rev. 2014, 114, 9919–9986. [Google Scholar] [CrossRef]
  10. Lafjah, M.; Djafri, F.; Bengueddach, A.; Keller, N.; Keller, V. Beta zeolite supported sol–gel TiO2 materials for gas phase photocatalytic applications. J. Hazard. Mater. 2011, 186, 1218–1225. [Google Scholar] [CrossRef]
  11. Resende, S.F.; Nunes, E.H.M.; Houmard, M.; Vasconcelos, W.L. Simple sol–gel process to obtain silica-coated anatase particles with enhanced TiO2-SiO2 interfacial area. J. Colloid Interface Sci. 2014, 433, 211–217. [Google Scholar] [CrossRef] [PubMed] [Green Version]
  12. Zhang, G.; Song, A.; Duan, Y.; Zheng, S. Enhanced photocatalytic activity of TiO2/zeolite composite for abatement of pollutants. Microporous Mesoporous Mater. 2018, 255, 61–68. [Google Scholar] [CrossRef]
  13. Kovalevskiy, N.S.; Lyulyukin, M.N.; Selishchev, D.S.; Kozlov, D.V. Analysis of air photocatalytic purification using a total hazard index: Effect of the composite TiO2/zeolite photocatalyst. J. Hazard. Mater. 2018, 358, 302–309. [Google Scholar] [CrossRef] [PubMed]
  14. Colmenares, J.C.; Magdziarz, A. Room temperature versatile conversion of biomass-derived compounds by means of supported TiO2 photocatalysts. J. Mol. Catal. A Chem. 2013, 366, 156–162. [Google Scholar] [CrossRef]
  15. Rengaraj, S.; Li, X.Z. Enhanced photocatalytic activity of TiO2 by doping with Ag for degradation of 2,4,6-trichlorophenol in aqueous suspension. J. Mol. Catal. A Chem. 2006, 243, 60–67. [Google Scholar] [CrossRef] [Green Version]
  16. Payormhorm, J.; Chuangchote, S.; Laosiripojana, N. CTAB-assisted sol-microwave method for fast synthesis of mesoporous TiO2 photocatalysts for photocatalytic conversion of glucose to value-added sugars. Mater. Res. Bull. 2017, 95, 546–555. [Google Scholar] [CrossRef]
  17. Wang, C.C.; Lee, C.K.; Lyu, M.D.; Juang, L.C. Photocatalytic degradation of CI Basic Violet 10 using TiO2 catalysts supported by Y zeolite: An investigation of the effects of operational parameters. Dyes Pigm. 2008, 76, 817–824. [Google Scholar] [CrossRef]
  18. Al-Harbi, L.M.; Kosa, S.A.; Maksod, I.H.; Hegazy, E.Z. The photocatalytic activity of TiO2-Zeolite composite for degradation of dye using synthetic UV and Jeddah sunlight. J. Nanomater. 2015, 16, 46. [Google Scholar] [CrossRef] [Green Version]
  19. Peter, A.; Mihaly-Cozmuta, L.; Mihaly-Cozmuta, A.; Nicula, C.; Barbu Tudoran, L.; Vulpoi, A.; Baia, L. Photocatalytic efficiency of zeolite-based TiO2 composites for reduction of Cu (II): Kinetic models. Int. J. Appl. Ceram. Technol. 2014, 11, 568–581. [Google Scholar] [CrossRef]
  20. Tawari, A.; Einicke, W.D.; Gläser, R. Photocatalytic oxidation of NO over composites of titanium dioxide and zeolite ZSM-5. Catalysts 2016, 6, 31. [Google Scholar] [CrossRef]
  21. Colmenares, J.C.; Magdziarz, A.; Kurzydlowski, K.; Grzonka, J.; Chernyayeva, O.; Lisovytskiy, D. Low-temperature ultrasound-promoted synthesis of Cr–TiO2-supported photocatalysts for valorization of glucose and phenol degradation from liquid phase. Appl. Catal. B-Environ. 2013, 134, 136–144. [Google Scholar] [CrossRef]
  22. Chong, R.; Li, J.; Ma, Y.; Zhang, B.; Han, H.; Li, C. Selective conversion of aqueous glucose to value-added sugar aldose on TiO2-based photocatalysts. J. Catal. 2014, 314, 101–108. [Google Scholar] [CrossRef]
  23. Payormhorm, J.; Chuangchote, S.; Kiatkittipong, K.; Chiarakorn, S.; Laosiripojana, N. Xylitol and gluconic acid productions via photocatalytic-glucose conversion using TiO2 fabricated by surfactant-assisted techniques: Effects of structural and textural properties. Mater. Chem. Phys. 2017, 196, 29–36. [Google Scholar] [CrossRef]
  24. Al-Dughaither, A.S.; de Lasa, H. HZSM-5 zeolites with different SiO2/Al2O3 ratios. Characterization and NH3 desorption kinetics. Ind. Eng. Chem. Res. 2014, 53, 15303–15316. [Google Scholar] [CrossRef]
  25. Akel, S.; Dillert, R.; Balayeva, N.O.; Boughaled, R.; Koch, J.; El Azzouzi, M.; Bahnemann, D.W. Ag/Ag2O as a Co-catalyst in TiO2 photocatalysis: Effect of the Co-catalyst/photocatalyst mass ratio. Catalysts 2018, 8, 647. [Google Scholar] [CrossRef] [Green Version]
  26. Handoko, C.T.; Moustakas, N.G.; Peppel, T.; Springer, A.; Oropeza, F.E.; Huda, A.; Strunk, J. Characterization and effect of Ag (0) vs. Ag (I) species and their localized plasmon resonance on photochemically inactive TiO2. Catalysts 2019, 9, 323. [Google Scholar] [CrossRef] [Green Version]
  27. Sanitnon, P.; Chiarakorn, S.; Chawengkijwanich, C.; Chuangchote, S.; Pongprayoon, T. Synergistic effects of zirconium and silver co-dopants in TiO2 nanoparticles for photocatalytic degradation of an organic dye and antibacterial activity. J. Aust. Ceram. Soc. 2003. [Google Scholar] [CrossRef]
  28. Hlekelele, L.; Franklyn, P.J.; Dziike, F.; Durbach, S.H. Novel synthesis of Ag decorated TiO2 anchored on zeolites derived from coal fly ash for the photodegradation of bisphenol-A. New J. Chem. 2018, 42, 1902–1912. [Google Scholar] [CrossRef]
  29. Castro, C.A.; Jurado, A.; Sissa, D.; Giraldo, S.A. Performance of Ag-TiO2 photocatalysts towards the photocatalytic disinfection of water under interior-lighting and solar-simulated light irradiations. Int. J. Photoenergy. 2012, 2012, 261045. [Google Scholar] [CrossRef] [Green Version]
  30. Jaafar, N.F.; Jalil, A.A.; Triwahyono, S.; Efendi, J.; Mukti, R.R.; Jusoh, R.; Suendo, V. Direct in situ activation of Ag0 nanoparticles in synthesis of Ag/TiO2 and its photoactivity. Appl. Surf. Sci. 2015, 338, 75–84. [Google Scholar] [CrossRef]
  31. Francisco, M.S.P.; Mastelaro, V.R. Inhibition of the Anatase-Rutile Phase Transformation with Addition of CeO2 to CuO-TiO2 System: Raman Spectroscopy, X-ray Diffraction, and Textural Studies. Chem. Mater. 2002, 14, 2514–2518. [Google Scholar] [CrossRef]
  32. Christoforidis, K.C.; Fernández-García, M. Photoactivity and charge trapping sites in copper and vanadium doped anatase TiO2 nano-materials. Catal. Sci. Technol. 2016, 6, 1094–1105. [Google Scholar] [CrossRef]
  33. Duan, Y.; Zhang, M.; Wang, L.; Wang, F.; Yang, L.; Li, X.; Wang, C. Plasmonic Ag-TiO2−x nanocomposites for the photocatalytic removal of NO under visible light with high selectivity: The role of oxygen vacancies. Appl. Catal. B 2017, 204, 67–77. [Google Scholar] [CrossRef]
  34. Sun, A.; Li, Z.; Li, M.; Xu, G.; Li, Y.; Cui, P. Room temperature synthesis of spherical mesoporous titania. Powder Technol. 2010, 201, 130–137. [Google Scholar] [CrossRef]
  35. Lv, Y.; Liu, Y.; Zhu, Y.; Zhu, Y. Surface oxygen vacancy induced photocatalytic performance enhancement of a BiPO4 nanorod. J. Mater. Chem. A 2014, 2, 1174–1182. [Google Scholar] [CrossRef]
  36. Jin, X.; Zhao, M.; Vora, M.; Shen, J.; Zeng, C.; Yan, W.; Chaudhari, R.V. Synergistic effects of bimetallic PtPd/TiO2 nanocatalysts in oxidation of glucose to glucaric acid: Structure dependent activity and selectivity. Ind. Eng. Chem. Res. 2016, 55, 2932–2945. [Google Scholar] [CrossRef]
  37. Su, C.; Hong, B.Y.; Tseng, C.M. Sol–gel preparation and photocatalysis of titanium dioxide. Catal. Today 2004, 96, 119–126. [Google Scholar] [CrossRef]
  38. Srisasiwimon, N.; Chuangchote, S.; Laosiripojana, N.; Sagawa, T. TiO2/lignin-based carbon composited photocatalysts for enhanced photocatalytic conversion of lignin to high value chemicals. ACS Sustain. Chem. Eng. 2018, 6, 13968. [Google Scholar] [CrossRef]
  39. Fischer, K.; Gawel, A.; Rosen, D.; Krause, M.; Abdul Latif, A.; Griebel, J.; Schulze, A. Low-temperature synthesis of anatase/rutile/brookite TiO2 nanoparticles on a polymer membrane for photocatalysis. Catalysts 2017, 7, 209. [Google Scholar] [CrossRef]
  40. Köferstein, R.; Ebbinghaus, S.G. Investigations of BaFe0. 5Nb0. 5O3 nano powders prepared by a low temperature aqueous synthesis and resulting ceramics. J. Eur. Ceram. Soc. 2017, 37, 1509–1516. [Google Scholar] [CrossRef] [Green Version]
  41. Valeeva, A.A.; Kozlova, E.A.; Vokhmintsev, A.S.; Kamalov, R.V.; Dorosheva, I.B.; Saraev, A.A.; Rempel, A.A. Nonstoichiometric titanium dioxide nanotubes with enhanced catalytical activity under visible light. Sci. Rep. 2018, 8, 9607. [Google Scholar] [CrossRef] [PubMed]
Figure 1. SEM images of (a) ZeY, (b) 10%TiO2 /ZeY, (c) 20%TiO2/ZeY, (d) 40%TiO2/ZeY, (e) 50%TiO2/ZeY, and (f) TiO2.
Catalysts 10 00423 g001
Figure 2. XRD patterns of TiO2, TiO2/ZeY (at different amounts of TiO2), and ZeY (at different ratios of SiO2:Al2O3).
Catalysts 10 00423 g002
Figure 3. Photocatalytic glucose conversions (■) and product yields [gluconic acid ( Catalysts 10 00423 i001), formic acid (◆), arabinose (△), and xylitol ( Catalysts 10 00423 i002
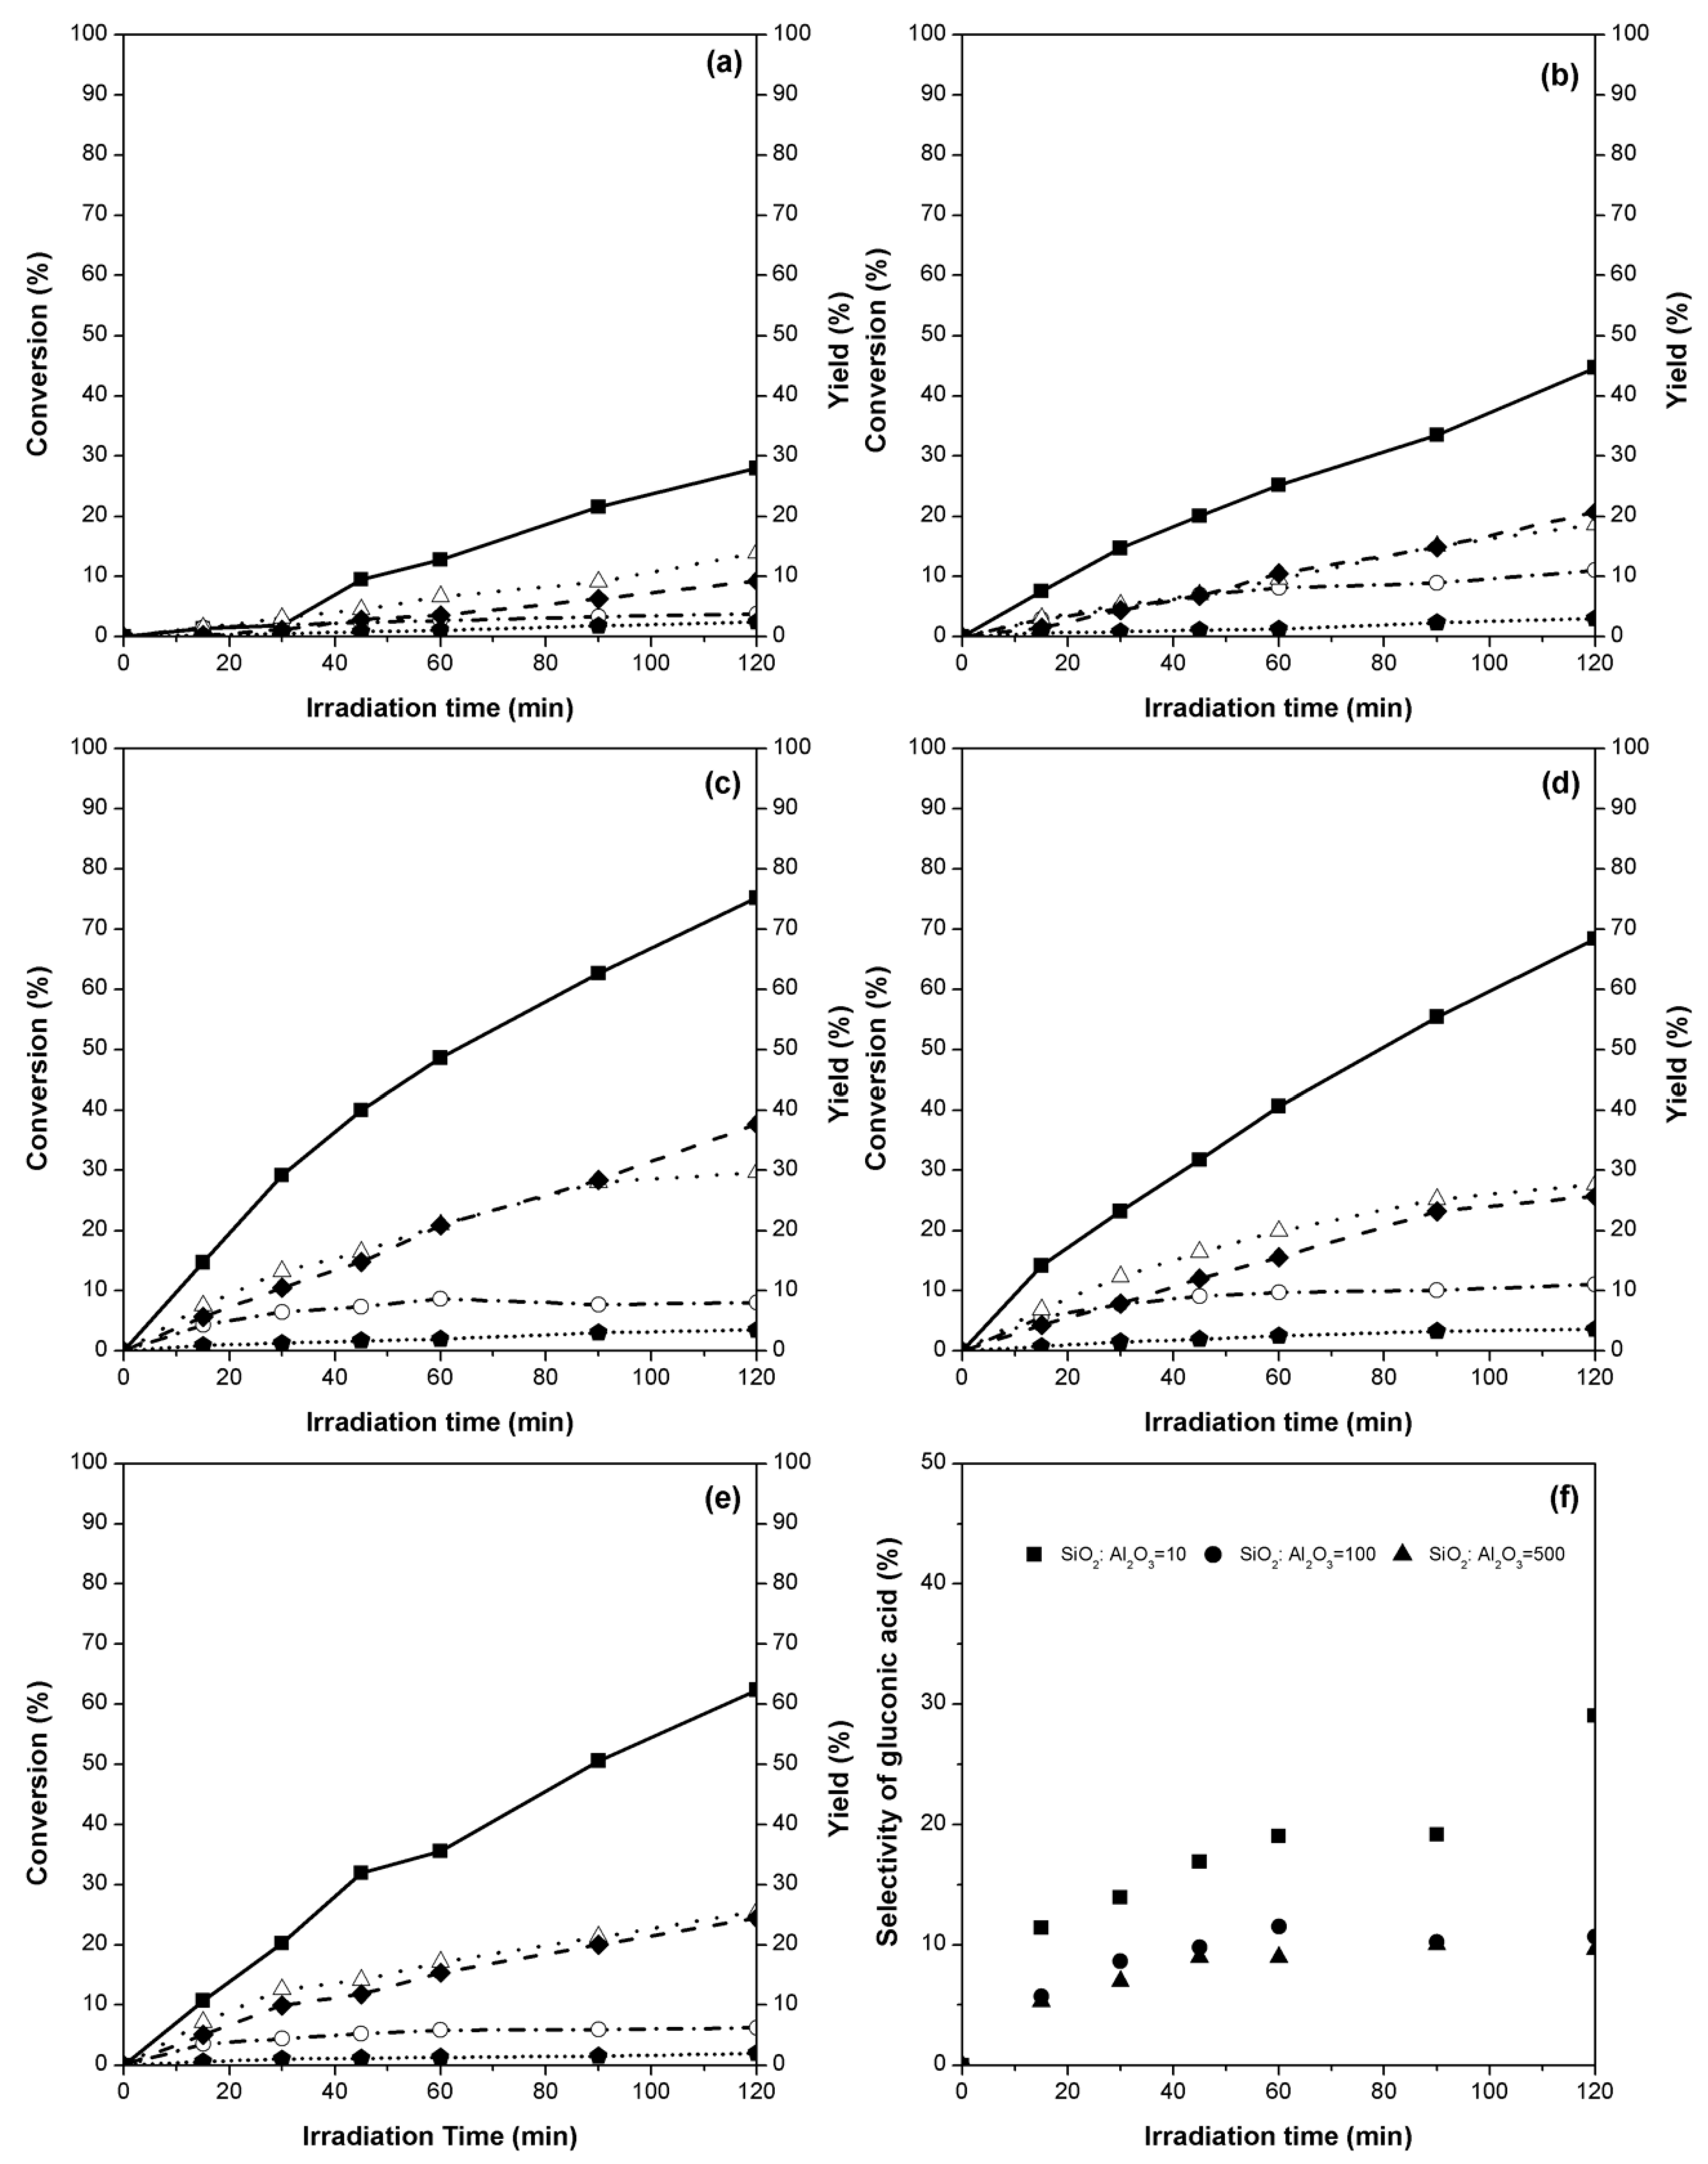
) over (a) TiO2, (b) 10%TiO2/ZeY, (c) 20%TiO2/ZeY, (d) 40%TiO2/ZeY, and (e) 50%TiO2/ZeY, and (f) selectivity of gluconic acid at different ratios of SiO2:Al2O3.
Catalysts 10 00423 g003
Figure 4. XRD patterns of TiO2, TiO2 (40%)/ZeY, Ag-TiO2 (40%)/ZeY (at different wt. %), 1 wt. % Cu-TiO2 (40%)/ZeY, and 1 wt. % Ag-Cu-TiO2 (40%)/ZeY.
Catalysts 10 00423 g004
Figure 5. UV–vis diffuse reflectance spectra of Ag-loaded TiO2 (40%)/ZeY (100%). The inset shows plots of (F(R)·hν)0.5 versus of the catalysts.
Catalysts 10 00423 g005
Figure 6. Electrochemical impedance spectra (EIS) of TiO2/ZeY and 1 wt. % Ag-TiO2/ZeY measured at −0.20 V forward bias.
Catalysts 10 00423 g006
Figure 7. Photocatalytic conversion of glucose of Ag-TiO2 (40%)/ZeY, Cu-TiO2 (40%)/ZeY, and Ag-Cu-TiO2 (40%)/ZeY under UV irradiation for 120 min [(a) and (c)]. Product yield of main products under UV irradiation at 120 min [(b) and (d)].
Catalysts 10 00423 g007
Table 1. Summary of crystal phases, crystallite sizes, particle sizes, specific surface areas (SBET), and pore diameters of TiO2, TiO2/ZeY (10, 20, 40 and, 50 mol % of TiO2 compared with ZeY), and ZeY.
PhotocatalystCrystal Phase (%)Crystallite Size (nm)Particle Size (μm)SBET (m2g−1)Pore Diameter (nm)
TiO2A(95)/R(5)A(30.3)0.56 ± 0.1034.3810.40
50%TiO2/ZeYA(67)/R(33)A(23.57)1.65 ± 0.22419.443.68
40%TiO2/ZeYA(38)/R(62)A(15.14)1.18 ± 0.27494.573.68
20%TiO2/ZeYA(19)/R(81)A(13.27)1.07 ± 0.20524.413.69
10%TiO2/ZeYA(0)/R(0)A(0)0.99 ± 0.23588.363.70
ZeYA(0)/R(0)A(0)1.01 ± 0.18590.763.90
A = anatase, R = rutile.
Table 2. Results from elemental analysis (from EDS) of photocatalysts.
PhotocatalystNominal Metal Loading (wt. %)EDS Analysis (wt. %)
AgCuTiAlSiO
0.5 wt. % Ag-TiO2/ZeY0.50.75-4.022.1531.6761.41
1 wt. % Ag-TiO2/ZeY10.81-10.990.5829.0558.57
3 wt. % Ag-TiO2/ZeY31.76-9.210.5426.7461.75
1 wt. % Cu-TiO2/ZeY1-0.8710.060.4630.6857.93
1 wt. % Ag-Cu-TiO2/ZeY10.280.0810.550.3627.6261.12
Table 3. Summary of characteristics of Ag-loaded TiO2 (40%)/ZeY (70%) catalysts prepared by microwave-assisted incipient wetness impregnation obtained from UV-vis diffuse reflectance spectra.
PhotocatalystWavelength (nm)Eg (eV)
Unloaded3863.00
0.5 wt. % Ag3892.89
1 wt. % Ag3922.82
3 wt. % Ag3942.74
5 wt. % Ag3952.68
1 wt. % Cu3892.78
1 wt. % Ag-Cu3902.91

