Article

Selectivity and Sustainability of Electroenzymatic Process for Glucose Conversion to Gluconic Acid

1
Max Planck Institute for Dynamics of Complex Technical Systems; Sandtorstr 1, 39106 Magdeburg, Germany
2
Process Systems Engineering, Otto-von-Guericke-University Magdeburg, Universitätsplatz 2, 39106 Magdeburg, Germany
3
Institut für Chemie, Otto-von-Guericke-University Magdeburg, 39106 Magdeburg, Germany
*
Author to whom correspondence should be addressed.
Catalysts 2020, 10(3), 269; https://doi.org/10.3390/catal10030269
Submission received: 17 January 2020 / Revised: 17 February 2020 / Accepted: 19 February 2020 / Published: 1 March 2020
(This article belongs to the Special Issue State of the Art and Future Trends in Nanostructured Biocatalysis)

Abstract

:
Electroenzymatic processes are interesting solutions for the development of new processes based on renewable feedstocks, renewable energies, and green catalysts. High-selectivity and sustainability of these processes are usually assumed. In this contribution, these two aspects were studied in more detail. In a membrane-less electroenzymatic reactor, 97% product selectivity at 80% glucose conversion to gluconic acid was determined. With the help of nuclear magnetic resonance spectroscopy, two main side products were identified. The yields of D-arabinose and formic acid can be controlled by the flow rate and the electroenzymatic reactor mode of operation (fuel cell or ion-pumping). The possible pathways for the side product formation have been discussed. The electroenzymatic cathode was found to be responsible for a decrease in selectivity. The choice of the enzymatic catalyst on the cathode side led to 100% selectivity of gluconic acid at somewhat reduced conversion. Furthermore, sustainability of the electroenzymatic process is estimated based on several sustainability indicators. Although some indicators (like Space Time Yield) are favorable for electroenzymatic process, the E-factor of electroenzymatic process has to improve significantly in order to compete with the fermentation process. This can be achieved by an increase of a cycle time and/or enzyme utilization which is currently low.

Graphical Abstract

1. Introduction

Gluconic acid is widely used in pharmaceutical, detergent, food, textile, and other industries [1,2]. It is a product of partial glucose oxidation. Glucose itself belongs to the renewable feedstock for the chemical industry. It is an abundant carbon source with good biodegradability. These aspects make it a platform chemical for different syntheses and a good candidate for replacing the use of fossil raw materials [3,4].
Various routes, including chemical, microbial, enzymatic, and bioelectrochemical, have been employed to convert glucose to gluconic acid. Chemical catalysis attracts a lot of attention as a very fast and efficient way. However, it suffers from low selectivity towards gluconic acid, resulting in further gluconic acid oxidation to glucaric acid [5]. Additionally, the utilization of noble metal catalysts like Pt and Au increases the production costs due to problems with catalyst deactivation and recovery [6,7]. The dominant route for the production of gluconic acid is a fermentation process using different microbial species like Aspergillus niger [8,9], Gluconobacter suboxidans [10], or Aureobasidium pullulans [11]. The major drawbacks of this technology are a complex downstream processing and disposal of large amounts of waste liquids [12]. Alternatively, replacing the whole cell with isolated enzymes will provide numerous advantages over the classical fermentation process. Due to the absence of biomass and less (no) by-products, separation and purification steps might be largely simplified. The use of isolated redox enzymes requires a smart strategy for the co-factor regeneration. Here, electrochemical methods for the co-factor regeneration can be quite advantageous since no co-substrates are needed and no further by-products are formed. These so-called electroenzymatic systems are a highly promising platform for the development of new sustainable processes [13,14,15]. In our previous publication, a novel process for electroenzymatic gluconic acid production was introduced [16], utilizing glucose oxidase (GOx) as a catalyst for glucose oxidation on both anode and cathode sides. It was shown that by changing the electrode structural parameters, the conversion can be improved up to 47%. We demonstrated that under our process conditions a very high Space Time Yield (STY) can be achieved compared to similar processes in literature [17,18,19,20]. In this previous publication, only glucose conversion was determined, but no product selectivity was discussed. Product selectivity is normally not an issue for enzymatic processes since a high selectivity of enzymatic catalysts is assumed [21]. The same applies to electroenzymatic processes, and to date, no publication on this topic considers selectivity issue [16,22]. Still, depending on the reactor design (without or with separator (a “separator”, is a physical barrier inside of an reactor, which either completely separates analyte and catholyte allowing passage of only one type of ion (ion-exchange membrane), or just partly prevents mixing of analyte and catholyte (diaphragm); both possibilities are thinkable in bioelectrochemical systems (for further reading please see for example [13,23]), type of catalysts and regeneration mechanisms on anode/cathode sides, further electrochemical or follow up chemical reactions can take place, decreasing the product selectivity.
Having in mind the high importance of selectivity for technical applications, this issue was studied in detail in the present publication. The product analysis has been performed with the help of nuclear magnetic resonance (NMR) spectroscopy. The influence of operating conditions (flow rate, cell potential, and conversion time) and different cathode catalysts (GOx/Horseradish peroxidase (HRP) combination vs. bilirubin oxidase (BOD)) on glucose conversion and selectivity was checked. In order to increase the understanding of involved processes and their interactions, additional measurements in a 3-electrode set up, followed by product analysis, were performed. Additionally, sustainability of enzymatic processes is usually assumed, without further quantifications. In this publication, sustainability of the electroenzymatic process is estimated based on several sustainability indicators.

2. Results and Discussion

2.1. GOx/GOx-HRP Reactor

The influence of the flow rate on conversion and selectivity in the electroenzymatic reactor with GOx on the anode side and the GOx-HRP cascade on the cathode side has been studied. Flow rates were varied from 0 to 14 mL min−1 at 22 °C, pH 6.00 and 20 mM glucose concentration (Figure 1a). In general, an increase of the flow rate improves the glucose mass transport. This provides more reactant to the electrode surface improving the electrochemical performance of the reactor from 0.2 mA cm−2 without electrolyte circulation to approx. 0.6 mA cm−2 at 14 mL min−1 (the maximal power density of 109 μW cm−2 has been achieved at 0.45 V (Figure S1)). These performances in the fuel cell mode of operation (Ucell > 0, icell > 0) are comparable to performances of other glucose/oxygen enzymatic fuel cells [24,25,26,27,28]. The electroenzymatic reactor in the present study also outperforms significantly other fuel cells based on the same combination of anode and cathode catalysts (e.g., approx. 16 µW cm−2 at 160 mM glucose and pH 6 was achieved in [27]). During performance measurements, the half-cell potentials were measured simultaneously in addition to the overall cell potential by using a reference electrode (Figure 1b). Due to the position of the reference electrode (at the middle distance between the anode and the cathode), the half-cell potentials always contain a contribution of the Ohmic drop in the electrolyte. The values in Figure 1b have been plotted in terms of overpotentials defined with respect to the open circuit values, without correction for the Ohmic drop in the electrolyte. The calculated values of the Ohmic drop have been presented in the same graph. As can be seen, the Ohmic drop loss in the electrolyte is very small due to very low currents in the electroenzymatic reactor. The results in Figure 1b show that the cathode overpotential is strongly influenced, while the anode overpotential is only slightly influenced by the flow rate. In our previous publication [22], the influence of the mass transport was studied under half-cell conditions. According to these data, both the anode and the cathode were influenced by the electrode rotation rate. This influence was larger at higher overpotentials (from ca. 0.2 to 0.4 V (anode) and from approx. −0.2 to −0.6 V (cathode)), while it was less expressed at lower overpotentials (up to ca. 0.2 V). Under present conditions (Figure 1b), the anode overpotential does not exceed 0.2 V, while the cathode overpotential goes up to 0.65 V. This explains why there is almost no influence of the flow conditions on the anode, and a larger influence on the cathode side.
In order to study the influence of the flow rate on glucose conversion, the electroenzymatic reactor was operated for 7 h at a constant cell potential of 0.00 V. During this time, the glucose concentrations were determined every hour with the help of an enzymatic assay. The conversion (Figure 2) is first increasing, with the flow rate reaching a maximum of approx. 60% at 5 mL min−1. Further increase of the flow rate (10 and 14 mL min−1) did not improve the glucose conversion (49% and 49.5%, respectively). These data are in contradiction with electrochemical performances of the reactor that increase monotonously with the flow rate change. Additionally, and surprisingly, the flow rate impacts not only the conversion, but also the product selectivity. Therefore, the reaction mixtures after 7 h of operation (at 0.0 V cell potential and at different flow rates), the glucose solution before conversion, as well as lyophilized samples (not shown), were analyzed with the help of nuclear magnetic resonance spectroscopy (NMR). The 1H chemical shifts for α-H1 and β-H1 at the C1 atom of glucose are 5.2 and 4.6 ppm (Figure 3), confirming the glucose structure previously reported in Holade Y. et al. [29]. The chemical shift of 4.1 ppm that is typical for 1H at the C2 position reveals the presence of gluconic acid in the reaction mixture (Figure 3). Furthermore, chemical shifts of 4.5 for H1 and 96.6, 72.3, 71.7, 68.4, and 66.3 ppm for C1 (Figure S2) in the 1H and 13C spectra (obtained from the lyophilized sample) are typical for the presence of D-arabinose. D-arabinose is a monosaccharide with 5 carbon atoms, and it has high importance for vitamin B2 and DNA syntheses. Although most saccharides in nature occur normally in their D-form, D-arabinose is not abundant in nature, but L-arabinose [30]. The chemical shift of 8.4 refers to the typical peak position of H1 for formic acid (Figure 3). This also was confirmed in 1D wet NMR spectra in [31]. Based on the information obtained from the 1H spectra, the selectivity towards gluconic acids and product yields were calculated according to equations 2 and 3, taking into account only amounts of gluconic acid, glucose, arabinose, and formic acid. The traces of the other products that were also found in the reaction mixture due to low quantities were not taken into consideration for yields and selectivity calculations. Ratios of the obtained peaks for each sample are marked in the spectra (see Figure S3). The selectivity and yield data have been summarized in Table 1. So, based on the NMR results, the major by-products of the electroenzymatic glucose oxidation under present conditions are formic acid and arabinose. The largest yield of arabinose (7%) was obtained at the lowest flow rate of 2 mL min−1. At 5 mL min−1 only traces of arabinose and approx. 2% of the formic acid were detected. At this flow rate, the highest selectivity with respect to the gluconic acid was observed. At higher flow rates (10 and 14 mL min−1), the selectivity for gluconic acid decreased again and the yield of arabinose increased to approx. 3%.
C = moles   of   Reactant   consumed   moles   of   Reactant   total
S = moles   of   Product   moles   of   Reactant   consumed
Y = moles   of   Product   moles   of   Reactant   total
As shown in Table 1, the total glucose conversion based on NMR correlates well with the values obtained using the glucose assay. The selectivity for gluconic acid follows, similar to the conversion, the bell-shaped dependence on the flow rate, with the highest selectivity of 96.5% at 5 mL min−1 flow rate. The selectivity data obtained in the electroenzymatic reactor, although lower than 100%, are still much higher than normally reported selectivities achieved using traditional catalysts. For example, it was shown that during glucose oxidation to gluconic acid by a concentrated FeCl3 solution at 110 °C, other by-products, like formic, acetic acid, and humins, are formed with a product selectivity in the range from 3 up to 57% depending on the conditions [32]. In the electrocatalytic system using a MnO2/Ti electrode as an anode for glucose oxidation, gluconic and glucaric acids were obtained with the yields of 45% and 49%, respectively [5].
Since the by-products are not expected in enzymatic processes, and they have not been reported before, the mechanisms of their formation is studied further. In general, in electrochemical systems, product selectivity can be influenced by electrode potentials. Additionally, in the absence of a separator (as in the present case), the products of reactions on the anode and cathode sides might react with each other. In the present electroenzymatic reactor, glucose was converted on both electrodes. One artificial and one natural mediator (TTF and oxygen) were involved into glucose conversion on the anode and cathode sides, respectively. Due to electrochemical mediator regeneration on the anode side, one can expect the formation of oxidized TTF form (TTF+), which might diffuse out of the anode catalyst layer. On the cathode side, hydrogen peroxide is formed due to the presence of the enzymatic cascade, which can be either further enzymatically consumed, or it can diffuse out of the catalyst layer. So, to understand the mechanisms of by-product formation in the electroenzymatic reactor anode and cathode potentials, over 7 h of operation were monitored (Figure 4). For the zero cell potential, and by neglecting the Ohmic drop in the electrolyte, the cell potential balance provides the same values for the anode and cathode half-cell potentials. Therefore, the lines in Figure 4 describe the changes of both anode and cathode potentials over time. Considering that for system understanding the changes of overpotentials (the overpotentials were expressed with respect to ocp values of anode and cathode reactions) are more insightful, these values were plotted in the Figure 4b,c for three different flow rates. As can be seen, the overpotentials of two electrodes are changing in different ways at different flow rates. While the cathode overpotential at 10 mL min−1 increases over time, the opposite trend has been observed for the cathode overpotential at the lowest flow rate (2 mL min−1). In comparison to other flow rates, the cathode and anode overpotentials at 5 mL min−1 are not changing significantly. In general and as observed in Figure 1b, the whole system is limited by the enzymatic cathode. At higher flow rates, the enzymatic cathode performs better, thus the cathode overpotential is lower. Consequently, the enzymatic anode can also operate at higher overpotentials. The initial behaviors of the enzymatic reactor at three different flow rates correspond to the behaviors presented in Figure 1. The increase of the cathode overpotential over time at 10 mL min−1 indicates cathode deterioration. At the same time at the low flow rate, the cathode seems to improve over time. One possible reason for the cathode deterioration at higher flow rates is catalyst leaching, which might happen since enzymes have been only physically adsorbed [16]. Additionally, at higher flow rates, the cathode operates (at first) at low overpotentials. Under such conditions, based on our simulation results, the cathode works through; with the hydrogen peroxide concentration reaching mM range [33].
HRP inhibition by its product hydrogen peroxide has been reported at concentrations higher than 5 mM [22]. Therefore, enzyme inhibition by the hydrogen peroxide might be responsible for the loss of activity of the cathode at higher flow rates. This seems not to be the case at lower flow rates. At low flow rate, the initially high cathode overpotentials favor more efficient hydrogen peroxide removal, therefore lower hydrogen peroxide concentrations inside of the catalyst layer. Still, a decrease of the overpotential over time might indicate the accumulation of hydrogen peroxide, which renders overpotentials lower over time. Hydrogen peroxide is produced in situ, where the rate of its production depends on GOx loading and glucose/oxygen flow rates, but not significantly on the electrochemical potential. An increase of the hydrogen peroxide concentration might be first followed by a decrease of the cathode overpotential. At lower overpotentials, inhibition effects might appear. This indeed was observed at 2 mL min−1 flow rate after approx. 4 h of operation. So, it can be postulated that the observed electrode potential profiles reflect the fine balance between the rates of hydrogen peroxide production (not dependent on potential), its consumption (potential dependent), its removal (flow rate dependent), as well as kinetics of enzyme inhibition (indirectly potential dependent). Based on this, one might assume that these profiles indirectly reflect the changes of hydrogen peroxide concentrations in the catalyst layer over time. One can deduce that at low cathode overpotentials, the hydrogen peroxide concentration in the catalyst layer will be high (10 mL min−1 t < 2 h, 2 mL min−1 t > 3 h), while at high overpotentials it will be low (10 mL min−1 t > 2 h, 2 mL min−1 t < 3 h). These dependences were also confirmed in our simulation studies [33]. The overpotentials of the cathode at 5 mL min−1 are always moderate. That might indicate the best balance between rates of hydrogen peroxide production and consumption which resulted in almost 100% selectivity for gluconic acid.
In the previous discussion, the cathode was implicitly considered responsible for the lowering of the gluconic acid selectivity. To confirm this, the anode and the cathode were studied separately in half-cells. Two kinds of experiments were conducted where anode and cathode overpotentials were predominantly high or predominantly low over 7 h of operation. The change of the electrode potentials in the half-cell was roughly mimicking the conditions of the electrode potential change during 7 h of reactor operation. The conditions of the experiments are summarized in Table 2. The reaction mixtures after 7 h of operation were analyzed by NMR. The results show that the selectivity on the anode side is independent on the overpotential. No by-products were detected on the anode side. On the cathode side, the selectivity was much below 100% and it was overpotential dependent (approx. 80% at high overpotentials and approx. 70% at low overpotentials). The electrode overpotentials are also influencing the glucose conversion. On the anode side, a conversion of only 6% was achieved at low overpotentials compared to 34% at high overpotentials. On the cathode side, the overall conversion was higher than on the anode side, and it followed the same tendency as the overpotential. The glucose conversion on the anode side follows Faraday’s law (100% current efficiency is calculated), which is not the case for the conversion on the cathode side (14% and 16% of conversion is based on electrical current passed through the cell (“electrochemical conversion”)). On the cathode side, glucose is converted in an enzymatic reaction. Therefore, the Faraday’s law based conversion correlates merely with the amount of the electrochemically reduced hydrogen peroxide by-product. Having in mind the large difference between the electrochemical and the overall conversion on the cathode side, one can assume that the large amount of hydrogen peroxide will be unreacted on the cathode side and might contribute to side reactions or to enzyme inhibitions.
Possible pathways for the side product formation are shown in Figure 5. Hydrogen peroxide can react with D-glucose or with D-gluconic acid. In both cases, D-arabinose might be formed. In addition to D-arabinose, formic acid or CO2 could emerge. Furthermore, in the presence of hydrogen peroxide, D-arabinose can be oxidized stepwise to formic acid [34,35]. D-glucose oxidation with hydrogen peroxide has been reported at temperatures between 120–200 °C [36]. In this process, many by-products were formed, but no D-arabinose. The production of D-arabinose and lower carbohydrates is based on chemical oxidation of sodium gluconate with sodium hypochlorite or the electrochemical oxidation in a fluidized bed reactor [30,37,38]. Additionally, Ruff oxidative degradation of gluconate to arabinose has been reported in the presence of hydrogen peroxide and iron (III) or copper (II) as catalysts [39]. The formation of D-arabinose based on pathways depicted in Figure 5 has not been reported so far in electroenzymatic systems.
In order to check which of the two pathways shown in Figure 5 is more likely to occur, further experiments with C1 labeled D-glucose were performed. The labeled D-glucose is a glucose molecule that has an isotope 13C at the position C1. The utilization of this glucose type does not change, nor has any influence on the reaction mechanism and enzyme catalytic activity. If the route goes through glucose oxidation with H2O2, formic acid containing the C1 glucose atom and D-arabinose are formed (Figure 5). If the second route is operative, oxidation of D-gluconic acid gives D-arabinose and CO2 (which should also contain the C1 glucose atom), that can easily exit the reaction mixture. Formic acid, in addition to the pathway described in Figure 5, can be formed by further degradations of glucose oxidation products. The presence of 13C in the formic acid spectra would confirm the pathway with glucose oxidation by hydrogen peroxide. However, the NMR spectra obtained from this experiment do not show any sharp signals for 13C, at the typical position for formic acid. This confirms that the D-arabinose is formed by gluconic acid and not by glucose oxidation (Figure S5). This brings us to the conclusion that formic acid might be formed by D-arabinose degradation to lower sugars. Unfortunately, as discussed before, their concentrations are too low to be detected by NMR.
The half-cell experiments have shown that the conversion on the anode side is favored by more positive anode potentials, while on the cathode side by more negative. Having in mind that at the cell potential of 0.0 V, anode and cathode potentials are mandatory the same, and that under the fuel cell mode of operation the cathode potential is always more positive than the anode, it appears logical to test the conversion and selectivity of the reactor operating into ion-pumping mode. The glucose conversion and selectivity were checked at cell potential of −0.1 V at a prolonged time of operation of 16 h. The half-cell potentials were monitored by using the reference electrode, and the results are presented in Figure 6a. The data on conversion and selectivity are summarized in Table 3. As can be seen, the cathode and anode potentials follow the same trend, as observed at the cell potential of 0.0 V and at the 5 mL min−1 flow rate (Figure 4). During the first ca. 4 h of operation, both anode and cathode potentials become more positive. Afterwards, they become more negative. As already commented, the initial changes of potentials into positive direction might be caused by a local increase of the hydrogen peroxide concentration in the catalyst layer. The change of potentials into negative direction is likely influenced by a decrease of the glucose concentration in the reactor over time. As expected, the overall glucose conversion increased to 72%, while the selectivity remained high (approx. 96%). The main by-product under these conditions is formic acid, and only traces of D-arabinose were detected. During this experiment, the cathode potentials were mostly below 0 V. In this potential range, oxygen can be reduced electrochemically on Vulcan carbon support (Figure S7), forming mainly hydrogen peroxide [40,41]. The consequences of this are twofold; on one side, oxygen which is needed for the enzymatic oxidation of glucose is used up. On the other side, additional hydrogen peroxide is formed. This might explain a small decrease of selectivity in comparison to the experiment at 0 V cell potential and the presence of D-arabinose only in trace amounts. In an additional experiment, the cell potential change over time was further modified, and the time of operation was increased to 21 h (Figure 6b,c). The cell potential has been changing from an overall ion-pumping mode of operation (−0.1 V) to an overall fuel cell mode of operation (0.05 V). The results on conversion and selectivity in Table 3 show a further increase of conversion (to 80%), followed by a small decrease of selectivity. The main side products were D-arabinose and formic acid.

2.2. GOx/BOD Reactor

To avoid by-product formation, an electroenzymatic reactor comprising a GOx anode (GOx-TTF/Vulcan-Gelatin) and a bilirubin oxidase (BOD) cathode has been developed. The main advantages of employing BOD as a catalyst on the cathode side are: (1) No intermediate step with hydrogen peroxide formation, (2) same optimal operation window as for GOx (pH 7.00, 37 °C), (3) in comparison to GOx-HRP electrode, BOD enzymatic electrode performs better (Figure S8). The main disadvantage is that glucose conversion takes place only at the anode side.
In terms of electrochemical performances, the GOx/BOD reactor outperforms the GOx/GOx-HRP reactor (Figure 7). Only the ocp value is a bit lower (approx. 0.7 V compared to approx.0.8 V for the GOx/GOx-HRP reactor), which is caused by a less positive ocp value of the BOD cathode in comparison to the GOx-HRP cathode (Figure S8). The reactor employing BOD at the cathode side reached a power density of approx. 0.2 mW cm−2 and a current density of approx. 0.9 mA cm−2. These values are in good agreement with literature values of similar fuel cells [24,42]. The glucose conversion and selectivity in these two reactors have been compared at a cell potential of 0.0 V and 5 mL min−1 flow rate (Figure 8, Table 4). Under these conditions, the GOx/BOD combination achieved less than 30% of glucose conversion, while GOx/GOx-HRP achieved approx. 60%. As expected, the GOx/BOD reactor was highly selective towards the glucose conversion, and no by-products were detected.

2.3. Process Sustainability

The importance of development of more sustainable and green processes in comparison to already existing alternatives brings the need for the evaluation of electroenzymatic route in this direction. The process sustainability can be evaluated by life cycle analysis (LCA) with cradle-to-grave approach [43]. This requires the inventory and environmental impacts assessment of all input and outputs of the production system, but due to the multiplicity of processes and chemicals involved, and availability of data, prices, and energy requirements, this approach is hardly applicable for the processes in early stage of development. Therefore, some indicators of sustainability from two categories (efficiency and environment) are selected for comparison between fermentation and the electroenzymatic process (Table 5). The analysis is restricted to reactor level, since not enough data are available for separation of reaction mixture exiting the electroenzymatic reactor. In the category efficiency four indicators were chosen: Space time yield (STY), product titre, reaction yield, and atom efficiency. As environmental indicator, so called E-factor is determined. Since, for the calculation of this indicator, not all data are available in all publications, an environmental indicator was calculated only for the present electroenzymatic and a selected fermentation process.
The STY is defined as a mass of product obtained during the cycle time (tcycle) in a reactor of volume VR. This definition is a bit different than the one used in our previous publication [16], where the STY was defined with respect to the electrode surface area. This was done in order to account for differences in the geometrical electrode surface areas (from 1 cm2 to 30 cm2) and total reaction volumes (from 28 to 200 cm3) between the reported electroenzymatic processes [17,18,19,20,44]. However, in order to enable more straightforward comparison with fermentation processes, STY in the present paper is expressed with respect to reactor volume. The two values of STY for the present electroenzymatic process are obtained from experiments where the total reaction volume was changing. The conversion time for the smaller volume (30 cm3) was shorter than for the larger one (70 cm3), while the STY was almost the same (ca. 35 ± 1 g dm−3 h−1). As can be seen in Table 5, the present electroenzymatic process outperforms other electroenzymatic processes, and other reported fermentation processes in terms of STY.
Yet, the product titre is low and the cycle times are a bit longer than for other electroenzymatic processes. The product titre of all reported electroenzymatic processes (ca. 1.66–14.5 g dm−3) is much lower than of fermentation processes (ca. 100–350 g dm−3), since the majority of enzymatic processes utilize very diluted glucose solutions (20 mM). The low product titre is increasing the end price of the product, however, based on literature for product titre larger than 10 g dm−3, the effect on the production cost becomes negligible [46]. One can assume that the product titre in the present work (3.1 g dm−3) should increase at least 4 times for the process to become competitive with fermentation. The cycle time is directly related to the total reaction volume and the required conversion. In the present study, the decrease of the total volume to 30 cm3 decreases the cycle time to 8 h (for the same reactor volume and the same conversion).
The reaction yields (amount of product/theoretical amount of product) (Table 5) are calculated based on conversion and selectivity data. Since the selectivity data are not provided for other electroenzymatic processes, their reaction yields are calculated assuming 100% selectivity. The atom efficiency is calculated based on reaction stoichiometry for all discussed processes (Equations (4)–(11)).
For fermentation process:
Glucose + O2 = D-glucono-1,5 lactone + H2O2 (catalyzed by GOx)
H2O2 = H2O + 1/2 O2 (catalyzed by catalase)
D-glucono-1,5 lactone + H2O = gluconic acid (hydrolysis)
Overall: Glucose + 1/2O2 = gluconic acid
For electroenzymatic process in this work:
Anode:
Glucose = D-glucono-1,5 lactone + 2H+ + 2e (catalyzed by GOx)
Cathode:
Glucose + O2 = D-glucono-1,5 lactone + H2O2
H2O2 + 2H+ + 2e = 2H2O (catalyzed by HRP)
2D-glucono-1,5 lactone + 2H2O = 2gluconic acid (hydrolysis)
Overall: Glucose + 1/2O2 = gluconic acid
The overall stoichiometry for the fermentation and the present electroenzymatic process is the same, giving the same atom efficiencies (100%). The overall stoichiometry for other electroenzymatic processes, assuming hydrogen evolution reaction on the cathode side reads:
Overall: Glucose + H20 = gluconic acid + H2
resulting in a bit decreased atom efficiency (99%)
The E-factor represents the ratio between kg waste and kg product [47]. For electroenzymatic process, waste calculation included, the waste formed during enzyme production, waste of biocatalyst, and carbon materials/mediators needed to be replaced at the end of one production cycle. For fermentation process, the waste included the amount of the biomass formed in the reactor during one production cycle. For both processes, water and inorganic salts used for buffering of solutions are excluded from the waste calculation. Additionally, for electroenzymatic process, waste formed during carbon nanoparticles production was not taken into account.
The amount of biomass formed during enzyme production is estimated from the literature data, which relates the enzyme activity per dm3 with the biomass dry weight (DW) per dm3 [48] or biomass wet weight (WW) per dm3 [49]. For GOx, typically enzymatic activity of 4000 U dm−3 corresponds to ca. 4.2 gDW_biomass dm−3. GOx enzyme, which was employed in the present manuscript, had activity of 200 U mgenzyme−1, therefore it was calculated that 0.21 gDW_biomass mgenzyme−1 will be formed. Since some loss of enzymes occurs during purification steps, this was additionally accounted for by respecting the literature yield data (these data relate the total enzyme activity after each purification step and the activity of the original homogenate). The values which are reported for GOx are between 63.3 and 95.6% yield. By assuming the more conservative value of the yield, one can estimate that 0.33 gDW_biomass mgenzyme−1 enzyme will be formed. The amount of enzyme which was needed for formation of an enzymatic anode was 1 mg cm−2, while for enzymatic cathode 0.6 mg cm−2. The total biomass required for formation of required GOx loadings on the anode and cathode sides were 0.53 gDW_biomass cm−2. Additionally, the cathode contained as the second enzyme horseradish peroxidase. Based on literature, 0.714 gWW_biomass is formed per 1 mg of HRP enzyme, assuming enzyme activity of 1000 U mgenzyme−1 [49]. The HRP loading on the cathode side was 1.8 mg cm−2, so one can estimate that 1.3 gDW_biomass cm−2 was required to form this amount of active enzyme. In total, the amount of biomass was 1.8 gbiomass cm−2 (this number contains some water, since the value for the HRP is reported as a wet weight value). This value is normalized with respect to the reactor volume, to allow the comparison with the fermentation process according to:
waste   ( kg   dm 3 ) = biomass   ( kg   dm 2 )   ×   A electrode ( dm 2 ) A electrode ( dm 2 )   ×   distance ( dm ) waste   of   enzyme   production + total   enzyme   loading   ( kg   dm 2 )   ×   A electrode ( dm 2 ) A electrode ( dm 2 )   ×   distance ( dm ) waste   of   biocatalyst + ( total   carbon   loading + mediator   loading ) ( kg   dm 2 )   ×   A electrode ( dm 2 ) A electrode ( dm 2 )   ×   distance ( dm ) waste   of   other   materials = 6 , 0 ( kg   dm 3 ) waste   of   enzyme   production + 0.011   ( kg   dm 3 ) waste   of   biocatalyst + 0.011   ( kg   dm 3 ) waste   of   other   materials = 6.022   kg   dm 3
The E-factor has been further calculated based on:
E factor =   waste   ( kg   dm 3 )   product   ( kg   dm 3 ) =   waste   ( kg   dm 3 )   STY   ( kg   h 1 dm 3 )   ×   t cycle = ca .9
The calculated E-factor for the fermentation process, based on process described in [11] is ca. 0.06. This analysis suggests that the E-factor of electroenzymatic process has to improve significantly in order to compete with the fermentation process. There are several possibilities to achieve this. At first, the life time of enzymatic electrodes (tcycle) has to increase. Assuming 6 months of continuous operation of electroenzymatic reactor (tcycle = 6 month × 30 day month−1 × 24 h day−1), the E factor will reduce to 0.04, which is close to the value calculated for the fermentation process. In general, GOx-electrodes are stable under optimal conditions for a couple of months [50,51,52]. In the present case, the stability of enzymatic electrode depends primarily on the immobilization procedure applied. Under present conditions, the enzymatic anode is very stable, while the enzymatic cathode shows a decrease of activity of ca. 25% over time. This loss is attributed to the leaching out effect as shown in Varnicic et al. [16].
Further possibility for the waste reduction is a decrease of enzyme loadings. Our data show that the reduction of enzyme loading to only half of the original loading is changing the overall activity only a little. However, 50% reduction of enzyme loadings will results in only factor 2 in waste and E-factor reduction. The analysis points out an additional problem of electroenzymatic process, which is related to enzyme utilization in enzymatic electrodes. Based on our calculations, the enzyme utilization in the enzymatic electrodes is very low [53]; only ca. 0.01% can be considered active. Therefore, increase of enzyme utilization would contribute significantly to the waste reduction. As a last point, product titre has to increase, which means that more concentrated glucose solutions are required to improve process sustainability.
The product titre is influencing the product separation. Low product titre, as in the case of electroenzymatic process, has significant impact on the product cost [46]. It additionally restricts the choice of separation technology. In the present case, electrodialysis could be a technology of choice. Based on patent data [54], two step electrodialysis could be used to separate gluconic acid from the reaction mixture, while the buffer solution and non-reacted glucose are recycled back to the process. This elegant option would significantly simplify the downstream processing of the electroenzymatic process compared to fermentation [45]. Still, the sustainability analysis of such reactor/separator unit including in addition to efficiency and environmental also some energy indicators of the suitability have to be conducted.

3. Materials and Methods

3.1. Chemicals and Instrumentation

All reagents, poly(vinylidene fluoride) (PVDF), glutaraldehyde (GA), 1-methyl-2-pyrrolidone (MP), D-glucose, D-Glucose-1-13C, tetrathiafulvalene (TTF), and sodium phosphate dibasic were purchased from Sigma-Aldrich, Taufkirchen, Germany. Gelatin for microbiology was supplied from Merck, Gernsheim, Germany. Potassium dihydrogen phosphate was provided by Carl Roth GmbH&Co.KG, Karlsruhe, Germany. Vulcan XC72 carbon nanomaterials were supplied by Cabot Corporation, Rheinfelden, Germany.
Biocatalysts, glucose oxidase (EC 1.1.3.4, 200 U mg−1 GOx) from Aspergillus niger and bilirubin oxidase from Myrotheciumverrucaria (EC 1.3.3.5, 15–16 U mg−1 protein, BOD) were supplied by Sigma-Aldrich, Taufkirchen, Germany. Horseradish peroxidase (EC 1.11.1.7, 1000 U mg−1 lyophil., HRP) from Amorica rusticana was provided by Serva Electrophoresis GmbH, Heidelberg, Germany. All solutions were prepared with Millipore water.
The electrochemical experiments were carried out using Autolab potentiostat (PGSTAT302, Eco Chemie), Metrohm Autolab B.V., Utrecht The Netherlands. The reactor was operated as a 2-electrode system, while for half-cell investigations, the 3-electrode set up using a rotating disk electrode (RDE, model ED101, Radiometer Analytical, Düsseldorf, Germany) as a working electrode was employed. A saturated calomel electrode (SCE) was used as a reference and Pt as a counter electrode. During the reactor operation, anode and cathode electrode potentials were measured with external voltmeters connected to the reference electrode (see Figure 9). All experiments were conducted in 20 mM glucose solution in 0.1 M phosphate buffer at pH 6.00 or 7.00. Temperature was in the range between 22 °C and 37 °C. The polarization curves were obtained by extracting the data from chronopotentiostatic measurements after 120 s at constant potential with a potential step of 0.05 V.
The glucose concentrations were measured spectrophotometrically (UV/Vis spectrophotometer, SPECORD S600, Analytik jena, Jena, Germany) with the help of glucose assay kits (UV-test, R-Biopharm, Darmstad, Germany).
Nuclear magnetic resonance spectroscopy was performed in D2O as a solvent at 400.13 frequency (NMR, Bruker DPX, Oudenbosch, Nederland 400 MHz (400.13 MHz for 1H; 100.61 MHz for 13C) and Bruker AV 600 MHz (600.13 MHz for 1H), AVANCE III, Bruker, Billerica, US), and was used to obtain information about system conversion, selectivity, and products yields.

3.2. Enzymatic Electrode Preparations

Enzymatic electrodes were prepared by following two procedures. Both of them are based on using Vulcan carbon nanomaterials as support for biocatalysts. The difference was in binding material and way of enzyme immobilization. In the procedure used for the anode side named “GOx-TTF/Vulcan-Gelatin”, 2% of gelatin solution was employed as a binder. A homogeneous suspension (100 μL) of carbon nanoparticles (20 mg mL−1), enzyme (10 mg mL−1), and tetrathiafulvalene (10 mg mL−1) in gelatin were cast on stainless steel discs, which were used as current collectors. After drying at room temperature, electrodes were cross-linked by immersion in 5% glutaraldehyde solution for 1 min. The second procedure, specified as “GOx-HRP/Vulcan-PVDF”, was used for the cathode side. It combines previously prepared Vulcan carbon nanoparticles (2 mg mL−1) bound by PVDF (0.25% in MP) on the carbon disc or hydrophilic Toray paper (TGP-H-060, Toray Deutschland GmbH) porous matrix, with physical biocatalyst adsorption. On the anode side, GOx was used, while on the cathode side, either GOx: HRP enzyme cascade (6 mg mL−1 of GOx and 18 mg mL−1 of HRP) or BOD (10 mg mL−1) were used as biocatalysts. Enzyme solutions were always freshly prepared using 0.1 M phosphate buffer. The adsorption time was 18 h for the cascade and 2 h for BOD. Both procedures for enzymatic electrode preparation already were described in detail in Varnicic et al. [16,22]. The electrodes used in the electroenzymatic reactor had the geometrical surface area of 1 cm2, while the surface area of the working electrode in the 3-electrode set up was 0.28 cm2.

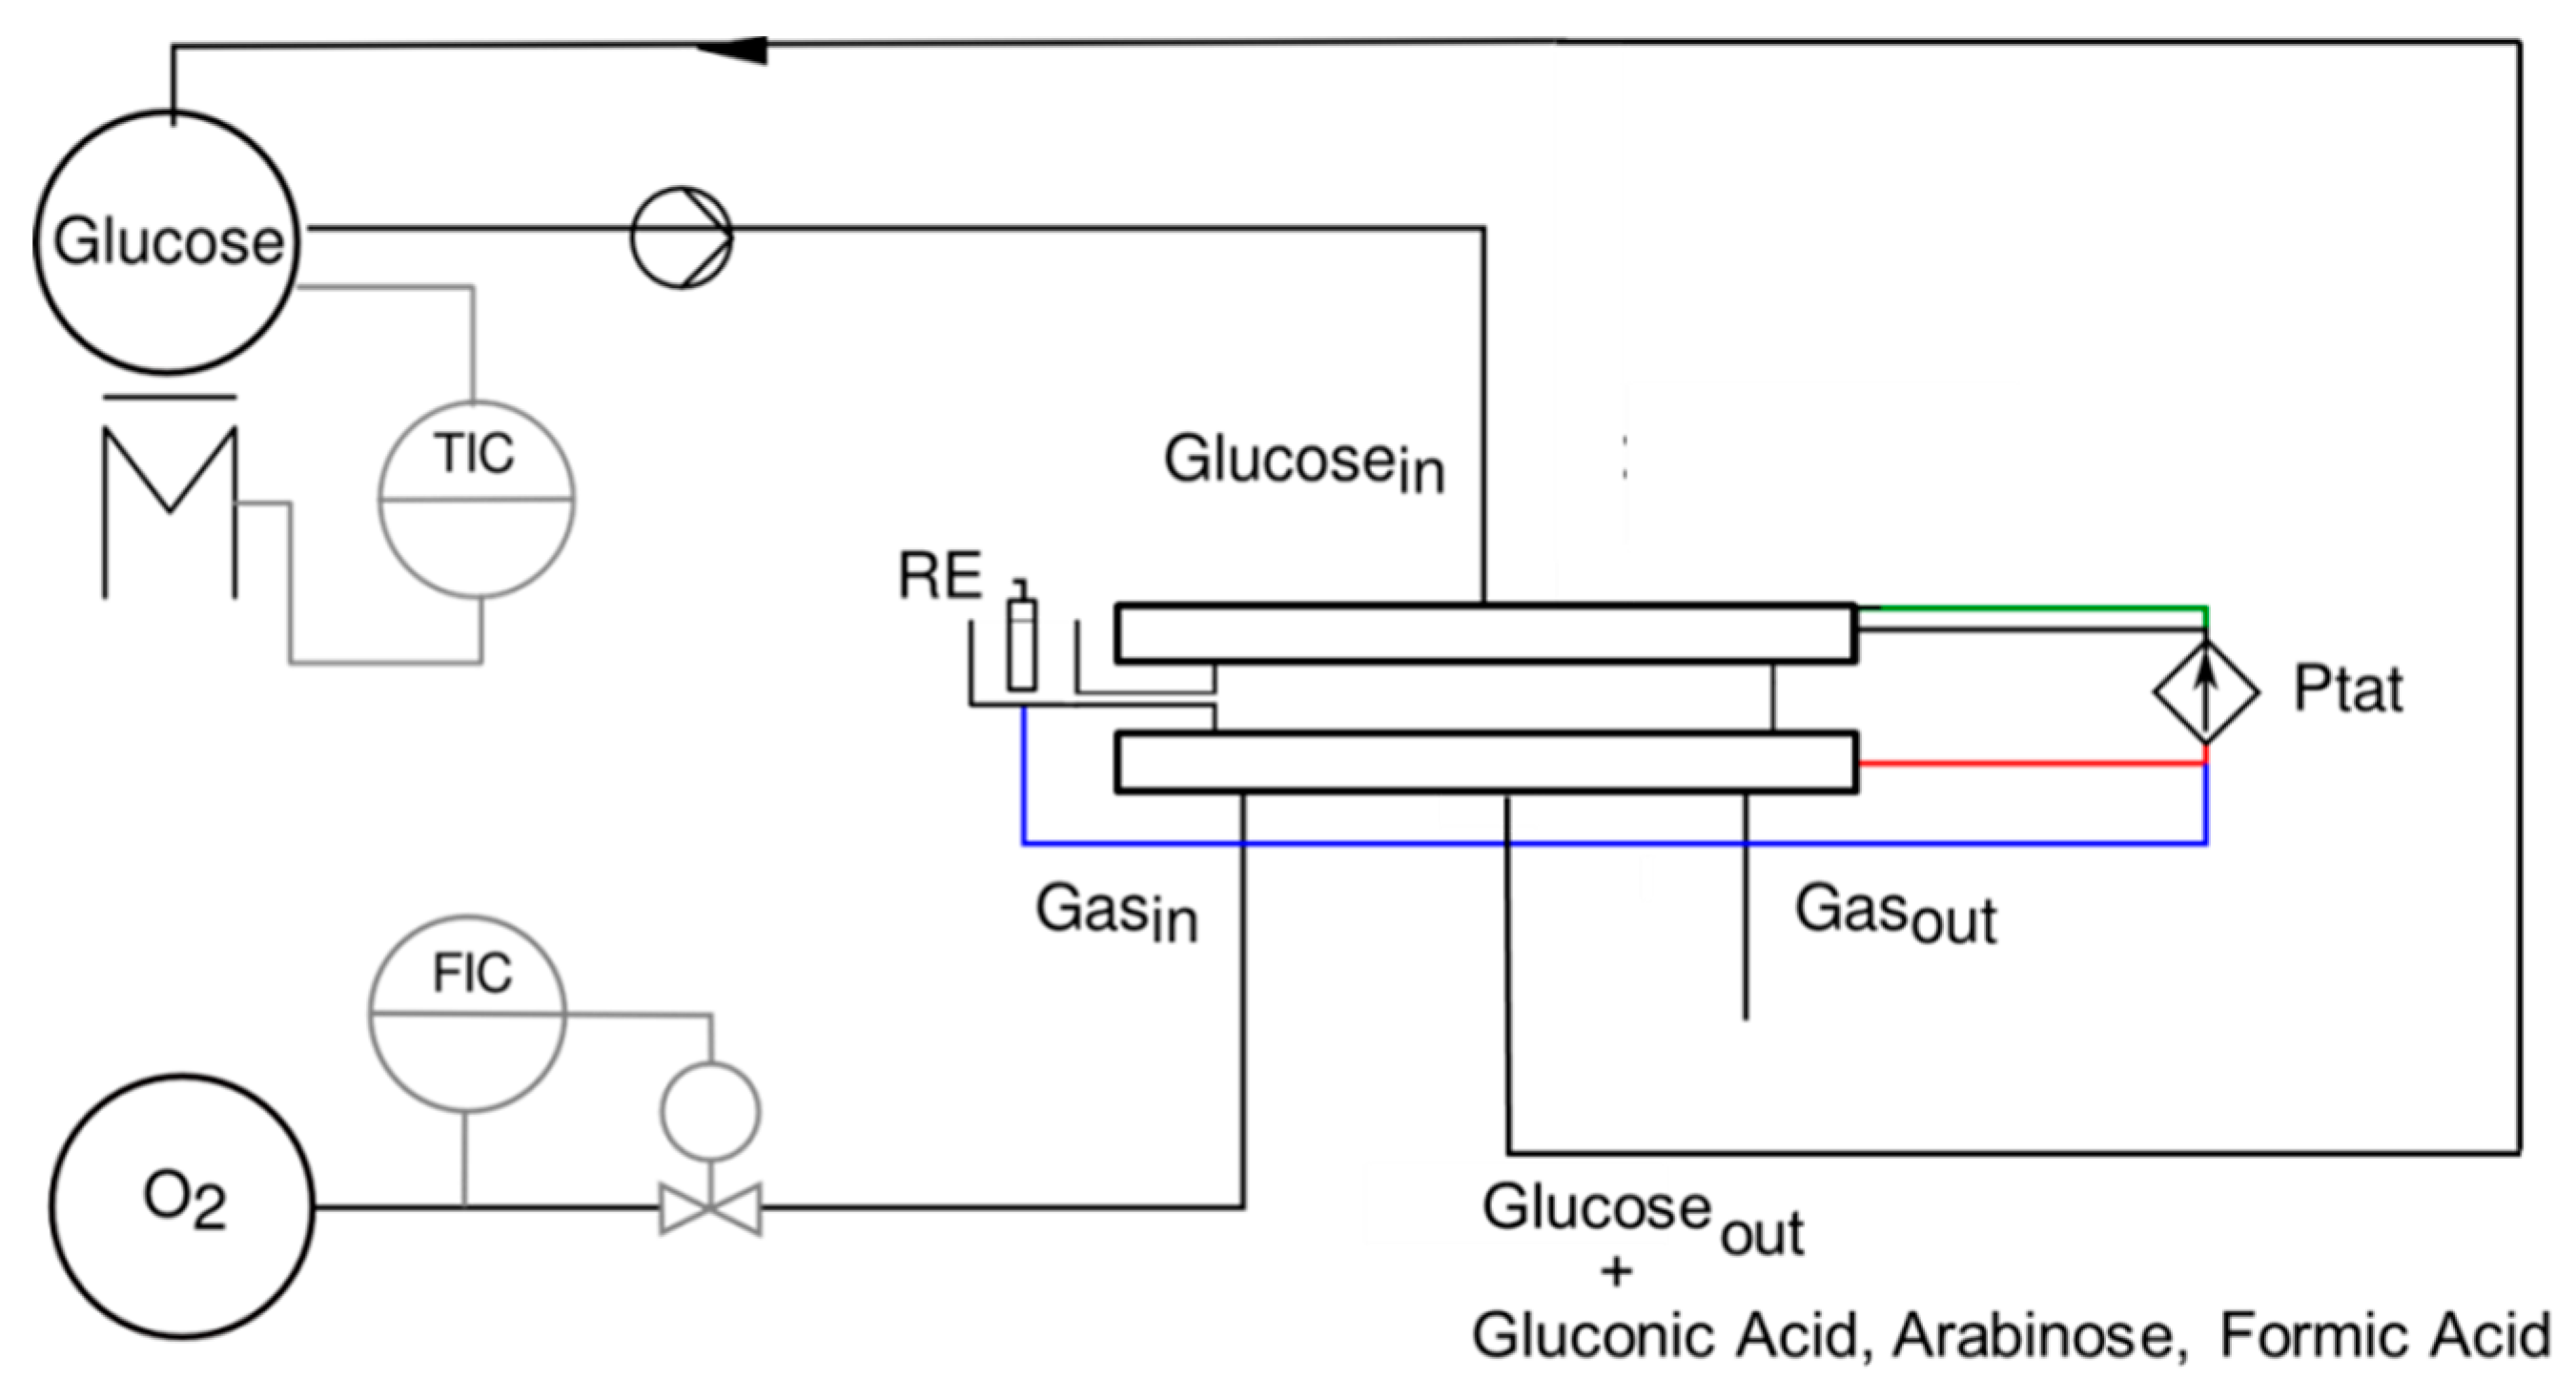
3.3. Electroenzymatic Reactor

The electroenzymatic reactor was already described in our previous publication [16]. In short, a parallel plate configuration with the distance of 3 mm between the electrodes was used. No separator was implemented, and the opening for the reference electrode was positioned in the middle of the distance between the anode and the cathode (Figure 9). Stainless steel and a graphite flow field were employed as current collectors on the anode and cathode sides, respectively. Glucose solution, prepared at least one day before, was recirculated from reservoir (Vr = 70 mL) with the flow rate variation from 2 to 14 mL min−1. Oxygen was supplied from the gas phase at the constant flow rate of 500 mL min−1. On the cathode side, between the graphite flow field and the hydrophilic Toray paper, an additional hydrophobic Toray paper was implemented.

4. Conclusions

The influences of flow rate, cell potential, operational time and type of biocatalysts on the performance of the electroenzymatic reactor for glucose oxidation were studied. An increase of the flow rate has a positive impact on the electrochemical performance of the reactor. In the case of conversion and selectivity, a bell-shaped dependence on the flow rate was observed. During 7 h of operation, the largest conversion and selectivity (60% and 97% respectively) was observed at 5 mL min−1. By adjusting the cell potential and the conversion time (21 h), conversions up to 80% at a somewhat reduced selectivity (92%) can be achieved. The half-cell measurements under conditions simulating the electrode potential changes in the reactor followed by NMR product analyses revealed that the enzymatic cathode, based on the GOx-HRP cascade, is mainly responsible for the decreasing of selectivity. It was postulated that the intermediate product of glucose oxidation by enzymatic cascade, namely hydrogen peroxide, is responsible for the formation of side products in the reactor. Two main side products were detected: D-arabinose and formic acid. The possible pathways for their formation were suggested. Based on experiments with C1 labeled glucose, the D-arabinose is formed by degradation of gluconic acid with hydrogen peroxide. This pathway has not been reported so far in literature regarding electroenzymatic synthesis. The electroenzymatic reactor employing GOx and BOD catalysts showed 100% selectivity for the glucose oxidation. However, the level of conversion was below 30%.
The preliminary sustainability analysis suggests that the E-factor of electroenzymatic process has to improve significantly in order to compete with the fermentation process. One possibility is to operate continuously electroenzymatic process for at least 6 months and/or to improve enzyme utilization within electrodes, which will allow reduction in enzyme loading necessary for preparation of the enzymatic electrodes. The comparison of the STY between the fermentation processes (0.1–21 g dm−3 h−1) and the present electroenzymatic process (ca. 35 ± 1 g dm−3 h−1), reveals the potential of the electroenzymatic process for gluconic acid production.

Supplementary Materials

The following are available online at https://www.mdpi.com/2073-4344/10/3/269/s1, Figure S1: Power curve of the electroenzymatic reactor at 10 mL min−1 flow rate, 20 mM glucose and O2 supplied from the gas phase at the cathode side; Figure S2: NMR spectra of lyophilized sample for D-arabinose presentation a) 1H spectra b) 13C spectra; Figure S3: NMR analysis of reaction solutions after 7 h in electroenzymatic reactors tested at three different flow rates (a) 10 mL min−1, (b) 5 mL min−1 and (c) 2 mL min−1; Figure S4: NMR analysis of reaction mixtures after 7 h of enzymatic electrodes operation in half-cell experiments, (a) and (b), anode at different potentials; (c) and (d) cathode, at different potentials, Conditions presented in Table 2; Figure S5: NMR spectra with labeled glucose (13C spectra); Figure S6: NMR results for electroenyzmatic reactors operated at two different conditions of cell potential and time, 5 mL min −1 (a) cell potential −0.1 V, time 16 h and (b) cell potential variation between −0.1 to 0.05, time 21 h, Conditions presented in Table 3; Figure S7: Polarization curves of Vulcan nanomaterial in the presence and absence of oxygen; Figure S8: Comparison of BOD and GOx-HRP enzymatic electrode obtained in half-cell system, 20 mM glucose, Conditions for BOD-electrode: pH 7.00, 37 °C, for GOx-HRP: pH 6.00, 22 °C; 400 rpm, O2.

Author Contributions

Conceptualization, M.V. and T.V.-K.; formal analysis, M.V., I.N.Z., and E.H.; investigation, M.V. and I.N.Z.; visualization, M.V.; writing—original draft preparation, M.V.; writing—review and editing, T.V.-K.; supervision, T.V.-K. and K.S. All authors have read and agreed to the published version of the manuscript.

Funding

This research was funded by Max Planck Institute for Dynamics of Complex Technical Systems, Magdeburg, Germany.

Conflicts of Interest

The authors declare no conflict of interest.

References

  1. Anastassiadis, S.; Morgunov, I.G. Gluconic acid production. Recent Pat. Biotechnol. 2007, 1, 167–180. [Google Scholar] [CrossRef]
  2. Ramachandran, S.; Fontanille, P.; Pandey, A.; Larroche, C. Gluconic acid: Properties, applications and microbial production. Food Technol. Biotechnol. 2006, 44, 185–195. [Google Scholar]
  3. Tong, X.L.; Ma, Y.; Li, Y.D. Biomass into chemicals: Conversion of sugars to furan derivatives by catalytic processes. Appl. Catal. A-Gen. 2010, 385, 1–13. [Google Scholar] [CrossRef]
  4. Murzin, D.Y.; Leino, R. Sustainable chemical technology through catalytic multistep reactions. Chem. Eng. Res. Des. 2008, 86, 1002–1010. [Google Scholar] [CrossRef]
  5. Bin, D.; Wang, H.; Li, J.; Wang, H.; Yin, Z.; Kang, J.; He, B.; Li, Z. Controllable oxidation of glucose to gluconic acid and glucaric acid using an electrocatalytic reactor. Electrochim. Acta 2014, 130, 170–178. [Google Scholar] [CrossRef]
  6. Biella, S.; Prati, L.; Rossi, M. Selective oxidation of D-glucose on gold catalyst. J. Catal. 2002, 206, 242–247. [Google Scholar] [CrossRef]
  7. Zhang, H.; Watanabe, T.; Okumura, M.; Haruta, M.; Toshima, N. Catalytically highly active top gold atom on palladium nanocluster. Nat. Mater. 2012, 11, 49–52. [Google Scholar] [CrossRef] [PubMed]
  8. Blom, R.H.; Pfeifer, V.F.; Moyer, A.J.; TraufRer, D.H.; Conway, H.F.; Crocker, C.K.; Farison, R.E.; Hannibal, D.V. Sodium gluconate production-fermentation with Asppergillus niger. Ind. Eng. Chem. 1952, 44, 435–440. [Google Scholar] [CrossRef]
  9. Sankpal, N.V.; Kulkarni, B.D. Optimization of fermentation conditions for gluconic acid production using Aspergillus niger immobilized on cellulose microfibrils. Process Biochem. 2002, 37, 1343–1350. [Google Scholar] [CrossRef]
  10. Velizarov, S.; Beschkov, V. Biotransformation of glucose to free gluconic acid by Gluconobacter oxydans: Substrate and product inhibition situations. Process Biochem. 1998, 33, 527–534. [Google Scholar] [CrossRef]
  11. Anastassiadis, S.; Aivasidis, A.; Wandrey, C. Continuous gluconic acid production by isolated yeast-like mould strains of Aureobasidium pullulans. Appl. Microbiol. Biotechnol. 2003, 61, 110–117. [Google Scholar] [CrossRef] [PubMed]
  12. Doneva, T.; Vassilieff, C.; Donev, R. Catalytic and biocatalytic oxidation of glucose to gluconic acid in a modified three-phase reactor. Biotechnol. Lett. 1999, 21, 1107–1111. [Google Scholar] [CrossRef]
  13. Krieg, T.; Sydow, A.; Schröder, U.; Schrader, J.; Holtmann, D. Reactor concepts for bioelectrochemical syntheses and energy conversion. Trends Biotechnol. 2014, 32, 645–655. [Google Scholar] [CrossRef] [PubMed]
  14. Dencic, I.; Meuldijk, J.; Croon, M.; Hessel, V. From a review of noble metal versus enzyme catalysts for glucose oxidation under conventional conditions towards a process design analysis for continuous-flow operation. J. Flow Chem. 2011, 1, 13–23. [Google Scholar] [CrossRef]
  15. DevauxBasseguy, R.; Gros, P.; Bergel, A. Electroenzymatic processes: A clean technology alternative for highly selective synthesis? J. Chem. Technol. Biotechnol. 1997, 68, 389–396. [Google Scholar] [CrossRef]
  16. Varničić, M.; Vidaković-Koch, T.; Sundmacher, K. Gluconic acid synthesis in an electroenzymatic reactor. Electrochim. Acta 2015, 174, 480–487. [Google Scholar] [CrossRef] [Green Version]
  17. Manjon, A.; Obón, J.M.; Casanova, P.; Fernández, V.M.; Iborra, J.L. Increased activity of glucose dehydrogenase co-immobilized with a redox mediator in a bioreactor with electrochemical NAD(+) regeneration. Biotechnol. Lett. 2002, 24, 1227–1232. [Google Scholar] [CrossRef]
  18. Obon, J.M.; Casanova, P.; Manjon, A.; Fernández, V.M.; Iborra, J.L. Stabilization of glucose dehydrogenase with polyethyleneimine in an electrochemical reactor with NAD(P)(+) regeneration. Biotechnol. Prog. 1997, 13, 557–561. [Google Scholar] [CrossRef]
  19. Gros, P.; Bergel, A. Electrochemically enhanced biosynthesis of gluconic acid. AIChE J. 2005, 51, 989–997. [Google Scholar] [CrossRef]
  20. Miyawaki, O.; Yano, T. Electrochemical bioreactor with immobilized glucose-6-phosphate-dehydrogenase on the rotating graphite disc electrode modified with phenazine methosulfate. Enzym. Microb. Technol. 1993, 15, 525–529. [Google Scholar] [CrossRef]
  21. Wohlgemuth, R. Biocatalysis-key to sustainable industrial chemistry. Curr. Opin. Biotechnol. 2010, 21, 713–724. [Google Scholar] [CrossRef]
  22. Varnicic, M.; Bettenbrock, K.; Hermsdorf, D.; Vidaković-Koch, T.; Sundmacher, K. Combined electrochemical and microscopic study of porous enzymatic electrodes with direct electron transfer mechanism. RSC Adv. 2014, 4, 36471–36479. [Google Scholar] [CrossRef] [Green Version]
  23. Wendt, H.; Kreysa, G. Electrochemical Engineering Science and Technology in Chemical and Other Industries; Springer: Berlin, Germany, 1999; p. 199. ISBN 978-3-642-08406-5. [Google Scholar]
  24. Reid, R.C.; Giroud, F.; Minteer Shelley, D.; Bruce, K.G. Enzymatic biofuel cell with a flow-through toray paper bioanode for improved fuel utilization. J. Electrochem. Soc. 2013, 160, H612–H619. [Google Scholar] [CrossRef]
  25. Agnes, C.; Reuillard, B.; Goff, A.; Holzinger, M.; Cosnier, S. A double-walled carbon nanotube-based glucose/H2O2 biofuel cell operating under physiological conditions. Electrochem. Commun. 2013, 34, 105–108. [Google Scholar] [CrossRef]
  26. Ramanavicius, A.; Kausaite-Minkstimiene, A.; Morkvenaite-Vilkonciene, I.; Genys, P.; Mikhailovar, R.; Semashko, T.; Voronovic, J.; Ramanaviciene, A. Biofuel cell based on glucose oxidase from Penicillium funiculosum 46.1 and horseradish peroxidase. Chem. Eng. J. 2015, 264, 165–173. [Google Scholar] [CrossRef]
  27. Krikstolaityte, V.; Oztekin, Y.; Kuliesius, J.; Ramanaviciene, A.; Yazicigil, Z.; Ersoz, M.; Okumus, A.; Kausaite-Minkstimiene, A.; Kilic, Z.; Solak, A.O.; et al. Biofuel cell based on anode and cathode modified by glucose oxidase. Electroanalysis 2013, 25, 2677–2683. [Google Scholar] [CrossRef]
  28. Gomez, C.; Shipovskov, S.; Ferapontova, E.E. Peroxidase biocathodes for a biofuel cell development. J. Renew. Sustain. Energy 2010, 2, 013103. [Google Scholar] [CrossRef]
  29. Holade, Y.; Servat, K.; Napporn, T.W.; Morais, C.; Berjeaud, J.M.; Kokoh, K.B. Highly selective oxidation of carbohydrates in an efficient electrochemical energy converter: Cogenerating organic electrosynthesis. Chemsuschem 2016, 9, 252–263. [Google Scholar] [CrossRef] [PubMed]
  30. Chou, C.F.; Chou, T.C. Paired electrooxidation IV. Decarboxylation of sodium gluconate to D-arabinose. J. Appl. Electrochem. 2003, 33, 741–745. [Google Scholar] [CrossRef]
  31. Zargari, N.; Kim, Y.; Jung, K.W. Conversion of saccharides into formic acid using hydrogen peroxide and a recyclable palladium(II) catalyst in aqueous alkaline media at ambient temperatures. Green Chem. 2015, 17, 2736–2740. [Google Scholar] [CrossRef] [Green Version]
  32. Zhang, H.; Li, N. Oxidative conversion of glucose to gluconic acid by iron(III) chloride in water under mild conditions. Green Chem. 2016, 16, 2558. [Google Scholar] [CrossRef]
  33. Do, T.Q.N. Model-Based Analysis of an Electroenzymatic System for Glucose Oxidation; Otto-von-Guericke University Magdeburg: Magdeburg, Germany, 2017; p. 136. [Google Scholar]
  34. Vandenberg, R.; Peters, J.A.; Vanbekkum, H. Selective alkaline oxidative-degradation of monosaccharides and disaccharides by hydrogen-peroxide using borate as catalyst and protecting group. Carbohydr. Res. 1995, 267, 65–77. [Google Scholar] [CrossRef]
  35. Isbell, H.S.; Frush, H.L. Reactions of carbhydrates with hydroperoxides 17. Mechanisms for hydroperoxide degradation of disaccharides and related-compounds. Carbohydr. Res. 1987, 161, 181–193. [Google Scholar] [CrossRef]
  36. Moreno, T.; Kouzaki, G.; Sasaki, M.; Goto, M.; Cocero, M.J. Uncatalysed wet oxidation of D-glucose with hydrogen peroxide and its combination with hydrothermal electrolysis. Carbohydr. Res. 2012, 349, 33–38. [Google Scholar] [CrossRef] [PubMed]
  37. Vallieres, C.; Matlosz, M. A multisectioned porous electrode for synthesis of D-arabinose. J. Electrochem. Soc. 1999, 146, 2933–2939. [Google Scholar] [CrossRef]
  38. Jiricny, V.; Stanek, V. Productionof D-arabinose in a pilot-plant fluidized-bed electrochemical reactor. J. Appl. Electrochem. 1994, 24, 930–935. [Google Scholar] [CrossRef]
  39. Hourdin, G.L.; Germain, A.; Moreau, C.; Fajula, F. The catalysis of the Ruff oxidative degradation of aldonic acids by copper(II)-containing solids. J. Catal. 2002, 209, 217–224. [Google Scholar] [CrossRef]
  40. Gara, M.; Compton, R.G. Activity of carbon electrodes towards oxygen reduction in acid: A comparative study. New J. Chem. 2011, 35, 2647–2652. [Google Scholar] [CrossRef]
  41. Watson, V.J.; Delgado, C.N.; Logan, B.E. Improvement of activated carbons as oxygen reduction catalysts in neutral solutions by ammonia gas treatment and their performance in microbial fuel cells. J. Power Sources 2013, 242, 756–761. [Google Scholar] [CrossRef]
  42. Flexer, V.; Brun, N.; Destribats, M.; Backov, R.; Mano, N. A novel three-dimensional macrocellular carbonaceous biofuel cell. Phys. Chem. Chem. Phys. 2013, 15, 6437–6445. [Google Scholar] [CrossRef] [Green Version]
  43. Gallezot, P. Conversion of biomass to selected chemical products. Chem. Soc. Rev. 2012, 41, 1538–1558. [Google Scholar] [CrossRef] [PubMed]
  44. Basséguy, R.; Délécouls-Servat, K.; Bergel, A. Glucose oxidase catalysed oxidation of glucose in a dialysis membrane electrochemical reactor (D-MER). Bioprocess Biosyst. Eng. 2004, 26, 165–168. [Google Scholar] [CrossRef] [PubMed]
  45. Pal, P.; Kumar, R.; Banerjee, S. Manufacture of gluconic acid: A review towards process intensification for green production. Chem. Eng. Process. 2016, 104, 160–171. [Google Scholar] [CrossRef]
  46. Parish, J.H. A Revolution in Biotechnology; Marx, J.L., Ed.; Cambridge University Press: New York, NY, USA, 1989; ISBN 0-521-32749-0. [Google Scholar]
  47. Sheldon, R.A. E factors, green chemistry and catalysis: An odyssey. Chem. Commun. 2008, 29, 3352–3365. [Google Scholar] [CrossRef]
  48. Jagdish Singh, N.V. Glucose oxides from Aspergillus niger: Production, characterization and immobilization for glucose oxidation. Adv. Appl. Sci. Res. 2013, 4, 250–257. [Google Scholar]
  49. Flocco, C.G.; Alvarez, M.A.; Giulietti, A.M. Peroxidase production in vitro by Armoracia lapathifolia (horseradish)-transformed root cultures: Effect of elicitation on level and profile of isoenzymes. Biotechnol. Appl. Biochem. 1998, 28, 33–38. [Google Scholar]
  50. Khan, G.F.; Ohwa, M.; Wernet, W. Design of a stable charge transfer complex electrode for a third-generation amperometric glucose sensor. Anal. Chem. 1996, 68, 2939–2945. [Google Scholar] [CrossRef]
  51. Pizzariello, A.; Stredansky, M.; Miertus, S. A glucose/hydrogen peroxide biofuel cell that uses oxidase and peroxidase as catalysts by composite bulk-modified bioelectrodes based on a solid binding matrix. Bioelectrochemistry 2002, 56, 99–105. [Google Scholar] [CrossRef]
  52. Merle, G.; Habrioux, A.; Servat, K.; Rolland, M.; Innocent, C.; Kokoh, K.B.; Tingry, S. Long-term activity of covalent grafted biocatalysts during intermittent use of a glucose/O-2 biofuel cell. Electrochim. Acta 2009, 54, 2998–3003. [Google Scholar] [CrossRef]
  53. Do, T.Q.N.; Varnicic, M.; Hanke-Rauschenbach, R.; Vidakovic-Koch, T.; Sundmacher, K. Mathematcal modeling of Porous Enzymatic Electrode with Direct Electron Transfer Mechanism. Electrochim. Acta 2014, 137, 616–626. [Google Scholar] [CrossRef]
  54. Genders, J.D.; Gopal, R.; Hartsough, D.M.; Kendall, P.M.; Long, W.J.; Mazur, D.J.; Zappi, G.D. Electrodialysis Methods for Purification and Recovery of Gluconic acid Derivatives. U.S. Patent 6541228B1, 1 April 2003. [Google Scholar]
Figure 1. (a) Polarization curves of the electroenzymatic reactor at different flow rates; (b) Potential loss distribution, anode: GOx-TTF/Vulcan-Gelatin, cathode: GOx-HRP/Vulcan-PVDF, blue line- 2 mL min−1, red line 5ml min−1, black line 10 mL min−1, Conditions: 20 mM glucose in 0.1 M phosphate buffer, O2 supply from the gas phase, pH 6.00, 22 °C, volume of the glucose reservoir: 70 mL.
Catalysts 10 00269 g001
Figure 2. Glucose conversion during 7 h in an electroenzymatic reactor at different flow rates.
Catalysts 10 00269 g002
Figure 3. NMR product spectra with identified peaks, black line: initial solution; blue line: final solution after 7 h of reactor operation.
Catalysts 10 00269 g003
Figure 4. Change of (a) anode and cathode electrode potentials (Ea = Ec); (b) anode overpotential; (c) cathode overpotential during 7 h of reactors operation at Ucell = 0.0 V.
Catalysts 10 00269 g004
Figure 5. Proposed pathway of glucose oxidation to gluconic acid and other by-products.
Catalysts 10 00269 g005
Figure 6. (a) Change of anode and cathode electrode potentials during reactors operation for the reactor 1; (b) change of anode electrode potential and (c) changed of cathode electrode potential during the reactor operation for the reactor 2, conditions presented in Table 3.
Catalysts 10 00269 g006
Figure 7. Polarization and power curves of electroenzymatic reactors based on two different cathodes, flow rate 5 mL min−1, 20 mM glucose in 0.1 M phosphate buffer, O2 supply from the gas phase, condition for GOx||GOx-HRP: pH 6.00, 22 °C; GOx||BOD system: pH 7.00, 37 °C.
Catalysts 10 00269 g007
Figure 8. Comparison of glucose conversion in two different reactors.
Catalysts 10 00269 g008
Figure 9. Schematic representation of electrochemical reactor experimental facility.
Catalysts 10 00269 g009
Table 1. Nuclear magnetic resonance (NMR) analysis of reaction solutions after 7h in electroenzymatic reactors tested at three different flow rates (Corresponding spectra shown in Supporting information, Figure S3).
Flow Rate/mL min−1Conversion/%Selectivity/%Y:GA/%Y:A/%Y:FA/%
10 and 1449.083.741.5 3.05.0 + traces of other products
557.096.555.0-Traces2.0 + traces of other products
246.073.934.07.05.0 + traces of other products
Y—yield, GA—gluconic acid, A—arabinose, FA—formic acid.
Table 2. NMR analysis of reaction mixtures after 7 h of enzymatic electrodes operation in half-cell experiments, Conditions: 20 mM glucose in 0.1 M PBS, pH 6.00, 22 °C, 70 mL; cathode: In the presence of O2, anode: In presence of N2 (Corresponding spectra shown in Supporting information, Figure S4).
Electrode Ea/Ec/V (Time)Overpotentials/V (Time)Glucose Conversion/%Selectivity/%Y:GA/%Y:A/%Y:FA/%
ANODE:
V-Gel/GOx-TTF
Ea = 0.2 (2 h)
Ea = 0.15 (2 h)
Ea = 0.1 (3 h)
0.35 (2 h)
0.3 (2 h)
0.25 (3 h)
351003401
ANODE:
V-Gel/GOx-TTF
Ea = 0.15 (2 h)
Ea = 0.1 (2 h)
Ea = 0.05 (3 h)
0.30 (2 h)
0.25 (2 h)
0.20 (3 h)
6100600
CATHODE:
V-PVDF/GOx-HRP
Ec = 0.05 (2 h)
Ec = 0.0 V (2 h)
Ec = −0.05 (3 h)
0.50 (2 h)
0.55 (2 h)
0.60 (3 h)
56804466 + traces of other products
CATHODE:
V-PVDF/GOx-HRP
Ec = 0.15 (2 h)
Ec = 0.1 (2 h)
Ec = 0.05 (3 h)
0.4 (2 h)
0.45 (2 h)
0.50 (3 h)
43702977 + traces of other products
Ea—anode electrode potential, Ec—cathode electrode potential, Y—yield, GA—gluconic acid, A—arabinose, FA—formic acid.
Table 3. NMR results for electroenzymatic reactors operated at two different conditions of cell potential and time, 5 mL min −1 (Figure S6).
ReactorTime/hCell Potential/VConversion/%Selectivity/%Y:GA/%Y:A/%Y:FA/%
116U = −0.1 6795.564-Traces3 + traces of other products
221U = −0.1 (5.5 h)
U = −0.05 (3.5 h)
U = 0.0 (3 h)
U = 0.05 (9 h)
80927442 + traces of other products
Table 4. NMR results for electroenzymatic reactors employing different cathodes.
SystemConditionsCell Potential/VFlow Rate/mL min−1Conversion/%Selectivity/%
GOx-HRP based cathodepH 6.00/22 °CUcell = 0.0 56097
BOD based cathodepH 7.00/37 °CUcell = 0.0 528100
Table 5. Comparison of different processes for the gluconic acid production.
IndicatorsElectroenzymatic FermentationElectroenzymatic
STY, g h−1 dm−333.7–36.10.132–210.13–4.9
Product titre, g dm−33.1100–3501.66–14.5
tcycle, h8–2020–1003–12
Reaction yield, %75 74–99.443–85
Atom efficiency, %10010099
E-factor/kg kg−190.06 [11]N/A
ReferencesThis work[45][17,18,19,20,44]

