Ab Initio Multiscale Process Modeling of Ethane, Propane and Butane Dehydrogenation Reactions: A Review


Abstract
1. Introduction
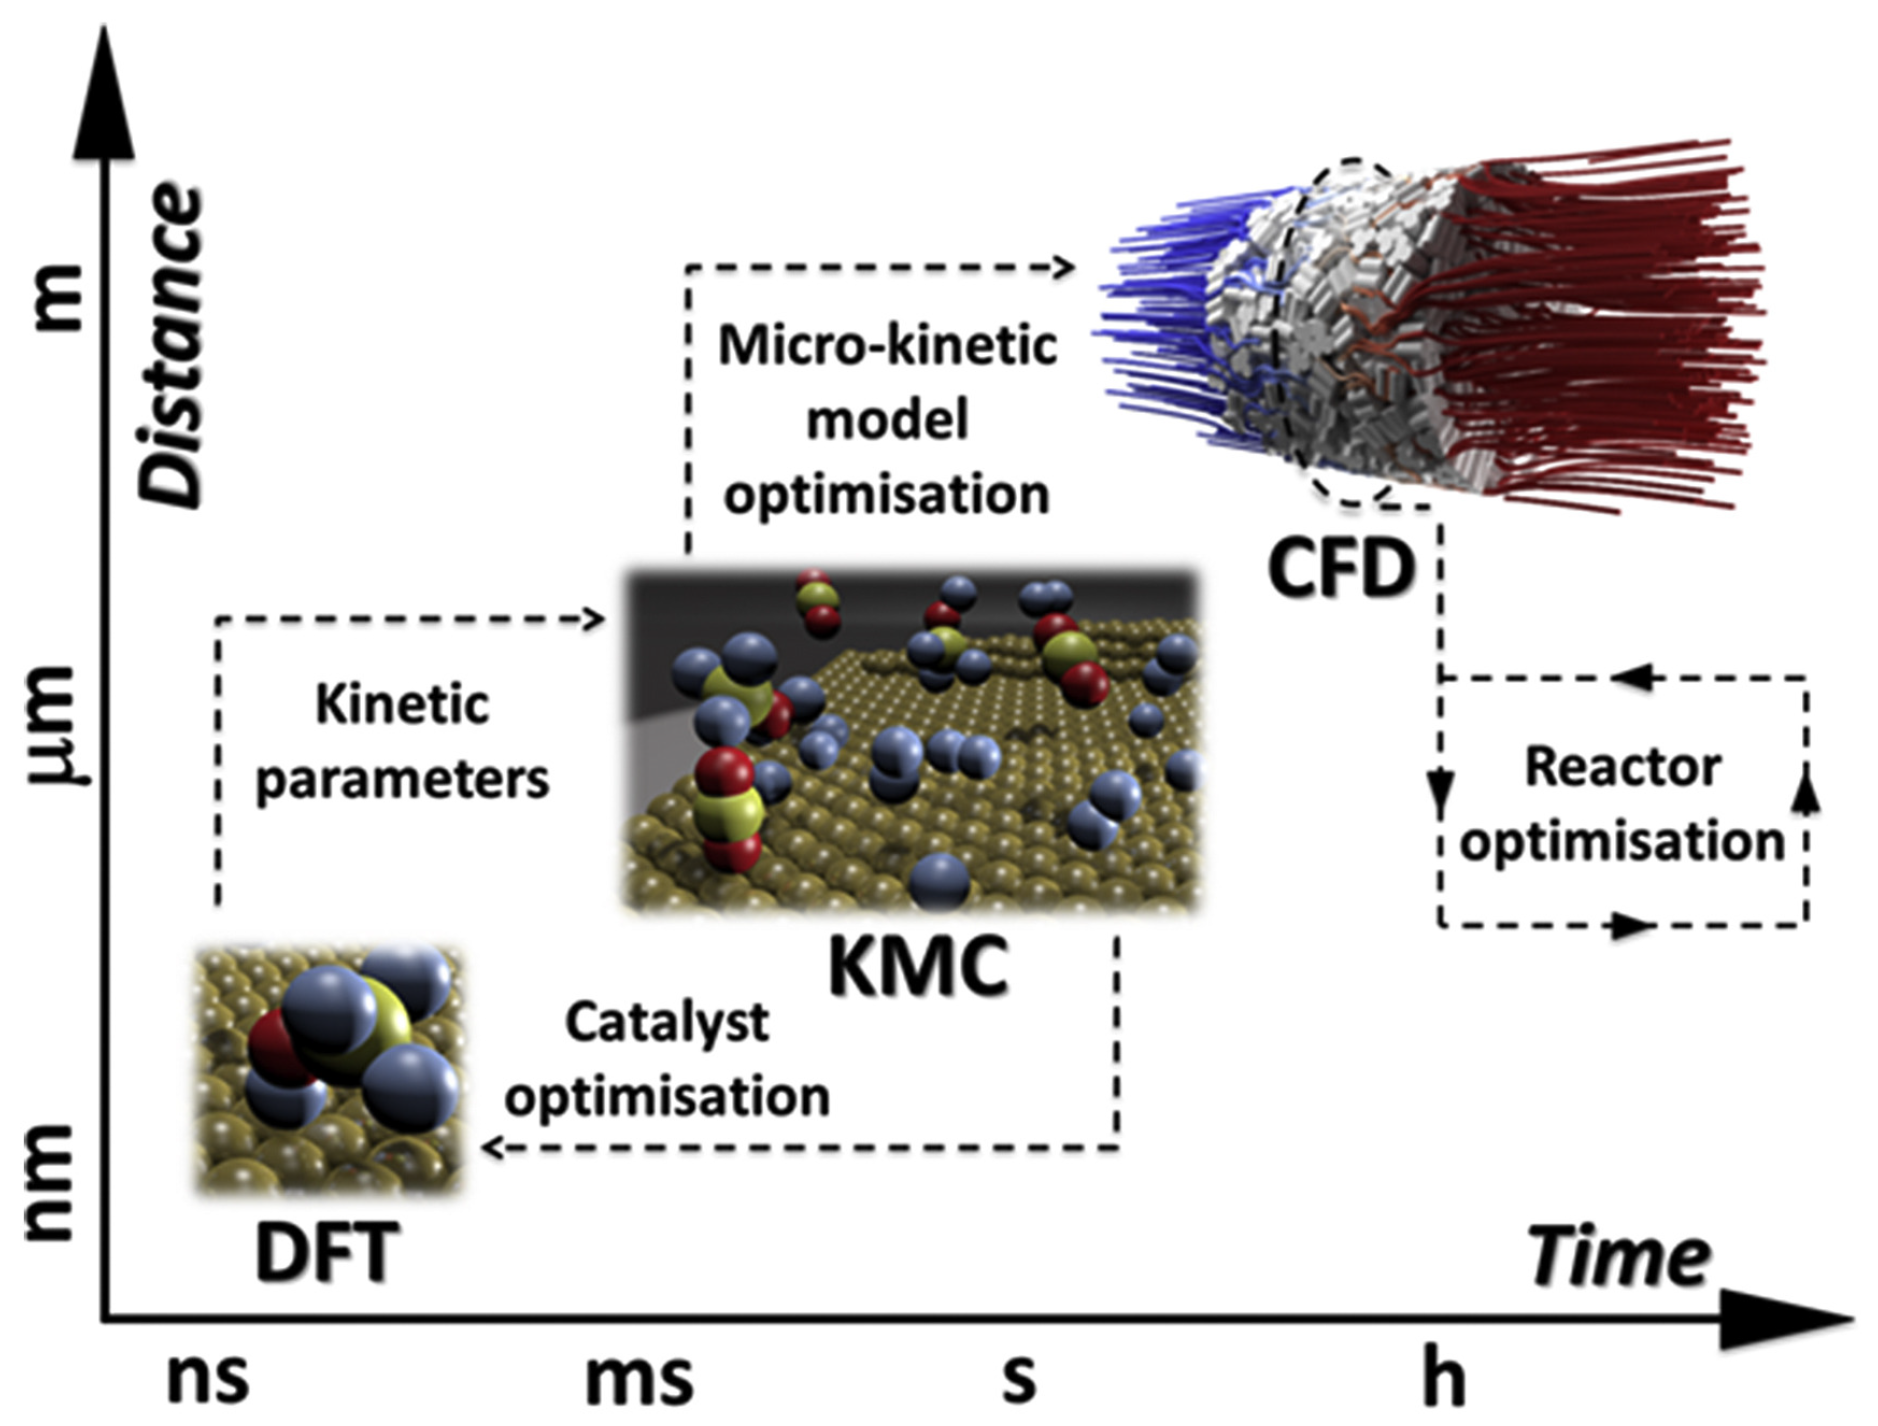
2. On Multiscale Modeling
3. Results and Discussion
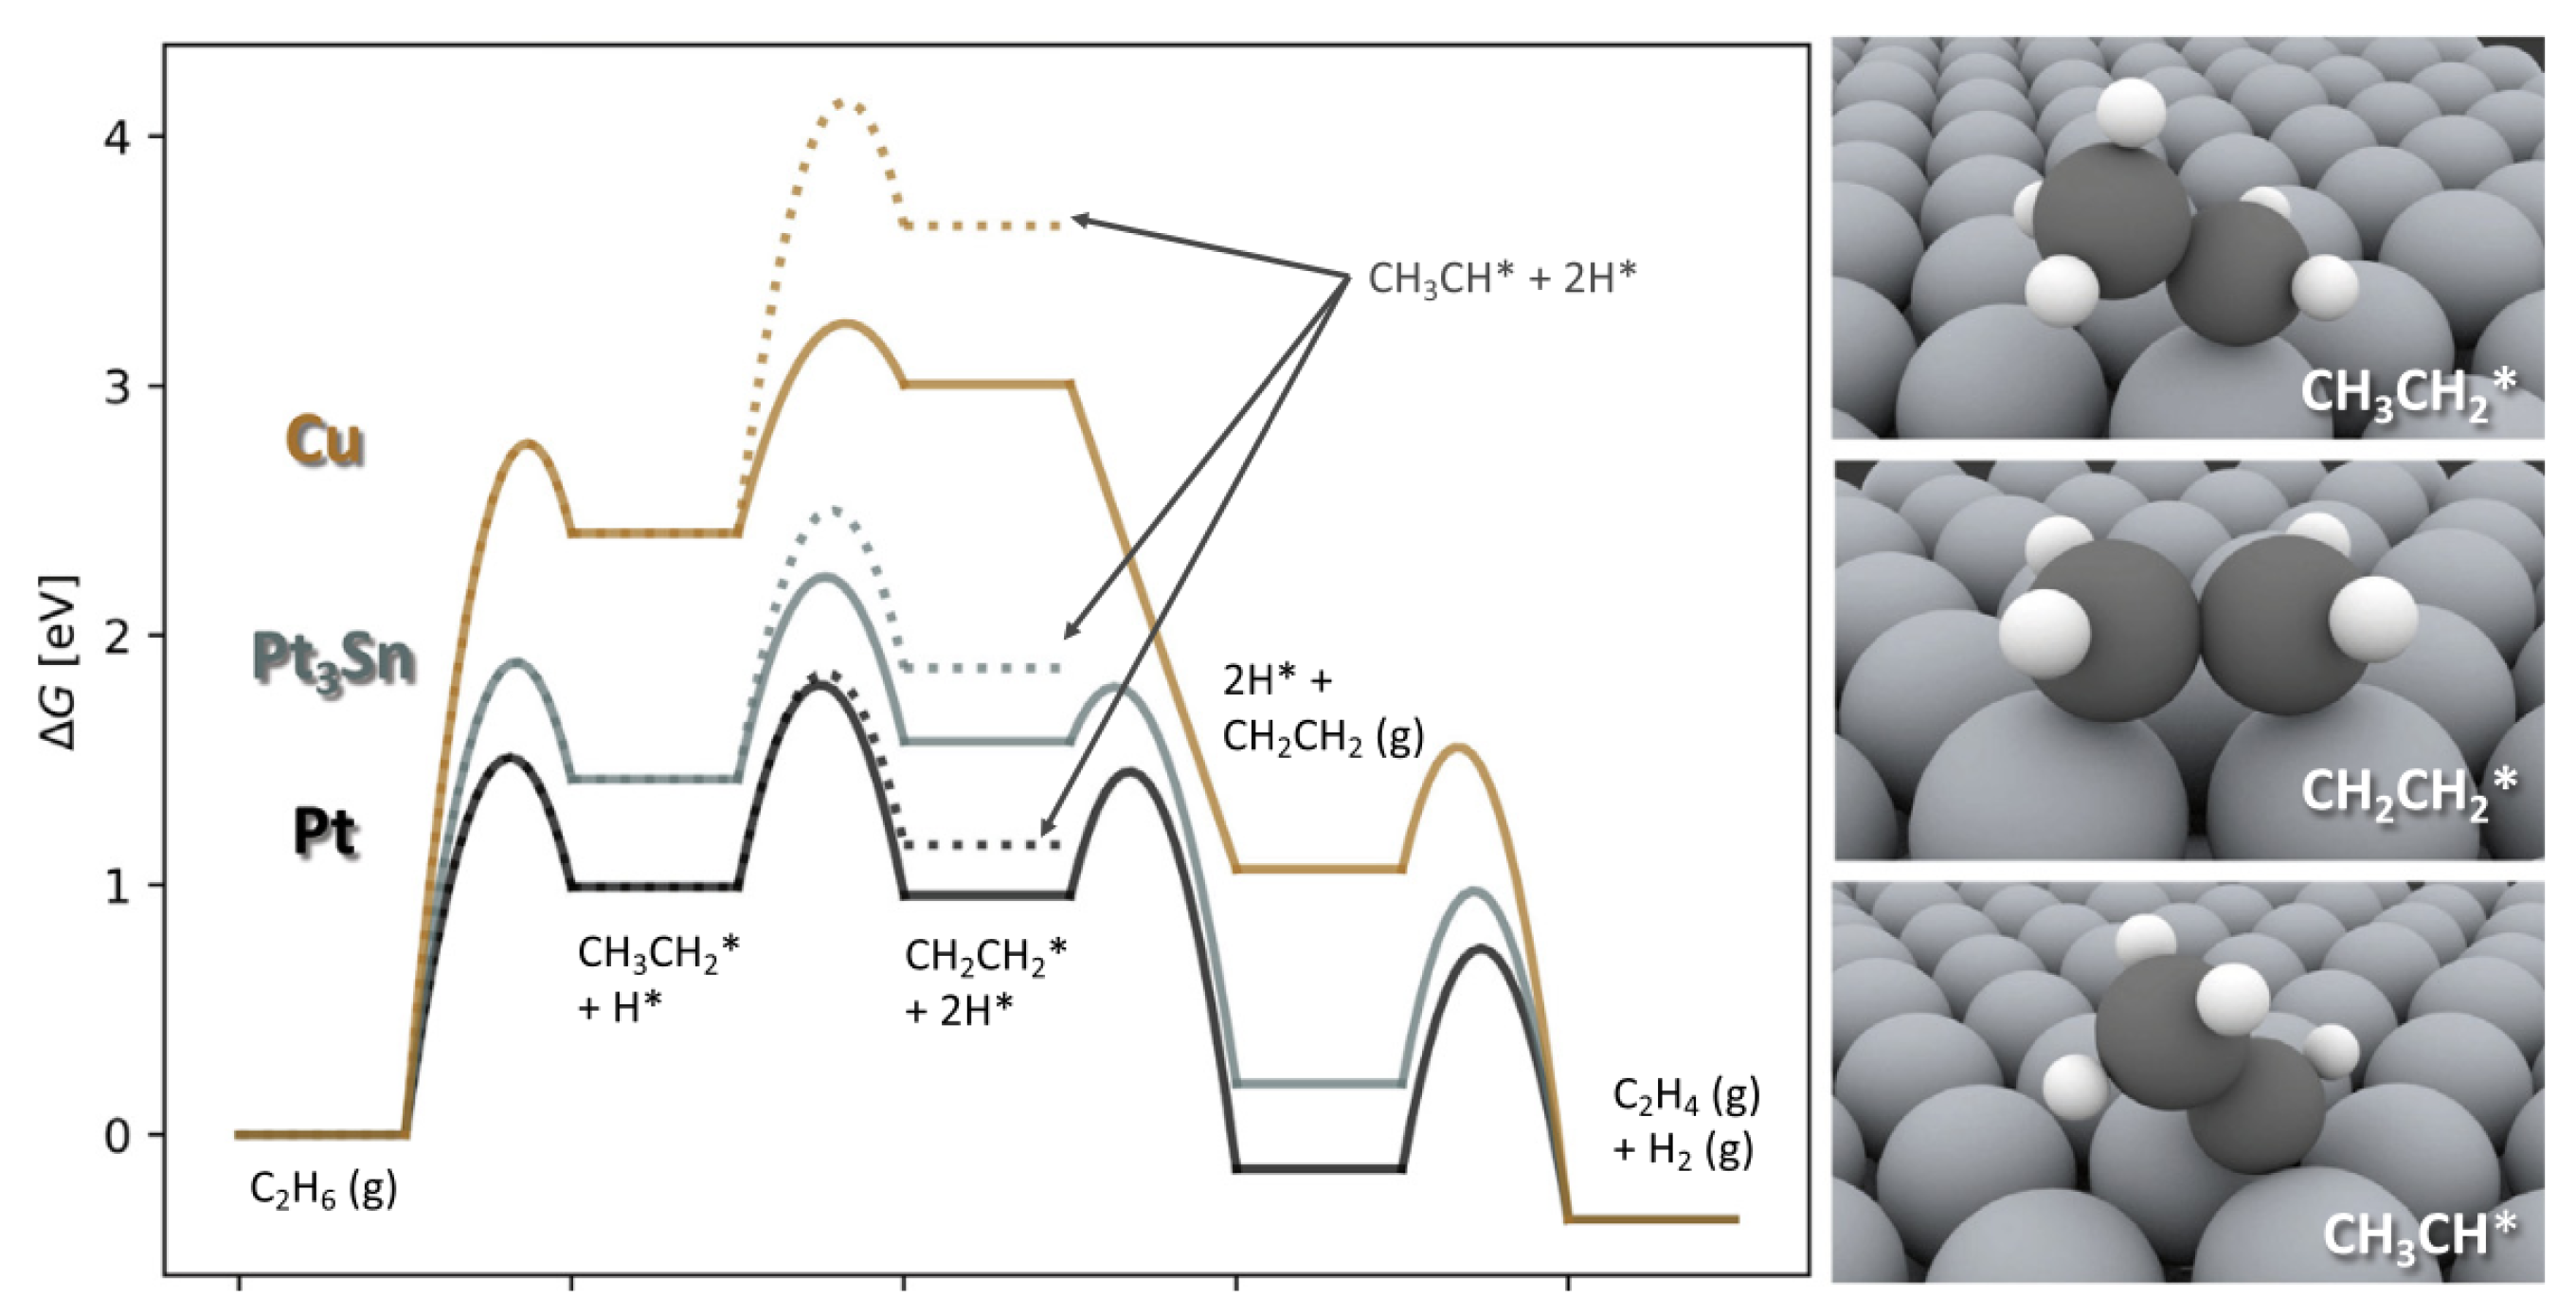
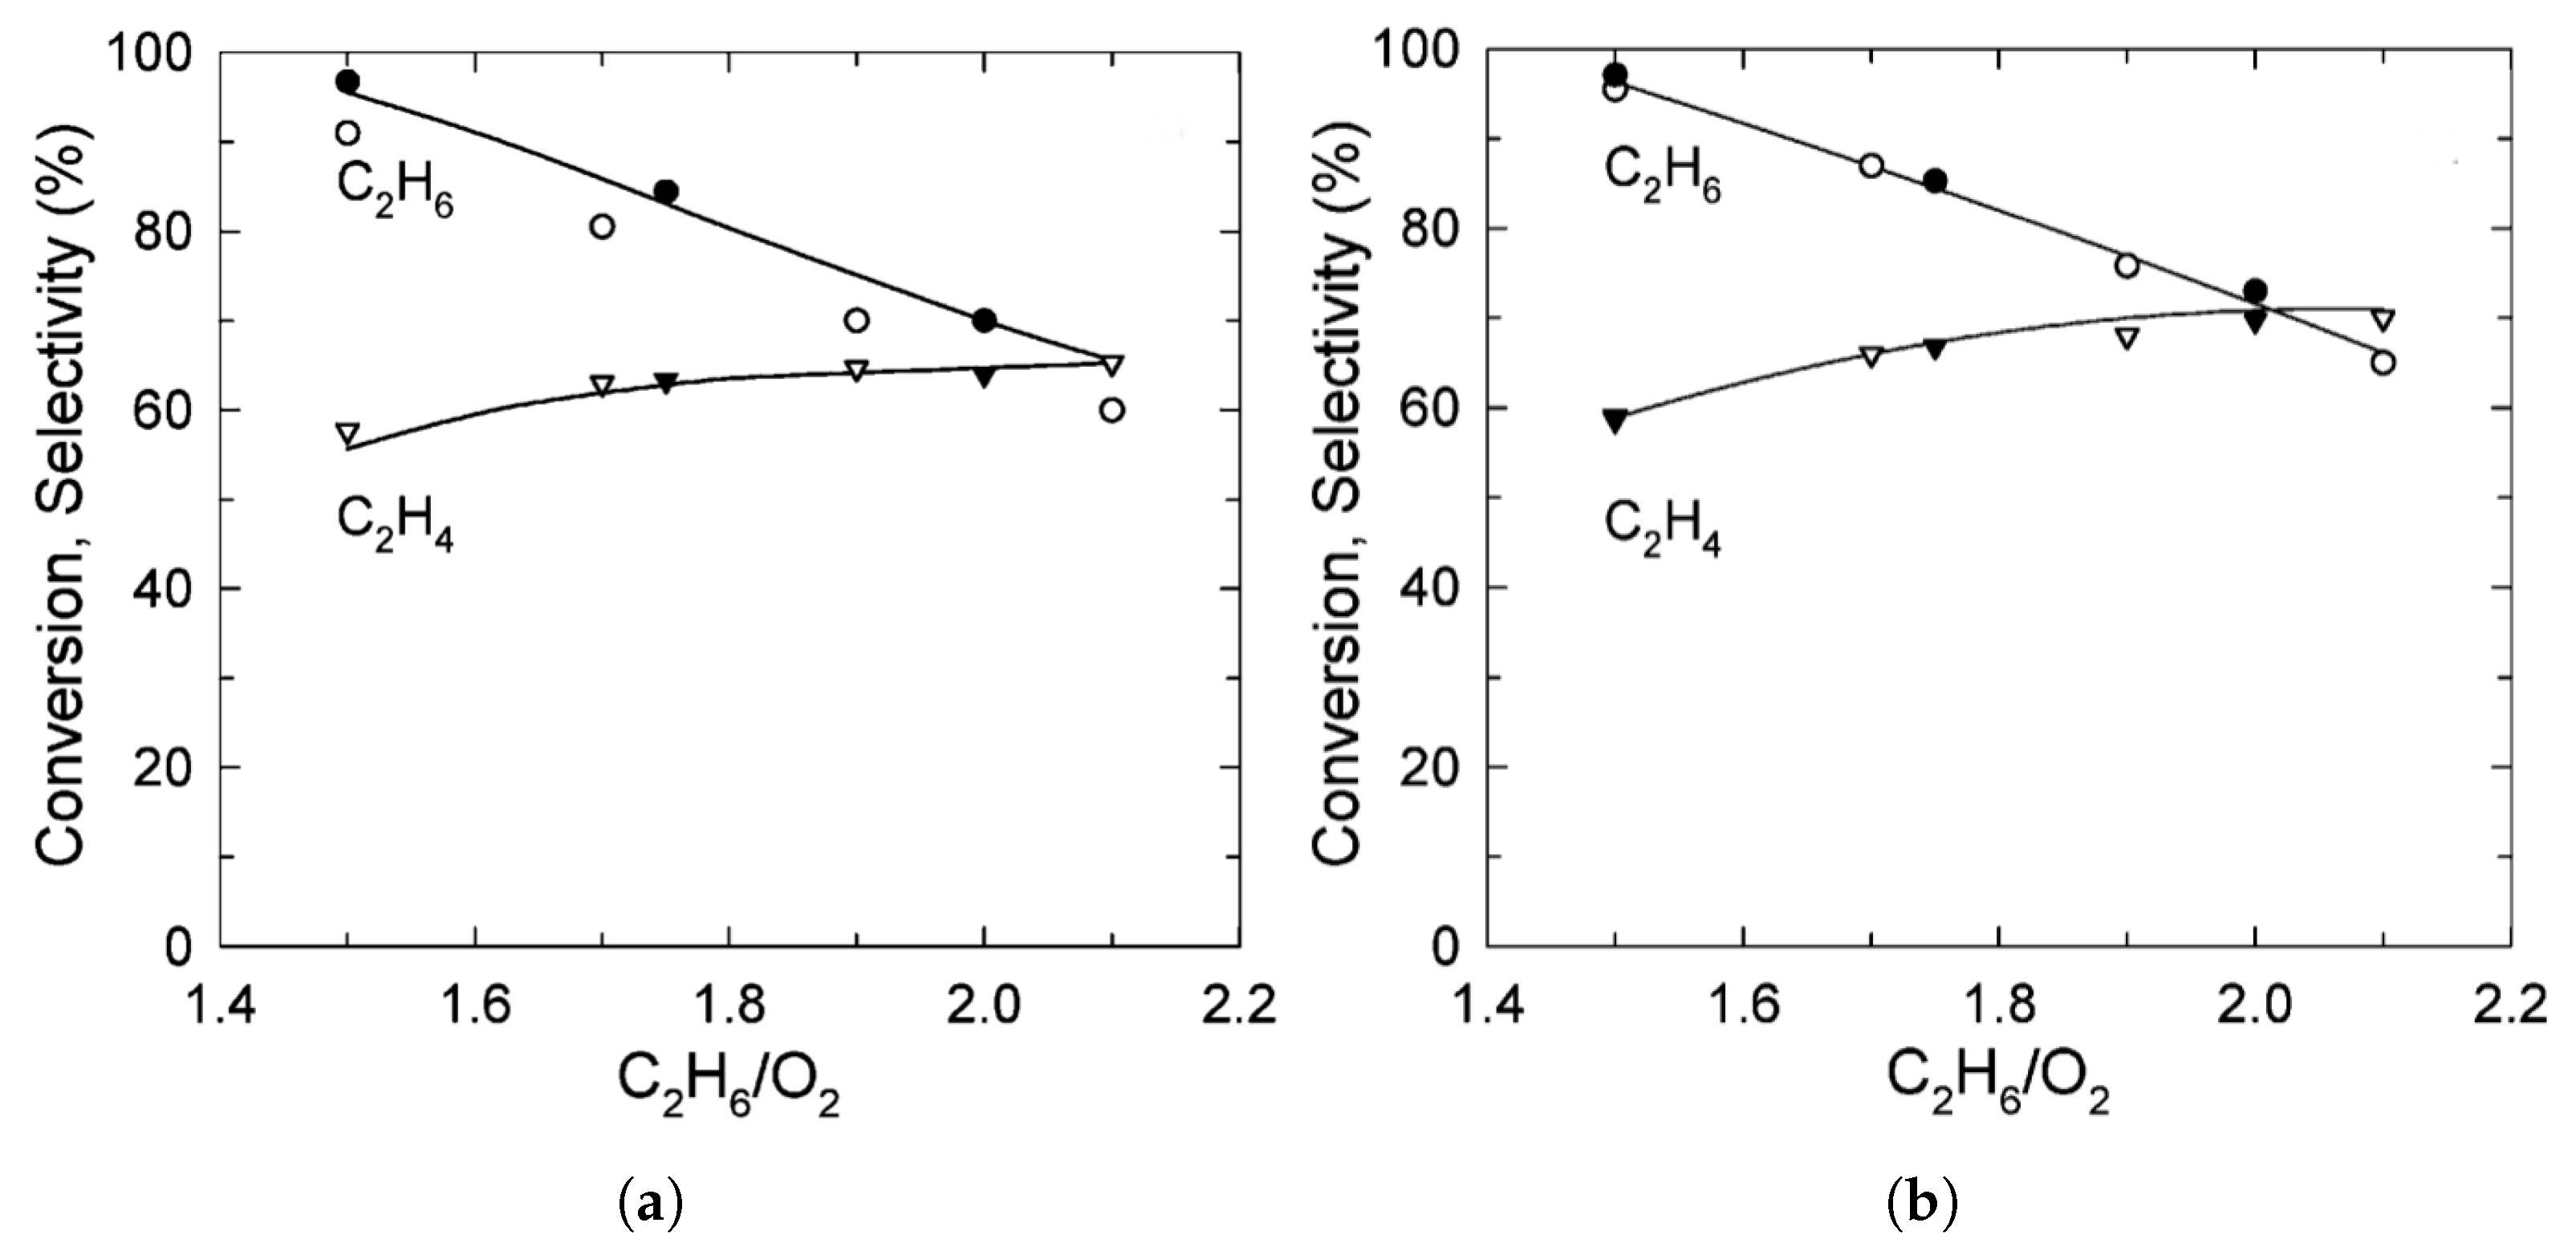
3.1. Ethane Dehydrogenation
3.2. Propane Dehydrogenation
3.2.1. Catalysts Used in Propane Dehydrogenation Process
3.2.2. Coke Formation and Catalyst Deactivation
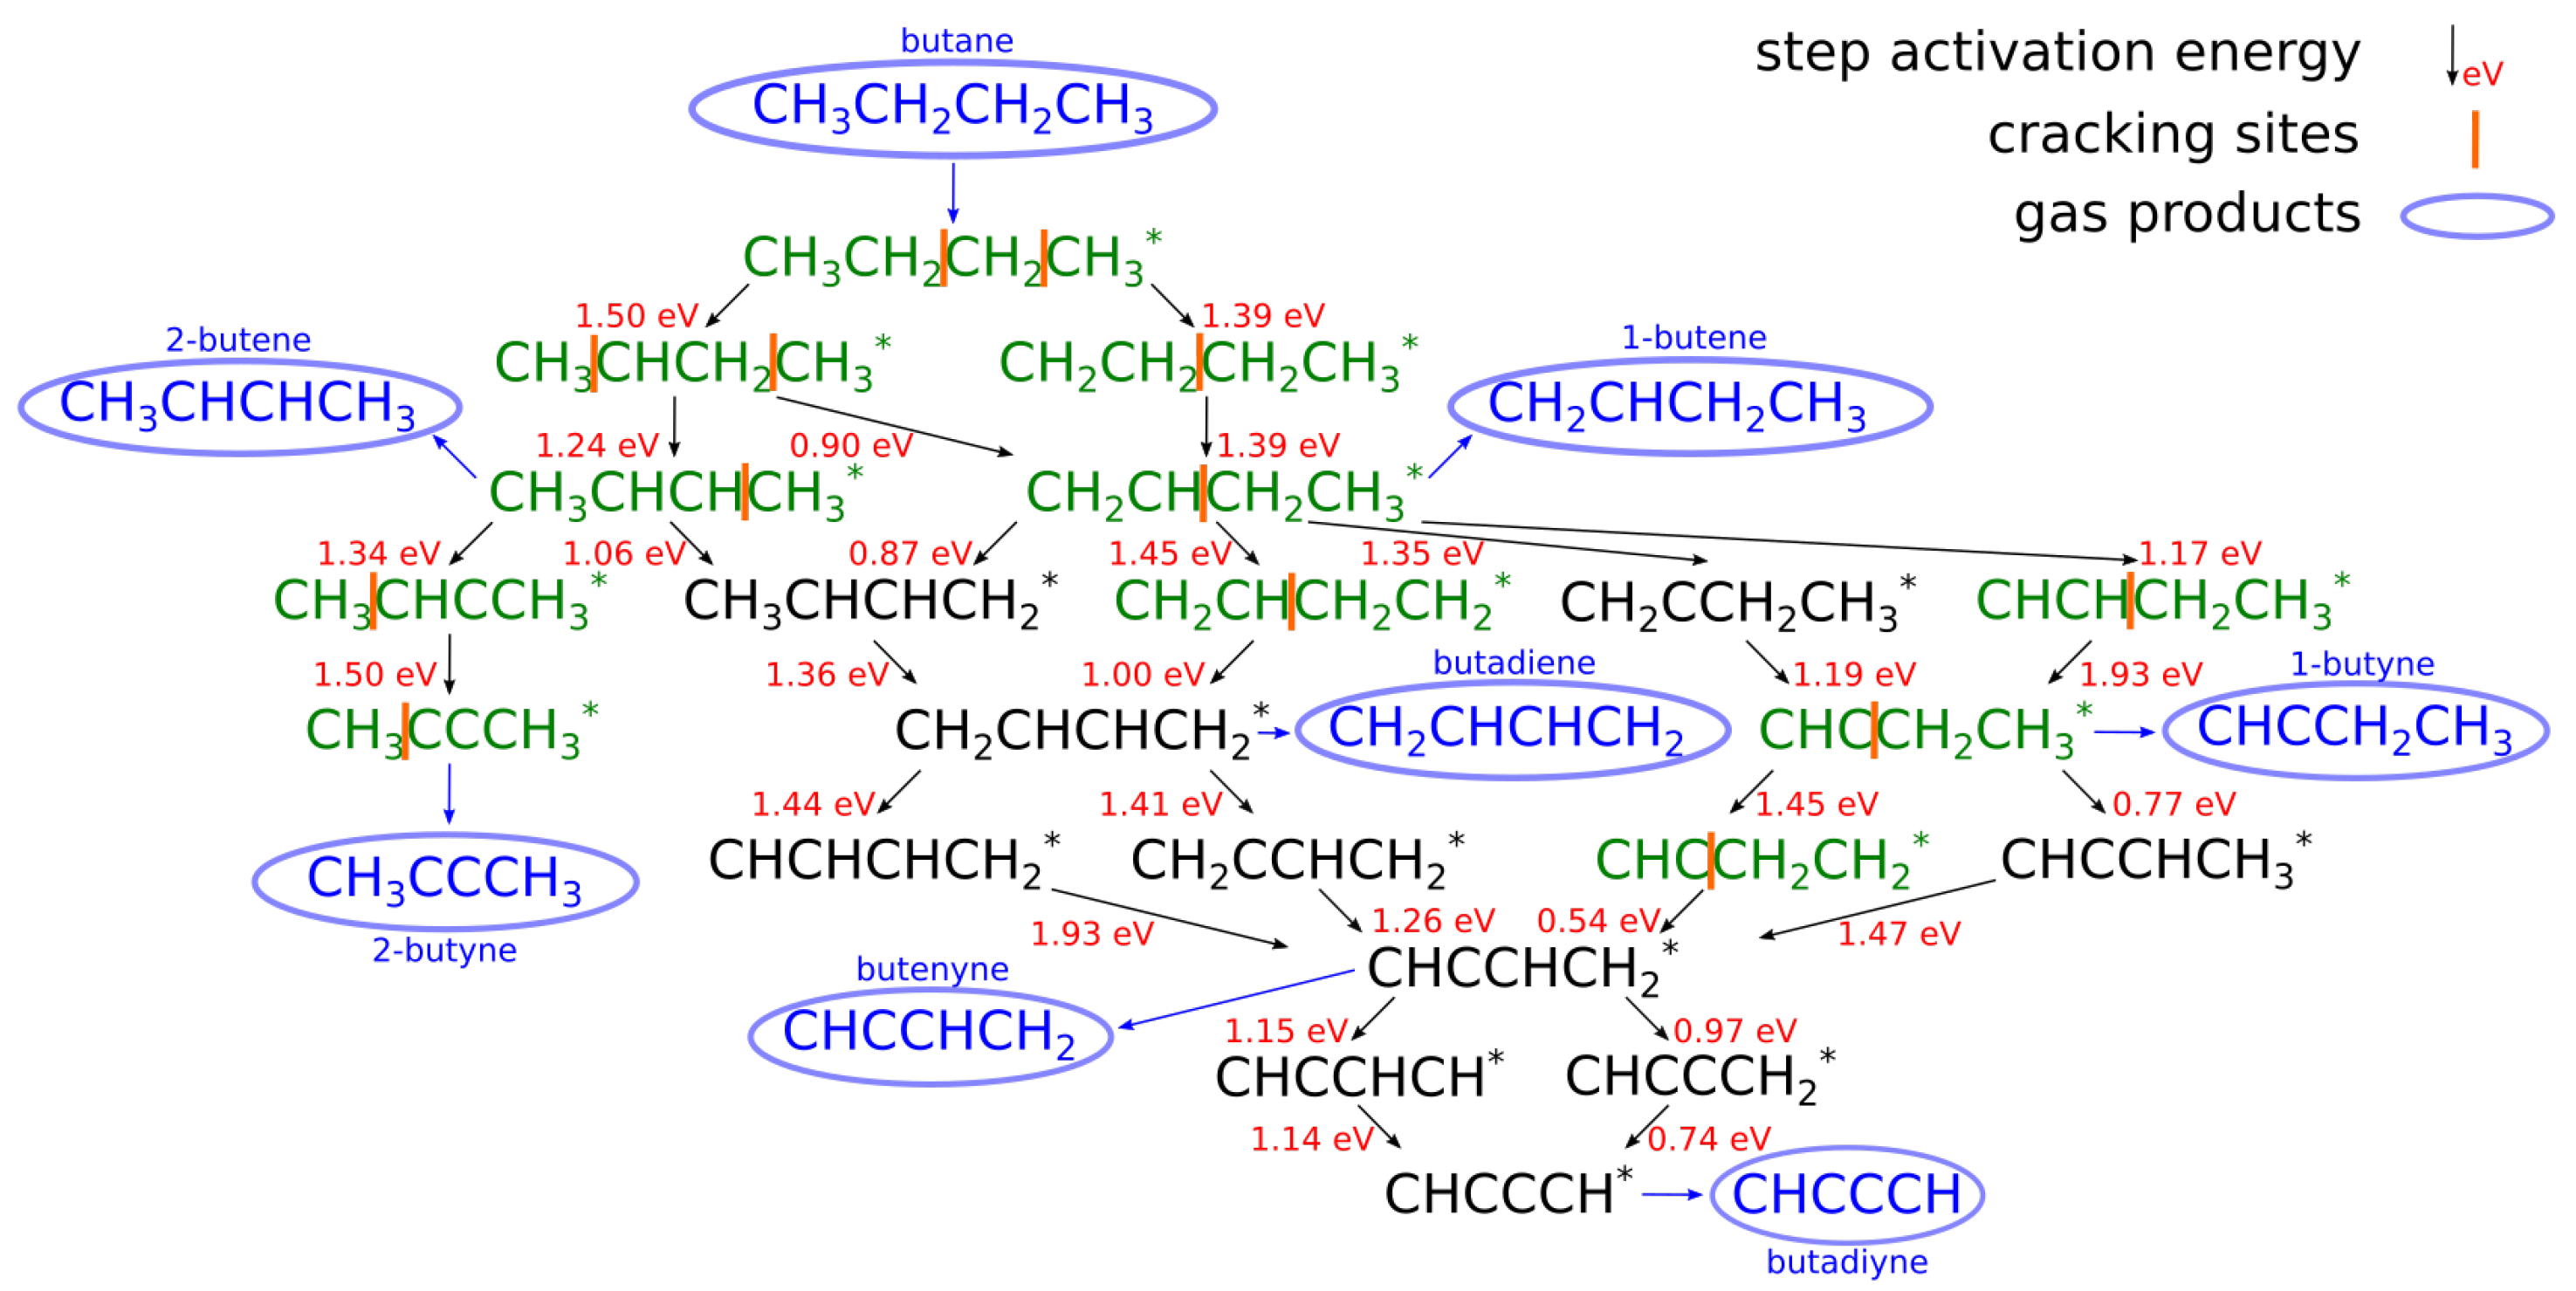
3.3. Butane Dehydrogenation
Catalysts Used in Butane Dehydrogenation Process
4. Discussion and Conclusions
Funding
Acknowledgments

Conflicts of Interest
References
- Stahl, S. Homogeneous Catalysis for C-H Activation and Other Approaches to Shale Gas Utilization. In The Changing Landscape of Hydrocarbon Feedstocks for Chemical Production: Implications for Catalysis: Proceedings of a Workshop; Alper, J., Ed.; The National Academies Press: Washington, DC, USA, 2016; pp. 1–136. [Google Scholar]
- Sattler, J.J.H.B.; Ruiz-Martinez, J.; Santillan-Jimenez, E.; Weckhuysen, B.M. Catalytic Dehydrogenation of Light Alkanes on Metals and Metal Oxides. Chem. Rev. 2014, 114, 10613–10653. [Google Scholar] [CrossRef]
- Matveyeva, A.N.; Wärnå, J.; Pakhomov, N.A.; Murzin, D.Y. Kinetic modeling of isobutane dehydrogenation over Ga2O3/Al2O3 catalyst. Chem. Eng. J. 2020, 381, 122741. [Google Scholar] [CrossRef]
- Geng, Z.; Deng, H.; Li, Y.; Zhang, M. Numerical investigation of complex chemistry performing in Pt-catalyzed oxidative dehydrogenation of ethane fixed-bed reactors. Chin. J. Chem. Eng. 2019, 28, 793–807. [Google Scholar] [CrossRef]
- Chen, Y.; Vlachos, D.D.G. Dehydrogenation, Hydrogenolysis and Oxidation of Ethane on Pt: Density Functional Theory Study and Microkinetic Analysis. In Proceedings of the 2009 AIChE Annual Meeting, Nashville, TN, USA, 8–13 November 2009; Volume 2745, p. 3865. [Google Scholar]
- Hansen, M.H.; Nørskov, J.K.; Bligaard, T. First principles micro-kinetic model of catalytic non-oxidative dehydrogenation of ethane over close-packed metallic facets. J. Catal. 2019, 374, 161–170. [Google Scholar] [CrossRef]
- Donsì, F.; Williams, K.A.; Schmidt, L.D. A multistep surface mechanism for ethane oxidative dehydrogenation on Pt- And Pt/Sn-coated monoliths. Ind. Eng. Chem. Res. 2005, 44, 3453–3470. [Google Scholar] [CrossRef]
- Kattel, S.; Chen, J.G.; Liu, P. Mechanistic study of dry reforming of ethane by CO2 on a bimetallic PtNi(111) model surface. Catal. Sci. Technol. 2018, 8, 3748–3758. [Google Scholar] [CrossRef]
- Yang, B.; Yuschak, T.; Mazanec, T.; Tonkovich, A.L.; Perry, S. Multi-scale modeling of microstructured reactors for the oxidative dehydrogenation of ethane to ethylene. Chem. Eng. J. 2008, 135, S147–S152. [Google Scholar] [CrossRef]
- Stefanidis, G.D.; Vlachos, D.G. Oxidative dehydrogenation of ethane to ethylene using microtechnology. In Proceedings of the 21th International Symposium on Chemical Reaction Engineering (ISCRE-21), Philadelphia, PA, USA, 13 June 2010. [Google Scholar]
- Du, Y.; Berrouk, A.S.; Sun, L.; Sun, W.; Fang, D.; Ren, W. Experimental and Computational Fluid Dynamics Investigations of Light Alkane Dehydrogenation in a Fluidized Bed Reactor. Energy Fuels 2019, 33, 4177–4189. [Google Scholar] [CrossRef]
- Chang, Q.Y.; Wang, K.Q.; Hu, P.; Sui, Z.J.; Zhou, X.G.; Chen, D.; Yuan, W.K.; Zhu, Y.A. Dual-function catalysis in propane dehydrogenation over Pt1–Ga2O3 catalyst: Insights from a microkinetic analysis. AIChE J. 2020, 66, e16232. [Google Scholar] [CrossRef]
- Huš, M.; Kopač, D.; Likozar, B. Kinetics of non-oxidative propane dehydrogenation on Cr2O3 and the nature of catalyst deactivation from first-principles simulations. J. Catal. 2020, 386, 126–138. [Google Scholar] [CrossRef]
- Madeira, L.M.; Portela, M.F. Catalytic oxidative dehydrogenation of n-butane. Catal. Rev. 2002, 44, 247–286. [Google Scholar] [CrossRef]
- Nawaz, Z. Light alkane dehydrogenation to light olefin technologies: A comprehensive review. Rev. Chem. Eng. 2015, 31, 413–436. [Google Scholar] [CrossRef]
- Wang, S.; Zhu, Z. Catalytic Conversion of Alkanes to Olefins by Carbon Dioxide Oxidative Dehydrogenation—A Review. Energy Fuels 2004, 18, 1126–1139. [Google Scholar] [CrossRef]
- Carrero, C.A.; Schloegl, R.; Wachs, I.E.; Schomaecker, R. Critical Literature Review of the Kinetics for the Oxidative Dehydrogenation of Propane over Well-Defined Supported Vanadium Oxide Catalysts. ACS Catal. 2014, 4, 3357–3380. [Google Scholar] [CrossRef]
- Gärtner, C.A.; van Veen, A.C.; Lercher, J.A. Oxidative Dehydrogenation of Ethane: Common Principles and Mechanistic Aspects. ChemCatChem 2013, 5, 3196–3217. [Google Scholar] [CrossRef]
- Vlachos, D.; Mhadeshwar, A.; Kaisare, N.S. Hierarchical multiscale model-based design of experiments, catalysts, and reactors for fuel processing. Comput. Chem. Eng. 2006, 30, 1712–1724. [Google Scholar] [CrossRef]
- Kopač, D.; Jurković, D.; Huš, M.; Likozar, B. First-principles-based multiscale modelling of non-oxidative butane dehydrogenation on Cr2O3(0001). ACS Catal. 2021. accepted. [Google Scholar]
- Huš, M.; Grilc, M.; Pavlišič, A.; Likozar, B.; Hellman, A. Multiscale modelling from quantum level to reactor scale: An example of ethylene epoxidation on silver catalysts. Catal. Today 2019, 338, 128–140. [Google Scholar] [CrossRef]
- Pavlišič, A.; Huš, M.; Prašnikar, A.; Likozar, B. Multiscale modelling of CO2 reduction to methanol over industrial Cu/ZnO/Al2O3 heterogeneous catalyst: Linking ab initio surface reaction kinetics with reactor fluid dynamics. J. Clean. Prod. 2020, 275, 122958. [Google Scholar] [CrossRef]
- Andersin, J.; Honkala, K. DFT study on complete ethylene decomposition on flat and stepped Pd. Surf. Sci. 2010, 604, 762–769. [Google Scholar] [CrossRef]
- Chen, Y.; Vlachos, D.G. Hydrogenation of Ethylene and Dehydrogenation and Hydrogenolysis of Ethane on Pt(111) and Pt(211): A Density Functional Theory Study. J. Phys. Chem. C 2010, 114, 4973–4982. [Google Scholar] [CrossRef]
- Hook, A.; Celik, F.E. Predicting Selectivity for Ethane Dehydrogenation and Coke Formation Pathways over Model Pt–M Surface Alloys with ab Initio and Scaling Methods. J. Phys. Chem. C 2017, 121, 17882–17892. [Google Scholar] [CrossRef]
- Xu, L.; Stangland, E.E.; Mavrikakis, M. Ethylene versus ethane: A DFT-based selectivity descriptor for efficient catalyst screening. J. Catal. 2018, 362, 18–24. [Google Scholar] [CrossRef]
- Yang, M.L.; Zhu, Y.A.; Fan, C.; Sui, Z.J.; Chen, D.; Zhou, X.G. DFT study of propane dehydrogenation on Pt catalyst: Effects of step sites. Phys. Chem. Chem. Phys. 2011, 13, 3257–3267. [Google Scholar] [CrossRef]
- Salciccioli, M.; Chen, Y.; Vlachos, D.G. Microkinetic Modeling and Reduced Rate Expressions of Ethylene Hydrogenation and Ethane Hydrogenolysis on Platinum. Ind. Eng. Chem. Res. 2011, 50, 28–40. [Google Scholar] [CrossRef]
- Fattahi, M.; Kazemeini, M.; Khorasheh, F.; Darvishi, A.; Rashidi, A.M. Fixed-Bed Multi-Tubular Reactors for Oxidative Dehydrogenation in Ethylene Process. Chem. Eng. Technol. 2013, 36, 1691–1700. [Google Scholar] [CrossRef]
- Hook, A.; Massa, J.D.; Celik, F.E. Effect of tin coverage on selectivity for ethane dehydrogenation over platinum–tin alloys. J. Phys. Chem. C 2016, 120, 27307–27318. [Google Scholar] [CrossRef]
- Xiao, L.; Ma, F.; Zhu, Y.A.; Sui, Z.J.; Zhou, J.H.; Zhou, X.G.; Chen, D.; Yuan, W.K. Improved selectivity and coke resistance of core-shell alloy catalysts for propane dehydrogenation from first principles and microkinetic analysis. Chem. Eng. J. 2019, 377, 120049. [Google Scholar] [CrossRef]
- Sun, X.; Liu, M.; Huang, Y.; Li, B.; Zhao, Z. Electronic interaction between single Pt atom and vacancies on boron nitride nanosheets and its influence on the catalytic performance in the direct dehydrogenation of propane. Chin. J. Catal. 2019, 40, 819–825. [Google Scholar] [CrossRef]
- Zha, S.; Sun, G.; Wu, T.; Zhao, J.; Zhao, Z.J.; Gong, J. Identification of Pt-based catalysts for propane dehydrogenation via a probability analysis. Chem. Sci. 2018, 9, 3925–3931. [Google Scholar] [CrossRef]
- Zhu, J.; Yang, M.L.; Yu, Y.; Zhu, Y.A.; Sui, Z.J.; Zhou, X.G.; Holmen, A.; Chen, D. Size-dependent reaction mechanism and kinetics for propane dehydrogenation over Pt catalysts. ACS Catal. 2015, 5, 6310–6319. [Google Scholar] [CrossRef]
- Wang, J.C. Effects of surface step on molecular propane adsorption. Surf. Sci. 2003, 540, 326–336. [Google Scholar] [CrossRef]
- Saelee, T.; Namuangruk, S.; Kungwan, N.; Junkaew, A. Theoretical insight into catalytic propane dehydrogenation on Ni (111). J. Phys. Chem. C 2018, 122, 14678–14690. [Google Scholar] [CrossRef]
- Darvishi, A.; Davand, R.; Khorasheh, F.; Fattahi, M. Modeling-based optimization of a fixed-bed industrial reactor for oxidative dehydrogenation of propane. Chin. J. Chem. Eng. 2016, 24, 612–622. [Google Scholar] [CrossRef]
- Fattahi, M.; Khorasheh, F.; Sahebdelfar, S.; Zangeneh, F.T.; Ganji, K.; Saeedizad, M. The effect of oxygenate additives on the performance of Pt–Sn/γ-Al2O3 catalyst in the propane dehydrogenation process. Sci. Iran. 2011, 18, 1377–1383. [Google Scholar] [CrossRef]
- Barghi, B.; Fattahi, M.; Khorasheh, F. Kinetic modeling of propane dehydrogenation over an industrial catalyst in the presence of oxygenated compounds. React. Kinet. Mech. Catal. 2012, 107, 141–155. [Google Scholar] [CrossRef]
- Barghi, B.; Fattahi, M.; Khorasheh, F. The modeling of kinetics and catalyst deactivation in propane dehydrogenation over Pt-Sn/γ-Al2O3 in presence of water as an oxygenated additive. Pet. Sci. Technol. 2014, 32, 1139–1149. [Google Scholar] [CrossRef]
- Rostom, S.; de Lasa, H. Downer fluidized bed reactor modeling for catalytic propane oxidative dehydrogenation with high propylene selectivity. Chem. Eng. Process.-Process Intensif. 2019, 137, 87–99. [Google Scholar] [CrossRef]
- Choi, S.W.; Sholl, D.S.; Nair, S.; Moore, J.S.; Liu, Y.; Dixit, R.S.; Pendergast, J.G. Modeling and process simulation of hollow fiber membrane reactor systems for propane dehydrogenation. AIChE J. 2017, 63, 4519–4531. [Google Scholar] [CrossRef]
- Zhang, X.; You, R.; Wei, Z.; Jiang, X.; Yang, J.; Pan, Y.; Wu, P.; Jia, Q.; Bao, Z.; Bai, L.; et al. Radical Chemistry and Reaction Mechanisms of Propane Oxidative Dehydrogenation over Hexagonal Boron Nitride Catalysts. Angew. Chem. Int. Ed. 2020, 59, 8042–8046. [Google Scholar] [CrossRef]
- Cao, L.; Dai, P.; Zhu, L.; Yan, L.; Chen, R.; Liu, D.; Gu, X.; Li, L.; Xue, Q.; Zhao, X. Graphitic carbon nitride catalyzes selective oxidative dehydrogenation of propane. Appl. Catal. B Environ. 2020, 262, 118277. [Google Scholar] [CrossRef]
- Raman, N.; Maisel, S.; Grabau, M.; Taccardi, N.; Debuschewitz, J.; Wolf, M.; Wittkämper, H.; Bauer, T.; Wu, M.; Haumann, M.; et al. Highly effective propane dehydrogenation using Ga–Rh supported catalytically active liquid metal solutions. ACS Catal. 2019, 9, 9499–9507. [Google Scholar] [CrossRef]
- Boudeville, Y.; Kolb, M.; Pantazidis, A.; Marquez-Alvarez, C.; Mirodatos, C.; Elokhin, V. Monte-Carlo methods for simulating the catalytic oxidative dehydrogenation of propane over VMgO catalyst. Chem. Eng. Sci. 1999, 54, 4295–4304. [Google Scholar] [CrossRef]
- Shelepova, E.; Vedyagin, A.; Mishakov, I.; Noskov, A. Mathematical modeling of the propane dehydrogenation process in the catalytic membrane reactor. Chem. Eng. J. 2011, 176, 151–157. [Google Scholar] [CrossRef]
- Ghasemzadeh, K.; Alinejad, M.M.; Ghahremani, M.; Zeynali, R.; Pourgholi, A. Theoretical Study of Palladium Membrane Reactor Performance During Propane Dehydrogenation Using CFD Method. Indones. J. Chem. 2017, 17, 113–118. [Google Scholar] [CrossRef]
- Lian, Z.; Ali, S.; Liu, T.; Si, C.; Li, B.; Su, D.S. Revealing the Janus character of the coke precursor in the propane direct dehydrogenation on Pt catalysts from a kMC simulation. ACS Catal. 2018, 8, 4694–4704. [Google Scholar] [CrossRef]
- Ha, N.N.; Huyen, N.D.; Cam, L.M. Study on the role of SBA-15 in the oxidative dehydrogenation of n-butane over vanadia catalyst using density functional theory. J. Mol. Model. 2013, 19, 3233–3243. [Google Scholar] [CrossRef] [PubMed]
- Hà, N.N.; Hue, T.T.; Tho, N.M. Periodic Density Functional Theory Study of the Oxidative Dehydrogenation of n-butane on the (001) Surface of V2O5. AIP Conf. Proc. 2009, 1102, 287–290. [Google Scholar]
- Ha, N.N.; Huyen, N.D.; Cam, L.M. Ab-initio study of effect of basic MgO to V2O5 catalyst on oxidative dehydrogenation of C3H8 and n-C4H10. Appl. Catal. A Gen. 2011, 407, 106–111. [Google Scholar] [CrossRef]
- Rubio, O.; Herguido, J.; Menendez, M.; Grasa, G.; Abanades, J. Oxidative dehydrogenation of butane in an interconnected fluidized-bed reactor. AIChE J. 2004, 50, 1510–1522. [Google Scholar] [CrossRef]
- Soler, J.; Téllez, C.; Herguido, J.; Menéndez, M.; Santamarıa, J. Modelling of a two-zone fluidised bed reactor for the oxidative dehydrogenation of n-butane. Powder Technol. 2001, 120, 88–96. [Google Scholar] [CrossRef]
- Téllez, C.; Menéndez, M.; Santamarıa, J. Simulation of an inert membrane reactor for the oxidative dehydrogenation of butane. Chem. Eng. Sci. 1999, 54, 2917–2925. [Google Scholar] [CrossRef]
- Assabumrungrat, S.; Rienchalanusarn, T.; Praserthdam, P.; Goto, S. Theoretical study of the application of porous membrane reactor to oxidative dehydrogenation of n-butane. Chem. Eng. J. 2002, 85, 69–79. [Google Scholar] [CrossRef]
- Jackson, S.D.; Rugmini, S.; Stair, P.C.; Wu, Z. A comparison of catalyst deactivation of vanadia catalysts used for alkane dehydrogenation. Chem. Eng. J. 2006, 120, 127–132. [Google Scholar] [CrossRef]
- Wu, C.; Wang, L.; Xiao, Z.; Li, G.; Wang, L. Understanding deep dehydrogenation and cracking of n-butane on Ni (111) by a DFT study. Phys. Chem. Chem. Phys. 2020, 22, 724–733. [Google Scholar] [CrossRef]
- Li, X.; Yan, B.; Yao, S.; Kattel, S.; Chen, J.G.; Wang, T. Oxidative dehydrogenation and dry reforming of n-butane with CO2 over NiFe bimetallic catalysts. Appl. Catal. B Environ. 2018, 231, 213–223. [Google Scholar] [CrossRef]
- Wu, C.; Wang, L.; Xiao, Z.; Li, G.; Wang, L. Effects of van der Waals interactions on the dehydrogenation of n-butane on a Ni (111) surface. Chem. Phys. Lett. 2020, 137299. [Google Scholar] [CrossRef]
- Kostetskyy, P.; Nolan, C.M.; Dixit, M.; Mpourmpakis, G. Understanding Alkane Dehydrogenation through Alcohol Dehydration on γ-Al2O3. Ind. Eng. Chem. Res. 2018, 57, 16657–16663. [Google Scholar] [CrossRef]
- Byron, C.; Bai, S.; Celik, G.; Ferrandon, M.S.; Liu, C.; Ni, C.; Mehdad, A.; Delferro, M.; Lobo, R.F.; Teplyakov, A.V. Role of Boron in Enhancing the Catalytic Performance of Supported Platinum Catalysts for the Nonoxidative Dehydrogenation of n-Butane. ACS Catal. 2019, 10, 1500–1510. [Google Scholar] [CrossRef]
- Silvestre-Albero, J.; Sanchez-Castillo, M.A.; He, R.; Sepúlveda-Escribano, A.; Rodríguez-Reinoso, F.; Dumesic, J. Microcalorimetric, reaction kinetics and DFT studies of Pt–Zn/X-zeolite for isobutane dehydrogenation. Catal. Lett. 2001, 74, 17–25. [Google Scholar] [CrossRef]
- Casanave, D.; Ciavarella, P.; Fiaty, K.; Dalmon, J.A. Zeolite membrane reactor for isobutane dehydrogenation: Experimental results and theoretical modelling. Chem. Eng. Sci. 1999, 54, 2807–2815. [Google Scholar] [CrossRef]
- Van der Mynsbrugge, J.; Janda, A.; Mallikarjun Sharada, S.; Lin, L.C.; Van Speybroeck, V.; Head-Gordon, M.; Bell, A.T. Theoretical analysis of the influence of pore geometry on monomolecular cracking and dehydrogenation of n-butane in Brønsted acidic zeolites. ACS Catal. 2017, 7, 2685–2697. [Google Scholar] [CrossRef]
- Janda, A.; Vlaisavljevich, B.; Lin, L.C.; Smit, B.; Bell, A.T. Effects of zeolite structural confinement on adsorption thermodynamics and reaction kinetics for monomolecular cracking and dehydrogenation of n-butane. J. Am. Chem. Soc. 2016, 138, 4739–4756. [Google Scholar] [CrossRef]
- Wang, G.; Zhang, S.; Zhu, X.; Li, C.; Shan, H. Dehydrogenation versus hydrogenolysis in the reaction of light alkanes over Ni-based catalysts. J. Ind. Eng. Chem. 2020, 86, 1–12. [Google Scholar] [CrossRef]


| Source | Reaction Type | Scale, Methods | Catalyst | Reactor | Conditions | Conversion | Selectivity | Coke Deposition |
|---|---|---|---|---|---|---|---|---|
| [4] | O | micro-kinetics, CFD | eggshell | adiabatic fixed bed (2D-DEM CFD), SCTR | varied | 92% (SCTR) | 67% (SCTR) | oxidative dehydrogenation reduces coke formation and number of side reactions |
| [5] | O, NO | DFT, micro-kinetics | Pt | N/A | N/A | N/A | N/A | N/A |
| [8] | O, dry reforming | DFT, kMC | N/A | N/A | N/A | N/A | N/A | |
| [9] | O | micro-kinetics, CFD | microstructured (quartz) | N/A | 82.5% | 90% | N/A | |
| [6] | NO | DFT, micro-kinetics | metallic | N/A | 873 K, 0.2 bar ethane | N/A | N/A | N/A |
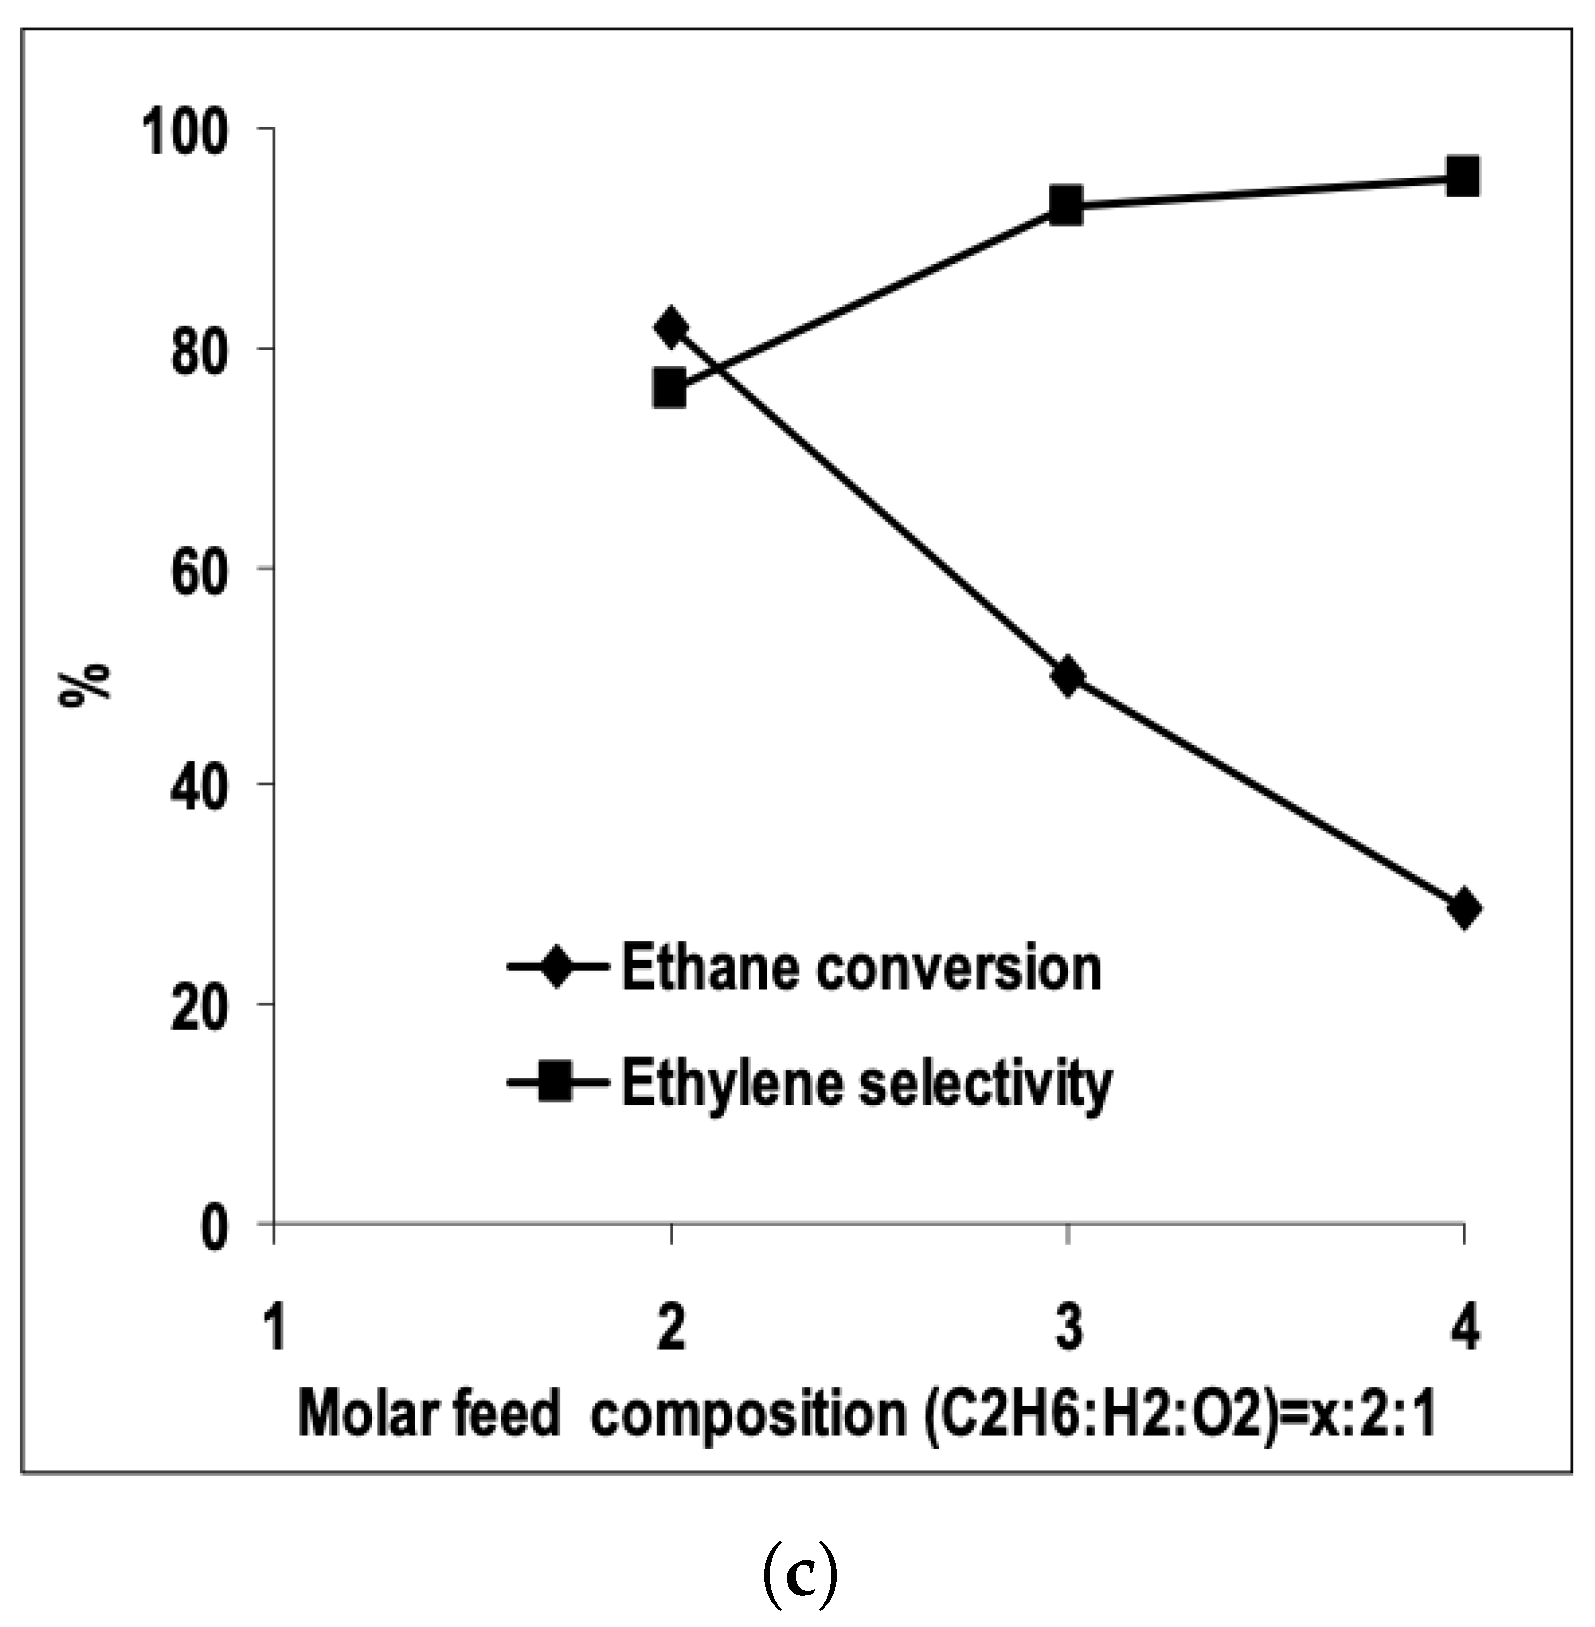
| [7] | O | micro-kinetics, CFD | and | plug-flow | 30 vol% ; ratio varied from 1.5–2; pressure 1.2 atm and varied | 95% | up to 80% | N/A |
| [30] | endothermic, NO | DFT | Pt-Sn alloy | N/A | N/A | N/A | higher Sn loading increases selectivity | Sn addition lowers coke deposition |
| Source | Reaction Type | Scale, Methods | Catalyst | Reactor | Conditions | Conversion | Selectivity | Coke Deposition |
|---|---|---|---|---|---|---|---|---|
| [11] | endothermic, NO | reaction kinetics, CFD | circulating fluidized bed | GHSV = 2350 h; propane flow 12.5 L/min; catalyst load 0.8 kg; 600 C, 0.1 Mpa | 42.4% (CFD) | 83.1% (CFD) | 0.001 g coke/g catalyst | |
| [13] | endothermic, NO | DFT, kMC | well-mixed CSTR | 850 K, 1 bar | N/A | 100% (kMC) | coke formation rate: at 1000 K | |
| [41] | O | kinetic modeling, particle CFD | - | circulating fluidized bed | steam velocity: 3 m/s; time step: 0.01 s; end time: 40 s; 500, 525, 550 C, 1 atm | 28% (single particle flow); 20% (particle cluster flow) | 94% to propylene | low coke deposition |
| [49] | endothermic, NO | DFT, kMC | Pt | N/A | N/A | N/A | 55–85% (depending on kMC lattice) | reduces coke, regenerates active sites |
| [42] | endothermic, NO | kinetics, macroscopic scale (ASPEN) | Na-doped | packed bed membrane | propane flow: 4000 kmol/h; propylene yield: 550 kton/yr; reactor volume: 421 m; preheat T: 650 C | 45% | 90% to propylene | N/A |
| [48] | endothermic, NO | kinetics [47], CFD | Pd-Ag | conventional membrane | feed flow rate: 0.75 L/min; 773 K, 1 bar | 49% (Pd membrane); 91% (Pd-Ag MR) | N/A | N/A |
| [46] | exothermic, O | Monte Carlo | N/A | N/A | N/A | model: 95%; experiment: 75% | N/A | |
| [43] | exothermic, O | DFT, kinetic study | hexagonal-BN | N/A | flow rate: 30 mL/min; 2.5 vol% of propane; 500–600 C | 500 C: 0.3%; 600 C: 38.2%; 600 C at 24 h: 43% | 94% at 500 C (propylene); 36% at 600 C (propylene); 75% (+ alkenes) | N/A |
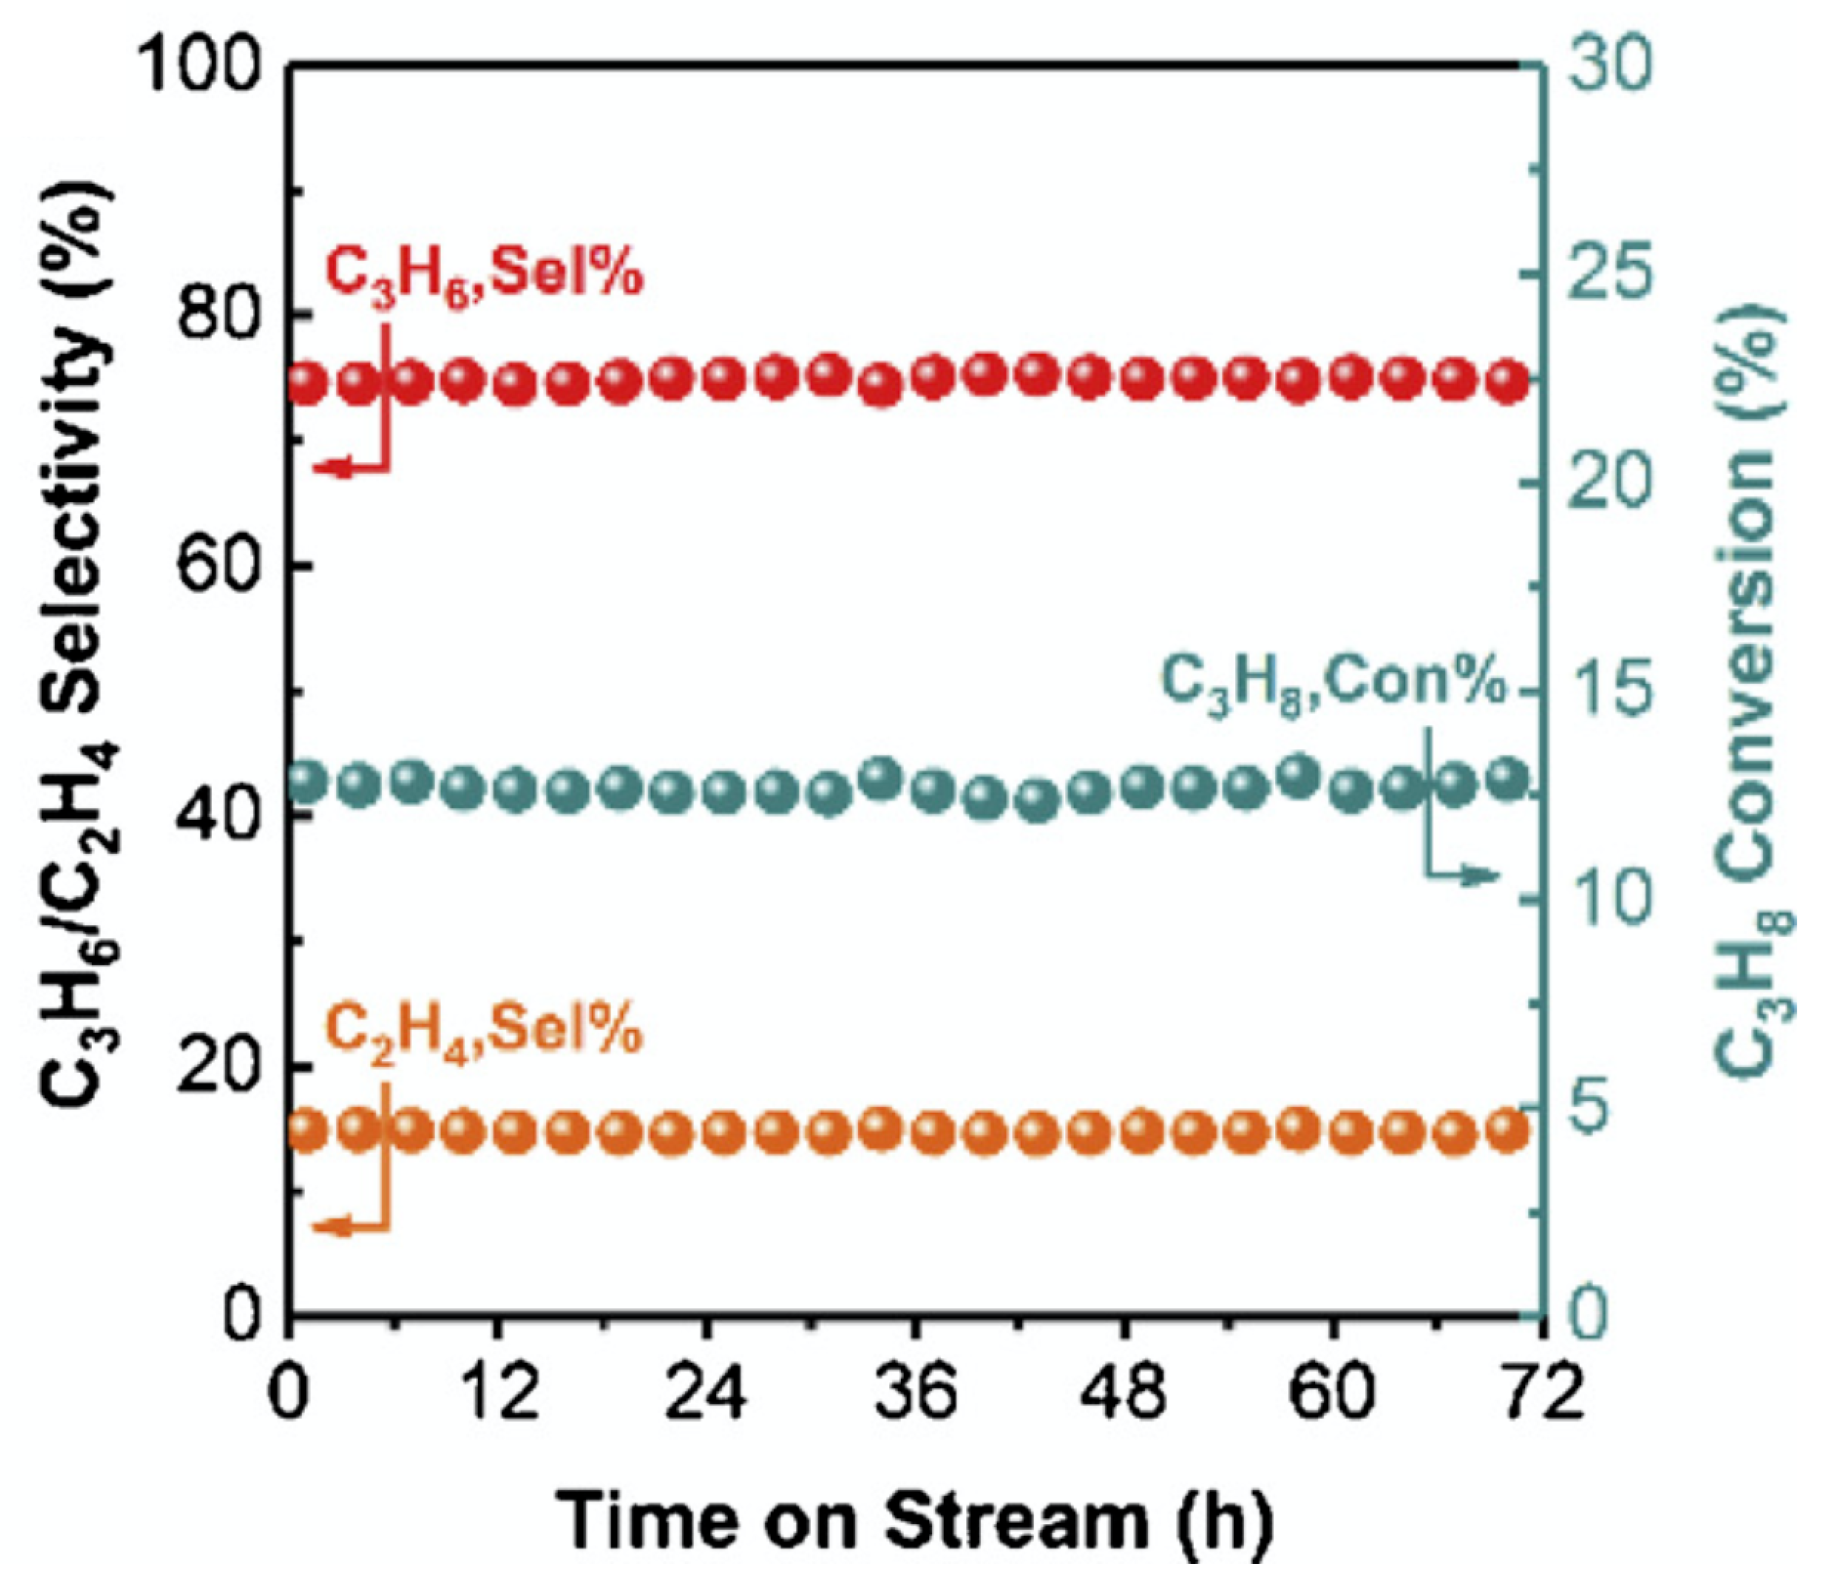
| [44] | exothermic, O | DFT, kinetic study | graphite- | N/A | flow rate: 18 mL/min; 500 C, 1 atm | 12.8% | 74.4% to propylene; 14.9% to ethylene | using oxidant (oxygen): coke deposition lower, lifetime increased |
| [32] | endothermic, NO | DFT | Pt on BN nanosheet | N/A | N/A | N/A | N/A | hydrogen added to reduce coke |
| [34] | endothernic, NO | DFT, kinetic study | Pt (various cluster size) | quartz | 0.05 g catalyst; 723–813 K, isothermal; 1–8 kPA , 1–10 kPa | larger Pt clusters lower conversion | ∼1 nm Pt cluster: 51.9%; ∼9 nm Pt cluster: 95.8% | larger Pt clusters lower coke formation |
| [45] | endothermic, NO | DFT, MD | Ga-Rh supported liquid metal solution | tubular quartz | propane flow: 8.9 mL/min; 550 C, 1.2 bar | 10–20% | ∼92% | N/A |
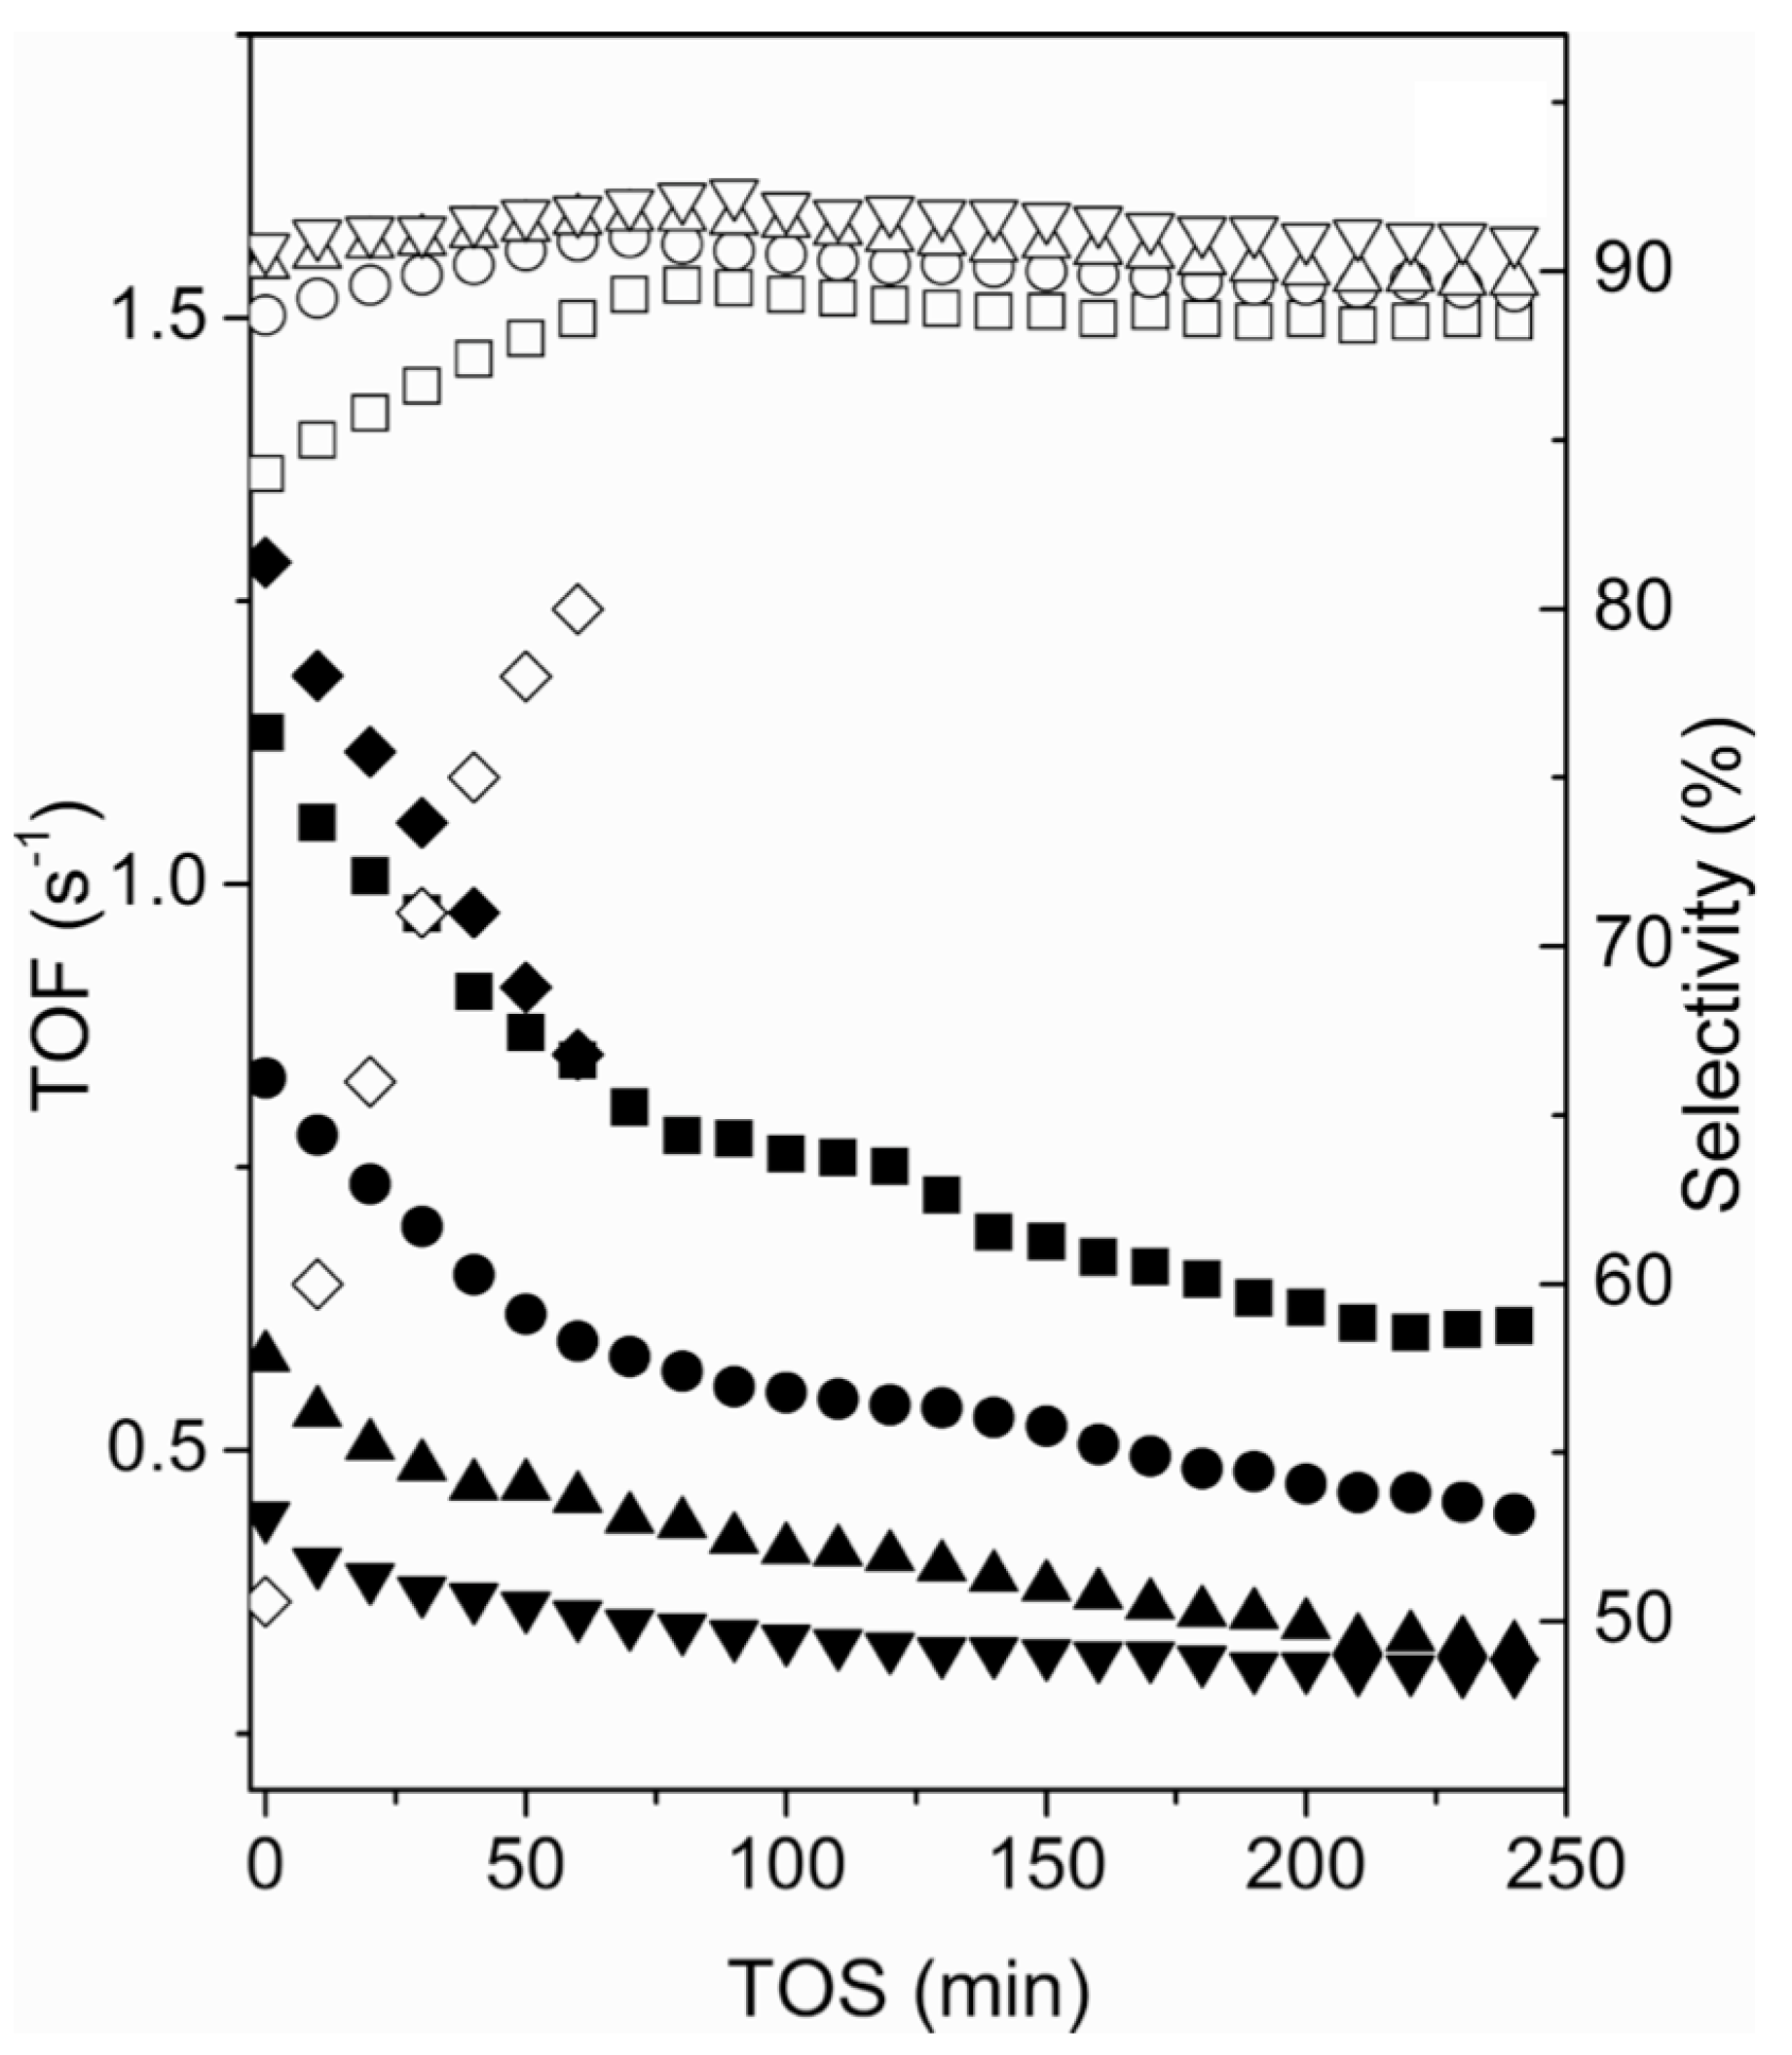
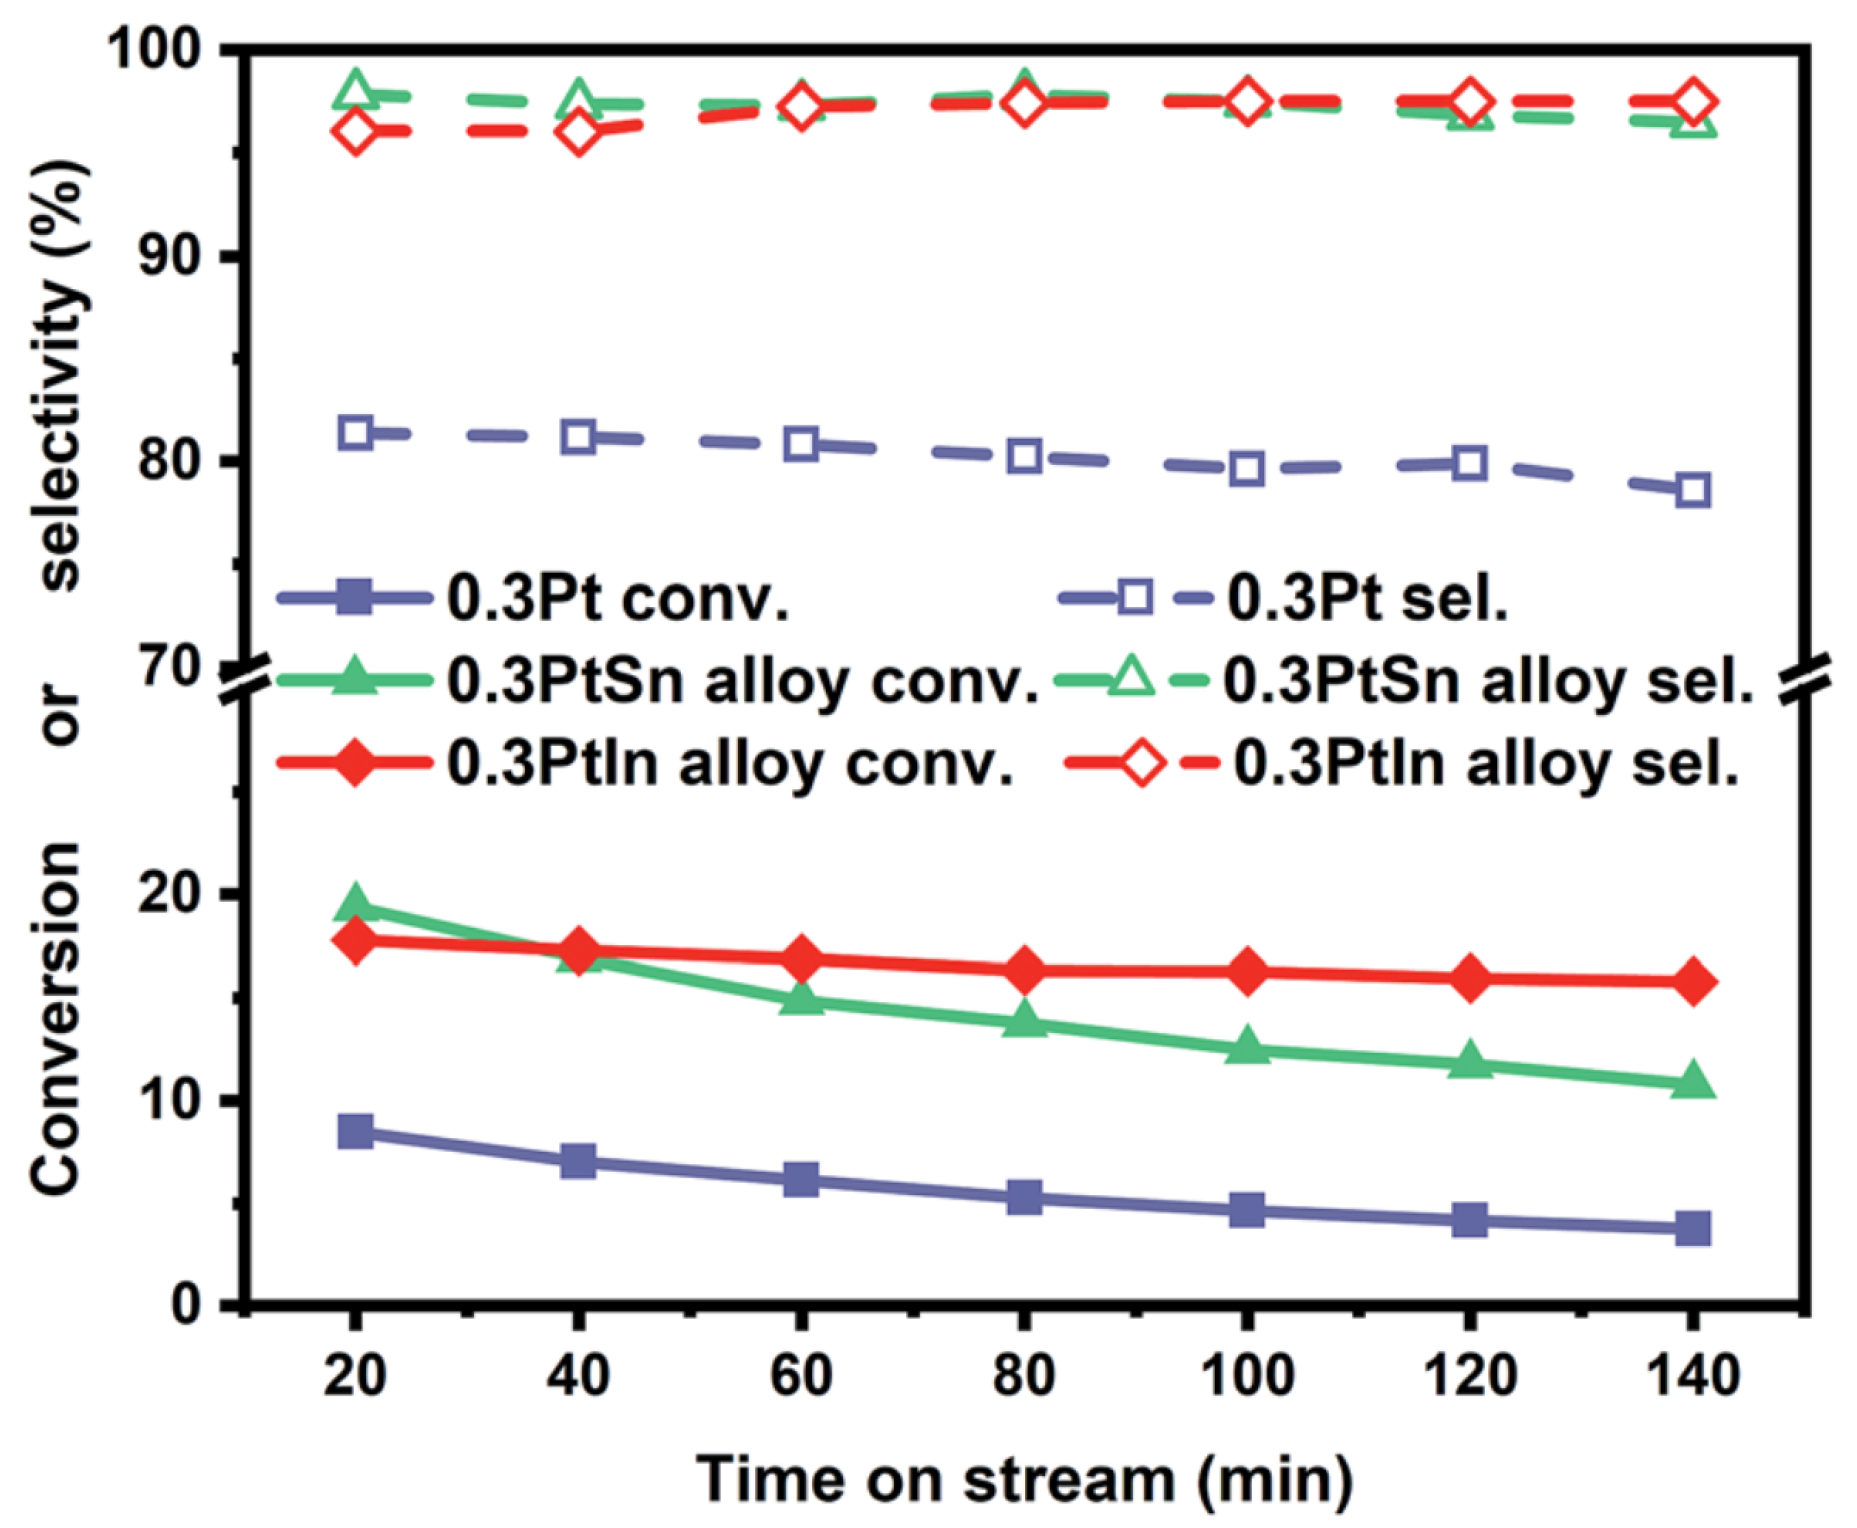
| [33] | endothermic, NO | DFT, microkinetics | Pt, , | N/A | total flow rate: 50 mL/min; 600 C, 1 atm | 5–20% (Figure 6) | 80–98% (Figure 6) | addition of In slows coke formation |
| Source | Reaction Type | Scale, Methods | Catalyst | Reactor | Conditions | Conversion | Selectivity | Coke Deposition |
|---|---|---|---|---|---|---|---|---|
| [51] | endothermic, O | DFT-PBE, MD | (001) | N/A | low temperature | N/A | N/A | N/A |
| [52] | endothermic, O | DFT | N/A | N/A | N/A | N/A | N/A | |
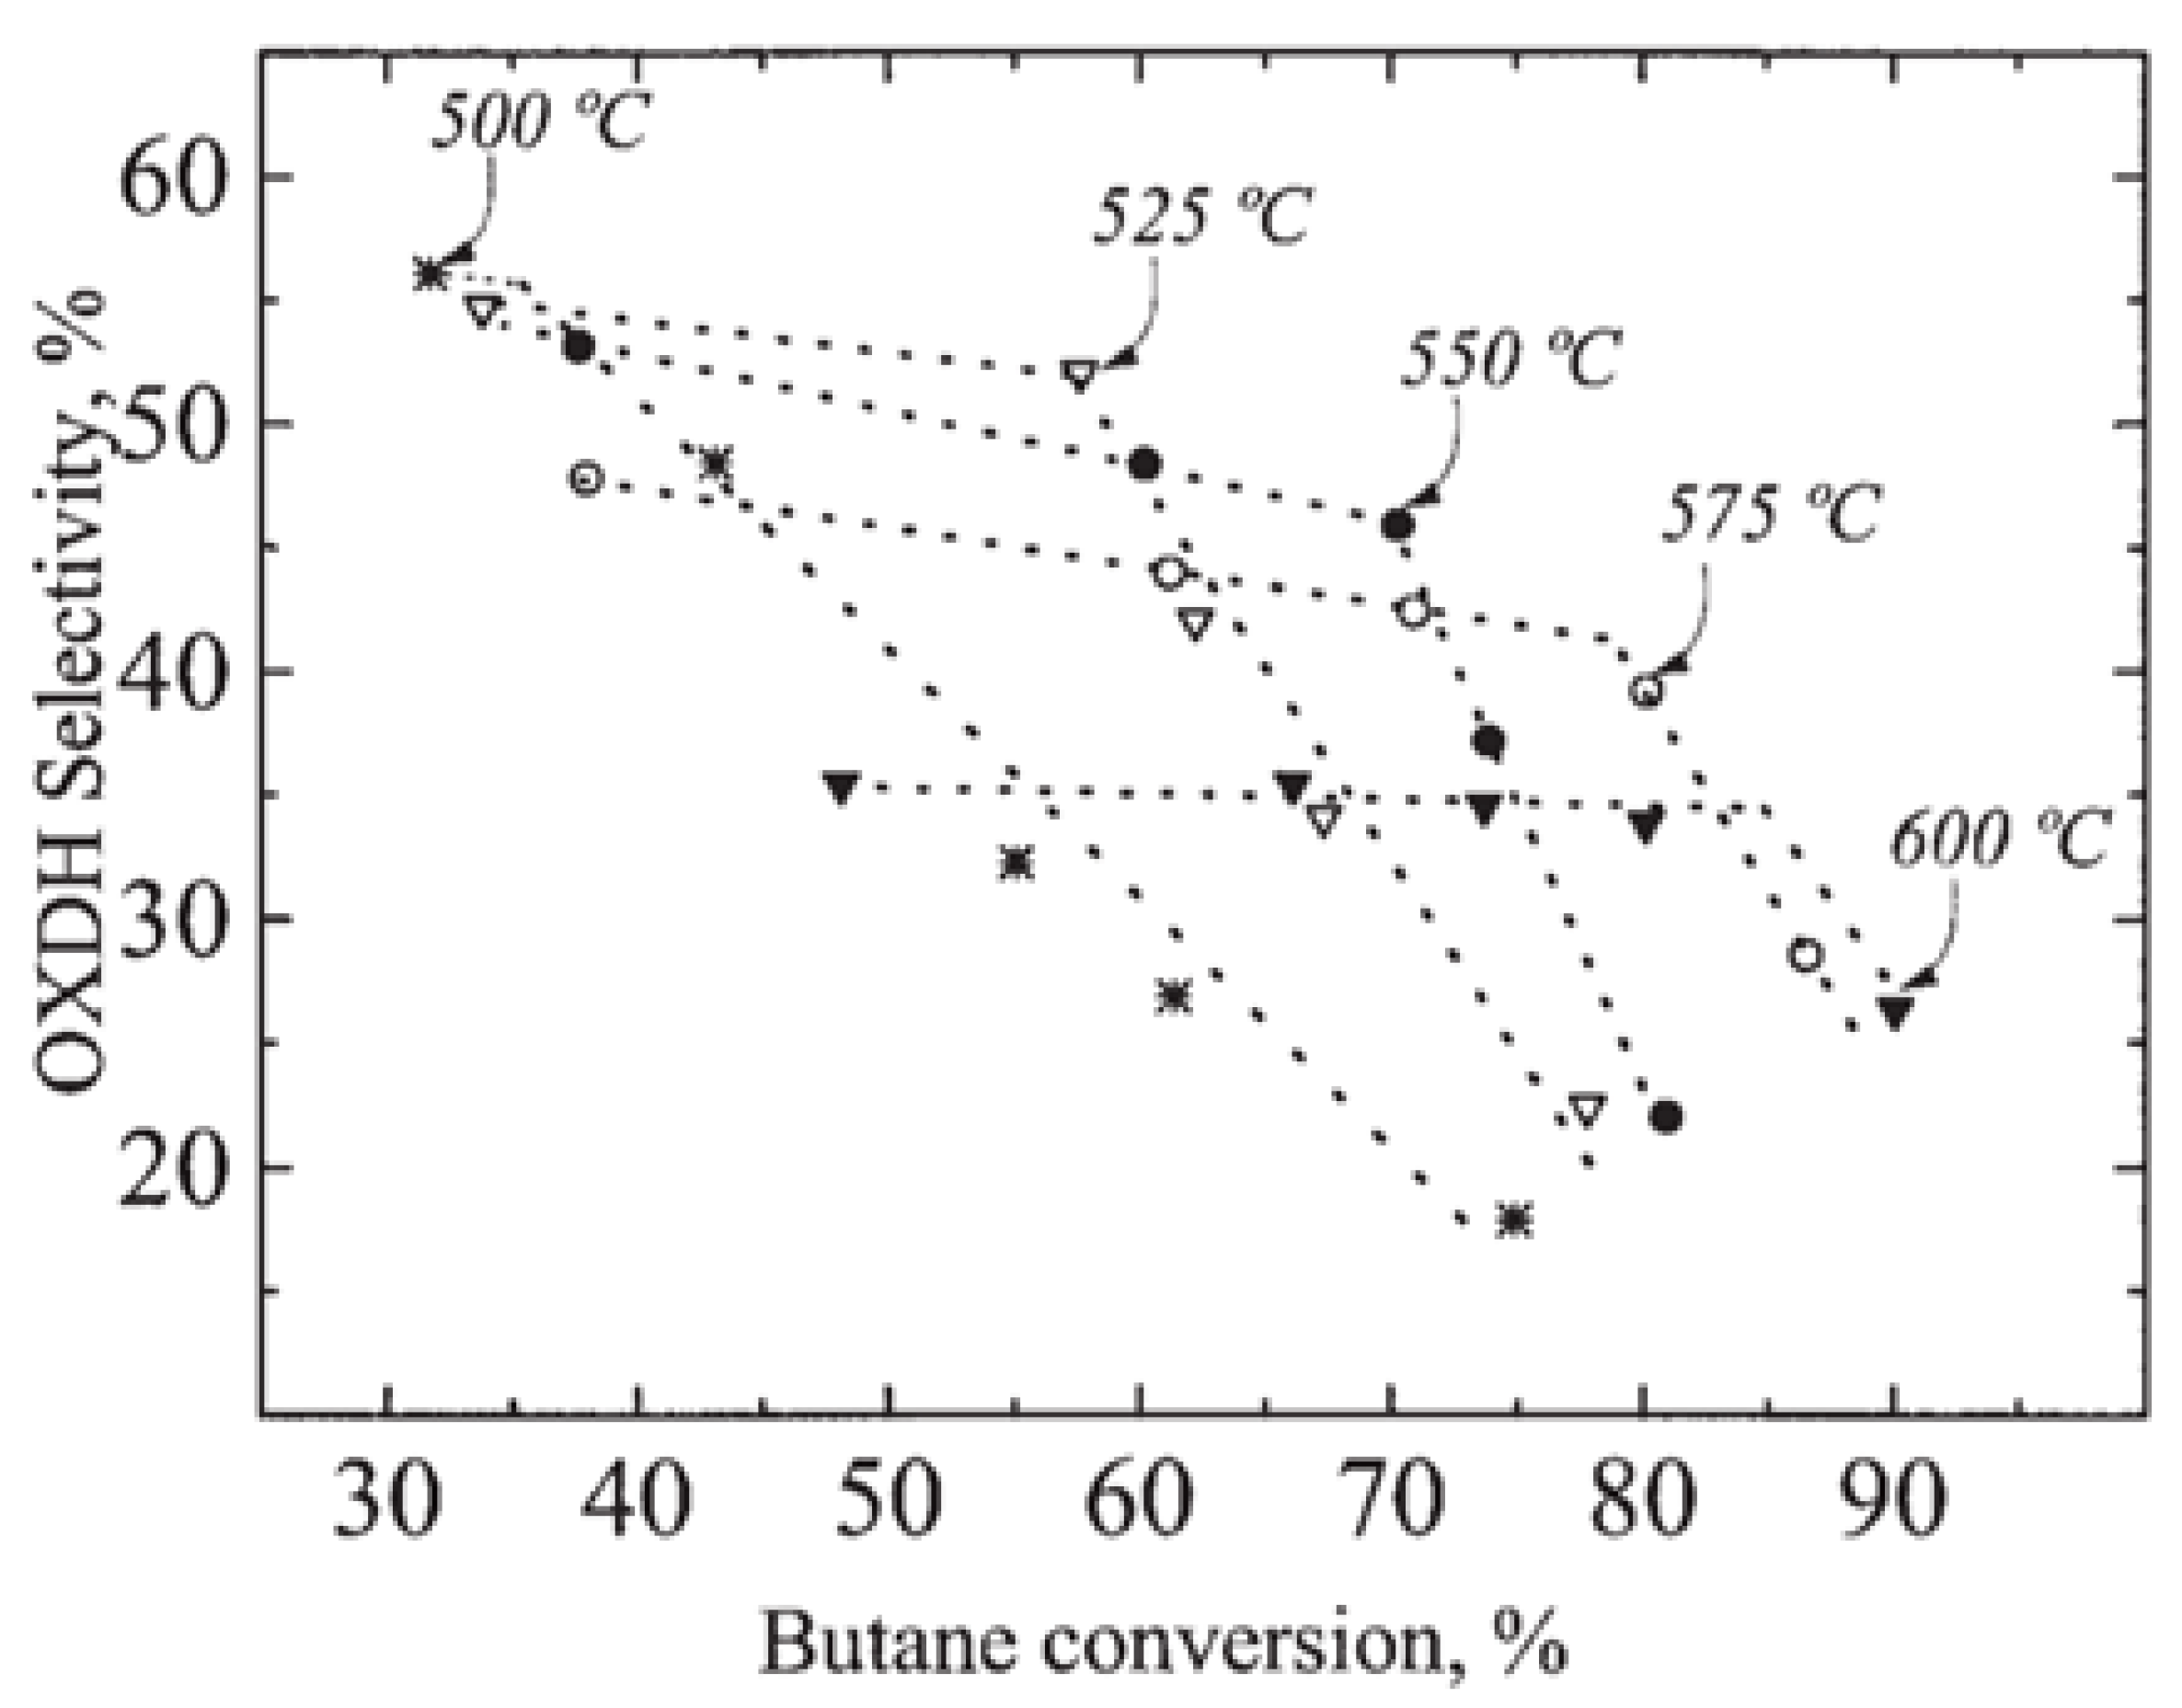
| [53] | O | kinetic modeling, fluid dynamic | internally circulating fluidized bed | 215 g catalyst; relative velocity: 1.5–5.5; feed rate: 1–4; 773–873 K | ∼33% (773 K) | ∼55% (773 K) | N/A | |
| [54] | O | kinetic modeling, gas and solid flow model | two-zone fluidized bed | total feed rate: 223 Ncm/min; 23 g catalyst; 773–873 K | ∼60% | ∼50% | N/A | |
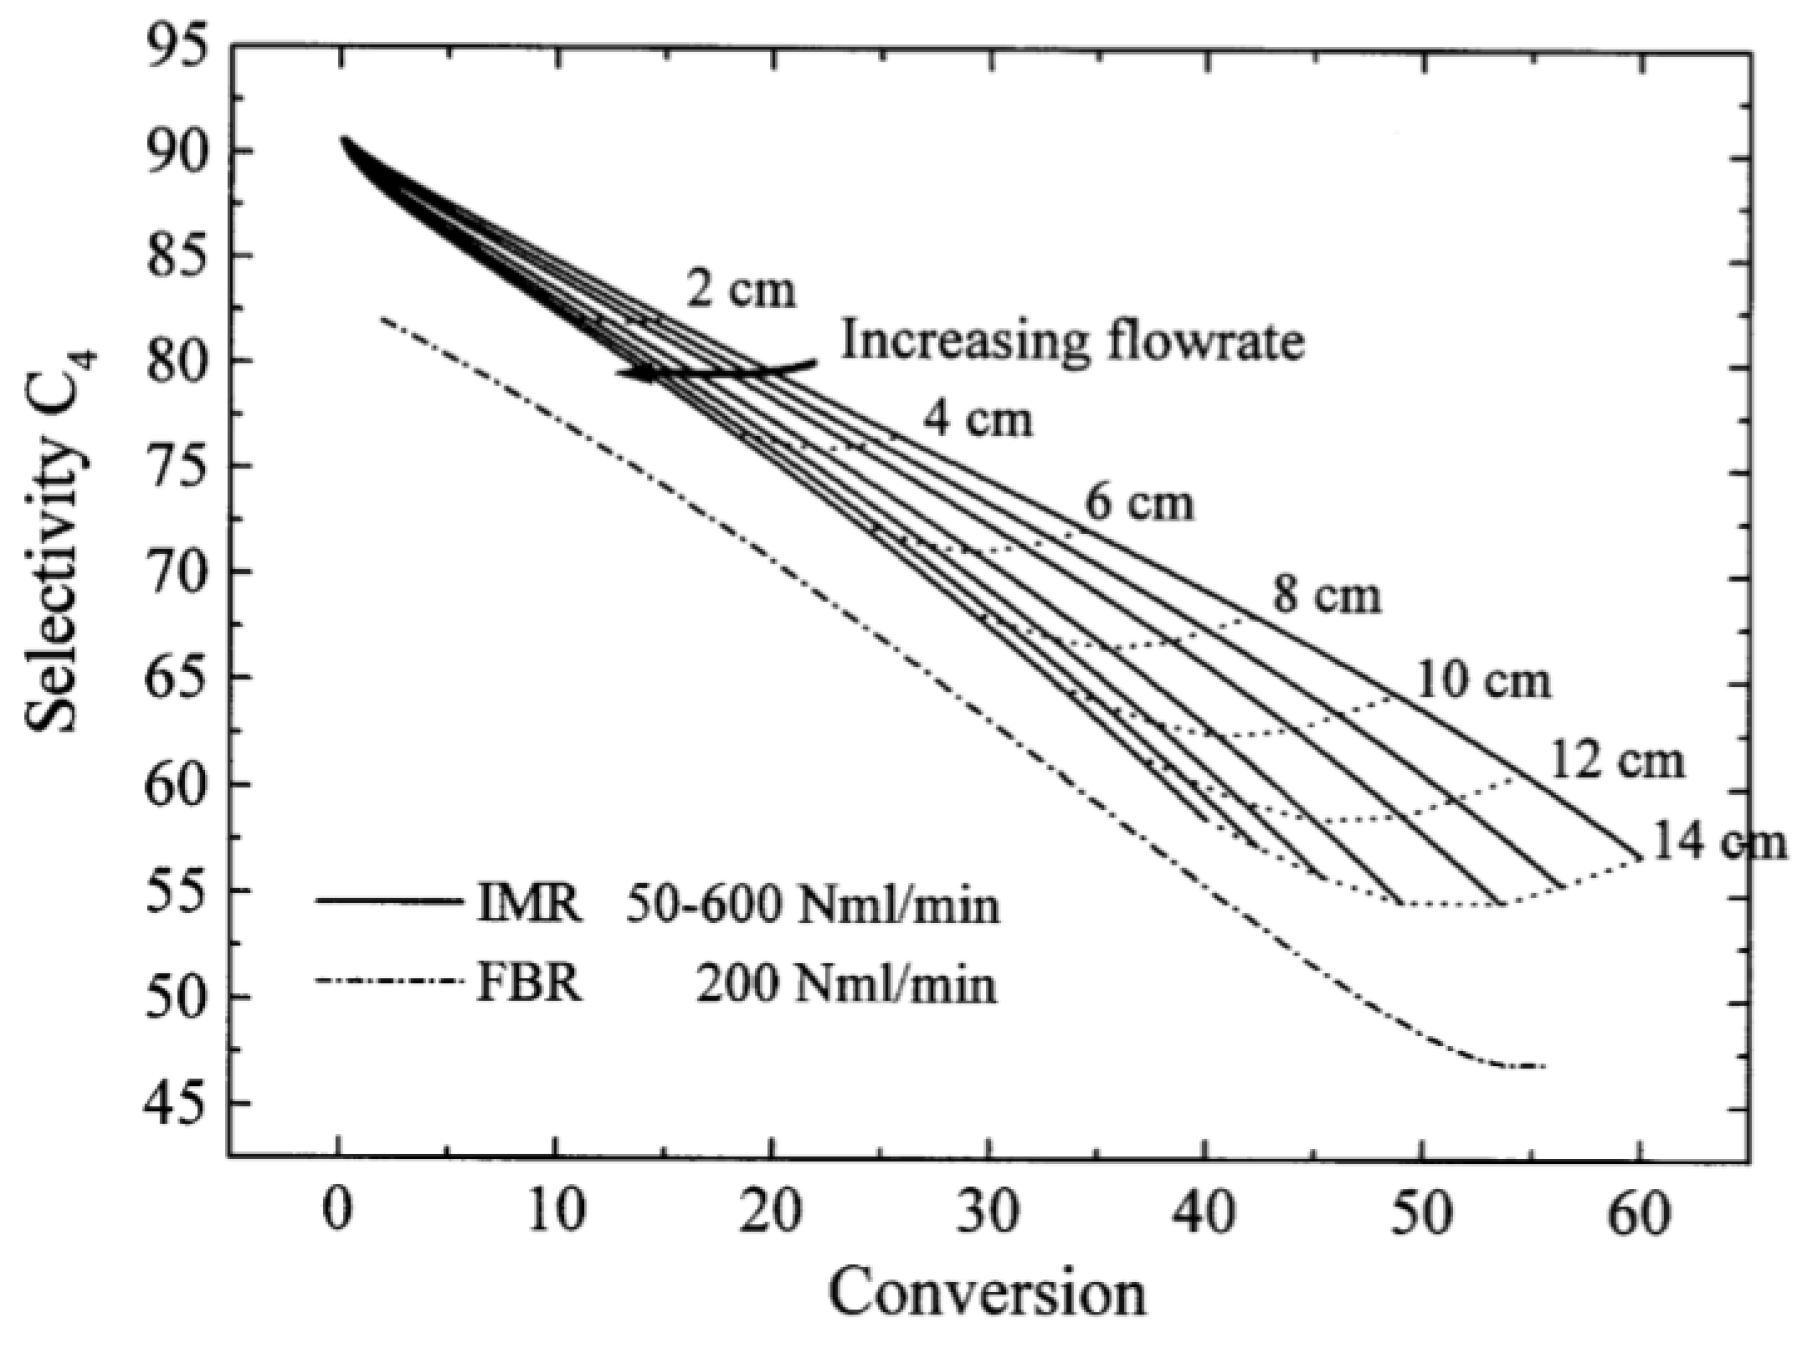
| [55] | endothermic, O | kinetic and reactor modeling | inert membrane (FBR, IMR) | 2.8 g catalyst; flow rate: 100–600 Nml/min; 773 K | ∼55% | 30% (butadiene), 10% (butenes) | N/A | |
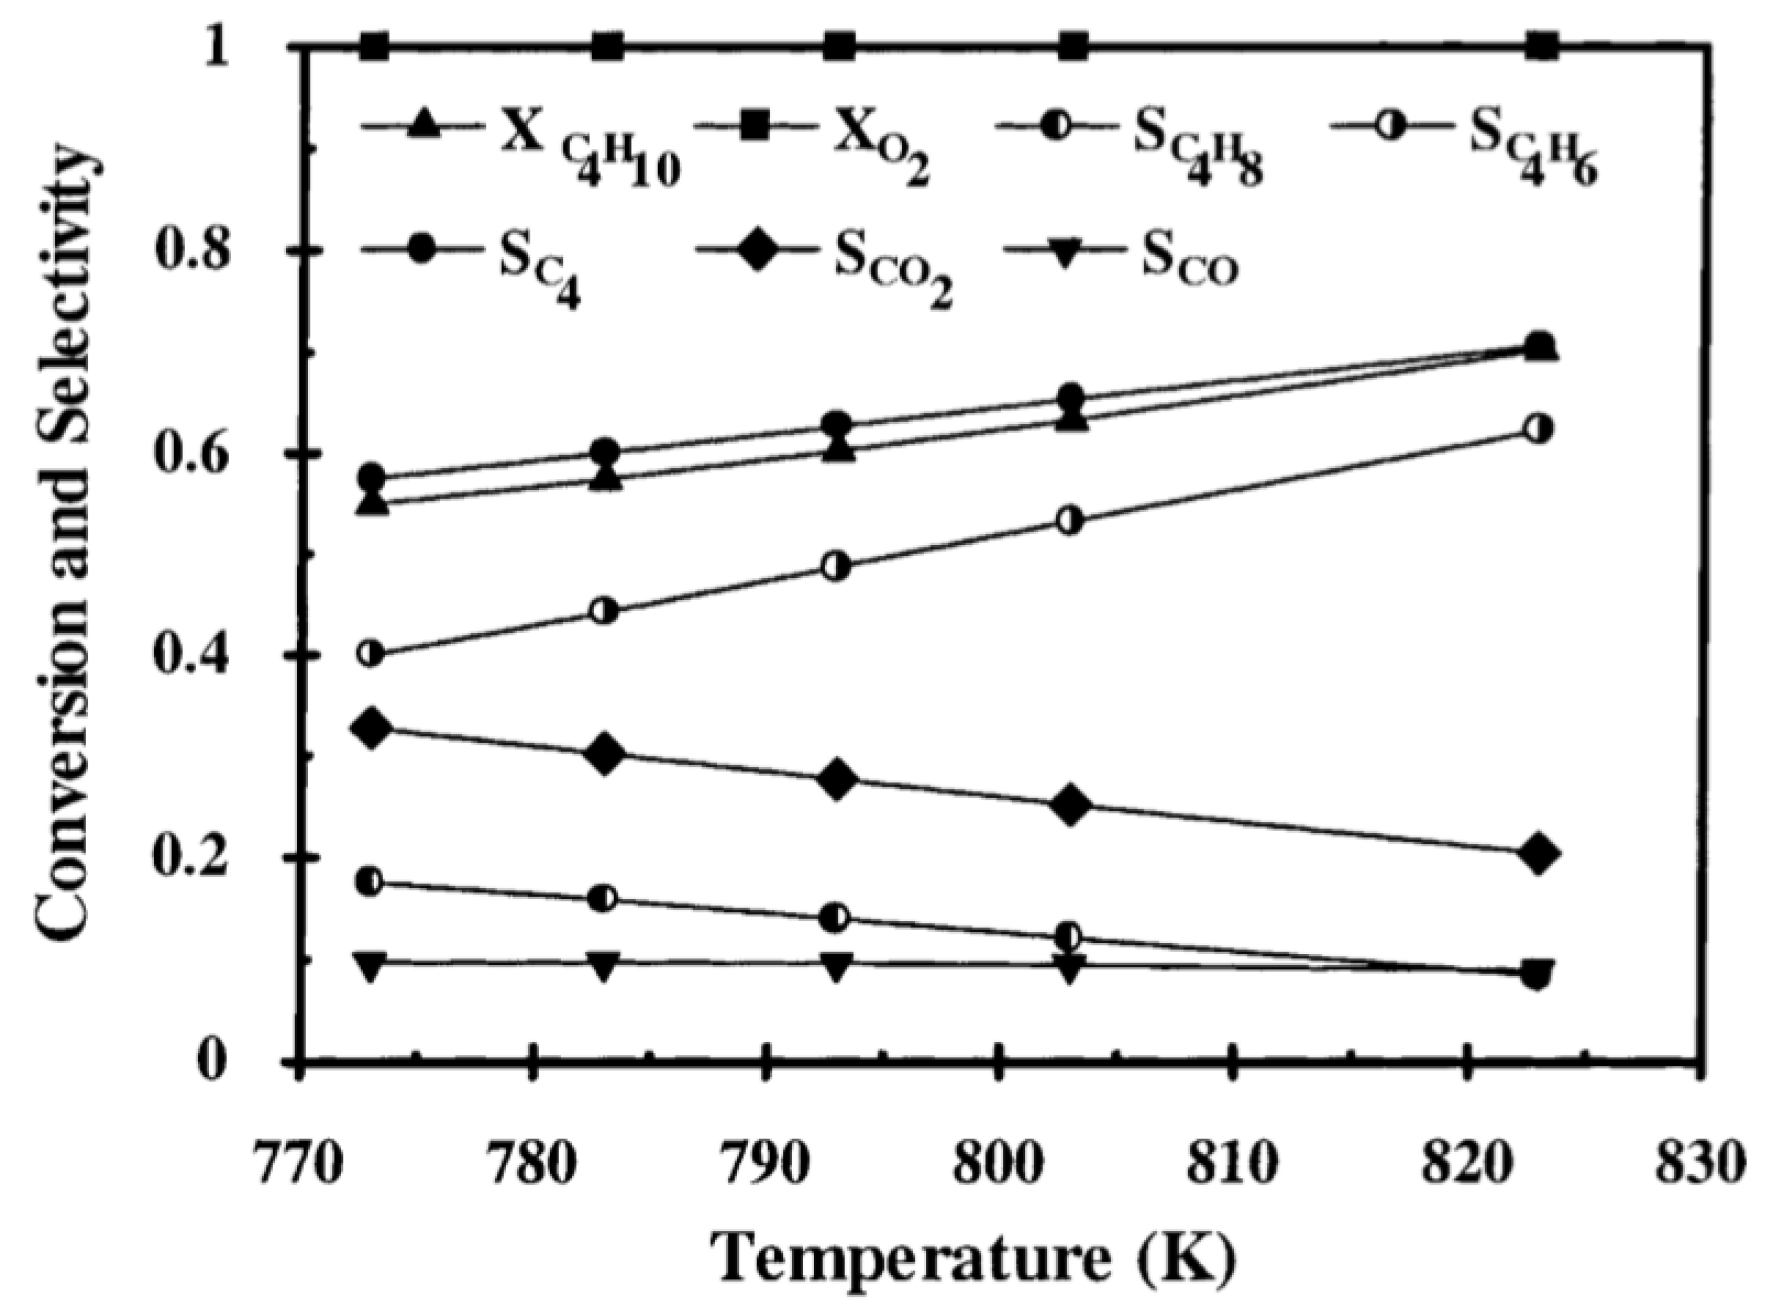
| [56] | endothermic, O | kinetic and reactor modeling | fixed bed, porous membrane | total flow rate: 4.5×10 mol/s; 748–823 K, 101.3 kPa; c() = 2–10%; c() = 2–10%; c() = 0–3%; c() = 0–3% | 70% (825 K) | 10% (butene), 60% (butyne) | N/A | |
| [58] | endothermic, NO | DFT, kinetic modeling | Ni(111) | N/A | 284.1 K–1028.2 K | N/A | N/A | coke deposition from deep dehydrogenation |
| [59] | exothermic, O | DFT, kinetic modeling | bimetallic | quartz tube | inlet gas flow: 40 mL/min; 873 K, 1 atm | N/A | N/A | adding Fe to Ni improves performance |
| [60] | endothermic, NO | DFT, DFT-D3 (vdW) | Ni(111) | N/A | N/A | N/A | N/A | N/A |
| [61] | endothermic, NO | DFT, kinetic modeling | - | N/A | 823 K | N/A | N/A | N/A |
| [3] | endothermic, O | MCMC | fixed bed | 793–853 K, 1 atm | 0.4–17.5% | N/A | no deactivation after 60 consecutive cycles | |
| [62] | NO | DFT | Pt/B/, Pt/ | quartz | GHSV: 2700 h; total flow rate: 100 mL/min; 823 K | N/A | 70% | coke surface deposit: 1.01% (Pt/); 0.68% (Pt/B/) |
| [63] | endothermic, NO | DFT, kinetic modeling, microcalorimetrics | Pt-Zn/X-zeolite | down-flow | 673–773 K, 0.01–0.04 atm | 0.45% | 95–100% | N/A |
| [64] | NO | kinetic and reactor modeling | Pt-In | zeolite membrane | feed rate: 50 cm/min; 773 K, 1–1.4 atm | ∼42% (0.3 atm) | N/A | high hydrogen permeation induces catalyst deactivation |
| [65] | NO | QM/MM, CBMC | Brønsted Acidic Zeolite | N/A | >673 K | N/A | N/A | N/A |
| [66] | NO | DFT, QM/MM, CBMC | Brønsted Acidic Zeolite | tubular quartz | zeolite weight: 8–15 mg; 773 K | N/A | N/A | N/A |
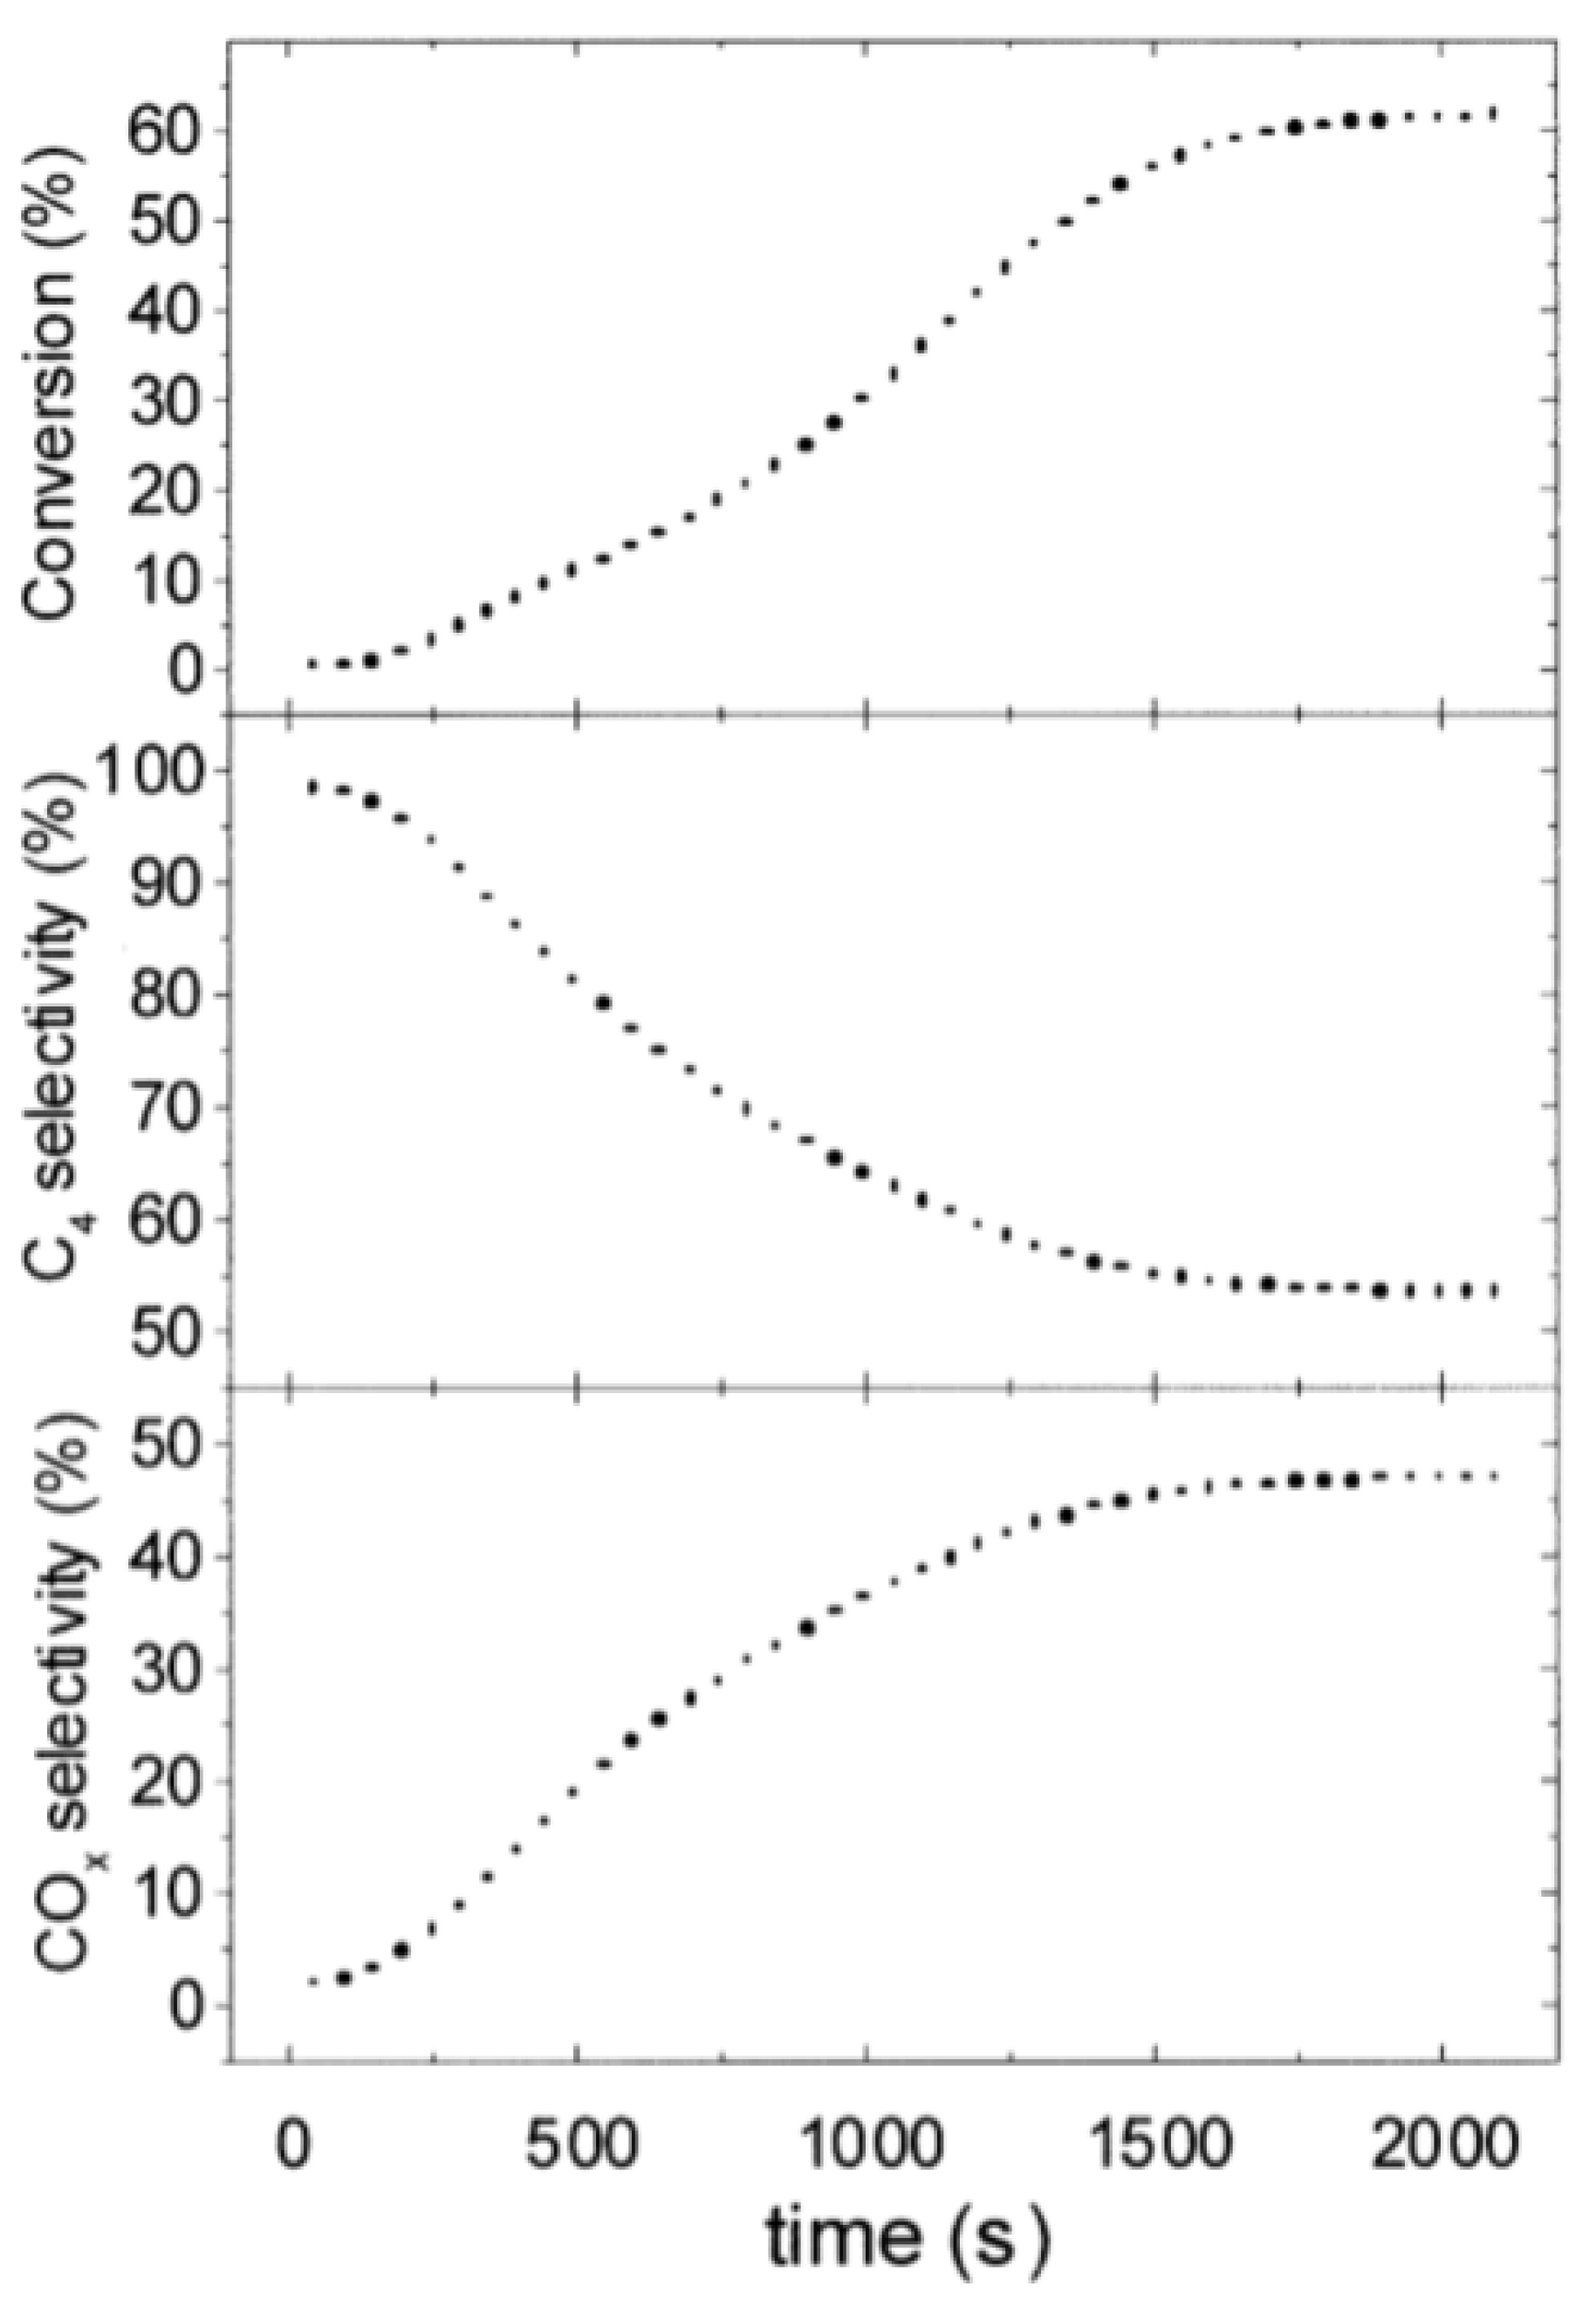
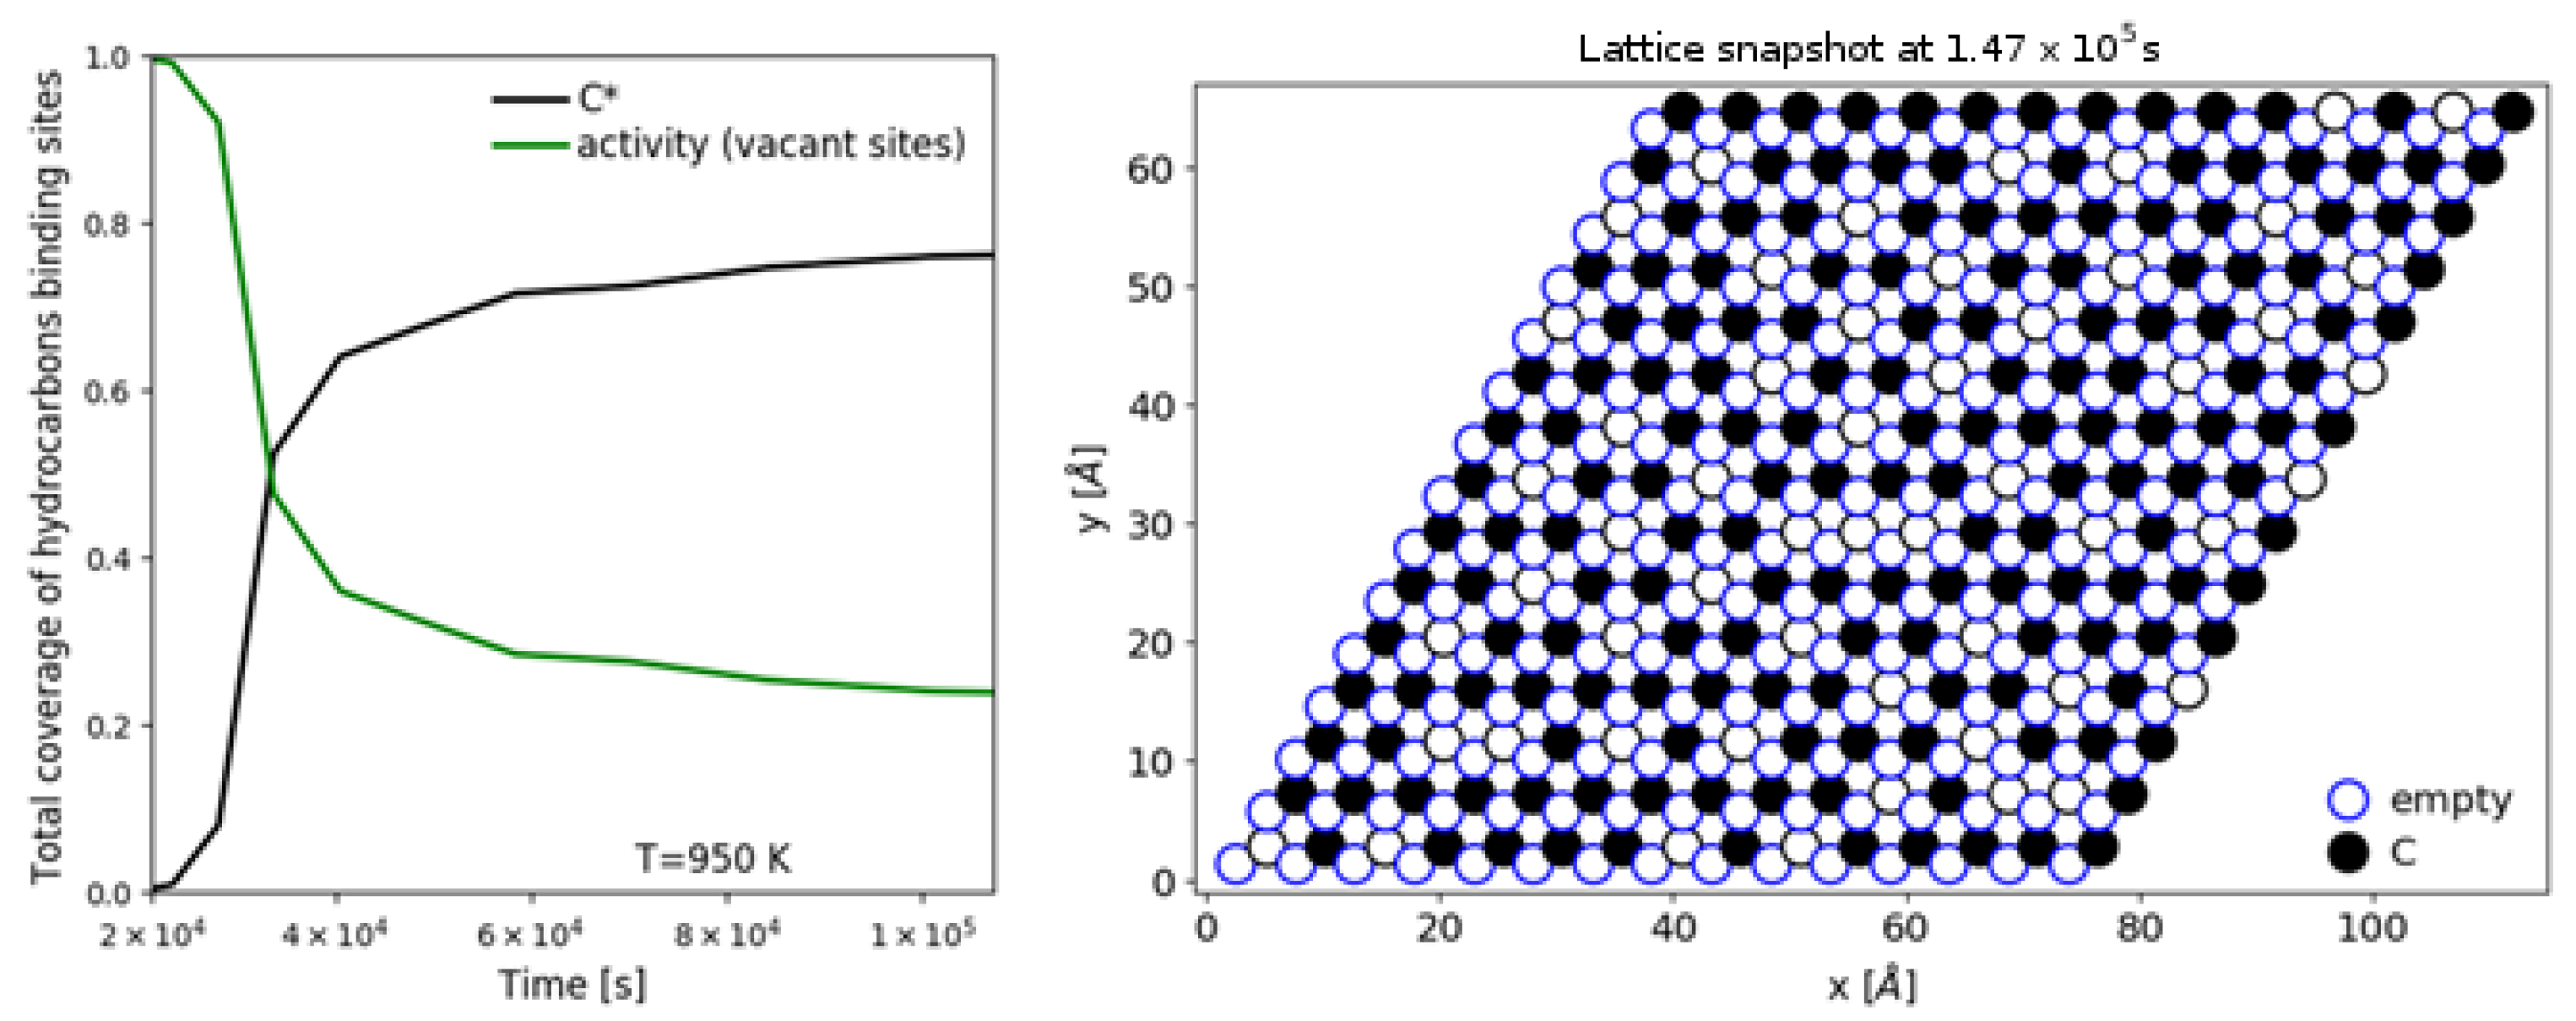
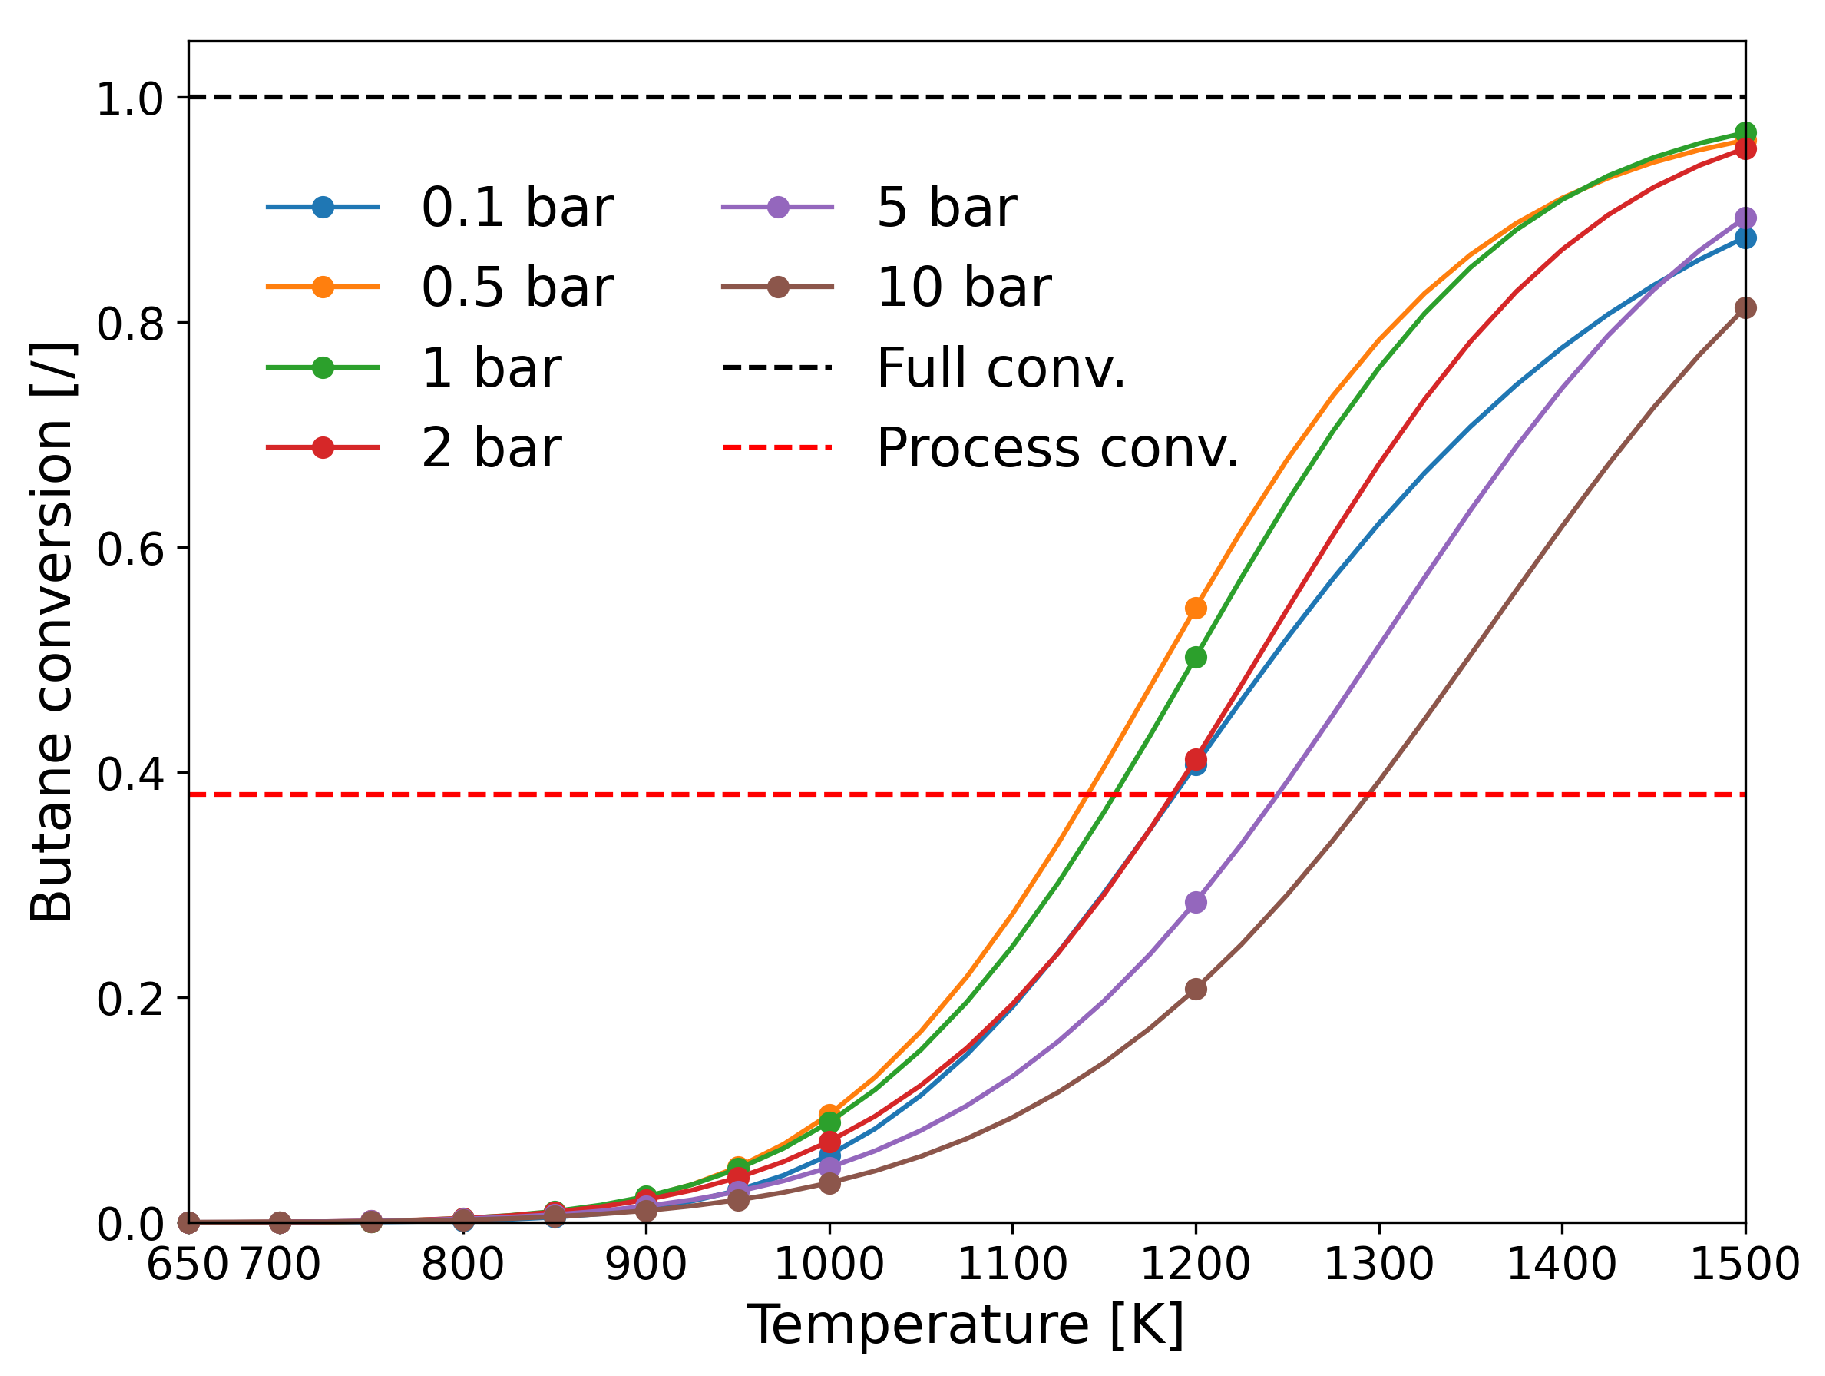
| [20] | endothermic, NO | DFT, kMC, MKM | (0001) | CSTR, PFR | GHSV: 100–20,000 h; 650–1500 K, 0.1–10 bar | ∼5% (950 K); ∼40% (1200 K); ≲95% (1500 K) | ∼90% 2-butene; ∼20% butadiene | significant deactivation after 10 h (Figure 13) |
Publisher’s Note: MDPI stays neutral with regard to jurisdictional claims in published maps and institutional affiliations. |
© 2020 by the authors. Licensee MDPI, Basel, Switzerland. This article is an open access article distributed under the terms and conditions of the Creative Commons Attribution (CC BY) license (http://creativecommons.org/licenses/by/4.0/).
Share and Cite
Skubic, L.; Sovdat, J.; Teran, N.; Huš, M.; Kopač, D.; Likozar, B. Ab Initio Multiscale Process Modeling of Ethane, Propane and Butane Dehydrogenation Reactions: A Review. Catalysts 2020, 10, 1405. https://doi.org/10.3390/catal10121405
Skubic L, Sovdat J, Teran N, Huš M, Kopač D, Likozar B. Ab Initio Multiscale Process Modeling of Ethane, Propane and Butane Dehydrogenation Reactions: A Review. Catalysts. 2020; 10(12):1405. https://doi.org/10.3390/catal10121405
Chicago/Turabian StyleSkubic, Luka, Julija Sovdat, Nika Teran, Matej Huš, Drejc Kopač, and Blaž Likozar. 2020. "Ab Initio Multiscale Process Modeling of Ethane, Propane and Butane Dehydrogenation Reactions: A Review" Catalysts 10, no. 12: 1405. https://doi.org/10.3390/catal10121405
APA StyleSkubic, L., Sovdat, J., Teran, N., Huš, M., Kopač, D., & Likozar, B. (2020). Ab Initio Multiscale Process Modeling of Ethane, Propane and Butane Dehydrogenation Reactions: A Review. Catalysts, 10(12), 1405. https://doi.org/10.3390/catal10121405