Article

Multi-Scale Studies of 3D Printed Mn–Na–W/SiO2 Catalyst for Oxidative Coupling of Methane

1
Process Dynamics and Operation Group, Technische Universität Berlin, Sekr. KWT-9, 10623 Berlin, Germany
2
Flemish Institute for Technological Research, VITO NV, 2400 Mol, Belgium
3
Rutherford Appleton Laboratory, Research Complex at Harwell, Didcot OX11 0FA, UK
4
School of Materials, University of Manchester, Manchester M13 9PL, UK
5
Finden Limited, Building R71, Harwell Campus, Didcot OX11 0QX, UK
6
ESRF—The European Synchrotron, 38000 Grenoble, France
7
Johnson Matthey Technology Centre, Blount’s Court Road, Sonning Common RG4 9NH, UK
8
Inorganic Membranes and Membrane Reactors, Sustainable Process Engineering, Department of Chemical Engineering and Chemistry, Eindhoven University of Technology, 5612 AZ Eindhoven, The Netherlands
9
Department of Chemistry, University College London, 20 Gordon Street, London WC1H 0AJ, UK
*
Author to whom correspondence should be addressed.
Catalysts 2021, 11(3), 290; https://doi.org/10.3390/catal11030290
Submission received: 31 December 2020 / Revised: 12 February 2021 / Accepted: 17 February 2021 / Published: 24 February 2021
(This article belongs to the Special Issue Multi-Scale Analysis of Advanced Catalytic Systems)

Abstract

:
This work presents multi-scale approaches to investigate 3D printed structured Mn–Na–W/SiO2 catalysts used for the oxidative coupling of methane (OCM) reaction. The performance of the 3D printed catalysts has been compared to their conventional analogues, packed beds of pellets and powder. The physicochemical properties of the 3D printed catalysts were investigated using scanning electron microscopy, nitrogen adsorption and X-ray diffraction (XRD). Performance and durability tests of the 3D printed catalysts were conducted in the laboratory and in a miniplant under real reaction conditions. In addition, synchrotron-based X-ray diffraction computed tomography technique (XRD-CT) was employed to obtain cross sectional maps at three different positions selected within the 3D printed catalyst body during the OCM reaction. The maps revealed the evolution of catalyst active phases and silica support on spatial and temporal scales within the interiors of the 3D printed catalyst under operating conditions. These results were accompanied with SEM-EDS analysis that indicated a homogeneous distribution of the active catalyst particles across the silica support.

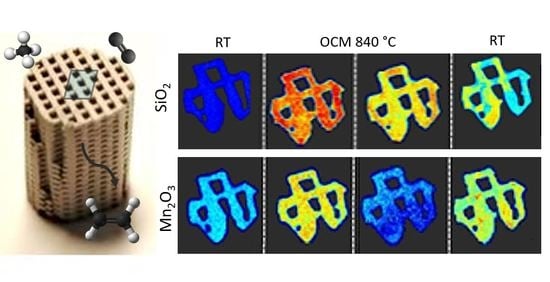
Graphical Abstract

1. Introduction

The most widespread method for ethylene production is naphtha steam cracking, which is one of the most energy consuming processes. The energy consumption and CO2 emissions in refinery processes (such as steam cracking, catalytic reforming) are responsible for as much as 33 GJ per tonne of product (ethylene) and 1.9 tonne of CO2 [1,2] which reflects the pressing need for CO2 emissions reduction within these processes and for the development and introduction of new industrial technologies with significant lower energy consumption. The oxidative coupling of methane (OCM) has been attracting interest for years as a promising route for the direct conversion of methane to ethylene [3]. In contrast to naphtha steam cracking, OCM offers the potential for simplifying the production process and enabling an important reduction of the environmental impact of manufacturing commercial olefins. Additionally, it is possible to produce ethylene from biogas as a renewable feedstock [4]. However, the direct conversion of CH4 is challenging due to the high C-H bond strengths and requires high temperature conditions which can be reduced with a careful selection of transition metals as catalysts. Since the 1980s there have been numerous studies on OCM reactions revolving around finding a suitable and stable catalyst composition based on variations of rare-earth oxides or mixed oxides and transition metals. Li/MgO [5,6], La2O3/CaO [7,8] and Mn/Na2WO4/SiO2 [9] are among the most promising compositions identified for OCM.
Mleczko et al. [10]’s kinetic model could be seen as the cornerstone of research on this subject proposing a temperature range between 700 and 950 °C, a CH4/O2 ratio between 2.5 and 10, pressure up to 10 bar and a set of 10 constituent reactions describing the OCM. In a study by Liu et al. [11], the OCM reaction was scaled up to a 200 mL fixed-bed reactor using a Mn/Na2WO4/SiO2 catalyst. This study reported a 100 h reaction time with the highest C2 (ethylene and ethane) yield, at 25%, and C2 selectivity at 61–66%, benefiting from the presence of steam. Lee et al. [12] reported a scale up of different reactor types to up to 40 g of packed Mn/Na2WO4/SiO2 catalysts. They observed hot spot formation due to poor heat transfer that led to a decrease in C2 selectivity and CO and CO2 formation. Furthermore, issues with the heat management of the reactor have been studied in great detail by Tiemersma et al. [13,14,15]. They proposed a dual function catalyst concept offering the advantage of coupling the OCM reaction with dry and steam methane reforming. At present, there is one commercial application of ethylene production via OCM [16].
The most recently published review by Gao et al. [17] comprehensively summarizes the latest developments in the field of catalytic ethylene production and its history. To date, the low C2 yields remain the main drawback of the OCM. However, striving for the highest C2 yield is not necessarily the goal, as it has been shown that the process can be economically viable even with lower yields but high selectivity [17]. The heat management remains the biggest challenge for the OCM reactor design [18] and several studies have pointed out that it is critical for the performance of the OCM, especially in order to overcome the problems with the generation and removal of reaction heat [19,20,21]. Therefore, recent research efforts focused on membranes for selective oxygen permeation for supplying oxygen to the reaction. In particular, the effect of different materials and treatments on the microstructure and the permeation of the membranes for distributive feeding of oxygen along the reactor is broadly studied [13,22,23,24] and has resulted in improved heat distribution along the reactor [21,23]. Some of these results are very promising, showing a C2 yield of up to 35% and increasing selectivity towards C2 (and low selectivity towards CO2 and CO) at the right temperature control while keeping the oxygen partial pressure low [25,26,27].
Shi et al. [28] have shown a certain amount of co-fed CO2 can lead to enriched surface tetrahedral Na2WO4 species and high surface concentration of O-species in MOx, increasing both conversion and selectivity.
Three-dimensional (3D) printing technology for catalyst printing is in its early stages of development but holds promise to open up new possibilities for reactor design and catalytic applications [22]. These structured catalysts are small-scale catalytic reactors consisting of regular three-dimensional channels constructed from successive layers of extruded filamentous material. 3D printing offers a great degree of control when designing the final geometry of the structure, including the outside form, the regular internal pattern of layers and fiber diameter and sizes. 3D printed catalysts offer an alternative to the conventional methods of using catalyst powders/pellets in packed beds. The benefit of 3D printing of periodic (multi-channel) structures over packed beds and foams is that they allow for a high degree of control over the printed arrays, higher mass and heat transfer, lower pressure drop and overall superior performance (due to higher geometric surface area) and easier scale-up, with a positive effect on process sustainability and costs [29]. The improved mass and heat transfer will lead to reduced catalyst deactivation and improvement of the reaction conversion. It was shown that printed monolithic catalysts can improve the removal of the reaction heat that is generated and thus establish a more optimal temperature profile [30,31]. In this work, periodic structured catalysts were directly printed, i.e., fully extruded 3D catalyst and support materials all in one.
The design of the catalysts in the present work was optimized for operation within a chemical OCM reactor capable of stable operation, with high product selectivity and conversion, that matched or exceeded the selectivity and conversion of existing catalyst formulations. The 3D printed catalysts were employed for ethylene production in a mini plant-scale reactor with a total volume of 1.8 L, as well as in a specially designed reactor cell for in situ/operando synchrotron X-ray diffraction measurements.
Synchrotron based X-ray diffraction computed tomography (XRD-CT) technique has been previously used to investigate catalyst systems under reaction conditions [32,33,34,35]. Matras et al. and Vamvakeros et al. [8,36,37,38,39,40] have performed real-time tomographic diffraction imaging of catalytic membrane reactors (CMRs) under OCM reaction conditions over Mn–Na–W/SiO2 catalysts packed inside Ba0.5Sr0.5Co0.8Fe0.2O3−δ (BSCF) [8] and BaCoxFeyZrzO3−δ (BCFZ) hollow fiber oxygen membranes [36,38] respectively.
The main contribution of this work to these research efforts consists of a multi-scale study into the microscopic nature and evolution of 3D printed monolith catalysts during the OCM, in order to show their potential for optimizing the reaction process. In addition, investigations on the catalytic behavior were carried out and were subsequently correlated with the reaction and process characteristics of the catalysts at lab and mini-plant scale.

2. Materials and Methods

2.1. Preparation of Catalysts

The starting catalyst powder was prepared by Johnson Matthey (JM). The method for making Mn–Na2–WO4/SiO2 was based on some of the incipient wetness impregnation methods published in the literature although those methods vary [41,42]. The catalyst loading was 1.6 wt % Mn–5 wt % Na2WO4/SiO2. Firstly, the amount of manganese nitrate required to achieve 1.6 wt % was dissolved in deionized water to fill 80% of the pore volume of the Evonik silica support (Evonik EXP-4210-1). The material was then dried at 65 °C. Subsequently, 5 wt % Na2WO4 was impregnated in the same manner but was dried at 105 °C. The material was then calcined at 750 °C for two hours with a heating ramp rate of 3 °C min−1.
Monolith-like multichannel structures were 3D printed from JM’s milled catalyst material and methylcellulose, a typical polymer binder. Tuning the inorganic binders and additives (colloidal silica, bentonite and additional EXP-4210-1 silica obtained from Evonik) was necessary to improve mechanical strength; additive-free Mn–Na2–WO4/SiO2 structures were of less satisfactory mechanical strength. To obtain structures of the desired patterns and size, the highly adaptable 3D printing system NScrypt was employed to allow direct and uniform (co)extrusion of support material and additives (Figure 1). Tuning the printing conditions included the selection of the nozzle size (fiber thickness), inter-fiber distance (channel size) and the stacking of the layers (architecture). The final 3D printed catalyst was obtained by adequate thermal treatment (calcination) at 500 °C to remove all aqueous and organic (polymer) components.

2.2. Characterization

2.2.1. Lab Characterization

The surface area (Brunauer–Emmett–Teller, BET) and porosity analyses of the catalysts (powder, pelletized and printed) were performed using nitrogen adsorption on a BELSORPmini gas sorption analyzer. The macro and microstructure and elemental distribution images were obtained using a FEI Nova NanoSEM 450 operated at 20 kV and coupled with an EDX (energy dispersive X-ray spectroscopy) QUANTAX 200 system. X-ray diffraction (XRD) analysis was carried out on a Philips/Panalytical X’Pert Pro powder diffractometer with a CuKα radiation source operated at 40 keV and 40 mA. The diffraction data was analyzed using the X’Pert High Score Plus software.

2.2.2. Synchrotron Characterization

XRD-CT measurements were performed at ID15A beamline [43] at the European Synchrotron Radiation Facility (ESRF) using a monochromatic beam of 95 keV. Consecutive XRD-CT scans were collected using a beam size of 45 × 18 μm with a z step size of 50 μm. Diffraction patterns were recorded using a PILATUS3 × CdTe (Dectris) area detector. The slices of the 3D printed catalysts were obtained using 260 translation steps (with 50 μm step size) and 180 rotation steps at over 180°, with exposure time of 25 ms. The detector calibration was performed using a CeO2 NIST standard. Every 2D diffraction image was converted to a 1D powder diffraction pattern after applying a 10% trimmed mean filter to remove outliers using pyFAI and the nDTomo software suite [44,45,46,47]. The final XRD-CT images (i.e., reconstructed data volume) were reconstructed using the filtered back projection algorithm. The details of the Rietveld refinement of the XRD-CT data can be found in the authors’ previous work [34].
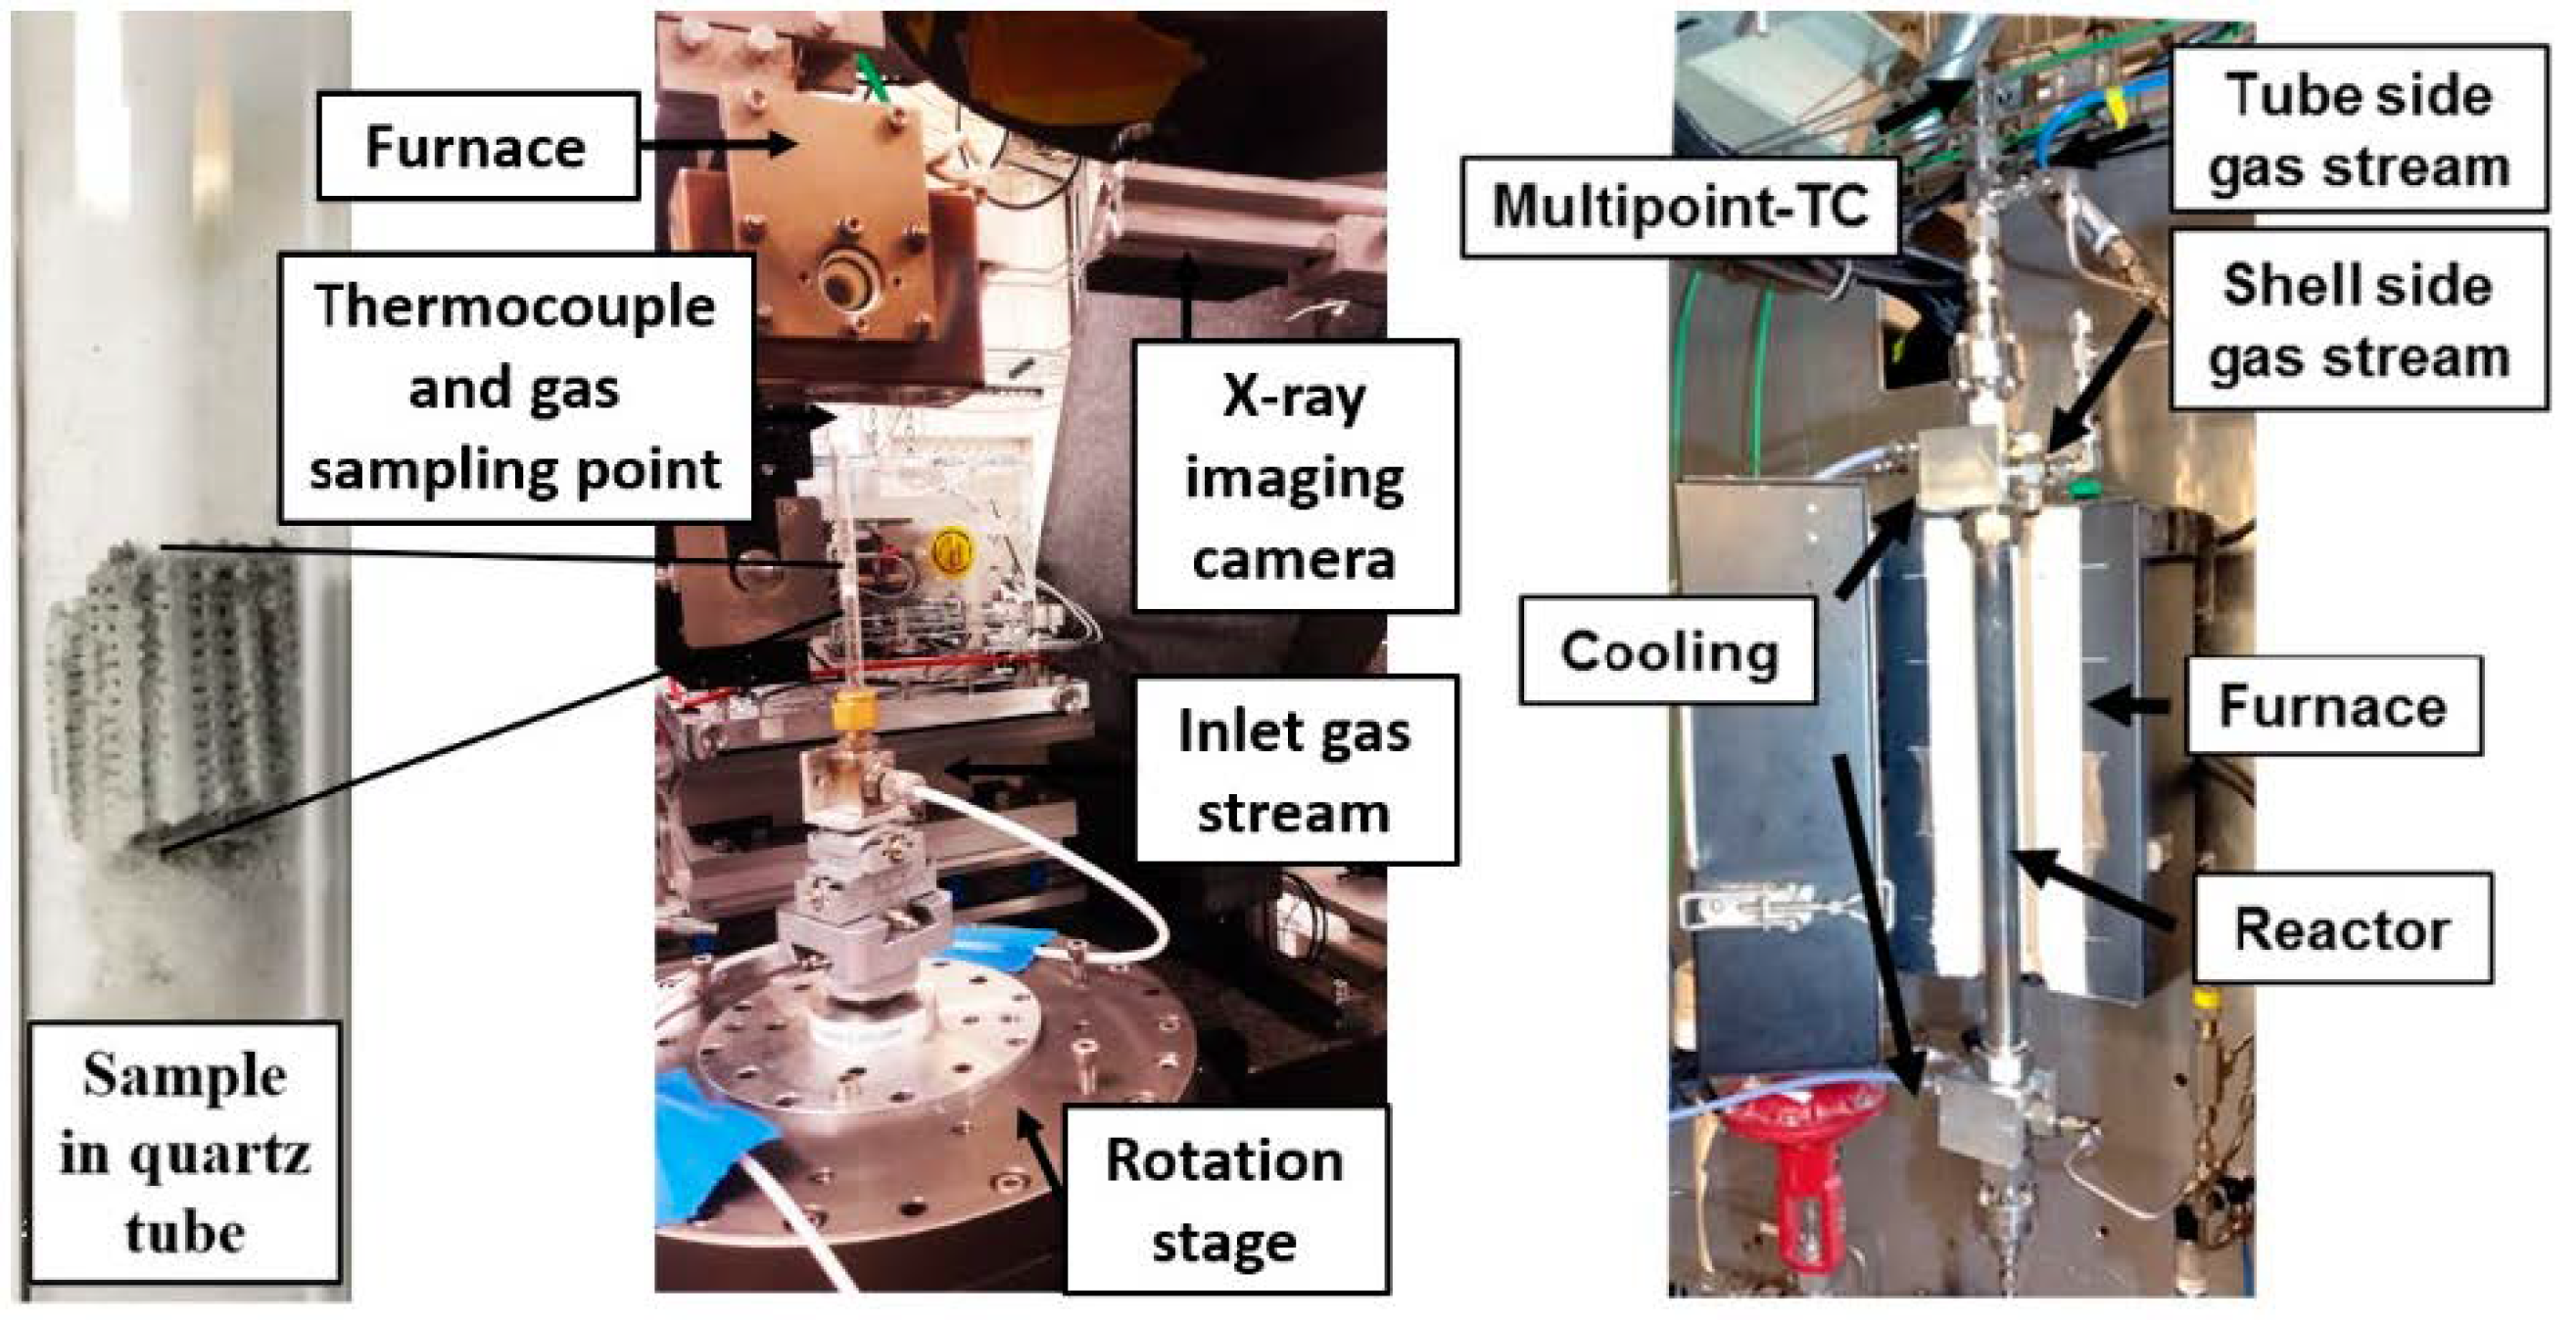
The OCM reaction was performed at atmospheric pressure with a CH4:O2:N2 ratio of 4:1:4. The outlet gases were analyzed by mass spectrometry at ID15 using an Ecosys portable mass spectrometer (the details of the operating conditions and results are shown in the Supplementary Materials). For the tests 88 mg of structured catalyst were cut to size for a 6 mm OD quartz tube and were heated up to 840 °C in the atmosphere of 5% O2 in He. The OCM reaction was performed with a gas hourly space velocity (GHSV) 36,000 mL g−1 h−1 and a total flow of 53 s cm3. The sample was heated using an ID15A in-house box furnace and the gas mixture was fed from the bottom of the reactor. Figure 2 shows the experimental setups used during both experiments, the in situ synchrotron XRD-CT (left) and the ex situ fixed bed reactor measurements.

2.3. Catalytic Testing

The ex situ experiments were carried out to test the 3D printed catalyst for its performance in a more realistic environment and compare it to its fixed bed analogues.
The catalytic testing was carried at the TUB reactor set-ups. First, the catalysts were tested in their printed form and re-crushed as pellets in a fixed bed reactor (FB). In addition, the catalyst powder was tested in a membrane fixed-bed reactor (MFB). The OCM reaction was performed at 1.25 bar(a).
The gas feed was controlled by Bronkhorst MFCs (IN-FLOW) and the reactors were located in an electric split tube furnace (HTM Reetz 2 kW). An Agilent micro-GC, equipped with a 20 m 5 Å molar sieve column and a 20 m PoraPLOT Q column with thermal conductivity detector (TCD), was used to analyze the outlet gases. The entire system is controlled and monitored with SIEMENS PCS7.
Figure 2 (right) shows the experimental setup at the TUB miniplant for ex-situ experiments. The schematic diagrams of the set-ups with reactors are shown in Figure S1 in the Supplementary Material.
It should be noted that the direction of the gas feed can have a certain influence on the reaction. In the results presented in this work, in the ex situ set-up the gas mixture was fed into the reactor from the top of the tube while the same gas mixture was fed from the bottom of the set-up in the in situ study (due to practical considerations and engineering constraints. See Figure S1). However, this influence is negligible for the printed structures, since only one structure was measured in the otherwise empty reactor, and heat radiation effects and heat dissipation are considered minimal due to the different process design.

2.3.1. Fixed Bed Reactor

For the fixed bed setup (Figure S1), the structures were located in a 60 cm long dense ceramic Al2O3 tube with ID/OD = 7/10 mm (Fraunhofer IKTS) which served as an inert reactor. The Al2O3 tubes were sealed with rubber O-rings outside the hot zone. The temperature control for the fixed bed reactor experiments was performed using a thermocouple attached to the ceramic tube.
The printed catalyst structures were first cut into shape with a scalpel (OD ~6.5 mm) and then calcined using the method shown in Figure 3. As shown by Matras et. al. [39] for this catalyst, a longer calcination period leads to a better stability of the catalyst, resulting in a more constant performance over a longer period of time. However, there is a trade-off since the calcination leads to a reduction of the catalyst’s specific surface area. Since this has a direct negative impact on the CH4 conversion and this loss is even more pronounced at elevated temperatures, the catalysts are not calcined at the reaction temperature but at 800 °C. The amount of catalyst used in the experiments was 0.6 g each. The structures were held in position in the reactor with quartz wool.
For preparation of the printed catalyst for testing, sample 1 was calcined directly in the reactor while the second sample was calcined in an external furnace according to Figure 3. Based on previous experiments with the powder catalyst in a FB or MFB reactor, the following gas flows were selected for the experiments:
  • CH4 = 96 cms3/min [standard cubic centimeter per minute]
  • O2 = 24 cms3/min
  • N2 = 96 or 120 cms3/min
  • CH4 to O2 to N2 ratio of 4:1:4 or 4:1:5
  • Gas hourly space velocity (GHSV): 4080 mLCH4 g−1Cat. h−1
The corresponding gas flows were adjusted according to the design of experiment; the reactor was heated to 840 °C with a 3 K/min ramp. The re-crushed structures were tested in the same way using the same amount of catalyst.
To ensure better reproducibility, the catalyst was discarded after each experiment and replaced by a new one.

2.3.2. Membrane Reactor

For the membrane reactor tests, 60 cm long porous Al2O3 tubes (Fraunhofer IKTS and Rauschert) with a pore diameter of dp = 100 nm and ID/OD = 7/10 mm were used. They were sealed with O-rings. A ceramic glaze was used to block most of the membrane, resulting in a 60 mm long permeable zone. The catalyst is present in powder form with a particle size of 250–400 µm. In the reactive zone, the catalyst is diluted 1:1 with inert SiC in the same grain size. The reactor is operated in dead end mode, so that all gases entering the shell side must leave through the membrane. For this reason and to reduce the amount of gas in the system, all free spaces were filled with SiC. The amount of catalyst used was 3 g per test. The catalyst temperature was controlled directly by means of a multipoint (18-point) WIKA thermocouple. To prevent contact of the reaction gases, the sensor is surrounded by a thin-walled Al2O3 tube. Figure S3 (Supplementary Materials) shows a schematic layout of the membrane reactor. The conditions were set to be comparable to those of the fixed bed reactor (FBR):
  • CH4 = 120 cms3/min
  • O2 = 30 cms3/min
  • N2 = 150 cms3/min
  • CH4 to O2 to N2 ratio of 4:1:5
  • Gas hourly space velocity (GHSV): 2400 mLCH4 g−1Cat. h−1
In addition, MFB tests also included experiments with up to 30% CO2 co-feed and increased dilution. Similar to the fixed bed reactor tests, the catalyst was discarded after each experiment and replaced with a new one.

3. Results and Discussion

3.1. Characterization Results

The authors have previously shown that there is a clear correlation between the thermal treatment and specific surface area on the one hand and the resulting activity of the catalyst on the other [39]. A higher specific surface area therefore generally leads to an increased CH4 conversion. The results of the N2 adsorption (Table 1) show that the powdered catalyst with a BET specific surface area of 38.4 m2/g has the highest specific surface area, as expected. The BET specific surface area of the 3D printed structures was 9.2 m2/g, about one order of magnitude lower, still almost an order of magnitude higher than the as-received pressed pellets supplied by Johnson Matthey. It is interesting to note that the pore diameter does not change during the printing process but decreases by a factor of 3 during pressing into pellets. The pressure loss is highest for powder and is two orders of magnitude lower for the structured catalysts.
The analysis of the adsorption isotherms as well as the BGH plots (Figures S6 and S7 in Supplementary Materials) show that all three catalyst configurations are mesoporous.
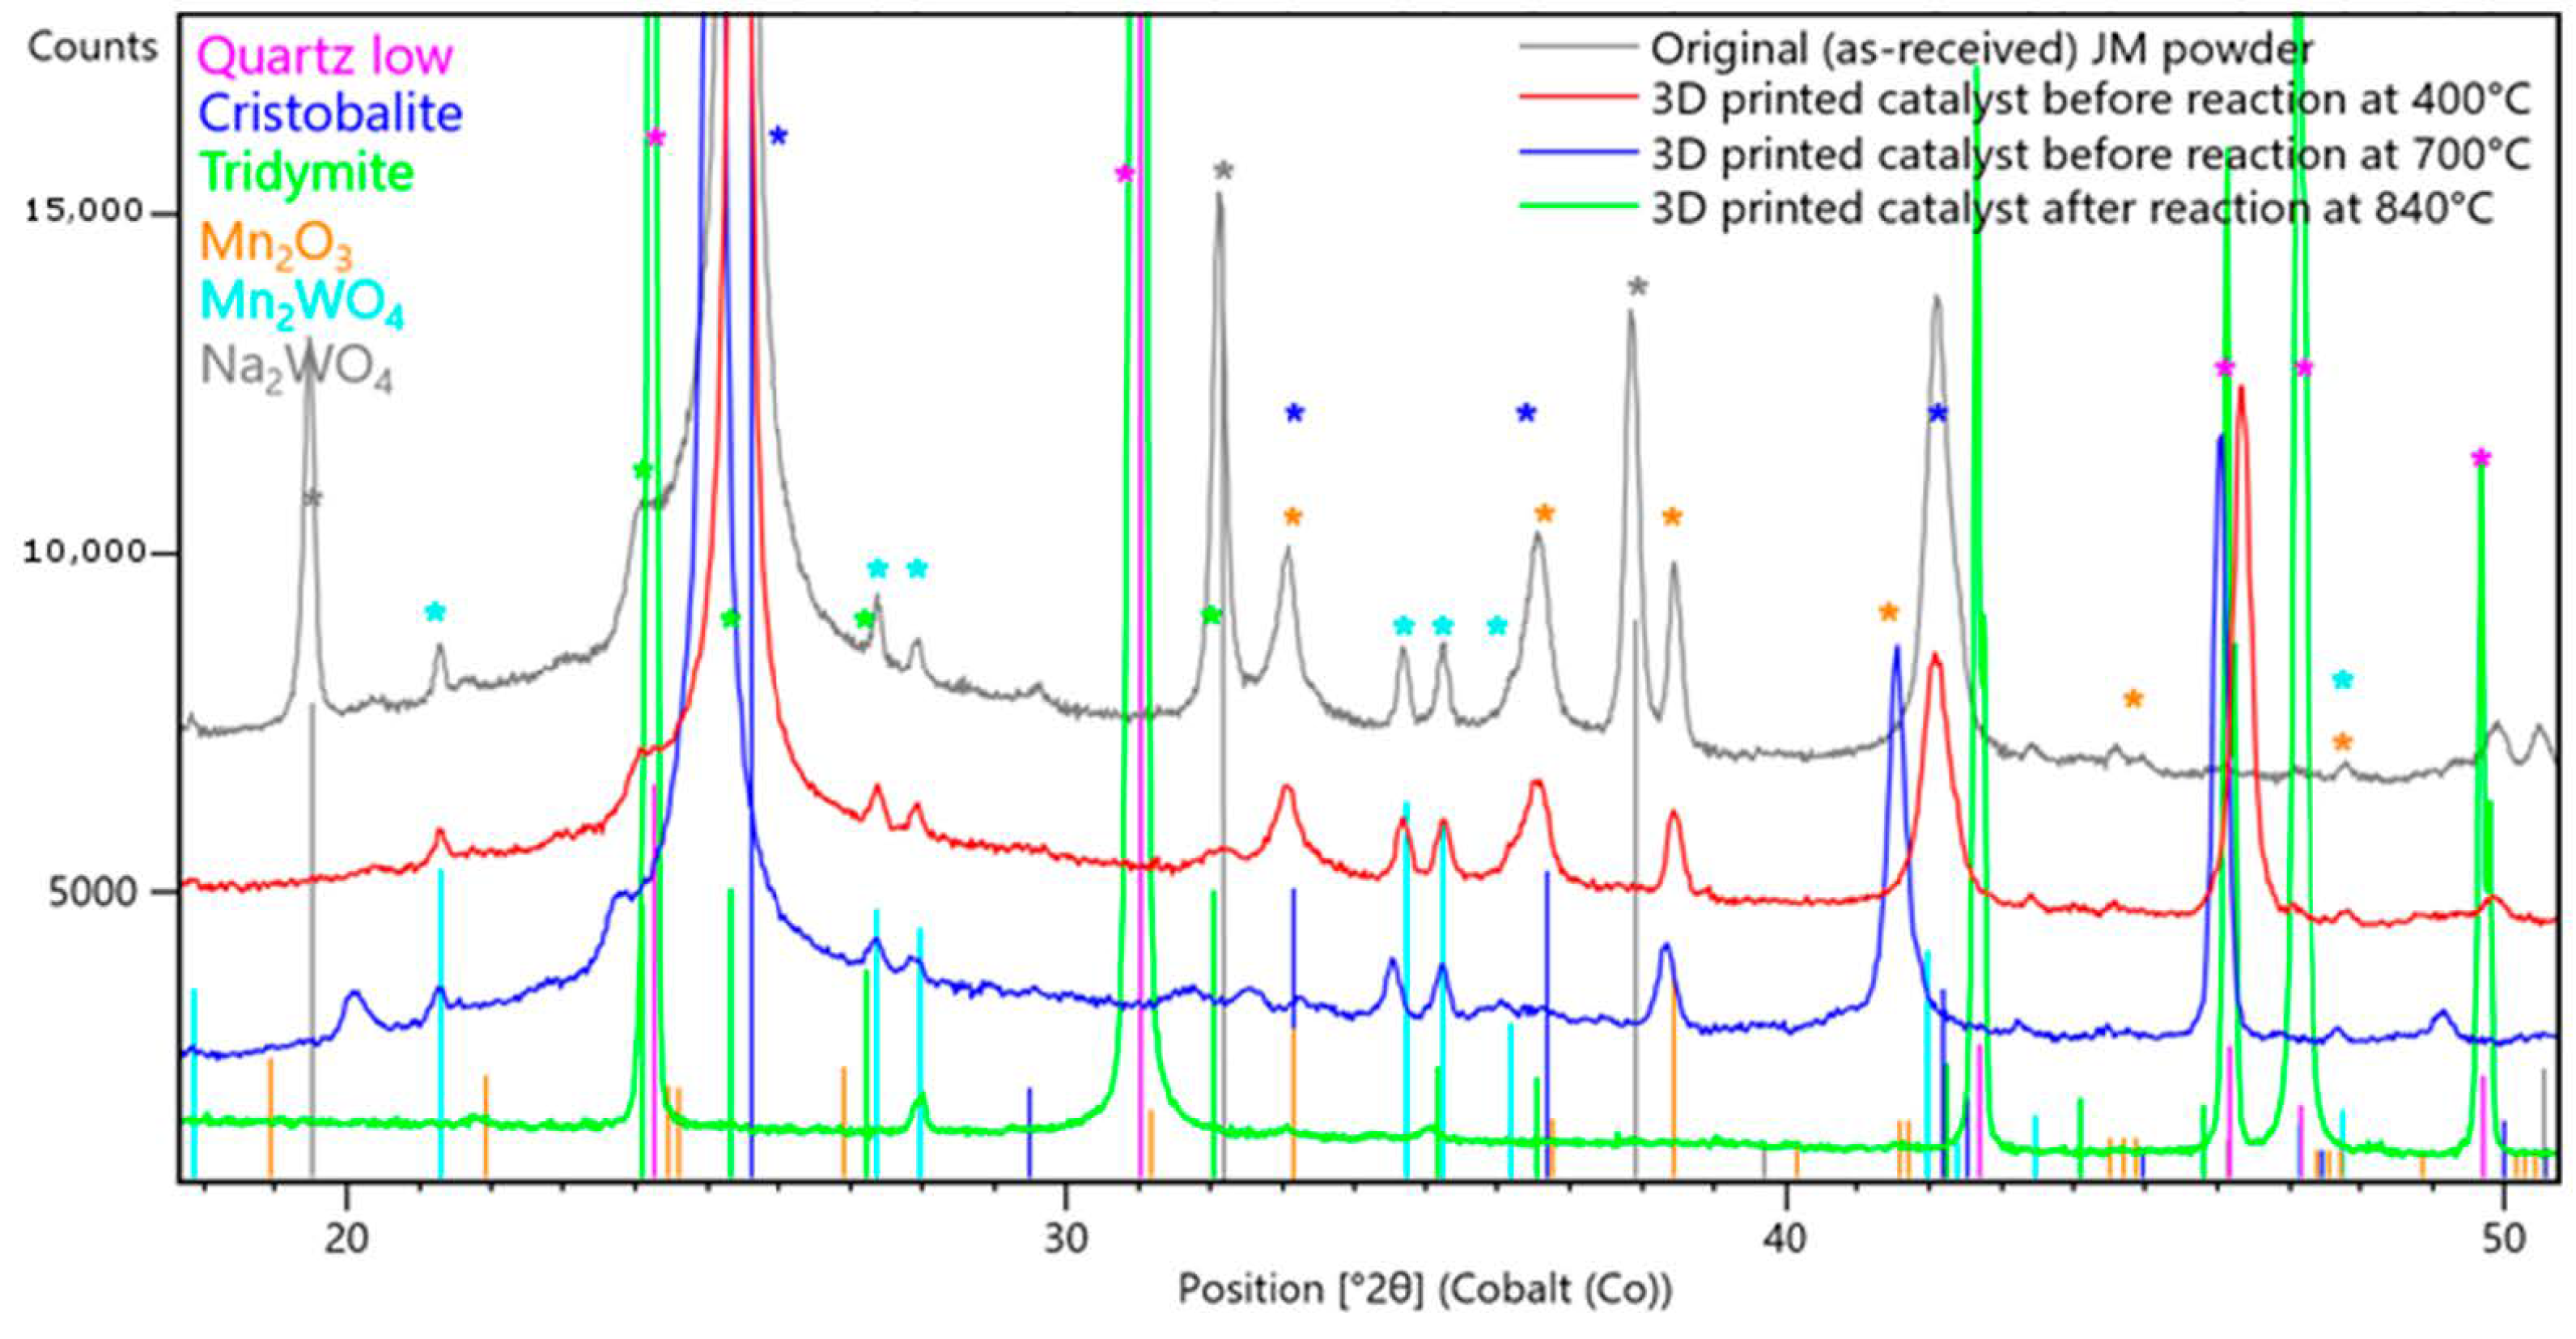
Ex-situ XRD measurements were performed on a representative 3D printed sample to confirm the phases present in the printed monoliths and compare them to the original starting powders. Figure 4 shows the XRD results for the 3D printed catalysts pre-treated at different calcination temperatures, at 400 and 700 °C, and after the reaction at 840 °C, compared to the original JM powder. Three silica crystalline phases were identified, Cristobalite, Tridymite and Quartz, as well as distinct oxide phases of the active catalyst’s material: Mn2O3, MnWO4, Mn2WO4, Mn3O4, Mn7SiO12 and Na2WO4. Figure S2 and Table S1 in the Supplementary Material provides a detailed overview of the phases identified, their space groups and lattice parameters at different temperatures.
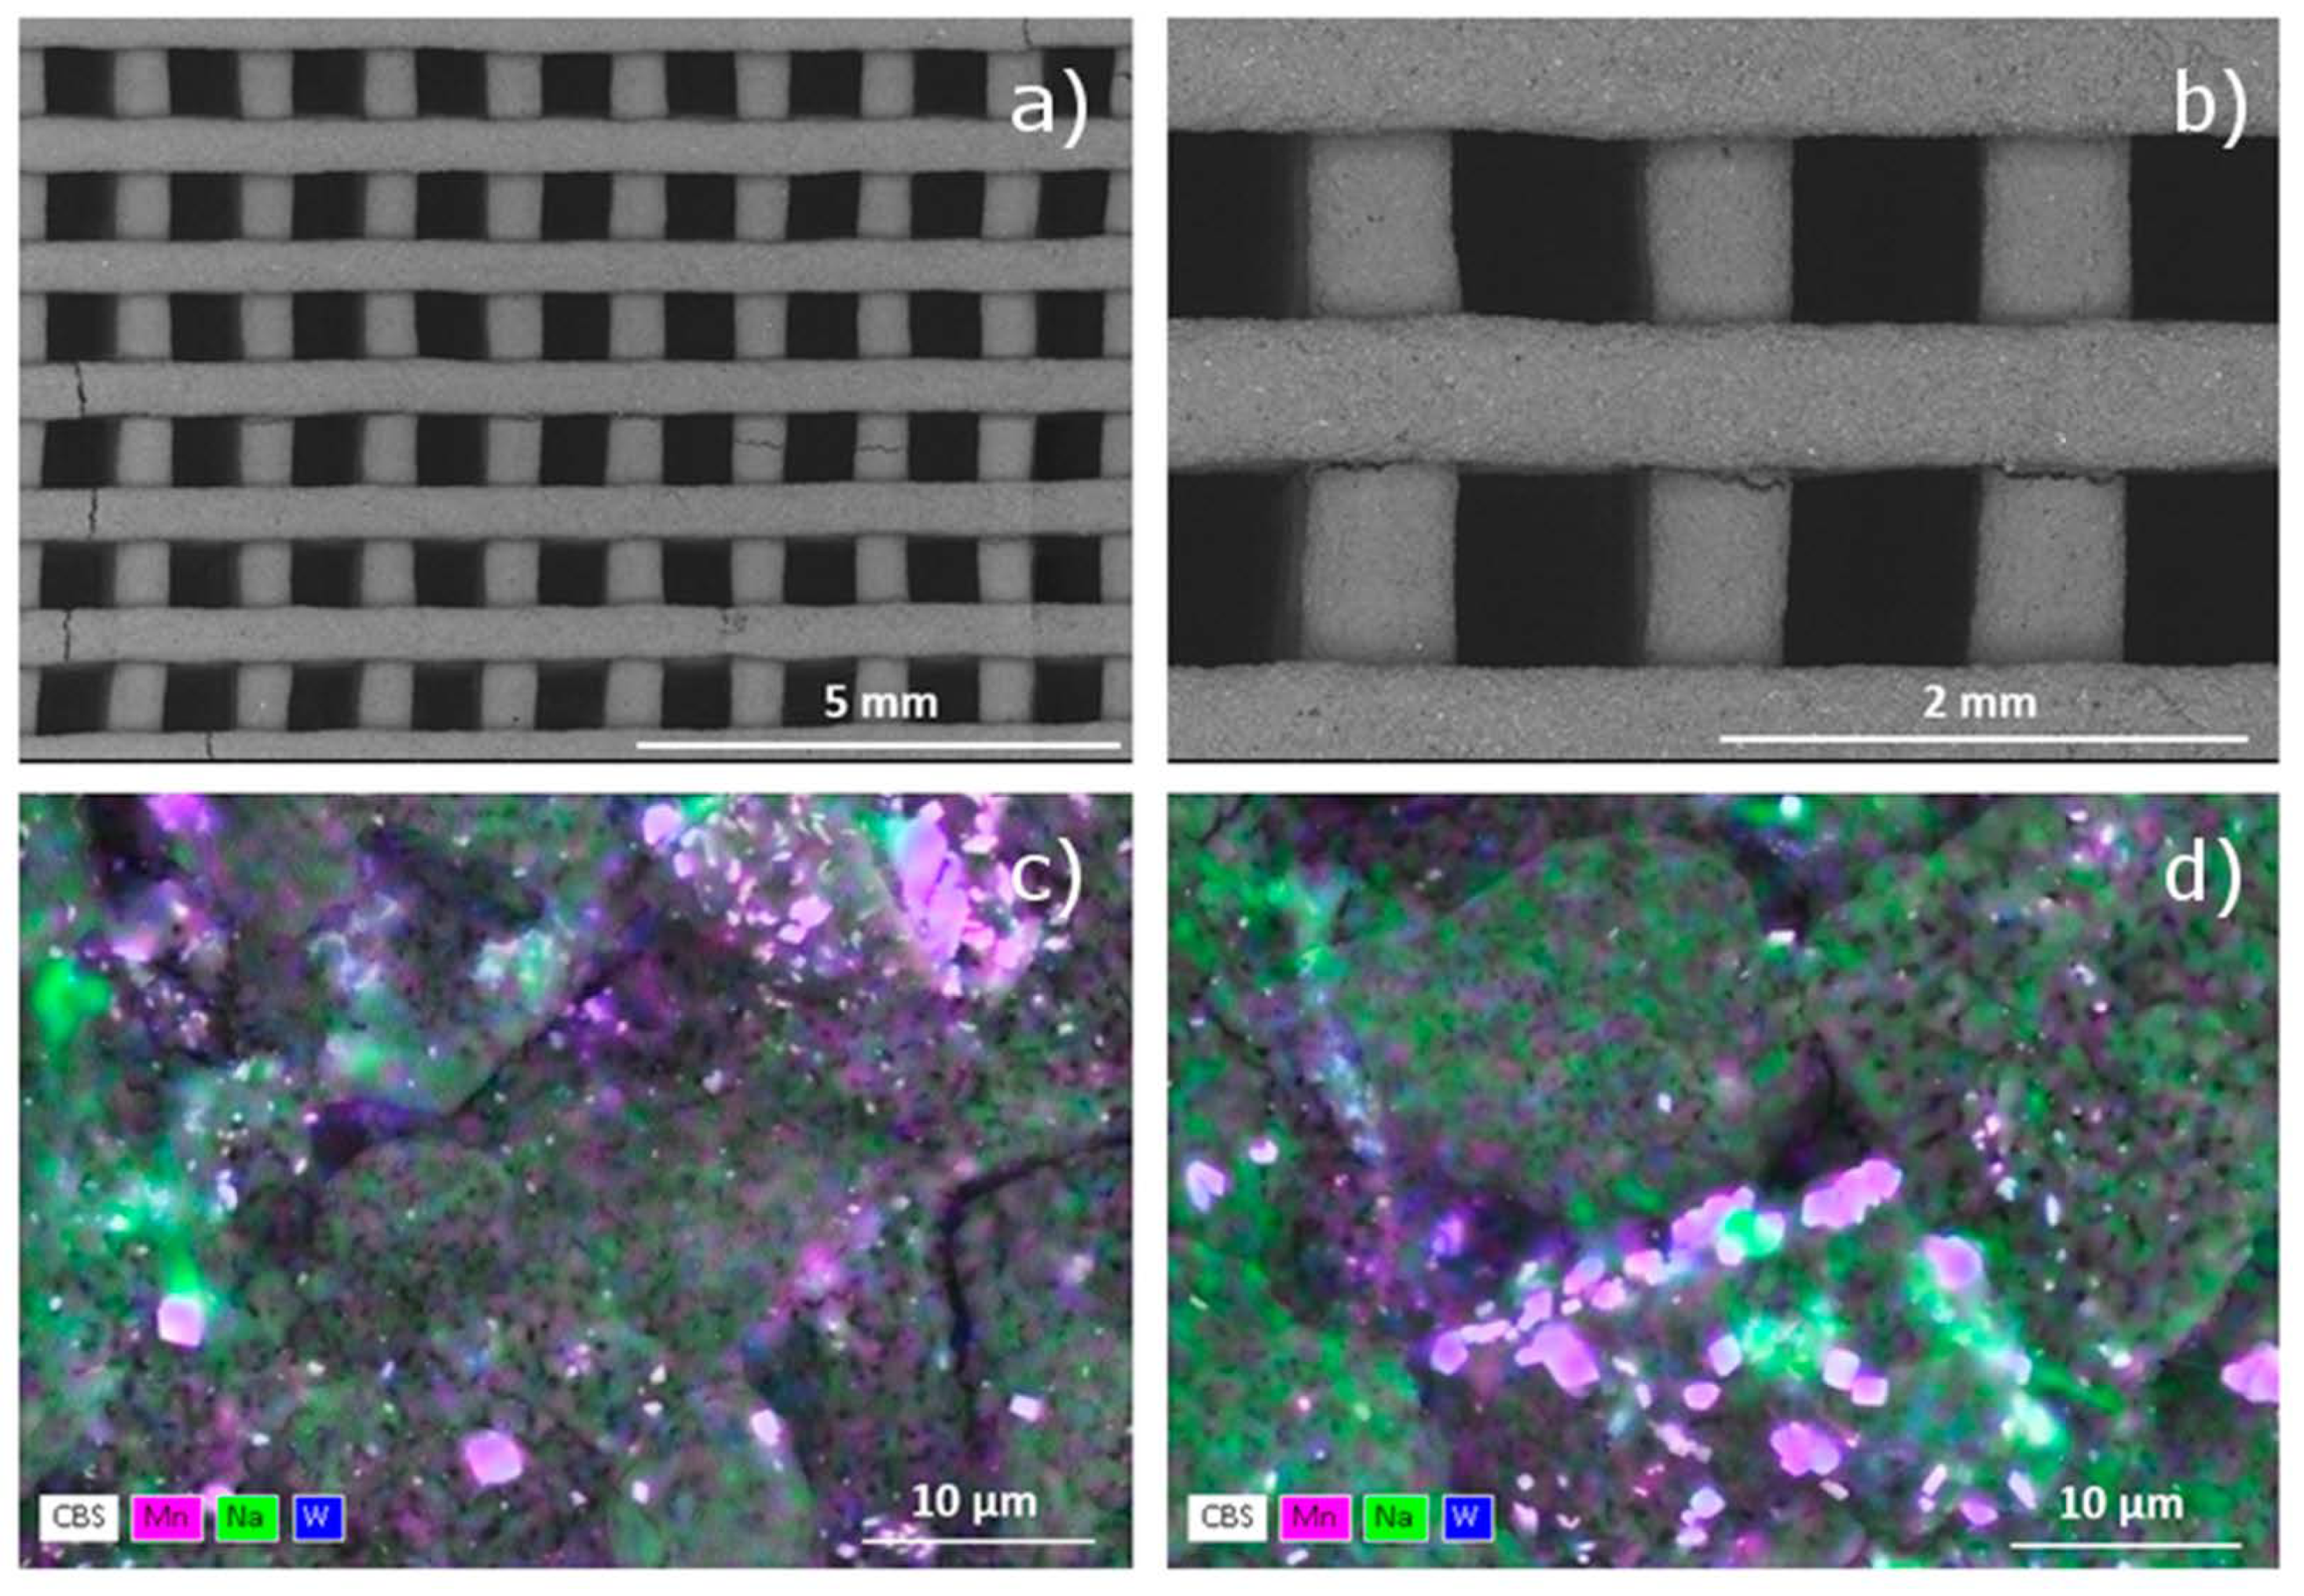
The morphology and microstructure of the 3D printed structure is shown in Figure 5. The EDS analysis reveals micron-size Mn grains that increased during the reaction and Na and W species that were co-located (see a comparison of WDS images before and after reaction shown in Figure S4 in the Supplementary Material).
Comparison of information from different positions in the 3D printed Mn–Na–W/SiO2 catalyst obtained by XRD-CT is presented in Figure 6 and Figure 7. The distribution maps of each detected phase are constructed from the integrated intensity of a corresponding diffraction peak in the individual XRD-CT patterns. The reconstructed 2D maps reveal both millimeter sized features of the printed catalyst body (channels and walls of the monolith) and the distribution of the micrometer sized Mn–Na–W active phases across the silica support. Figure 6 shows phase distribution maps for Mn2O3 detected both at room temperature and at 840 °C. MnWO4 has been recorded only at room temperature; it disappeared at 840 °C and did not reappear later during the measurement. Distribution maps for the other catalyst phases namely, MnWO4, Na2WO4 and Na6WO6 are presented in Figure S5 in the Supplementary Materials. Na2WO4 and Na6WO6 were only observed in crystalline form at room temperature during this experiment. Figure 7 shows the spatial variations in crystalline silica phases as a function of time under OCM operating conditions. It is both pre-reaction (preparation, thermal treatment) as well as reaction parameters that have influence on micro and macro distribution along the monolith.
The XRD-CT maps reveal that the catalyst is evenly distributed across the 3D printed structure. This is also further evidenced in the SEM images showing that the catalyst particles are well dispersed across the silica support. The phases presented in the XRD-CT data are in agreement with the ex situ XRD data (Figure S2 and Figure 4). Among the identified phases, MnWO4 disappears under OCM and does not reappear after the reaction. Na2WO4 and Na6WO6 are only present at room temperature (the latter at lower weight percentage).
The dominant Mn2O3 phase is present across all three scanned positions at 840 °C under reaction conditions. It should be noted that the intensity of the Mn2O3 reflections increased during the reaction compared to that at room temperature before the reaction. The lower amount of the Mn2O3 phase observed at 950 °C suggests that the catalyst is susceptible to higher temperatures and reducing conditions. Mn2O3 can be fully recovered (re-oxidized) to its original stoichiometry at room temperature.
Deposits of mainly Silica, Na and traces of Mn and W phases were observed along the inner wall of the alumina tube of the MFB reactor (Figure 8). Tungsten mobility and enhanced interaction between the volatile W and Mn species and silica support on the membrane walls have previously been observed in catalytic membrane reactors (MFB reactors using MgO and Ba-based perovskite tubes) by the authors (see Vamvakeros et al., Matras et al. and Supplementary Material). It was suggested that the appropriate calcination protocol is crucial in ensuring the way active catalyst species and silica support interact and the catalyst as a whole remains stable at elevated temperatures during the OCM reaction.

3.2. Catalytic Testing

The boundary conditions for the tests were two aspects in particular. Firstly, the reaction conditions of the in-situ experiments needed to be reproduced as accurately as possible to ensure comparability and repeatability. Secondly, the performance needed to be monitored over a certain amount of time to facilitate a comparison with the findings of the XRD analysis. The main aim of the reactor testing at both FB and MFB reactor scale was to establish the optimal process approach. The experiments with the FB of printed monoliths were based on the in-situ experiments and the knowledge of the optimal set of parameters of the MFB experiments.
The reaction indicators CH4 conversion (X_CH4), C2 selectivity (S_C2) and C2 yield (Y_C2) are calculated according to the following equations:
(1)
C o n v e r s i o n C H 4 = 1 n C H 4 , o u t n C H 4 , i n
(2)
S e l e c t i v i t y C 2 = 2 n C 2 H 4 , o u t + 2 n C 2 H 6 , o u t n C O 2 , o u t + n C O , o u t + 2 n C 2 H 4 , o u t + 2 n C 2 H 6 , o u t
(3)
Y i e l d = C o n v e r s i o n   × S e l e c t i v i t y
Fixed Bed:
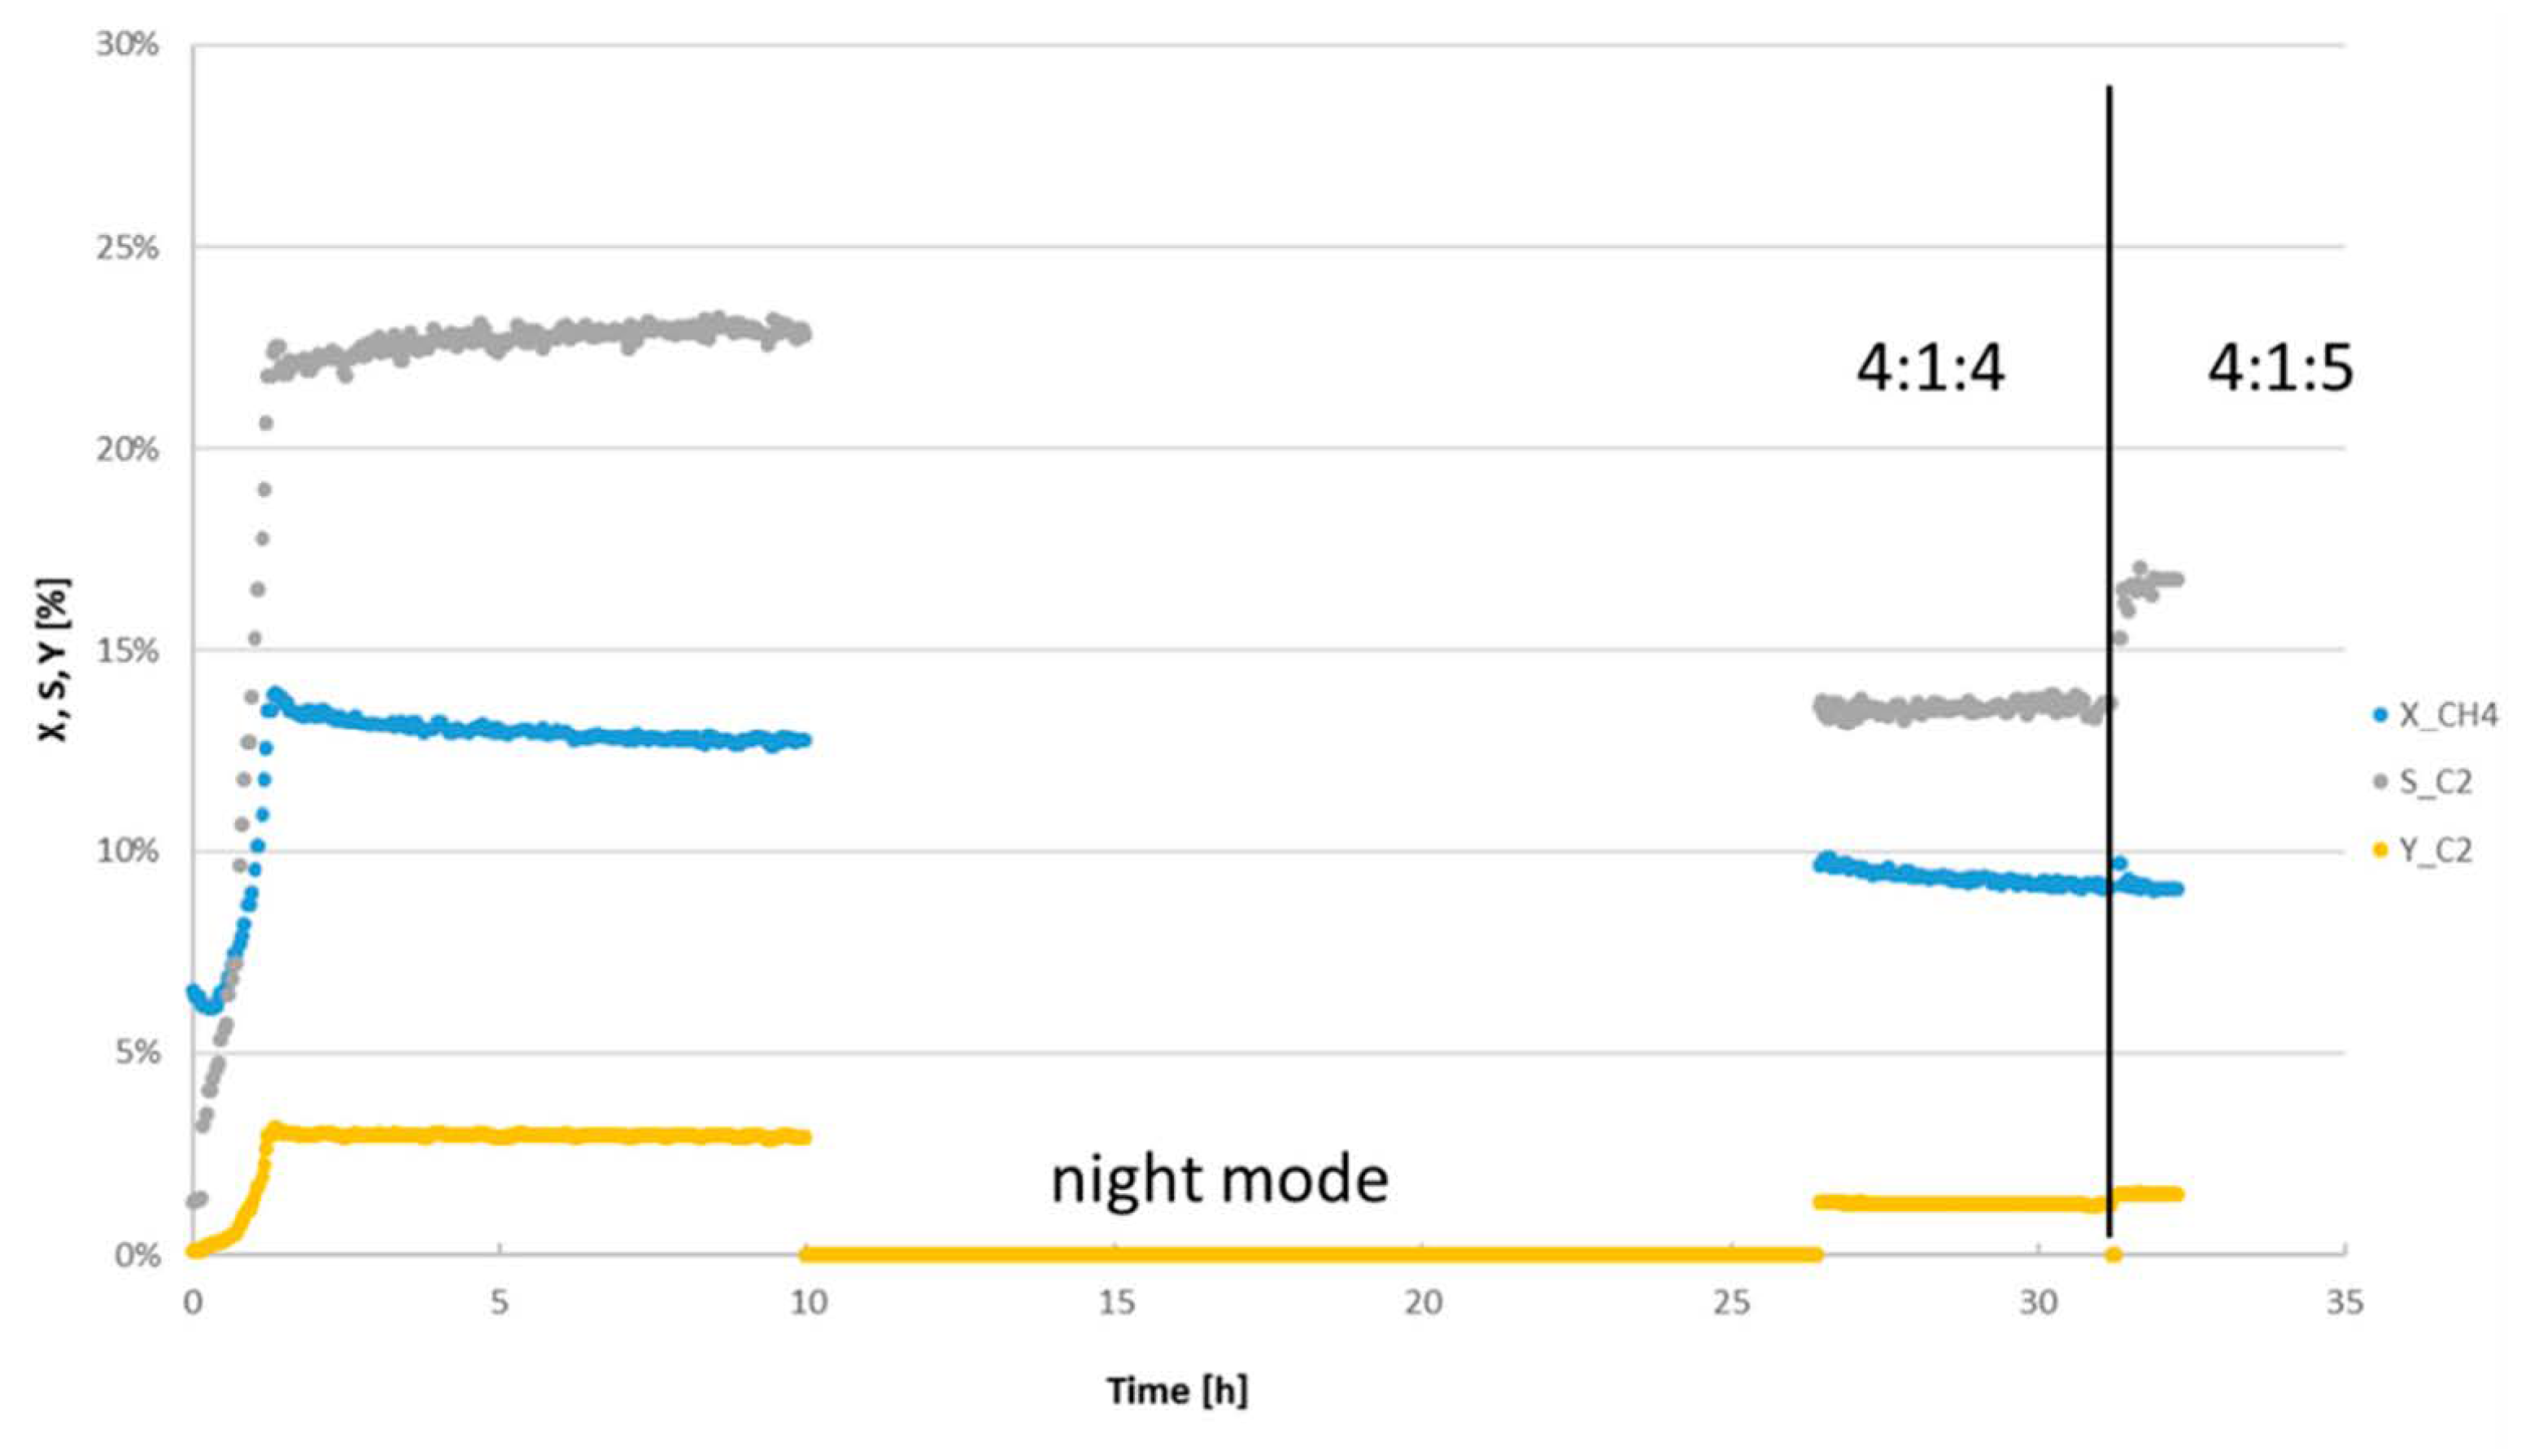
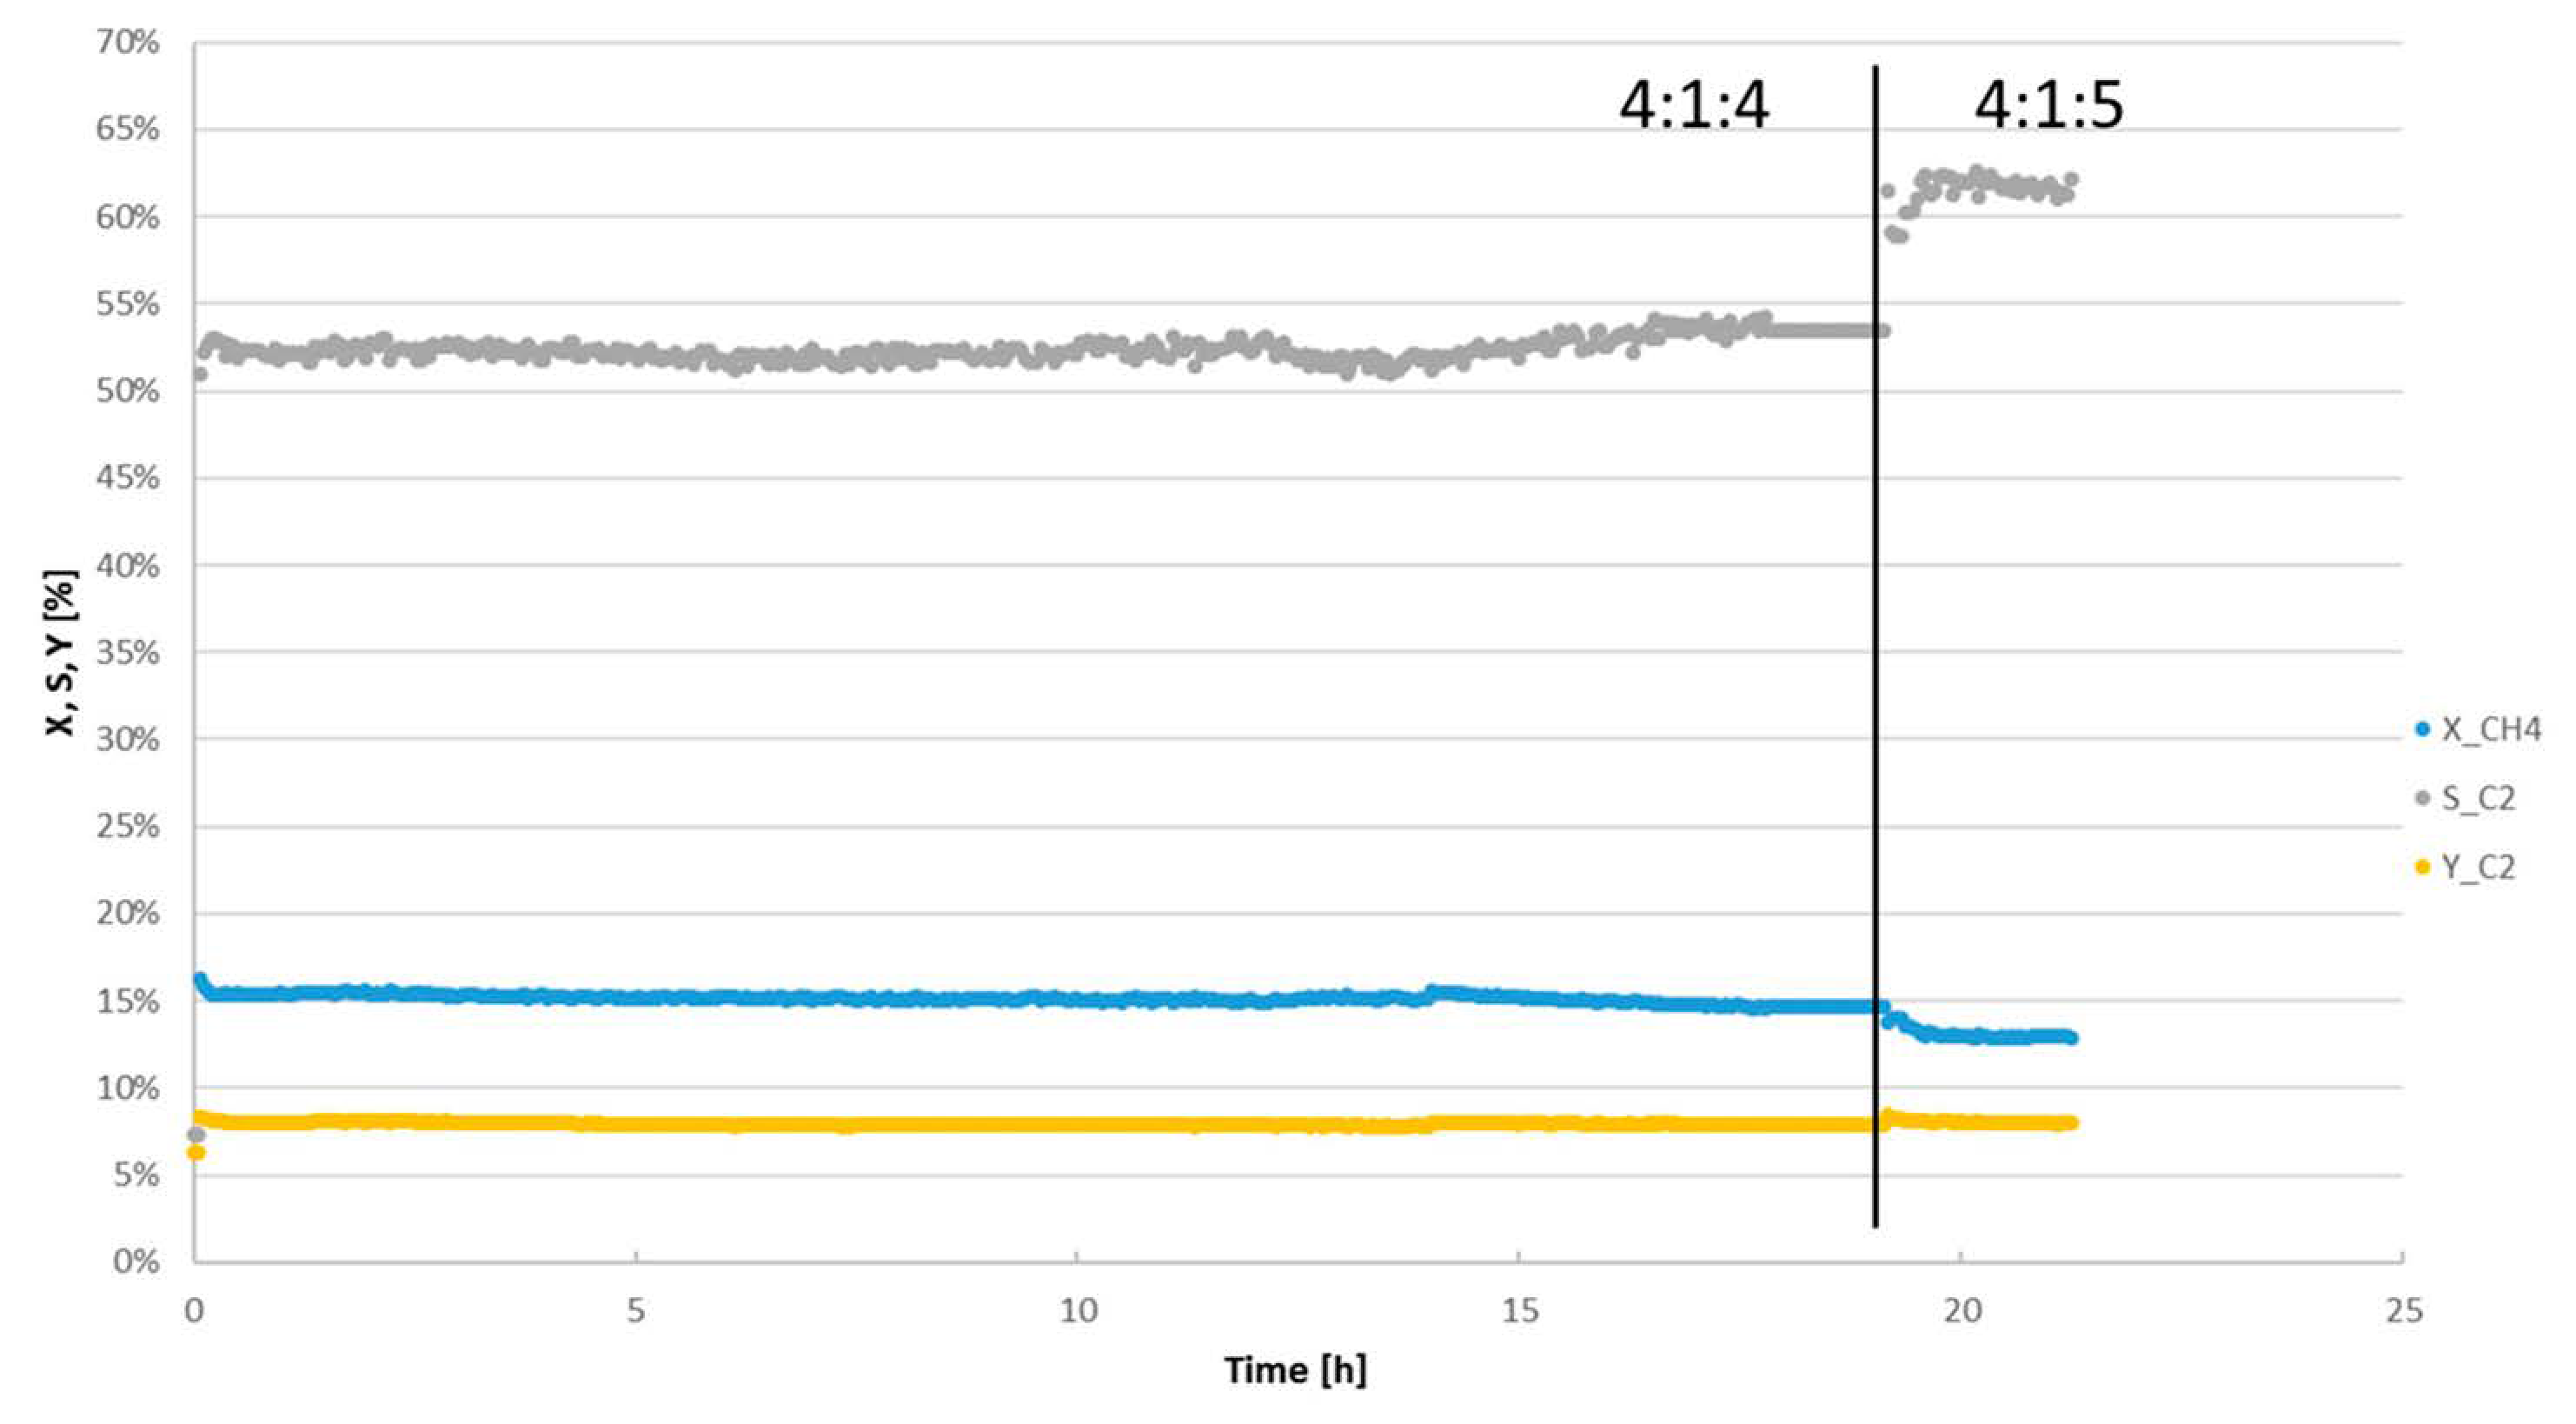
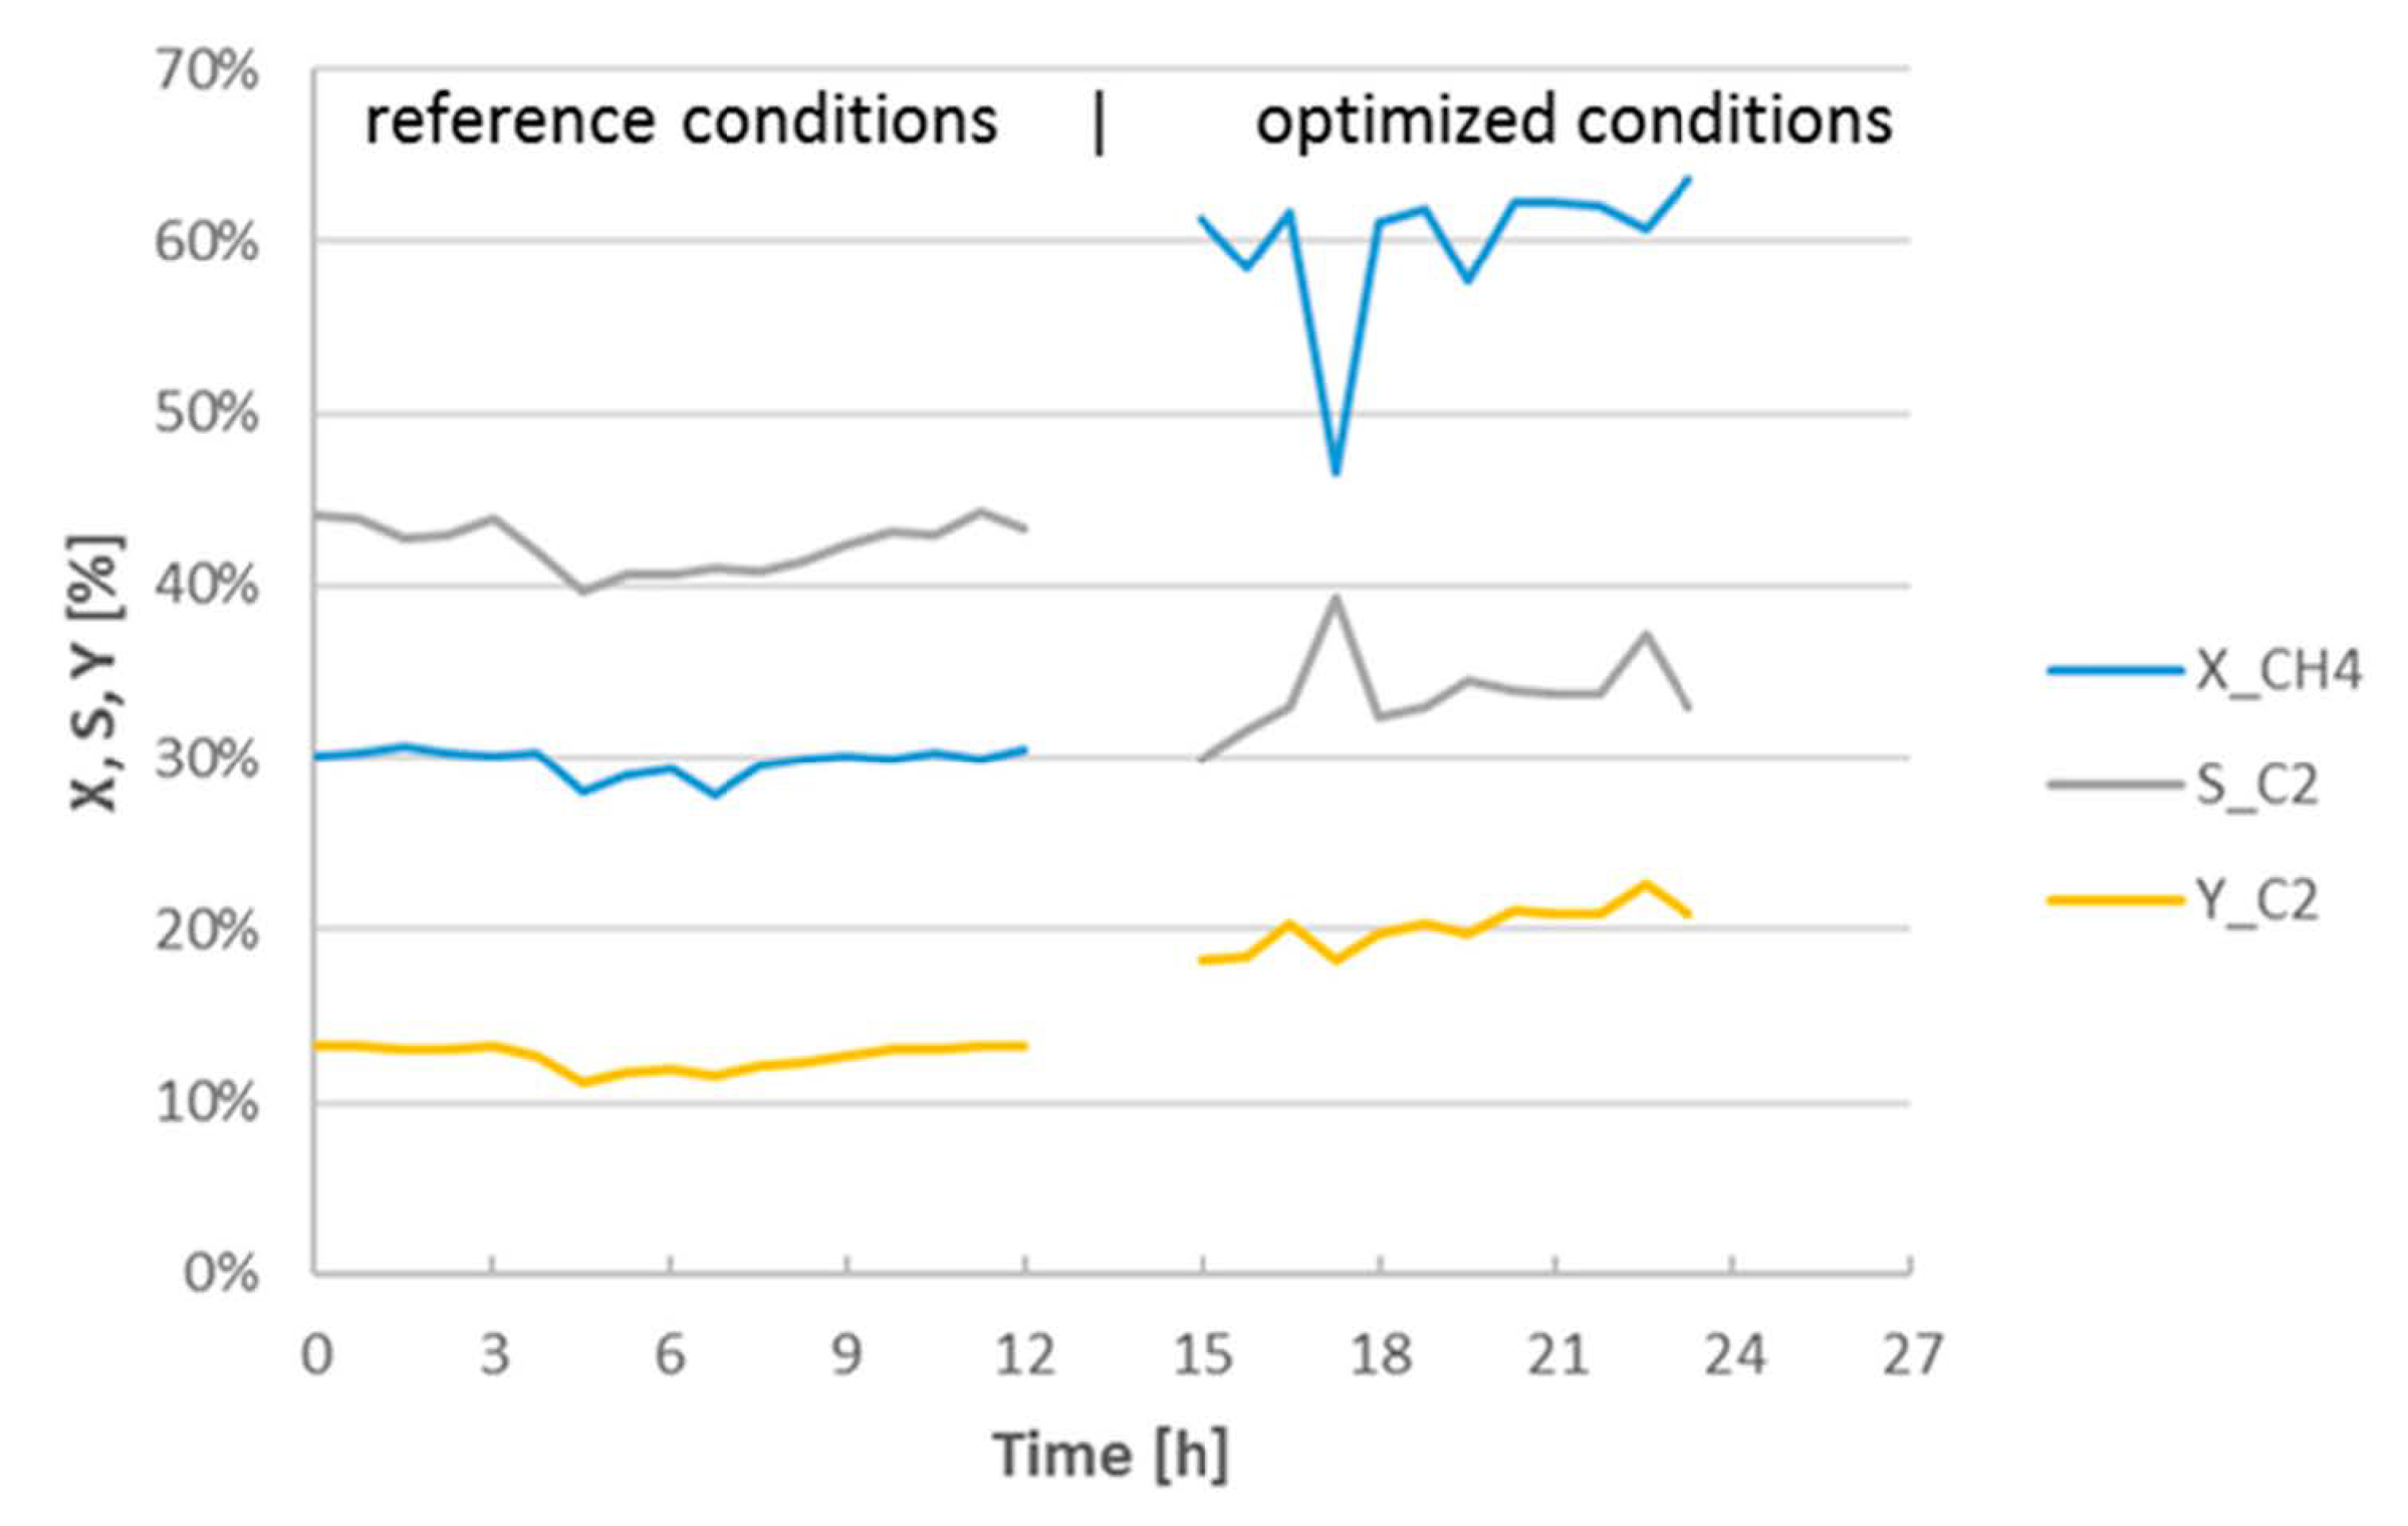
The experiments with the structured catalysts were carried out for 15 and 21 h stream time at 840 °C (Figure 9 and Figure 10).
The experiment (Figure 9) was carried out for several hours. After that the reaction was stopped, the reactor was kept at 650 °C overnight with air flow and then restarted the next day. At the end of the experiment, the ratio of reactants was set to 4:1:5 for matching with the MFB tests. As can be seen, the methane conversion decreases slightly over time with a steeper drop at the very beginning. The selectivity slightly increases during the experiment, while the yield remains mostly unchanged. This small but fast decrease in a relatively short period of time is unusual and probably due to insufficient calcination time. Furthermore, it can be seen that the higher dilution has a significant influence on the selectivity, so that the C2 yield increases slightly.
It should be noted that the catalyst performs significantly worse after the night mode. Since this effect could not be observed in previous experiments with the catalyst, it can be assumed that the prolonged calcination had an impact on its performance. Another test was therefore performed with a second batch of the 3D printed catalyst with an improvement in the calcination conditions and without the night-time setback.
In the second attempt (Figure 10) the previously observed drop in performance does not occur and the catalyst keeps its conversion constant over the approximately 24 h test period, which is in line with results from literature. However, there is still the short steep drop in conversion in the beginning, which could be associated with the observed loss of MnWO4 in the XRD scans. In general, conversion, selectivity and yield are clearly higher than those of the first test and within the expected range [17]. It should be noted that the results fell short of reported results for Mn–Na–W/SiO catalysts, especially with regard to the conversion. Previous tests with the JM powder also showed significantly better results, with around 18% yield. The second experiment, however, resulted in the improved stability of the catalyst for the duration of the 20 h stream time. The results are in line with the findings of Matras et al. [39,40] who also observed a more stable behavior for the same catalyst after a prolonged calcination period. The increased dilution at the end of the run does increase selectivity, as well as yield.
To establish whether the lower performance was caused by the printing, the structures were re-crushed after printing and tested under the same conditions as those for the monoliths. There it could be seen that the performance of the crushed catalyst, when operated as a regular packed bed, does not differ significantly from that of the structures. However, it must be noted that due to the higher pressure drop and associated reduced dissipation of reaction heat in the scale up, the influence should increase with increasing catalyst mass. Thus, with all other parameters remaining constant, the structures would improve.
Comparative experiments with other catalyst recipes (SBA15, sol-gel based formulations) showed that the binder which was used had non-selective properties. Experiments with manganese tungstate catalysts without binder showed selectivity in the same range as the untreated powder and the printed structures from these catalysts showed a selectivity of 42% with a conversion of over 30%.
Studies on porous MgO tubes from RHP and the catalyst from JM showed formation of magnesium silicate on the wall of the MgO tubes and tungsten imbedding as a sublayer in the form of magnesium tungstate.
Membrane Fixed Bed:
Figure 11 shows the results of the membrane fixed bed (MFB) experiments. It can be seen that under the same conditions, the membrane reactor with slightly lower selectivity has much higher conversion and therefore also increased C2 conversion. The processes fluctuate more than the FB but remain largely stable over a longer period of time. A selectivity of 43.4% was achieved at 30% conversion and maintained over 12 h.
The second curve describes the optimized operating conditions at which the highest C2 yield was achieved. In addition to the higher dilution, the CH4:O2 ratio was also lowered and 30% CO2 was added as inert gas. A C2 yield of 22.6% with a selectivity of 37.2% and a CH4 conversion of 60.8% was achieved. The trans-membrane pressure difference resulted in 2.8 bar.
When working with porous membranes, the pressure is one of the most important variables influencing the reactor operation, since the specific pressure drop through the catalytic bed is quite high. At high GHSV the pressure difference between the reaction side and the air feeding side can shift so much that (a) most of the air flows into the reaction side only at the very end of the permeable zone, and (b) even back permeation into the air feeding side can occur. For this reason, the pressure drop should be kept as low as possible, which could be achieved especially in larger plants with monolithic catalysts.
The higher dilution in the second optimized experiment provides higher pressure in the air feeding side, leading to better, more uniform O2 dosing, so that a lower CH4:O2 ratio can be operated. It also prevents back permeation. However, this effect generates an overall higher operating pressure (4.5 bar(a)), which, in turn, has a negative effect on the selectivity of the membrane reactor. In addition, the CO2 provides a slight reduction in side-reactions.
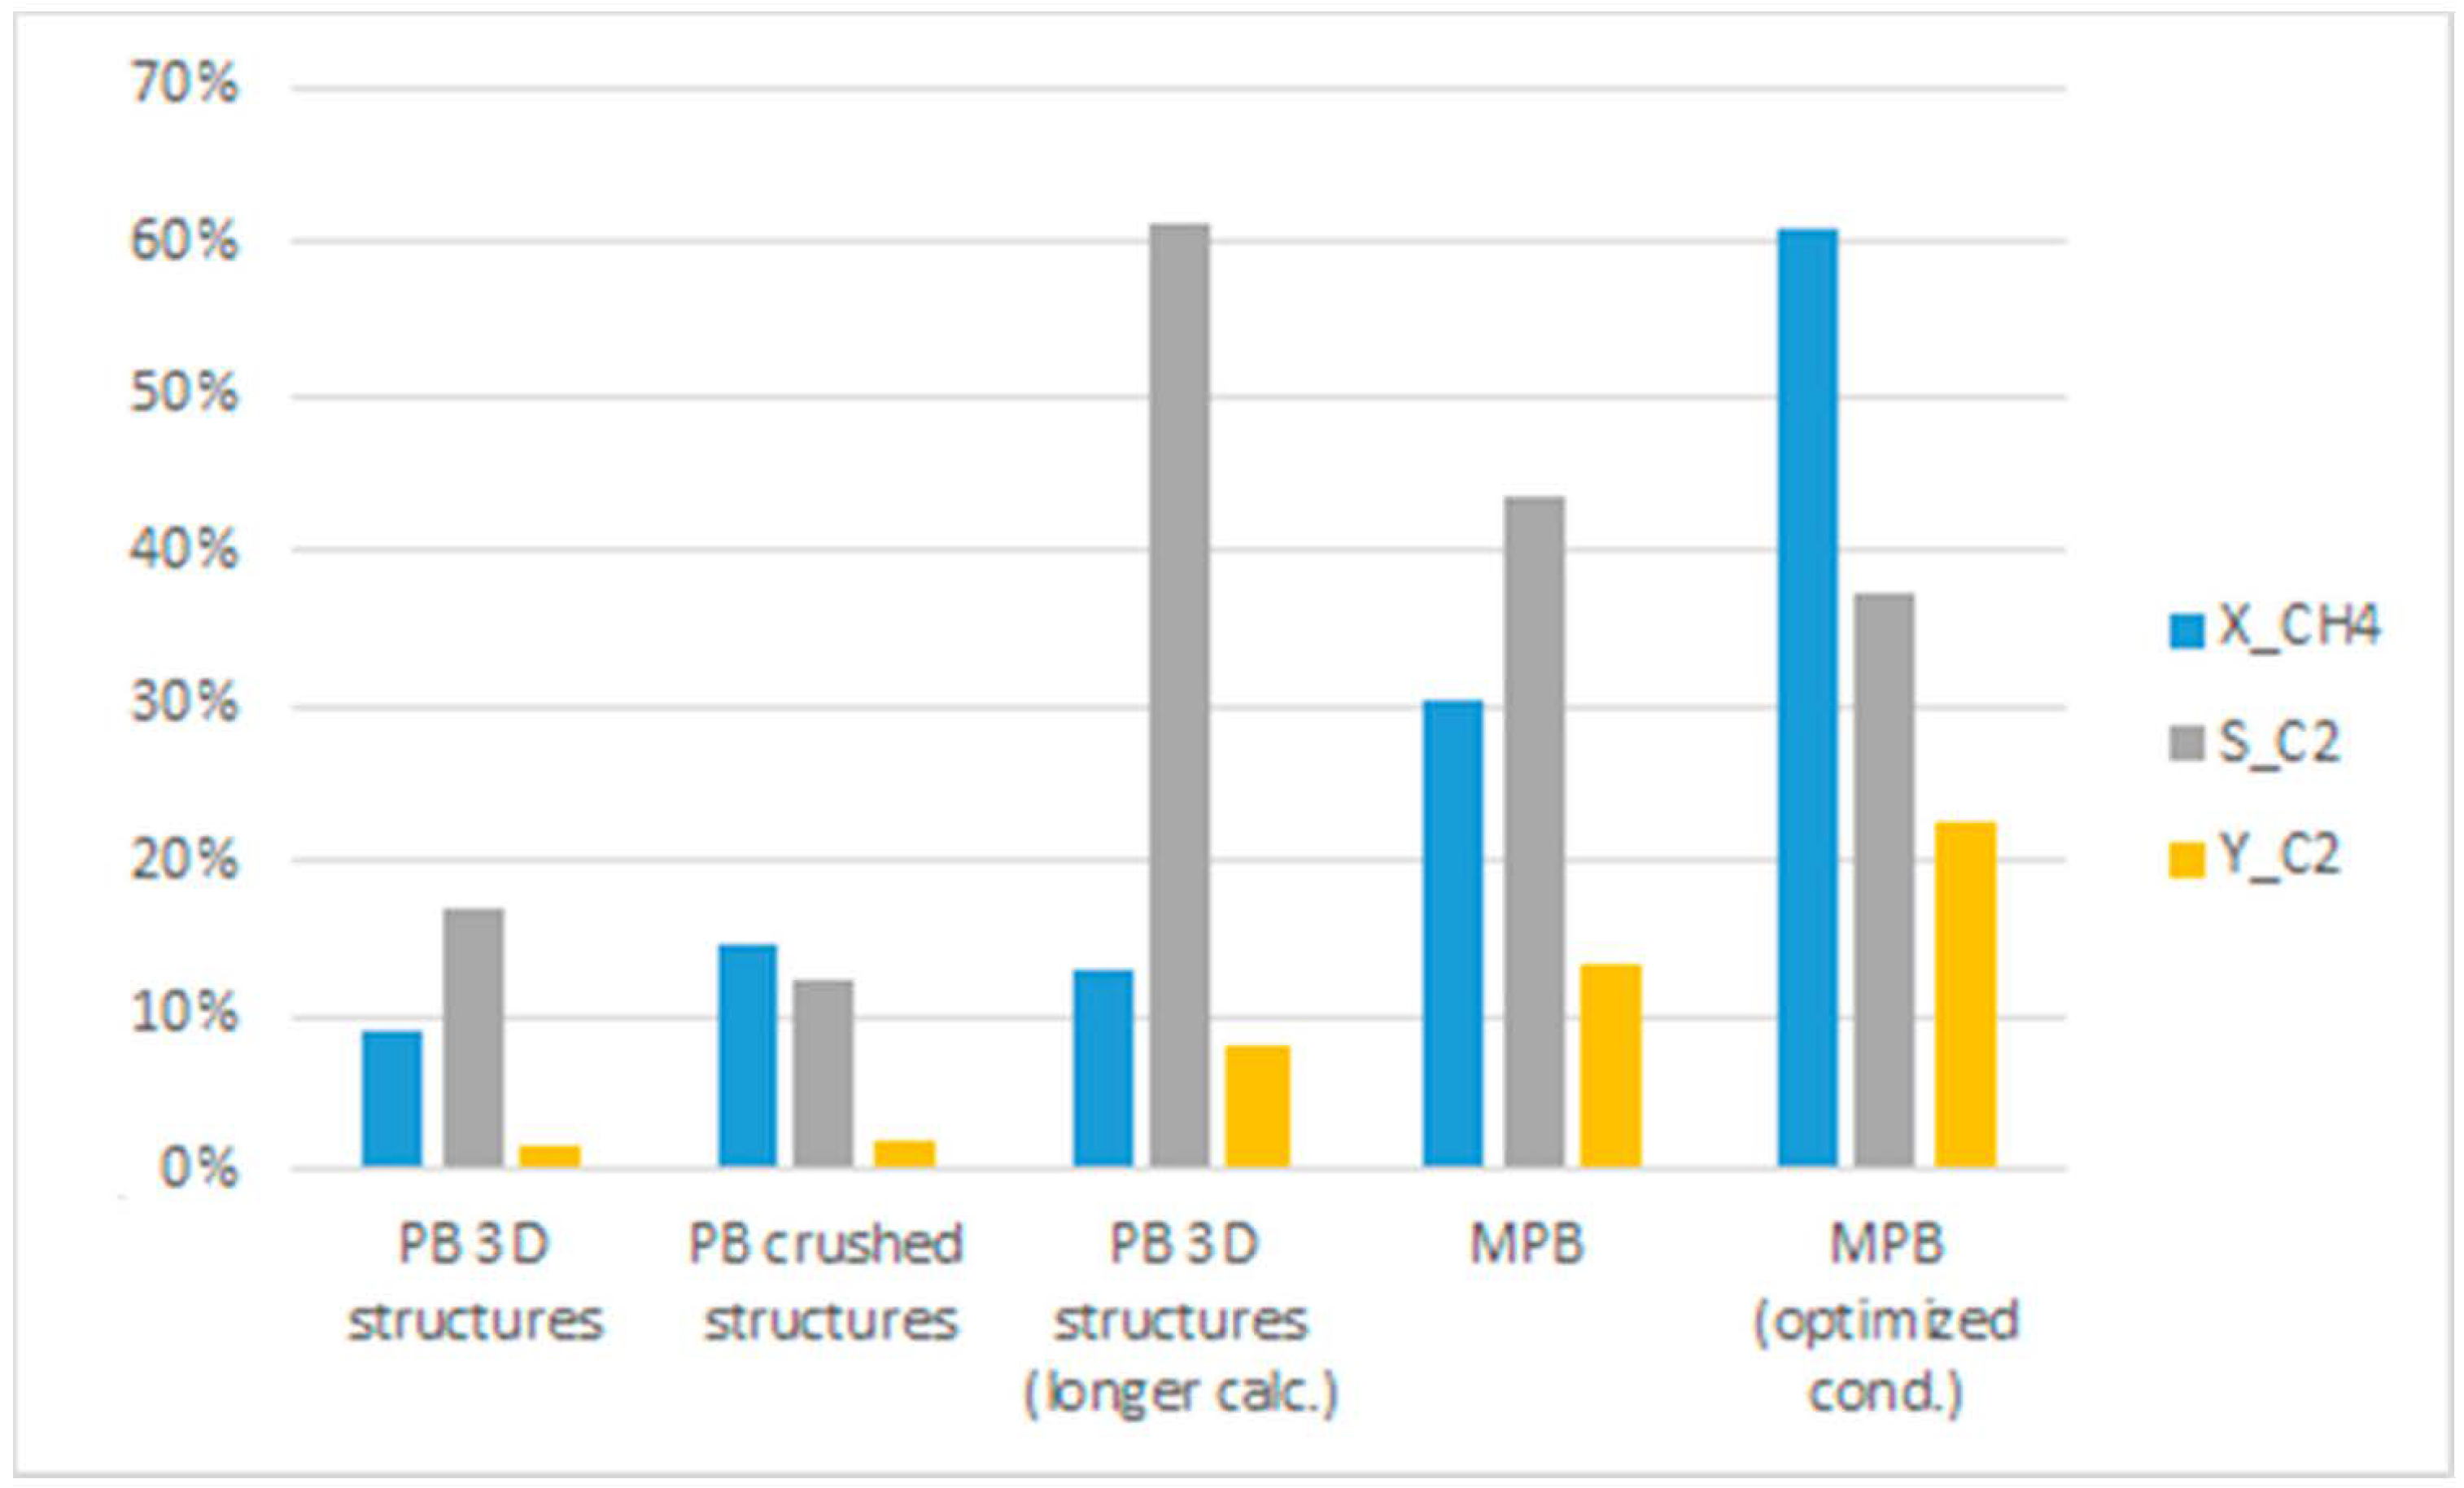
Figure 12 shows a summary of the performance of the Mn–Na–W/SiO2 catalyst under OCM conditions for each of the reactor configurations under study in this work: 3D printed monoliths (PB), its fixed-bed analogue (packed bed of crushed 3D printed monoliths), and the MFB reactor (powdered catalyst). All Experiments were run with the same CH4:O2:N2 ratio and nearly the same GHSV in the TUB’s miniplant setup.
As can be seen here, monolith catalysts can achieve selectivities of over 60% when properly calcined. Experiments and characterization tests also confirm the stability of the catalysts under reaction conditions up to a temperature of 850 °C. Taking into account that the binder used for printing probably has a negative influence on the selectivity, even higher values can be expected which should be further investigated in future work. The literature data confirm that this type of catalyst can achieve up to 90% selectivity [34]. In general, the catalyst used here shows reasonable and good results. In particular, due to the very low pressure drop and the high possible flow rates, the catalyst is promising with regard to the very important heat management.
In addition, it can be seen that the use of (porous) membrane reactors can achieve higher yields under almost the same conditions. As already mentioned, a high feed rate ensures better dosing, but also increases the process pressure, which has a counterproductive effect. The use of printed monoliths could tackle this issue and decouple throughput and pressure loss which might lead to better results.

4. Conclusions

This work showcases key advances in innovative reactor design for OCM reactions under a selected set of conditions. Experimental comparisons were made between 3D printed Mn–Na–W/SiO2 catalyst, its packed analogues and a membrane fixed bed reactor, each of which were co-fed a flow of CH4 and O2 at a constant ratio, with other experimental conditions maintained as similar as possible. A final experiment was conducted under an optimized set of conditions showing improved performance in terms of conversion and yield.
Multi-length scale XRD-CT and complementary SEM/EDS/WDS techniques have been employed to directly compare the morphology and variation of the active catalyst components, before, during and after the reaction. In addition, XRD-CT served to probe and image the working 3D printed catalyst system during more than 5 h of operation under the OCM reaction conditions. The study has given new insight into the variation of the catalyst active phases across the support as a function of time and position within the 3D printed catalytic body. This allowed for a better understanding of the structure-activity relationships and of whether the silica support and Mn species exert an effect on the catalyst behavior under operating conditions. More specifically, both the three crystalline silica phases and the Mn species remained present in their oxidized Mn2O3 form in the working 3D printed catalyst throughout the OCM reaction, while no presence of other species, containing Na and W, was observed. In contrast, Mn2+, Na+ and WO42− to a lesser extent were found to have formed a thin layer on the inner alumina membrane wall in the MFB reactor, as was previously reported by the authors for the same MnNaW-SiO2 catalyst in a Ba-based membrane reactor. This suggested that in the presence of CH4, the catalytic membrane reactor does not contain the crystalline Mn2O3 phase (Mn2O3 loses its long-range order) while the Na+ and WO4 migrated and interacted with the membrane wall.
In addition to the variation in the distribution of phases across the catalyst bed, the MFB reactor showed a highly significant increase in performance compared to the FB reactor (3D printed catalyst bed).
At the lab (millimeter) reactor scale, the 3D printed catalyst exhibited very similar performance to its crushed, packed bed analogue except for a 40% increase in conversion with higher selectivity and very minor increase in yield. However, it should be noted that a significantly lower pressure drop remains one of the key advantages of the 3D printed catalytic reactor monoliths.
When working with porous membranes, the pressure presents one of the most important variables; the pressure drop through the packed catalytic bed is quite high. As a result, at high GHSV, the pressure difference between the reaction side and the air feeding side can dramatically vary so that the air feeding into the reaction side only at the very end of the permeable zone, instead of distributivity across the packed bed, and even back permeates into the air feeding side.
In this respect, there is scope for further work to be carried out, in particular at the larger plant scale, where the pressure drop should be kept as low as the geometrically regular 3D printed catalysts allow with membranes employed for a distributive oxygen feed at tuned CH4/O2 feed ratios. Preliminary design recommendations are provided in Figure S8 in the Supplementary Material.

Supplementary Materials

The following are available online at https://www.mdpi.com/2073-4344/11/3/290/s1. Figure S1: Schematic illustration of TUB miniplant experimental setup for Fixed Bed Reactor (top) and Membrane Fixed Bed Reactor (bottom). Figure S2: XRD patterns and identified phases during a temperature ramp from 400 °C to 900 °C and back at room temperature. The insert shows a zoomed in region of 2θ of 20–40° with the identified reflections with no pattern changes with temperature at 400 °C and 500 °C. Figure S3: Optical images of a cross section of a 3D printed Mn-Na-W/SiO2 catalyst embedded in epoxy resin. The blue rectangle indicates a region of interest presented in greater detail in Figure S6. Figure S4: WDS images of 3D printed Mn-Na-W/SiO2 catalyst before (top row) and after (bottom row) reaction showing elemental distribution and porosity as an effect of the exposure of the structure to the reaction conditions. Note that the catalyst material and pores are evenly distributed inside the structure. Figure S5: Phase distribution maps showing the evolution of each Mn- and Na-W oxide phase recorded across the silica support at three separate positions within the 3D printed sample. Mn2O3 was detected both at room temperature and at 840 °C. MnWO4 was recorded only at room temperature and did not reappear later during the measurement. Na2WO4 and Na6WO6 can be only observed in crystalline form at room temperature during this experiment. The temperature dependent XRD measurements presented in Table S1 were performed on a PANalytical Empyrean, 60 kV with PIXcel3D. Figure S6: N2 adsorption-desorption isotherms for powder, 3D printed and pelletized Mn-Na-W-O/SiO2 samples. Figure S7: Pore diameter plots showing mesopore size distributions for the powder and 3D printed Mn-Na-W-O/SiO2 samples. Figure S8: Scope for future work: from current fixed bed incarnations to catalytic membrane reactors comprising 3D printed monoliths and porous alumina membrane for O2 distributive feed for a scaled up reactor design. Table S1: Summary of XRD results and identified phases during a temperature ramp from room temperature/400 °C to 1000 °C and back at room temperature. The table includes respective space groups and lattice parameters at different temperatures obtained from Rietveld analysis.

Author Contributions

Conceptualization and experimental plan, T.K., V.M., H.R.G.; writing—original draft preparation and editing, T.K., V.M., N.G.; material preparation, S.P., N.G., B.R.; synchrotron measurements, D.M., A.V. and S.D.M.J.; data analysis, T.K., V.M., D.M. and A.V.; resources and supervision, J.-U.R., A.M.B.; project administration and funding acquisition, F.G. All authors have read and agreed to the published version of the manuscript.

Funding

This project has received funding from the European Union’s Horizon 2020 research and innovation program under grant agreement No 679933 (MEMERE project). We acknowledge the European Synchrotron Radiation Facility for provision of synchrotron radiation facilities. A.M.B. acknowledges EPSRC (award EP/K007467/1) for funding.

Data Availability Statement

All data are available from the corresponding authors on reasonable request.

Acknowledgments

All the authors also gratefully acknowledge the financial and technical support provided by their respective institutions. We acknowledge support by the German Research Foundation and the Open Access Publication Fund of TU Berlin. The authors would like to thank Marco di Michiel for preparing ID15A beamline instrumentation and setup at ESRF and for helping with the data acquisition.

Conflicts of Interest

The authors declare no conflict of interest.

References

  1. Ghanta, M.; Fahey, D.; Subramaniam, B. Environmental impacts of ethylene production from diverse feedstocks and energy sources. Appl. Petrochem. Res. 2014, 4, 167–179. [Google Scholar] [CrossRef] [Green Version]
  2. Bergmann, M.; Schmitz, A.; Hayden, M.; Kosonen, K. (Eds.) Imposing a Unilateral Carbon Constraint on Energy-Intensive Industries and Its Impact on Their International Competitiveness. Data and Analysis; Publications Office of the European Union: Luxembourg, 2007. [Google Scholar]
  3. Stünkel, S.; Illmer, D.; Drescher, A.; Schomäcker, R.; Wozny, G. On the design, development and operation of an energy efficient CO2 removal for the oxidative coupling of methane in a miniplant scale. Appl. Therm. Eng. 2012, 43, 141–147. [Google Scholar] [CrossRef]
  4. Penteado, A.T.; Kim, M.; Godini, H.R.; Esche, E.; Repke, J.-U. Techno-economic evaluation of a biogas-based oxidative coupling of methane process for ethylene production. Front. Chem. Sci. Eng. 2018, 12, 598–618. [Google Scholar] [CrossRef]
  5. Otsuka, K.; Hatano, M.; Komatsu, T. Synthesis of C2H4 by Partial Oxidation of CH4 Over Transition Metal Oxides With Alkali-Chlorides. In Studies in Surface Science and Catalysis: Methane Conversion; Bibby, D.M., Chang, C.D., Howe, R.F., Yurchak, S., Eds.; Elsevier: Amsterdam, The Netherlands, 1988; pp. 383–387. [Google Scholar]
  6. Farrell, B.L.; Linic, S. Oxidative coupling of methane over mixed oxide catalysts designed for solid oxide membrane reactors. Catal. Sci. Technol. 2016, 6, 4370–4376. [Google Scholar] [CrossRef]
  7. Sofranko, J. The oxidative conversion of methane to higher hydrocarbons. J. Catal. 1987, 103, 302–310. [Google Scholar] [CrossRef]
  8. Matras, D.; Vamvakeros, A.; Jacques, S.D.M.; Middelkoop, V.; Vaughan, G.; Aran, M.A.; Cernik, R.J.; Beale, A.M. In situ X-ray diffraction computed tomography studies examining the thermal and chemical stabilities of working Ba0.5Sr0.5Co0.8Fe0.2O3-δ membranes during oxidative coupling of methane. Phys. Chem. Chem. Phys. PCCP 2020, 22, 18964–18975. [Google Scholar] [CrossRef]
  9. Pak, S.; Qiu, P.; Lunsford, J.H. Elementary Reactions in the Oxidative Coupling of Methane over Mn/Na2WO4/SiO2 and Mn/Na2WO4/MgO Catalysts. J. Catal. 1998, 179, 222–230. [Google Scholar] [CrossRef]
  10. Mleczko, L.; Baerns, M. Catalytic oxidative coupling of methane—reaction engineering aspects and process schemes. Fuel Process. Technol. 1995, 42, 217–248. [Google Scholar] [CrossRef]
  11. Liu, H.; Wang, X.; Yang, D.; Gao, R.; Wang, Z.; Yang, J. Scale up and stability test for oxidative coupling of methane over Na2WO4-Mn/SiO2 catalyst in a 200 mL fixed-bed reactor. J. Nat. Gas Chem. 2008, 17, 59–63. [Google Scholar] [CrossRef]
  12. Lee, J.Y.; Jeon, W.; Choi, J.-W.; Suh, Y.-W.; Ha, J.-M.; Suh, D.J.; Park, Y.K. Scaled-up production of C2 hydrocarbons by the oxidative coupling of methane over pelletized Na2WO4/Mn/SiO2 catalysts: Observing hot spots for the selective process. Fuel 2013, 106, 851–857. [Google Scholar] [CrossRef]
  13. Tiemersma, T.P.; Chaudhari, A.S.; Gallucci, F.; Kuipers, J.A.M.; van Sint Annaland, M. Integrated autothermal oxidative coupling and steam reforming of methane. Part 1: Design of a dual-function catalyst particle. Chem. Eng. Sci. 2012, 82, 200–214. [Google Scholar] [CrossRef]
  14. Tiemersma, T.P.; Chaudhari, A.S.; Gallucci, F.; Kuipers, J.A.M.; van Sint Annaland, M. Integrated autothermal oxidative coupling and steam reforming of methane. Part 2: Development of a packed bed membrane reactor with a dual function catalyst. Chem. Eng. Sci. 2012, 82, 232–245. [Google Scholar] [CrossRef]
  15. Tiemersma, T.P.; Kolkman, T.; Kuipers, J.A.M.; van Sint Annaland, M. A novel autothermal reactor concept for thermal coupling of the exothermic oxidative coupling and endothermic steam reforming of methane. Chem. Eng. J. 2012, 203, 223–230. [Google Scholar] [CrossRef]
  16. Scher, E.C.; Zurcher, F.R.; Cizeron, J.M.; Schammel, W.P.; Tkachenko, A.; Gamoras, J.; Karshtedt, D.; Greg, N.Y.C.E. Production of Ethylene with Nanowire Catalysts. U.S. Patent 9,718,054, 1 August 2017. [Google Scholar]
  17. Gao, Y.; Neal, L.; Ding, D.; Wu, W.; Baroi, C.; Gaffney, A.M.; Li, F. Recent Advances in Intensified Ethylene Production—A Review. ACS Catal. 2019, 9, 8592–8621. [Google Scholar] [CrossRef]
  18. Sadjadi, S.; Simon, U.; Godini, H.R.; Görke, O.; Schomäcker, R.; Wozny, G. Reactor material and gas dilution effects on the performance of miniplant-scale fluidized-bed reactors for oxidative coupling of methane. Chem. Eng. J. 2015, 281, 678–687. [Google Scholar] [CrossRef]
  19. Zanthoff, H.; Baerns, M. Oxidative coupling of methane in the gas phase. Kinetic simulation and experimental verification. Ind. Eng. Chem. Res. 1990, 29, 2–10. [Google Scholar] [CrossRef]
  20. Zohour, B.; Noon, D.; Senkan, S. New Insights into the Oxidative Coupling of Methane from Spatially Resolved Concentration and Temperature Profiles. ChemCatChem 2013, 5, 2809–2812. [Google Scholar] [CrossRef]
  21. Godini, H.R.; Xiao, S.; Kim, M.; Holst, N.; Jašo, S.; Görke, O.; Steinbach, J.; Wozny, G. Experimental and model-based analysis of membrane reactor performance for methane oxidative coupling: Effect of radial heat and mass transfer. J. Ind. Eng. Chem. 2014, 20, 1993–2002. [Google Scholar] [CrossRef]
  22. Middelkoop, V.; Coenen, K.; Schalck, J.; van Sint Annaland, M.; Gallucci, F. 3D printed versus spherical adsorbents for gas sweetening. Chem. Eng. J. 2019, 357, 309–319. [Google Scholar] [CrossRef]
  23. Godini, H.R.; Trivedi, H.; de Villasante, A.G.; Görke, O.; Jašo, S.; Simon, U.; Berthold, A.; Witt, W.; Wozny, G. Design and demonstration of an experimental membrane reactor set-up for oxidative coupling of methane. Chem. Eng. Res. Des. 2013, 91, 2671–2681. [Google Scholar] [CrossRef]
  24. Godini, H.R.; Xiao, S.; Kim, M.; Görke, O.; Song, S.; Wozny, G. Dual-membrane reactor for methane oxidative coupling and dry methane reforming: Reactor integration and process intensification. Chem. Eng. Process. Process Intensif. 2013, 74, 153–164. [Google Scholar] [CrossRef]
  25. Spallina, V.; Velarde, I.C.; Jimenez, J.A.M.; Godini, H.R.; Gallucci, F.; Annaland, M.V.S. Techno-economic assessment of different routes for olefins production through the oxidative coupling of methane (OCM): Advances in benchmark technologies. Energy Convers. Manag. 2017, 154, 244–261. [Google Scholar] [CrossRef]
  26. Tonkovich, A.L.Y.; Jimenez, D.M.; Zilka, J.L.; Roberts, G.L. Inorganic membrane reactors for the oxidative coupling of methane. Chem. Eng. Sci. 1996, 51, 3051–3056. [Google Scholar] [CrossRef]
  27. Bhatia, S.; Thien, C.Y.; Mohamed, A.R. Oxidative coupling of methane (OCM) in a catalytic membrane reactor and comparison of its performance with other catalytic reactors. Chem. Eng. J. 2009, 148, 525–532. [Google Scholar] [CrossRef]
  28. Shi, J.; Yao, L.; Hu, C. Effect of CO2 on the structural variation of Na2WO4/Mn/SiO2 catalyst for oxidative coupling of methane to ethylene. J. Energy Chem. 2015, 24, 394–400. [Google Scholar] [CrossRef]
  29. Zhou, X.; Liu, C.-J. Three-dimensional Printing for Catalytic Applications: Current Status and Perspectives. Adv. Funct. Mater. 2017, 27, 1701134. [Google Scholar] [CrossRef]
  30. Cruellas, A.; Melchiori, T.; Gallucci, F.; van Sint Annaland, M. Advanced reactor concepts for oxidative coupling of methane. Catal. Rev. 2017, 59, 234–294. [Google Scholar] [CrossRef] [Green Version]
  31. Aigler, J.M.; Lunsford, J.H. Oxidative dimerization of methane over MgO and Li+/MgO monoliths. Appl. Catal. 1991, 70, 29–42. [Google Scholar] [CrossRef]
  32. Middelkoop, V.; Vamvakeros, A.; de Wit, D.; Jacques, S.D.M.; Danaci, S.; Jacquot, C.; De Vos, Y.; Matras, D.; Price, S.W.; Beale, A.M. 3D printed Ni/Al2O3 based catalysts for CO2 methanation—A comparative and operando XRD-CT study. J. CO2 Util. 2019, 33, 478–487. [Google Scholar] [CrossRef]
  33. Vamvakeros, A.; Jacques, S.D.M.; Di Michiel, M.; Matras, D.; Middelkoop, V.; Ismagilov, I.Z.; Matus, E.V.; Kuznetsov, V.V.; Drnec, J.; Senecal, P.; et al. 5D operando tomographic diffraction imaging of a catalyst bed. Nat. Commun. 2018, 9, 4751. [Google Scholar] [CrossRef] [Green Version]
  34. Beale, A.M.; Jacques, S.D.M.; Di Michiel, M.; Mosselmans, J.F.W.; Price, S.W.T.; Senecal, P.; Vamvakeros, A.; Paterson, J. X-ray physico-chemical imaging during activation of cobalt-based Fischer-Tropsch synthesis catalysts. Philos. Trans. Ser. A Math. Phys. Eng. Sci. 2018, 376. [Google Scholar] [CrossRef]
  35. Beale, A.M.; Jacques, S.D.M.; Gibson, E.K.; Di Michiel, M. Progress towards five dimensional diffraction imaging of functional materials under process conditions. Coord. Chem. Rev. 2014, 277–278, 208–223. [Google Scholar] [CrossRef]
  36. Vamvakeros, A.; Jacques, S.D.M.; Middelkoop, V.; Di Michiel, M.; Egan, C.K.; Ismagilov, I.Z.; Vaughan, G.B.M.; Gallucci, F.; van Sint Annaland, M.; Shearing, P.R.; et al. Real time chemical imaging of a working catalytic membrane reactor during oxidative coupling of methane. Chem. Commun. 2015, 51, 12752–12755. [Google Scholar] [CrossRef] [PubMed] [Green Version]
  37. Matras, D.; Jacques, S.D.M.; Poulston, S.; Grosjean, N.; Estruch Bosch, C.; Rollins, B.; Wright, J.; Di Michiel, M.; Vamvakeros, A.; Cernik, R.J.; et al. Operando and Postreaction Diffraction Imaging of the La–Sr/CaO Catalyst in the Oxidative Coupling of Methane Reaction. J. Phys. Chem. C 2019, 123, 1751–1760. [Google Scholar] [CrossRef] [Green Version]
  38. Vamvakeros, A.; Matras, D.; Jacques, S.D.M.; Di Michiel, M.; Middelkoop, V.; Cong, P.; Price, S.W.; Bull, C.L.; Senecal, P.; Beale, A.M. Real-time tomographic diffraction imaging of catalytic membrane reactors for the oxidative coupling of methane. Catal. Today 2020. [Google Scholar] [CrossRef]
  39. Matras, D.; Vamvakeros, A.; Jacques, S.; Grosjean, N.; Rollins, B.; Poulston, S.; Stenning, G.B.; Godini, H.; Drnec, J.; Cernik, R.J.; et al. Effect of thermal treatment on the stability of Na-Mn-W/SiO2 Catalyst for the Oxidative Coupling of Methane. Faraday Discuss. 2020. [Google Scholar] [CrossRef] [Green Version]
  40. Vamvakeros, A.; Matras, D.; Jacques, S.D.M.; Di Michiel, M.; Price, S.W.T.; Senecal, P.; Aran, M.A.; Middelkoop, V.; Stenning, G.B.; Mosselmans, J.F.W.; et al. Real-time multi-length scale chemical tomography of fixed bed reactors during the oxidative coupling of methane reaction. J. Catal. 2020, 386, 39–52. [Google Scholar] [CrossRef]
  41. Wang, J.; Chou, L.; Zhang, B.; Song, H.; Zhao, J.; Yang, J.; Li, S. Comparative study on oxidation of methane to ethane and ethylene over Na2WO4–Mn/SiO2 catalysts prepared by different methods. J. Mol. Catal. A Chem. 2006, 245, 272–277. [Google Scholar] [CrossRef]
  42. Serres, T.; Aquino, C.; Mirodatos, C.; Schuurman, Y. Influence of the composition/texture of Mn–Na–W catalysts on the oxidative coupling of methane. Appl. Catal. A Gen. 2015, 504, 509–518. [Google Scholar] [CrossRef]
  43. Vaughan, G.B.M.; Baker, R.; Barret, R.; Bonnefoy, J.; Buslaps, T.; Checchia, S.; Duran, D.; Fihman, F.; Got, P.; Kieffer, J.; et al. ID15A at the ESRF—A beamline for high speed operando X-ray diffraction, diffraction tomography and total scattering. J. Synchrotron Radiat. 2020, 27 Pt 2, 515–528. [Google Scholar] [CrossRef]
  44. Kieffer, J.; Petitdemange, S.; Vincent, T. Real-time diffraction computed tomography data reduction. J. Synchrotron Radiat. 2018, 25 Pt 2, 612–617. [Google Scholar] [CrossRef]
  45. Ashiotis, G.; Deschildre, A.; Nawaz, Z.; Wright, J.P.; Karkoulis, D.; Picca, F.E.; Kieffer, J. The fast azimuthal integration Python library: pyFAI. J. Appl. Crystallogr. 2015, 48 Pt 2, 510–519. [Google Scholar] [CrossRef]
  46. Vamvakeros, A.; Jacques, S.D.M.; Di Michiel, M.; Middelkoop, V.; Egan, C.K.; Cernik, R.J.; Beale, A.M. Removing multiple outliers and single-crystal artefacts from X-ray diffraction computed tomography data. J. Appl. Crystallogr. 2015, 48, 1943–1955. [Google Scholar] [CrossRef]
  47. Vamvakeros, A. nDTomo Software Suite. 2018. Available online: https://github.com/antonyvam/nDTomo (accessed on 23 February 2021).
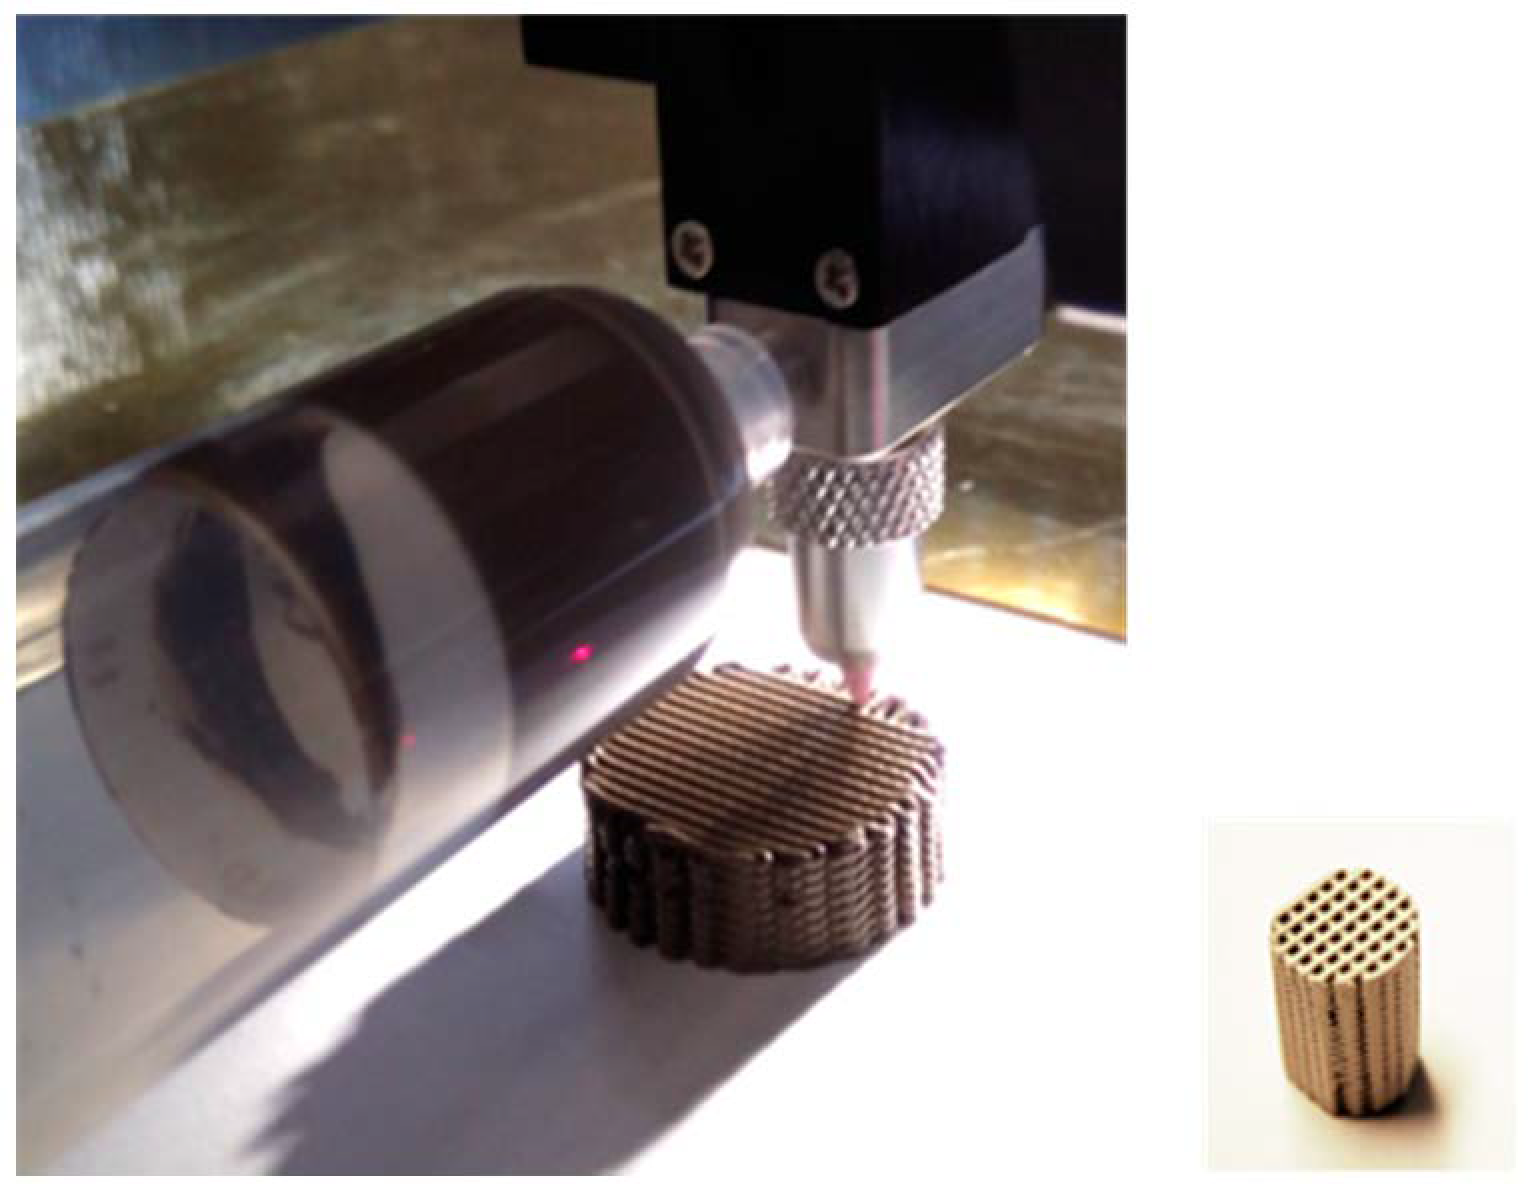
Figure 1. (left) Photo of catalyst structures directly printed from JM’s reference catalyst powder (Mn–Na–W/SiO2) using an NScrypt printer; (right) cylinders of smaller dimensions were cut to fit a 0.6 cm reactor.
Catalysts 11 00290 g001
Figure 2. Photo (left) of in-situ experimental set up at the ID15A beamline for XRD-CT studies of 3D printed Mn–Na–W–O/SiO2 catalyst; the set-up comprises a box furnace placed around the reactor cell (see insert left with sample in quartz tube) connected with the required tubing. Photo (right) of miniplant experimental setup at Technical University Berlin (TUB). The unit comprises a reactor within a split tube furnace with gas supply from above and an 18-point thermocouple inside the reactor and catalytic bed.
Catalysts 11 00290 g002
Figure 3. Calcination procedure for the thermal pre-treatment of the Mn/Na2WO4/SiO2 catalyst.
Catalysts 11 00290 g003
Figure 4. Lab XRD data for 3D printed catalyst calcined at 400 and 700 °C before and after the reaction performed at 840° compared to the Mn–Na–W/SiO2 as-received powder (further details on the XRD data and the phases identified at each temperature between 400 and 1000 °C can be found in Figure S2 and Table S1 in the Supplementary Material).
Catalysts 11 00290 g004
Figure 5. SEM images of 3D printed monolith and its fiber regular arrangement (a) and microstructure (b) after reaction; EDS mappings (c,d) after reaction, showing catalyst material homogenously distributed across silica support with mainly larger grains of Mn and Na phases observed ((a), scale bar 5 mm; (b), scale bar 100 μm; (c,d), scale bar 10 μm; legend: Mn—fuchsia, Na—green, W—blue).
Catalysts 11 00290 g005
Figure 6. In-situ studies of 3D printed Mn–Na–W/SiO2 catalysts from JM; spatial distribution of the active catalyst component (Mn2O3-phase) on the micrometer length scale across silica support under different oxidative coupling of methane (OCM) operating conditions with a CH4:O2:N2 ratio of 4:1:4 at 840 °C for a duration of 5.5 h and at 950 °C for ca. 1 h (note that top and bottom positions were not measured).
Catalysts 11 00290 g006
Figure 7. Reconstructed 2D images of the distribution of the catalyst silica support indicate macro and micro-scale features in space (at three positions, top, middle and bottom of the monolith) as a function of time and temperature during OCM introduction and under OCM operating conditions at 840 °C for a duration of 5.5 h and at 950 °C for a duration of ca 1 h; the thermal color maps show the following distribution of crystalline phases of the silica support: tridymite (top panel), cristobalite (middle panel), quartz (bottom panel); tridymite and quartz are present in their higher symmetry hexagonal forms at 840 and 950 °C; quartz started to form at high temperature; cristobalite is present in the higher symmetry cubic form at 840 and 950 °C. Panels present the phase distribution normalized in respect to maximum value of scale factor for particular silica phase in each separate z positions—in this way it is possible to observe the phase distribution as a function of time and conditions. In addition, the plots on the right present the mean value for normalized scale factor and for each XRD-CT scan.
Catalysts 11 00290 g007
Figure 8. SEM images combined with a concentric backscattered (CBS) images (ad) and EDS images (ei) showing the morphology and microstructure of Mn–Na–W/SiO2 pelletized powder in alumina MFB reactor. Note the formation of a sublayer of Na and silica (possibly in the form of Na silicate) on the inner wall of the alumina tube after reaction (legend: Mn—yellow, Na—fuchsia, O—light green, Si—cyan, W—dark green).
Catalysts 11 00290 g008
Figure 9. First catalyst charge. Catalyst testing of 3D structured catalyst at 840 °C, GHSV = 4080 mLCH4 g−1Cat. h−1, CH4:O2:N2 = 4:1:4 (later 4:1:5); (legend: X_CH4—methane conversion in %, S_C2—C2-selectivity in %, Y_C2—yield of C2 products in %).
Catalysts 11 00290 g009
Figure 10. Second catalyst charge. Catalytic testing of 3D structured catalyst corresponding to reaction conditions at the XRD-CT run with longer calcination time and time on stream at 840 °C, GHSV = 4080 mLCH4 g−1Cat. h−1, CH4:O2:N2 = 4:1:4 (later 4:1:5).
Catalysts 11 00290 g010
Figure 11. Results from membrane reactor configuration over 12 h on stream and optimized rection conditions for 9 h after 2.5 h catalyst regeneration with pure air; total flow 300 mL/min, 840 °C, GHSV = 2400 mLCH4 g−1Cat. h−1, CH4:O2:N2:CO2 = 4:1:5:0 (later 4:3:8:7).
Catalysts 11 00290 g011
Figure 12. Summary plots of Mn–Na–W/SiO2 catalyst performance in different reactor configurations under OCM conditions: (1) packed bed (PB) of 3D structures 4:1:5 (2) PB of crushed structures 4:1:5 (3) PB of 3D structures 4:1:5 (longer calcination) (4) Membrane packed bed (MPB) with powdered catalyst 4:1:5 (5) MPB with powdered catalyst 4:3:8:1:4 CH4:O2:N2+ 30% CO2, total flow 200 mL/min (PB) and 300 mL/min (MPB), 840 °C.
Catalysts 11 00290 g012
Table 1. Summary of the Brunauer–Emmett–Teller (BET) specific surface area results and pore sizing for pelletized powder and 3D printed catalyst.
Mn-Na-W/SiO2 Catalyst
PowderPellet3D Structure
Sample weight[g]0.290.350.22
Vm[cm3(STP) g−1]8.820.372.11
as,BET[m2 g−1]38.401.599.17
Average pore diameter[nm]25.868.0625.51
Spec. Pressure loss[bar m−1]1.000.270.05
Osithereme type IVIVIV
Publisher’s Note: MDPI stays neutral with regard to jurisdictional claims in published maps and institutional affiliations.