Abstract
Olefins are among the most important structural building blocks for a plethora of chemical reaction products, including petrochemicals, biomaterials and pharmaceuticals. An ever-increasing economic demand has urged scientists, engineers and industry to develop novel technical methods for the dehydrogenation of parent alkane molecules. In particular, the catalysis over precious metal or metal oxide catalysts has been put forward as an alternative way route to thermal-, steam- and fluid catalytic cracking (FCC). Multiscale system modeling as a tool to theoretically understand processes has in the past decade period evolved from a rudimentary measurement-complementing approach to a useful engineering environment. Not only can it predict various experimentally obtained parameters, such as conversion, activity, and selectivity, but it can help us to simulate trends, when changing applicative operating conditions, such as surface gas temperature or pressure, or even support us in the search for the type of materials, their geometrical properties and phases for a better functional performance. An overview of the current set state of the art for saturated organic short chain hydrocarbons (ethane, propane and butane) is presented. Studies that combine at least two different dimensional scales, ranging from atomistic-, bridging across mechanistic mesoscale kinetics, towards reactor- or macroscale, are focused on. Insights considering reactivity are compared.
1. Introduction
Dehydrogenation of short-chain hydrocarbons (ethane, propane, and butane) is an important industrial reaction for producing olefins as key organic chemicals. Dehydrogenation is of particular interest as an alternative to steam cracking and fluid catalytic cracking, which are still the predominant ways of producing olefins. Due to the increased demand for olefins, the development of novel catalytic processes and in particular improved catalysts has been the main focus for the industrial research facilities and process plants.
The global demand for light alkenes is steadily increasing, mainly due to the requirements of the petrochemical industry for chemical precursors. Propene, butene, and butadiene demand shows a growth trend projected to the year of 2022 [1]. The global cracker feedstock and consequently product slate shows that in the past 10–15 years, the naphtha percentage declined from 55% to 45%, all on the account on propane, butane, and in particular ethane, the latter growing from 27% to 35% [1]. The recent discovery of the shale gas deposits will further reinforce the ethane and propane dehydrogenation units. Commercial routes to propene and butene also include new on-purpose technologies, such as 1-step dehydrogenation, olefin metathesis, methanol to olefins, and enhanced fluid catalytic cracking processes.
Industrially, two commercial technologies are globally most represented for the dehydrogenation of paraffins: Oleflex® and Catofin® [2]. While both are used for propane and isobutane dehydrogenation, they differ slightly by the reactor type and setup, and mostly by the type of catalysts used: while the former uses Pt/Sn-type catalysts, the latter uses CrO catalysts, both on alumina support and promoted with various metals, most commonly Na and K [2]. Both technologies suffer from coke deposition on the catalyst surface, requiring the use of special catalyst regeneration reactor in dehydrogenation unit, to enable recycling by burning and purging the coke deposits as gaseous products [3].
Ethane dehydrogenation is one of the methods for the production of ethylene, which is an important feedstock chemical [4]. Although the topic has been covered extensively in terms of modeling, the literature mostly focuses on single scale modeling. Including multiple scales makes for a well rounded perspective on the topic and can provide a better understanding of the reaction mechanism as well as elucidate the optimal conditions in terms of yields, selectivities and conversion.
Ethane dehydrogenation can be oxidative or non-oxidative, both of which have been studied extensively [4,5,6,7,8,9,10]. The non-oxidative process is more prone to coke formation, which leads to catalyst deactivation [4]. Oxidative dehydrogenation is an exothermic process and can therefore be carried out at lower temperatures, about 300 K lower than the non-oxidative endothermic process [8]. This both prevents coking and suppresses side reactions and the formation of by-products, such as CO, which reduce ethylene selectivity [4]. Pt either as a pure metal [4,5,9,10] or in bimetallic alloy catalysts [6,7,8] is the first choice for ethane dehydrogenation, because it provides a desirable conversion and selectivity [4,5].
Propylene is mainly obtained as a by-product of steam cracking and fluid catalytic cracking of naphtha, light diesel, and other oil products [11,12]. It is the second most important chemical in the petrochemical industry and used for the production of polypropylene, propylene oxide, acrylic acid and acrylonitrile [13]. Since the 1930s, due to the rapid increase in the demand for propylene, it has been produced with the direct catalytic dehydrogenation of propane [11,13]. Pt is the most commonly used catalyst for the propane dehydrogenation process (PDH) despite its propensity for coking. To mitigate this problem, Pt is usually doped or alloyed with other elements. However, there are many other catalysts, such as Cr and Al oxides, Ni, h-BN (hexagonal boron nitride), VMgO, etc. which can perform similarly or even better in the PDH process, depending on the operating conditions and the type of reactor used.
Catalytic conversion of n-butane is an important commercial route towards butylene and butadiene [14]. Processing of alkanes represents a major task in the petrochemical industry. Besides other processing methods, catalytic dehydrogenation of butane (BDH) is of particular interest because of its ability to generate corresponding olefins and dienes, which are important intermediates in production of a range of valuable chemicals, for instance in the production of gasoline and fuel additives. The most commonly used products, butylene and butadiene, are crucial in the production of synthetic rubbers and are continually in high demand. Moreover, butadiene is an important bulk chemical for the synthesis of elastomers and polymer resins, which has been predominantly extracted from refinery waste gas and natural gas condensates [3].
Industrial dehydrogenation is quite often optimized to produce olefins, which are suitable for the synthesis of polymers. For these processes, chromia- or platinum-based catalysts are used, generally supported on aluminum oxide, and promoted with alkali metals. Even though a lot of improvements have been made for Cr and Pt-based catalytic materials, several economic, environmental, and technological challenges are still needed to be solved, such as a high tendency to coking and consequently short catalyst lifetime [3].
The dehydrogenation has already been implemented in some commercially available processes, among which Oleflex® and Catofin® predominate. Non-oxidative BDH is highly endothermic, making the reaction technologically challenging. Therefore, high temperatures (800–1000 K) and low pressures (around 1 atm) are optimal for the reaction. The rate-controlling steps consist of C–H and C–C cleavage, whose rates differ depending on the backbone of the hydrocarbons involved. When C–C predominates, cracking and eventually coking occur, which is undesirable. This is affected by the catalyst used, which can be either noble metal-based or metal oxide-based.
Many excellent reviews of light alkane dehydrogenation exist, discussing different aspects. The topic has been extensively covered and reviewed by Sattler et al. [2]. Nawaz took a detailed look at the technologies and their economical viability [15]. Madeira and Portela overviewed the dehydrogenation of butane, focusing on catalyst performance and (empirical) kinetics [14]. Wang and Zhu reviewed the use of a soft oxidant () in catalytic deyhdrogenation [16]. Some reviews focus on specific catalysts, such as the work by Carrero et al. [17]. Gärtner et al. reviewed the oxidative dehydrogenation of ethane [18].
In this paper, we focus on modeling. We review multiscale modeling efforts on short-chain alkane dehydrogenation. After a short introduction of multiscale modeling, the modeling of ethane, propane and butane dehydrogenation is separately reviewed. We consider the simulations of various scales and compare the effect of different types of catalysts on products selectivity and reactant conversion as well as the coke formation and catalyst deactivation. Since the process can be carried out oxidatively or non-oxidatively, the impact of oxygen is discussed. We overview the benefits and shortcomings of individual models and ultimately present an outlook for the field.
2. On Multiscale Modeling
Multiscale modeling, as the name suggests, is a computational technique for studying processes on various scales (electronic or ab initio scale, kinetic or mesoscale, process or macroscale) [19], which are coupled. One of the biggest advantages of multiscale modeling is the possibility to infer macroscopic behavior from ab initio atomistic calculations. When used for catalysis, this means that selectivity, conversion, and yield can be assessed solely from knowing the catalyst material and the reactants. It can be used to either explain the processes and help optimize the conditions or predictively as a tool for the the computational screening of catalyst materials, effectively enabling the intelligent computer-steered catalyst design.
In multiscale modeling, three main scales can be distinguished. On the electronic (quantum) level, electron interactions are studied from the first principles. In heterogeneous catalysis, adsorbate–surface and adsorbate–adsorbate interactions, and the energetics of the chemical reaction pathway are most important. Usually, density functional theory (DFT) is used for the calculations since it exhibits a particularly favorable cost/accuracy ratio. The potential energy surface for the reactions is converted into reaction rates at a given temperature using the transition state theory (TST). Molecular dynamics (MD) can be used to calculate dynamic properties such as diffusivity. For the reader to get a perspective on the amount of DFT calculations that are required to map a dehydrogenation reaction network, Figure 1 shows an example of the reaction mechanism of butane dehydrogenation. The figure depicts the network of elementary surface reactions over CrO-type catalyst, and shows the values of activation energies, which are together with the intermediates adsorption energies calculated using DFT. Besides basic elementary steps, the figure also shows possible cracking sites of C intermediates, for which the activation energies was also calculated via DFT [20]. Secondary reactions such as cracking are responsible for byproduct formation, in this case coke.
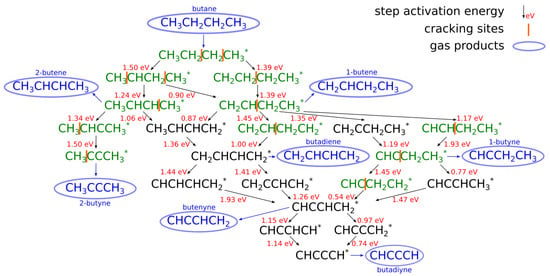
Figure 1.
An example of the proposed reaction mechanism for the butane dehydrogenation over CrO-type catalyst. The reaction activation energy is given for all elementary steps, while cracking sites are also depicted and their activation energies were also calculated via DFT. (Reprinted with permission from [20]).
The calculated reaction rates for individual steps are used in mean-field microkinetic (MK) or kinetic Monte Carlo (kMC) simulations, linking the electronic scale to the mesoscopic scale. At the mesoscopic scale, we can calculate and study the dynamics of the system and ensemble properties. KMC is mostly used for treating spatio-temporal events since the real systems are very complex [19,21]. However, the microkinetic approach, which is based on solving a system of differential equations describing the abundance of each species, is much less computationally demanding and is often used instead. However, it deals with averages and is blind to the effects of individual species–species effects (such as lateral interactions).
The largest scale in the multiscale modeling is the macro or the reactor scale, where the properties of the reactor are simulated in the real operating conditions. For this purpose, computational fluid dynamics (CFD) is commonly used. In CFD calculations, reactor characteristics such as gas pressure drop and fluid flow are included and studied. The reaction mechanism, which has been determined in the previous scales, is coupled with the effects of reactor design, reaction conditions and transport phenomena. Together with mean-field modeling, CFD helps to provide sufficient computational results for comparison with real-world experiments in the laboratory operating conditions [21]. While all individual methods have matured, using them as in a coupled fashion remains challenging.
Figure 2 shows the schematics of multiscale approach to modeling. Various methods are represented, together with the typical spatial and temporal scale of the simulation. While all individual methods matured and are being constantly developed, using them as in a coupled fashion remains challenging. Although for instance DFT and kMC (or MK) are presently often used together in a sort of dual-scale modeling fashion, coupling with additional scale to include for instance macroscopic reactor transport phenomena or evolution of the catalyst surface structure during the reactor operation is still in its infancy [22].
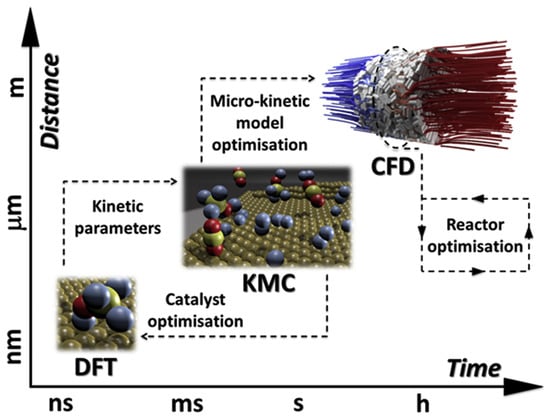
Figure 2.
A schematic representation of the multiscale modeling, with various methods representing different temporal and spatial scales of the modeling phenomena. (Reprinted with permission from [22]. Copyright 2020 Elsevier).
3. Results and Discussion
3.1. Ethane Dehydrogenation
Although there have been several studies of ethane dehydrogenation over Pt and Pt-based alloys employing DFT [23,24,25,26,27], they remain confied to monoscale modeling. Coupling energetics with kinetics has proved to be a much more challenging task, which most research omits. Herein, we list those that do not.
Focusing on metal-type catalysts, the reaction was studied on Pt(111) and stepped Pt(211) [24], PtNi(111) [8], and Pt(111), (111) and Cu(111) [6]. Chen and Vlachos studied the effect of a surface defect by comparing Pt(111) and Pt(211) using DFT [24]. They postulated the entire reaction mechanism, including deep dehydrogenation all the way to CHC*, C species isomerizations and all possible cracking reactions (C–C bond scission). It was found that the carbon species adsorbed more strongly at steps than terraces, while the activation barriers are lower, meaning that steps (or defects in general) are more active sites for the reaction. While * is the most abundant intermediate at the surface, ethylene is the most abundant gaseous product. The rate-determining barrier is 0.81 eV. This study was expanded on by performing microkinetic modeling, which showed that H* and * are the most abundant surface species [28]. Moreover, the reverse reaction (ethylene hydrogenation) was also studied. To facilitate reactor design and system simulation, the mechanism was reduced to a microkinetic model and a one-step rate expression.
On PtNi(111), the reaction was investigated with as a soft oxidant. Kattel et al. [8] combined DFT and KMC to estimate the turnover frequencies and selectivity. In this model, besides the full dehydrogenation and cracking of species, the focus was put on the conversion of to CO, as well. Kinetic simulations showed CO, , and to be the most abundant gaseous products, while the surface saturated with O*, OH* and some C*. The barrier of the first dehydrogenation (i.e., to ) was the lowest (1.12 eV), followed by 1.06 eV for the second dehydrogenation to . CO does not dissociate directly but rather converts to COOH and HOOC via the free hydrogen atoms. A sensitivity analysis revealed that the second dehydrogenation reaction is rate determining.
Hansen et al. studied the reaction on Cu(111), Pt(111), and (111) using DFT and microkinetic modeling. Electronic calculations included 31 possible reaction steps (dehydrogenation and cracking) and showed that the first dehydrogenation (to ) is rate-limiting. This barrier was lowest on Pt(111). Scaling relations were used to elucidate the general trends for transition metals, which followed a linear correlation as expected from the d-band model. The dimensionality of the system was reduced to two descriptors (adsorption energy of and , Figure 3). Microkinetic modeling using a system of differential equations was performed for all investigated catalysts and alloys thereof. In the ensuing activity volcano, Pt and were identified as the best performing catalysts [6].
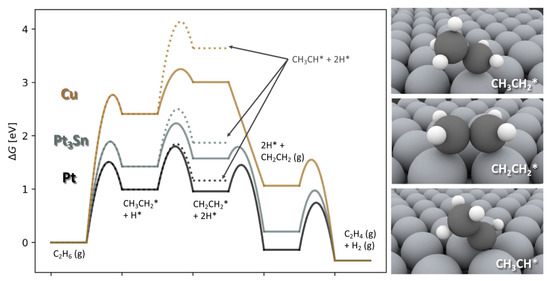
Figure 3.
Free energy diagrams (at 873 K, 0.2 bar , bar , (0.1% carbon conversion), and 0.6 bar ) are presented. Solid lines represent the most relevant pathway in ethane conversion to ethylene, and dotted lines the elementary step to *. Pathways are drawn for three different catalysts, Cu, and Pt. Atomic structures are shown in the right panel (large gray spheres = surface atoms, black spheres = C atoms, small white spheres = H atoms). (Reprinted with permission from [6]. Copyright 2019 Elsevier).
In a micro-kinetics study, Chen and Vlachos found that the C–C bond cleavage mainly proceeds through [24]. This complements the findings of the kMC study by Kattel et al. [8], where about 95% of ethene formed on the surface of the catalyst was shown to desorb due to a weak ethylene-catalyst interaction. Hence, there is only 5% of ethylene left on the catalyst for further reactions (deep dehydrogenations and a subsequent scission of the C–C bond). Kattel at al. [8] study showed that ethane dehydrogenation to ethylene primarily occurs via two successive C–H bond scissions. The same conclusion was reached by Hansen et al. [6], who established that the highest flux for the dehydrogenation reaction of ethane to ethylene can be attributed to the direct pathway through and . They have shown that below 0.1% conversion rate of ethane, rather than destabilisation of the olefin to motivate the desorption, the second step in the dehydrogenation is the key to achieving selectivity. Thus, it is important to adjust the conditions to drive the dehydrogenation to instead of .
Reaching the higher rungs of the multiscale ladder, CFD was used to study ethane dehydrogenation on an eggshell Pt catalyst [4], pure metal Pt [10], and Pt/Sn [7], all supported on . Furthermore, the Pt/Sn catalyst was also studied in various types of model reactors—a 2D continuous stirred tank reactor (CSTR) [4], a plug-flow reactor [7], and a micro-structured quartz reactor [9,10]. In all studies, the concentration of ethane in the feed was the main observable. The obtained results were consistent–as the to ratio increased, the conversion decreased, selectivity increased and the temperature decreased. The theoretical model has predicted the experimental ethylene selectivity and ethane conversion well [9]. The graphical representation of the combined results from all studies is shown in Figure 4. Another important aspect in ethane dehydrogenation process is reactor design. Fattahi et al. modeled an industrial scale reactor for the oxidative dehydrogenation of ethane. The model showed a better ethylene selectivity in a double-bed multi-tubular reactor over the single-bed design due to lower oxygen partial pressures [29]. Table 1 summaries the literature overview and the main results.
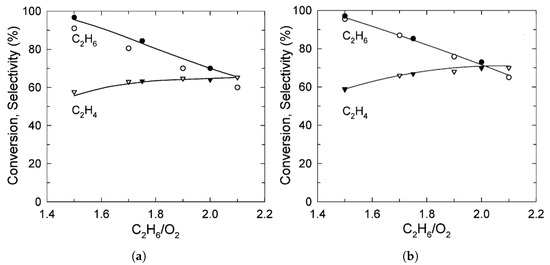
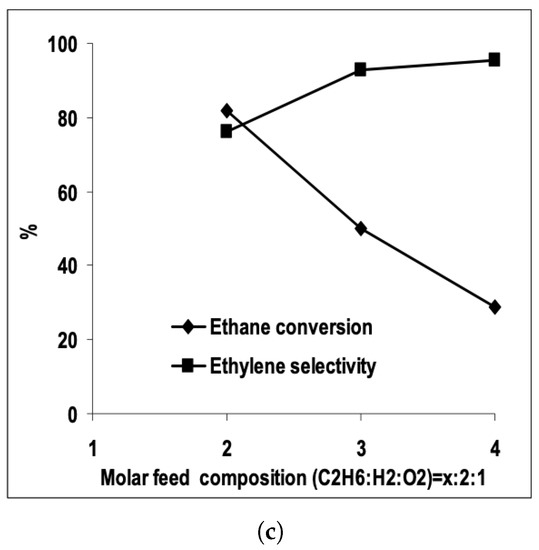
Figure 4.
Ethane conversion and ethylene selectivity versus molar ratio of and in the reactor feed obtained from CFD models, represented by lines (points are experimentally obtained results). (a,b) Donsì et al. results on Pt (a) and Pt/Sn catalyst (b). (Reprinted with permission from [7]. Copyright 2005 American Chemical Society); (c) Ethane conversion and ethylene selectivity results form Stefanidis and Vlachos. (Reprinted with permission from [10]).

Table 1.
The overview of the multiscale modeling results for ethane dehydrogenation process over different catalysts, reactor types, and conditions. Oxidative (O) and non-oxidative (NO) reaction types were considered.
3.2. Propane Dehydrogenation
3.2.1. Catalysts Used in Propane Dehydrogenation Process
The most commonly used catalysts in the PDH process are Pt-based. Various studies focused on using pure Pt or Pt combined with other metals, for example: Pt- [12]; M@Pt, M = Fe, Co, Ni, Cu, Ru, Rh, Pd, Ag, Os, Au [31]; Pt on boron nitride nanosheets [32], , [33]. The study by Zhu et al. focused on the DFT analysis and kinetic simulations in the temperature range from 450 C to 540 C for the PDH over the Pt catalyst accounting for different cluster sizes. The predicted propylene selectivity was 95.8% for big Pt clusters (∼9 nm) and 51.9% for smaller clusters (∼1 nm), as shown in Figure 5. They also showed that the smaller cluster size results in a higher turn over frequency (TOF), lower selectivity and higher deactivation rate. The rate of coke production is inversely proportional to the Pt cluster size [34]. The study by Zha et al. used the catalyst, linking DFT and microkinetics of PDH at 600 C, atmospheric pressure and a total flow rate of 50 mL/min. The authors reported a high selectivity (approximately 98%), as shown in Figure 6. Further comparison showed that pure Pt does not have as high selectivity as . The addition of In indicated a loss of activity, but superior control over coke formation [33].
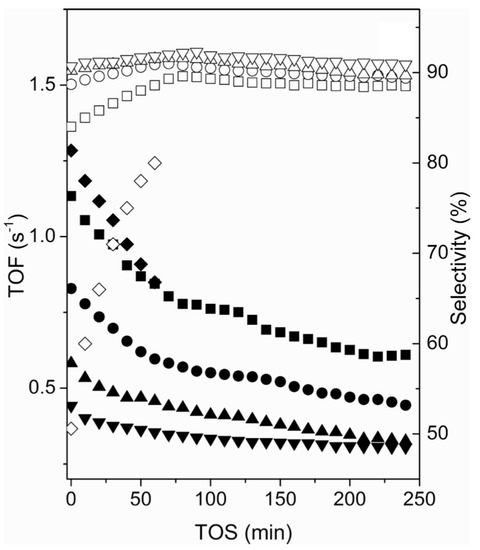
Figure 5.
Comparison of propylene selectivity of different Pt cluster size versus time-on-steam (TOS). Empty symbols represent selectivity, and filled symbols represent TOF. Diamonds-1 nm, squares-3 nm, circles-5 nm, upward-pointing triangles-7 nm, downward-pointing triangles-9 nm cluster size. (Reprinted with permission from [34]. Copyright 2015 American Chemical Society).
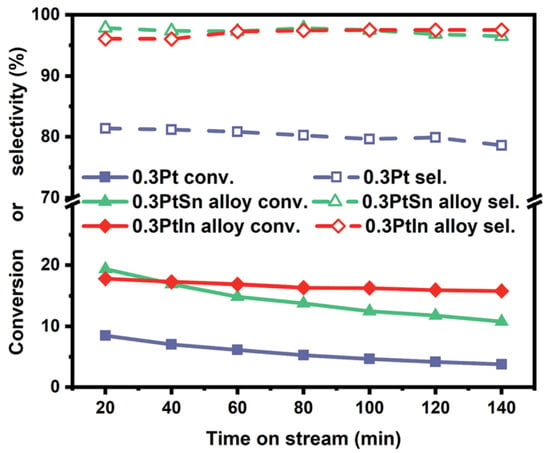
Figure 6.
Conversion and selectivity of , Pt and catalysts in PDH process. Reaction conditions: T = 600 C, atmospheric pressure, total flow rate = 50 mL/min. (Reprinted with permission from [33]. Published by The Royal Society of Chemistry).
The structure of the catalyst and the nature of catalytic active sites play an important role both in modeling and experimental performance. Yang et al. investigated PDH on flat Pt(111) and stepped Pt(211) surfaces using DFT and show that the energy barriers for propane adsorption vary between 0.65 eV and 0.75 eV on the flat surface, and from 0.25 eV to 0.35 eV on the stepped surface [27]. The result clearly indicates that stepped surfaces are kinetically more favorable for dehydrogenation [27]. Wang et al. studied the absorption of propane on Pt(655) using molecular dynamics and similarly concluded that adsorption preferably occurs at the step edge on the Pt surface [35].
To achieve better catalytic activity, Pt is deposited onto supports, such as . Chang et al. studied the kinetics of PDH over a single Pt atom doped catalyst using DFT and mean-field microkinetics. They showed the bifunctional character of the catalyst, where the Pt-O site is more active for propane dehydrogenation, while Ga-O site is active for hydrogen regeneration. The introduction of Pt makes the reaction 2.8 times faster [12].
Focusing on materials beyond Pt, Saelee et al. studied the PDH process over the Ni(111) catalyst and compared it to Pt. They were trying to determine: which factors supress the selectivity of the PDH reaction on Ni, does the reaction and side reactions proceed according to the same mechanism on Ni as on Pt and how can selectivity and reactivity be improved in comparison to the Pt catalyst. Using DFT and transition state calculations to determine the propane/propylene and Ni surface interaction, calculate the adsorption energy and reaction barriers and analyse charge transfer, they showed that the Ni catalyst exhibits a higher activity than Pt but poorer selectivity due to deep dehydrogenations and C–C bond scissions [36].
Other materials have also been considered to be catalysts for the PDH process, in particular Cr and Al oxides are most commonly studied. However, special attention in multiscale modeling should not only be given to the type of catalyst but also to the operating conditions, in particular temperature, and the type of reactor used, together with its feed flow rate. Darvishi et al. modeled the oxidative dehydrogenation of propane over the /- catalyst in a multi tubular reactor filled with 10,000 small diameter tubes. The results showed that a high heat transfer per reactor volume unit and low to moderate oxygen partial pressures should be ensured to provide successful reactor operation. Higher efficiency was obtained with the oxygen distribution over reactor axial coordinate. Periodic air injections increased the selectivities and propylene production over feeding all the oxygen at the reactor inlet, due to lower oxygen partial pressures [37]. The effect of the oxygenate additives was presented by Fattahi et al. who studied the effect of oxygenate modifiers such as methanol and water in the PDH process over the Pt-Sn/- catalyst in a fixed-bed quartz reactor for the reaction temperature of 575, 600 and 620 C. Optimum additions of water and methanol resulted in a higher selectivity and greater propylene yields as well as coke formation reduction [38].
The Pt-Sn/- catalyst was also used in the kinetic modeling of PDH process by Barghi et al. The predictions for propane conversion and propylene yield were similar to experimental data. The model was able to predict optimal amounts of oxygen compounds to improve the propane conversion and reduce coke formation [39,40].
Rostom et al. used kinetic modeling and computational particle fluid dynamics to calculate a high selectivity over the V/- catalyst in circulating fluidized bed downer reactor, with the temperature of 550 C at downer top and pressure of 101,325 Pa. The selectivities were 94% for a particle cluster flow and 93% for a single particle flow. Conversion was relatively low at around 28% for single particle flow and 20% for cluster particle flow. The reaction temperature was 823 K at the top of the reactor [41]. Choi et al. reported higher conversion of 45%, which was reached in packed bed membrane reactor with temperature of 650 C and a propane flow of 4000 kmol/h over the Na-doped - catalyst. Selectivity to propylene was 90%. They made a detailed modeling analysis of a membrane reactor system for PDH using the ASPEN® process simulations software [42]. Du et al. studied PDH over the - catalyst in a circulating fluidized bed reactor with optimal operating conditions for propane with temperature at 600 C, pressure of P = 0.1 MPa and propane flow of 12.5 L/min. They defined a kinetic model with four non-oxidative reaction paths and used predicted hydrodynamics and species concentration distribution using the CFD model. Although the experimental propane conversion of around 39% was slightly lower than conversion obtained from simulations, which was approximately 42%, the agreement is still very good. The selectivity as obtained from the simulations was 83%, which is consistent with the experimental value of 84% [11]. Based on the results above, we conclude that in general, metal oxide catalysts give slightly lower selectivities compared to the Pt catalysts.
Hexagonal boron nitride (h-BN) and graphitic carbon nitride g- were also used in the PDH process. Zhang et al. used high a h-BN and low h-BN content catalyst. They studied the reaction mechanism of oxidative propane dehydrogenation (OPDH) using kinetic modeling and DFT calculations, proposing a detailed reaction pathway yielding various products in OPDH. Two different catalysts were tested, h-BN high and h-BN low, depending on the BET surface area (h-BT high 72.7 m/g and h-BT low 3.7 m/g). With high h-BN at 600 C, they report the propylene selectivity of 36% and the propane conversion of 43%. Changing the temperature to 500 C, the conversion was only 0.3%, while the selectivity increased to 94% [43]. Cao et al. investigated an oxidative dehydrogenation of propane using graphitic carbon nitride. They studied the kinetic behaviour of reactant concentrations and the reaction rate during oxidative propane dehydrogenation process. They made precise reaction mechanism and performed DFT calculations to optimize the structure of catalyst. As opposed to h-BN, reaction over g- at temperature of 500 C, pressure of 1 atmosphere and feed flow rate 18 mL/min showed slightly higher propane conversion of 12.8%, and slightly lower selectivity to propylene of 74.4%. Figure 7 shows a temporal evolution of selectivity and conversion over g-, depending on the time on stream [44].
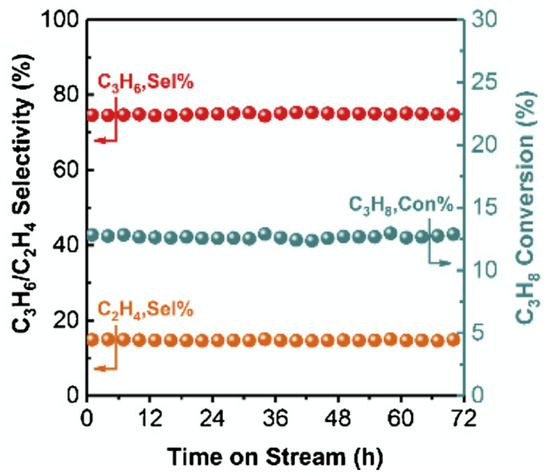
Figure 7.
Stability test of g--12 h at 500 C in PDH process. Reaction conditions: 0.7 g catalyst, He// = 4/4/1, flow rate = 18 mL/min. (Reprinted with permission from [44]. Copyright 2020 Elsevier).
Raman et al. investigated the activity of Ga-Rh supported catalytically active liquid metal solutions (SCALMS) systems for PDH using ab initio molecular dynamics (AIMD) simulations. Ga-Rh catalyst showed selectivity of around 92% (Figure 8) and conversion between 10% and 20% at 550 C at 1.2 bar gas pressure [45] and 8.9 mL/min propane flow. Boudeville et al. studied the oxidative dehydrogenation of propane over the VMgO catalyst containing 14 wt% of V. Their Monte Carlo model predicted a 95% selectivity to propylene, while the experimental selectivity was 75% [46]. Ghasemzadeh et al. studied PDH over the Pd-Ag catalyst at a temperature of 773 K, pressure 1 bar and feed flow rate of 0.75 L/min. The addition of the Pd membrane results in the propane conversion increase from 41% to 49%. They modeled a membrane and a conventional reactor with CFD using the PDH reaction rate, kinetics and equilibrium parameters from Shelepova et al. [47,48]. Modeling wise, the effect of temperature and feed flow rate on the process is considered, reaching the conversion of 91% [48].
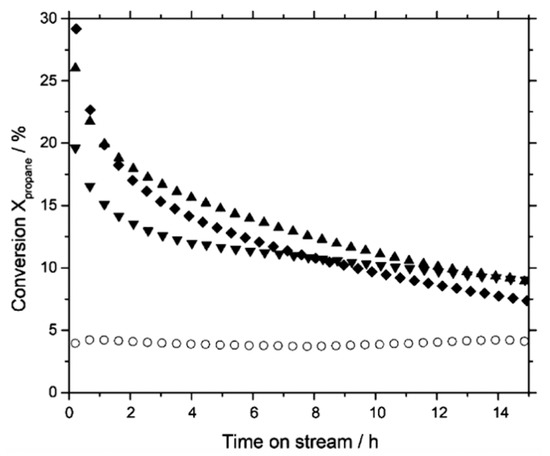
Figure 8.
Propane conversion in PDH process over Ga-Rh catalyst (Reaction conditions: t = 550 C, P = 1.2 bar) with different Ga-Rh molar ratios: 0 = open circles, 34 = downward-pointing triangles, 89 = upward-pointing triangles, 125 = diamonds. (Reprinted with permission from [45]. Copyright 2019 American Chemical Society).
To conclude, in designing a catalyst for propane dehydrogenation process many aspects should be taken into account to achieve the desired results. For example, Pt showed better results when alloyed with other elements. Chang et al. showed how Pt in combination with makes the reaction 2.8 times faster [12], Zha et al. showed a higher selectivity when Pt is allyoed with In, as a [33]. In catalyst design, the size of catalyst particles is an important parameter. The effect of Pt cluster size revealed that smaller clusters result in higher TOF, lower selectivity and higher deactivation rate [34]. Although Pt is the most commonly used catalyst in the PDH process, studies with other types of catalysts (V/- [41], - [11], g- [44], etc.) showed comparable results. Catalyst materials and size should be gathered with appropriate reactor type and reaction conditions such as temperature, pressure, flow rate etc. A prudent combination of all the parameters results in higher PDH process efficiency.
3.2.2. Coke Formation and Catalyst Deactivation
Coke formation and the ensuing catalyst deactivation is the main processes inhibiting PDH. Depending on the catalyst material and particle shape/size, different coke tendencies can be observed. Thus, it is highly advantageous if we understand the deactivation of the catalyst in question.
Despite its poor resilience during coking, Pt alloys remain most common catalysts for the PDH process. Atomistically, coke formations follows deep dehydrogenations of the hydrocarbons, ultimately yielding coke due to the C–C bond scission. Additionally, sintering and phase changes brought about by high temperatures, oxidative environment and coke formation further reduce the catalyst activity. To decrease coking, doping Pt catalysts with different elements is advantageous. For example, Co and In reduce coke formation and improve propylene selectivity [31]. However, the addition of a non-active catalytic material can reduce the TOF significantly, up to several magnitudes [33].
Coke begins to form during the deep dehydrogenation due to reaction intermediates such as propyne () undergoing further dehydrogenations. The deeply dehydrogenated products (such as *) are precursors for the C–C bond scission [12]. To reduce coke formation and regenerate the catalysts by cleaning the active sites, gas can be used [49]. Hydrogen reacts with the C atoms to form methane, which is desorbed from the surface as a gaseous product, leading to increased propylene selectivity during the PDH process [32]. Another important aspect of the coke formation is the catalyst particle size, since it has been shown that smaller Pt particles are more inclined towards coke formation (correlated with higher conversion), while larger particles show higher selectivity and less coking [27].
Huš et al. performed a first-principles-based multiscale study of propane dehydrogenation over Cr2O3(0001). They found that the reactions proceeds via the following route –> –> –> –> . Propylene is the most abundant product. Cracking and coking were the consequence of deep dehydrogenations and cracking reactions, among which the decomposition of to and was the most important. The overall apparent activation barrier for the production of propylene was 1.37 eV. The catalyst poisoning due to coking is inherent to the reaction model, which includes all relevant deep dehydrogenations and cracking reactions. It was found that it can be decomposed into two contributions: the formation of C* and the formation of *. The overall deactivation can be described with Arrhenius-like kinetics with an apparent barrier of 2.82 eV [13].
To reduce coke deposition and catalyst deactivation, thus increasing the catalyst lifetime, an oxidant can be used instead [44]. In oxidative PDH, coke deposition is slower due to lower operating temperatures, resulting also in higher yields [41].
For a better comparison between different catalysts, results are gathered in Table 2. It is shown which multiscale methods were used, which catalysts were chosen for better selectivity, conversion and simply to test them in PDH process. Very important aspect, coke formation and catalyst deactivation is pointed out. Reactor and reaction conditions are written if they were mentioned in an article.

Table 2.
The overview of the multiscale modeling results for propane dehydrogenation process over different catalysts, reactor types, and conditions. Oxidative (O) and non-oxidative (NO) reaction types were considered.
3.3. Butane Dehydrogenation
Catalysts Used in Butane Dehydrogenation Process
, the vanadium oxide, is a commonly known and a well-established catalyst for selective oxidative dehydrogenation of butane. Its catalytic behavior is often further improved by deposing it on an appropriate support. Ha et al. performed quantum chemical calculations using DFT of n-butane dehydrogenation over supported mesoporous silica SBA-15 [50]. The authors calculated the activation barriers, adsorption energies, and the oxidation states of V atoms. The barriers for the activation of the C–H bond are 22 kcal mol. The ratio of Si/Al was found to influence the direction of the initial reaction steps. CI-NEB was used to find the minimum energy pathway between known minima, while MD method was used to investigate the durability of structures and examine the diffusion constant. The study of the kinetics shows that the most favorable products are but-2-ene and but-1-ene, based on the smallest activation energy [51].
Next, the effect of MgO on the catalyst was investigated. It is known that shows high catalytic activity for the butane dehydrogenation due to the small activation energy for C–H bond scission. However, it is difficult to use it in practice because of its low melting point (500–600 C). Thus, the doped / was investigated for the C–H bond scission for butane, although activation energy is a little bit higher than when using only . However, / is more stable. On the other hand, is unsuitable for the C–H bond activation because of a high activation energy [52]. Figure 9, Figure 10, Figure 11 and Figure 12 show conversions and selectivities of BDH over V/MgO in different reactor types.
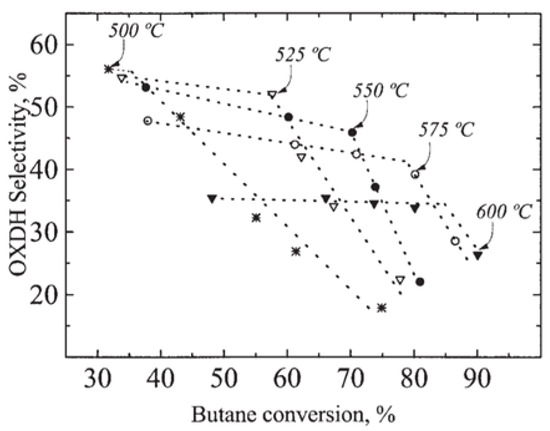
Figure 9.
Selectivity-conversion plot for several temperatures of BDH catalysed over V/MgO in the ICFBR (interconnected fluidized-bed reactor). The mathematical model of the ICFBR with included kinetic and fluid dynamic model of the reaction was used. It shows that for a given temperature, the ODH selectivity decreases with butane conversion, gradually at first and more steeply later. (Reprinted with permission from [53]. Copyright 2004 John Wiley and Sons, American Institute of Chemical Engineers).
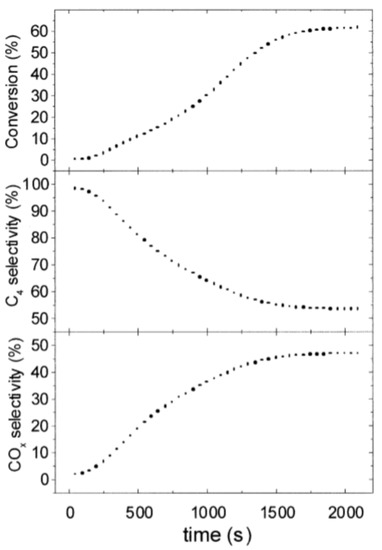
Figure 10.
Butane conversion and product selectivity versus time, for an in situ redox fluidized bed reactor during oxidative dehydrogenation of n-butane on V/MgO catalyst. The conversion of butane increases in the first half an hour until a steady state is reached. The selectivity to is high in the beginning, but later decreases when the CO is formed. (Reprinted with permission from [54]. Copyright 2001 Elsevier).
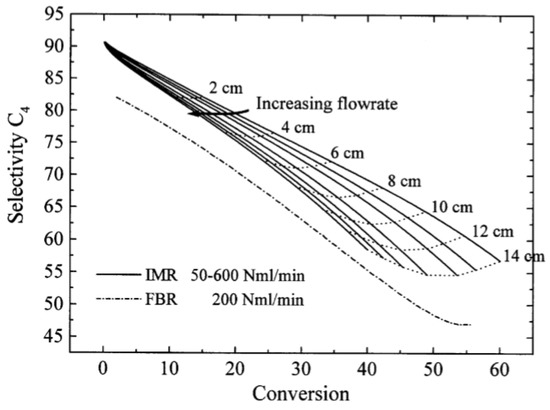
Figure 11.
Selectivity–conversion plot for FBR (fixed bed reactor) and IMR (inert membrane reactor) of the oxidative dehydrogenation of butane over V/MgO catalyst. (Reprinted with permission from [55]. Copyright 1999 Elsevier).
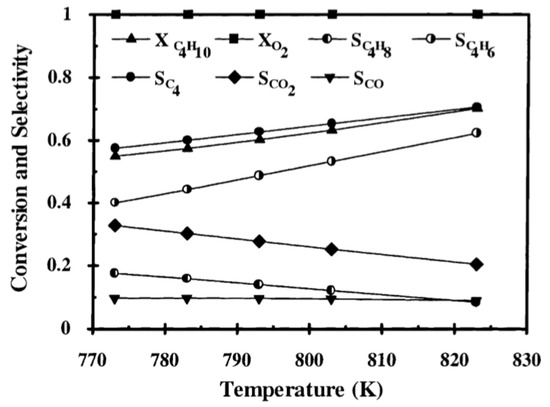
Figure 12.
The effect of the reaction temperature in the FBR. ODH reaction on V/MgO was studied by mathematical modeling of a FBR. According to the results of the study, the selectivity to increased with the increasing temperature. (Reprinted with permission from [56]. Copyright 2002 Elsevier).
Jackson et al. claim that catalytic behavior during the n-butane dehydrogenation and the deactivation of vanadium catalysts depend mainly on the nature of surface vanadium species. Two types of vanadium species on the surface have been studied, namely isolated or polymeric. Results of their study show that polymeric species are more active than the isolated VO species [57].
More thorough studies of BDH were done on Ni-based catalysts, focusing on DFT and kinetic simulations [58,59,60]. These show that nickel-based catalysts typically suffer from fast deactivation due to the thermal sintering and coke deposition [58,59]. Moreover, they show a relatively low selectivity towards partial oxidation or reduction reactions [59].
To achieve better performance, Ni can be modified with Fe, which is shown to be a successful approach to tune the reaction pathway and to improve catalytic performance in terms of activity, selectivity and/or stability, which is commonly based on the amount of Fe added [59]. Catalyst characterization shows that the Ni active species are in the metallic state, while Fe species mainly exist as FeO. DFT calculations further reveal the dehydroganation pathways over Ni(111) and FeO/Ni(111) surfaces, showing that Ni(111) favours the Ce–C bond scission, while FeO/Ni(111) promote the Ce–H bond cleavage [59].
Moreover, the mechanism of deep dehydrogenation is taken into account when studying the BDH process and steam reforming [58]. The study of butane adsorption and two dehydrogenation pathways on Ni(111) catalyst has been done via DFT calculations. The pathways include the formation of 1-butyne and 2-butyne. DFT calculations predicted that the 1-butyne pathway is slightly favored, but when using D3 correction method for DFT, the 1-butyne and 2-butyne pathways were both equally feasible. These results show clearly that Van der Waals (vdW) correction is essential when simulating reactions where intermediates show weak adsorption [60].
Another investigated catalyst for BDH is . Kostetskyy et al. used the ab initio electronic structure calculations and a kinetic model to study the dehydrogenation via two different mechanisms: a sequential and a concerted pathway was compared. On this catalyst, the concerted dehydrogenation pathway was proposed to be energetically preferable, in terms of the Gibbs free energies, to the sequential one, for all hydrocarbons in question [61].
Kinetic modeling by Matveyeva et al. was done for isobutane dehydrogenation over / catalyst in a fixed bed reactor. The authors use Markov Chain Monte Carlo (MCMC) methods to develop a stochastic model, focusing on using only important reaction steps in the mechanistic pathway. The number of kinetic parameters was optimized to a degree to only describe the essential features of the reaction kinetics [3]. The results show low isobutane conversion of BDH over / catalyst, while the catalyst deactivation was not a major issue [3].
Pt-based catalysts on various supports are among the most effective catalysts for selective dehydrogenation and isomerisation processes. However, high process temperatures and the possibility of coke formation require catalyst modifications to mitigate such effects [62]. Such catalysts were studied by Byron et al. with Pt/B/ [62], Silvestre-Albero et al. with Pt-Zn/X-zeolite [63] and Casanave et al. with Pt-In [64]. One of the emerging approaches to prevent Pt catalyst deactivation is the use of boron additives that have been put forward as an alternative to prevent coking. Byron et al. performed a DFT calculations in his study. Pt/ and Pt/B/ catalysts were compared. For Pt/, the amount of coke was calculated to be 1.01%, while for Pt/B/, it was 0.68%. The results showed that the presence of boron improves the catalyst stability for non-oxidative dehydrogenation of n-butane. Also, the rate of n-butane conversion over Pt/B/ was found to be more than two times better as when using Pt/, throughout the duration of the reaction (25 h) [62].
Silvestre-Albero et al. combine the results from the reaction kinetics studies of isobutane dehydrogenation with DFT calculations and results from micro-calorimetric measures to describe the surface chemistry in terms of Horiuti-Polanyi mechanism. The Pt-Zn/X-zeolite catalyst that they study shows high activity and selectivity for the dehydrogenation of isobutane to isobutylene at temperatures from 673 K to 773 K. The rate of isobutane dehydrogenation (calculated as TOF) per site counted by adsorption is comparable (i.e., lower by a factor of ∼5) to the activity of a Pt-Sn/L-zeolite catalyst [63].
The conversion of isobutane to isobutene on the Pt-Zn/zeolite catalyst was lower then 45% of the expected equilibrium conversion (at 673K with a feed composition of 0.01 atm isobutane and 0.7 atm hydrogen, the expected equilibrium conversion was 0.99%, and the observed isobutane conversion was 0.45%). The isobutane dehydrogenation selectivity was 100% at the lower conversion levels of this study and higher than 95% at the higher conversion level [63].
A reaction catalyzed over the Pt-In catalyst has been studied using a packed-bed zeolite membrane reactor by Casanave et al. Two different scenarios were studied, namely the co-current and the counter-current mode. In the co-current mode, the BDH reaction was limited by the transport properties of the membrane, while in the counter-current mode, the limitation by kinetics was governing the results, making the catalyst inactive [64]. It was found that the flux of hydrogen through the composite membrane is higher in the counter-current than in the co-current mode. Nevertheless, the overall conversion in both the counter-current and the co-current mode was the same [64].
Brønsted Acidic Zeolites are another candidates for BDH catalysts. The study by Van der Mynsbrugge et al. focused on the mobility within the zeolite cavity, showing that the low confinement plays an important role in the predomination of the methylene pathway [65]. In another study over Brønsted Acidic Zeolites, Janda et al. used Monte Carlo simulations, DFT and QM/MM calculations to extract the intrinsic activation enthalpies, entropies, and rate coefficients [66]. The simultaneous decrease in both (intrinsic activation entropies) and (intrinsic activation enthalpies) for terminal cracking and dehydrogenation with increasing confinement are observed. Adsorption equilibrium constants reaction rate coefficients increase with a decreasing cavity size, causing the apparent reaction rate to also increase. Differences in equilibrium constants among the three zeolites are dominated by enthalpy [66].
Finally, Cr-based catalysts are also used for BDH in the industrial environment. In the study by Kopač et al., the Cr catalyst was modeled as a four-layer (0001) slab of . DFT calculations were used to obtain reaction energies, activation barriers and pre-exponential factors for every elementary reaction step in BDH, including deep dehydrogenations C–C scission, linking , , and chemistries. The reaction rates for all elementary reactions were calculated from the DFT-energetics in the transition state theory approximation. They were hierarchically cast into two kinetic models (MKM and kMC). While MKM was used for reactor simulations, kMC was used to follow the catalyst surface evolution. The results show that the main product of the reaction below 1000 K is 2-butene, circa 90% of the products at these temperatures, the rest being mainly 1-butene. These products are the first products in the BDH pathway. At higher temperatures, above 1000 K, butadiene starts to form. If the temperatures are increased further, 2-butyne starts to form. There is less than 0.3% of and lower hydrocarbons present in the bulk gas concentration at all conditions. The authors also investigated catalyst deactivation and concluded that is a suitable catalyst for BDH. See Figure 13 for deactivation kinetics and the situation on the surface [20]. The selectivity to 2-butene is best al lower temperatures while selectivity to other products (1-butene, butadiene, and 2-butyne) require higher temperatures (above 1000 K).
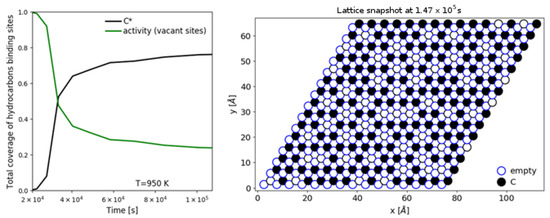
Figure 13.
(Left) Temporal evolution of the lattice coverage. (Right) Lattice snapshot at the final time of the kMC simulation. Please note that there are two types of active sites on the lattice, corresponding to the binding sites for hydrocarbons (black) and hydrogen (blue). The simulation conditions are P = 1 bar and T = 950 K. (Reprinted with permission from [20]).
As expected, the conversion of butane is best when using pressure slightly below 1 bar and the theoretical estimates are comparable with the experimental conversion from the Catadiene® technology. At lower or higher pressures, the conversion is lower (Figure 14).
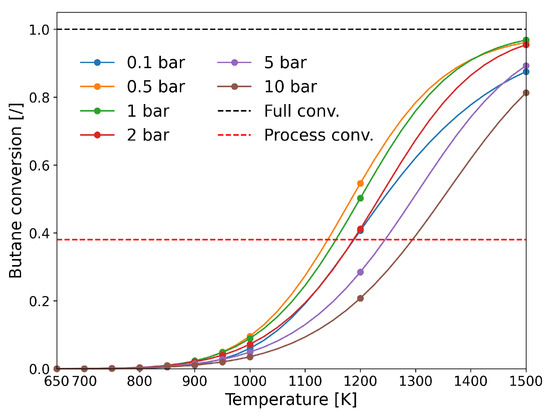
Figure 14.
Butane conversion from MKM simulations at different operating conditions (temperature and pressure). Red dashed line shows the industrial conversion using the Catadiene® technology. (Reprinted with permission from [20]).
On the other hand, the CrO-based catalysts are known to be an environmentally questionable due to the damaging toxicity of the Cr, which invariably form in the catalyst. Therefore, care must be taken during the catalyst production, as well as during the usage and disposal or recycling process. Furthermore, the low melting point of the species (196 C) further prevents the long-term stability. Given all of the above, the development of advanced low-cost and environmental-friendly catalysts for dehydrogenation remains much sought after [67].
4. Discussion and Conclusions
The alkane dehydrogenation process presently represents the economic and efficient way to produce light olefins. However, rising demands for these products, together with the increasing price of oil, are pushing the petrochemical industry to improve on methods and technologies for dehydrogenation process. One of the main advantages of the catalytic dehydrogenation is that it can produce a particular, targeted alkene, instead of a mixture of products which are typically produced via the naphtha cracking.
In recent years, the large amount of shale gas can be extracted via fracking, and the obtained natural gas can be used in the steam cracking refineries. Since economically the price of alkenes is mainly determined by the amount of produced olefins in a side reaction of the cracking, this creates an opportunity for the on-purpose technologies such as catalytic dehydrogenation, as the steam cracking produces negligible amount of side products [2]. Thus, the number of industrial dehydrogenation sites is expected to increase in the following years. Both propylene and butadiene consumption are continuing to grow and as such, the new installments of the propane and butane dehydrogenation units are under way worldwide [2,15].
In this review article, alkane dehydrogenation overview was presented in terms of multiscale modeling. We concentrated on ethane, propane, and butane dehydrogenation, presenting in a thorough manner the studies which focused on theoretical modeling. Theoretical understanding can often provide an insight into the catalyst nature, especially when the surface is decorated with metal dopants, or when the geometry is complex with steps, kinks, or different shapes. In such cases, in silico techniques can often provide order-of-magnitude estimates and trends that can be used to compare different materials, and to be used as a guide for the catalyst synthesis and the experimental setup.
The main conclusion is that for each alkane dehydrogenation process, there exist various catalysts, which show different performance. While Pt-based catalysts are most common among all processes, we find that other types are studied and provide different advancements in terms of cost, environmental issues, and/or catalytic performance such as selectivity, conversion, activity, degradation, etc. Another important aspect that we consider is whether the dehydrogenation process is oxidative or non-oxidative.
All the results are represented in Table 1, Table 2 and Table 3, where the reader can find important information, tailored to the specific interest. Most importantly, the conversion and selectivity are presented for each catalyst where available. To summarize, Pt- and Cr-type catalysts show high selectivity for the dehydrogenation of short-chain hydrocarbons (ethane, propane, and butane) with respect to other type of catalysts, while conversion can often be improved by using other catalyst types, such as V-based or Na-doped catalysts. Depending on the operating conditions, the method and catalyst can be chosen for a specific needs (high conversion, high selectivity, best stability for coke deposition) based on multiscale modeling results gathered in this review. The oxidative dehydrogenation in general shows better catalyst stability in terms of coking, as concluded from a few studies done on PDH (Table 2) and BDH (Table 3). The addition of oxidant, such as , can minimize the coke deposit and consequently increase the lifetime of catalyst, since less regeneration cycles are required.

Table 3.
The overview of the multiscale modeling results for butane dehydrogenation process over different catalysts, reactor types, and conditions. Oxidative (O) and non-oxidative (NO) reaction types were considered.
Funding
This research was funded by the EU Framework Programme for Research and Innovation Horizon 2020 project BiZeolCat, grant number 814671, and the Infrastructure funding, grant number I0-0039.
Acknowledgments
We acknowledge the Slovenian Research Agency (ARRS) through Core Grant P2-0152.


Conflicts of Interest
The authors declare no conflict of interest.
References
- Stahl, S. Homogeneous Catalysis for C-H Activation and Other Approaches to Shale Gas Utilization. In The Changing Landscape of Hydrocarbon Feedstocks for Chemical Production: Implications for Catalysis: Proceedings of a Workshop; Alper, J., Ed.; The National Academies Press: Washington, DC, USA, 2016; pp. 1–136. [Google Scholar]
- Sattler, J.J.H.B.; Ruiz-Martinez, J.; Santillan-Jimenez, E.; Weckhuysen, B.M. Catalytic Dehydrogenation of Light Alkanes on Metals and Metal Oxides. Chem. Rev. 2014, 114, 10613–10653. [Google Scholar] [CrossRef]
- Matveyeva, A.N.; Wärnå, J.; Pakhomov, N.A.; Murzin, D.Y. Kinetic modeling of isobutane dehydrogenation over Ga2O3/Al2O3 catalyst. Chem. Eng. J. 2020, 381, 122741. [Google Scholar] [CrossRef]
- Geng, Z.; Deng, H.; Li, Y.; Zhang, M. Numerical investigation of complex chemistry performing in Pt-catalyzed oxidative dehydrogenation of ethane fixed-bed reactors. Chin. J. Chem. Eng. 2019, 28, 793–807. [Google Scholar] [CrossRef]
- Chen, Y.; Vlachos, D.D.G. Dehydrogenation, Hydrogenolysis and Oxidation of Ethane on Pt: Density Functional Theory Study and Microkinetic Analysis. In Proceedings of the 2009 AIChE Annual Meeting, Nashville, TN, USA, 8–13 November 2009; Volume 2745, p. 3865. [Google Scholar]
- Hansen, M.H.; Nørskov, J.K.; Bligaard, T. First principles micro-kinetic model of catalytic non-oxidative dehydrogenation of ethane over close-packed metallic facets. J. Catal. 2019, 374, 161–170. [Google Scholar] [CrossRef]
- Donsì, F.; Williams, K.A.; Schmidt, L.D. A multistep surface mechanism for ethane oxidative dehydrogenation on Pt- And Pt/Sn-coated monoliths. Ind. Eng. Chem. Res. 2005, 44, 3453–3470. [Google Scholar] [CrossRef]
- Kattel, S.; Chen, J.G.; Liu, P. Mechanistic study of dry reforming of ethane by CO2 on a bimetallic PtNi(111) model surface. Catal. Sci. Technol. 2018, 8, 3748–3758. [Google Scholar] [CrossRef]
- Yang, B.; Yuschak, T.; Mazanec, T.; Tonkovich, A.L.; Perry, S. Multi-scale modeling of microstructured reactors for the oxidative dehydrogenation of ethane to ethylene. Chem. Eng. J. 2008, 135, S147–S152. [Google Scholar] [CrossRef]
- Stefanidis, G.D.; Vlachos, D.G. Oxidative dehydrogenation of ethane to ethylene using microtechnology. In Proceedings of the 21th International Symposium on Chemical Reaction Engineering (ISCRE-21), Philadelphia, PA, USA, 13 June 2010. [Google Scholar]
- Du, Y.; Berrouk, A.S.; Sun, L.; Sun, W.; Fang, D.; Ren, W. Experimental and Computational Fluid Dynamics Investigations of Light Alkane Dehydrogenation in a Fluidized Bed Reactor. Energy Fuels 2019, 33, 4177–4189. [Google Scholar] [CrossRef]
- Chang, Q.Y.; Wang, K.Q.; Hu, P.; Sui, Z.J.; Zhou, X.G.; Chen, D.; Yuan, W.K.; Zhu, Y.A. Dual-function catalysis in propane dehydrogenation over Pt1–Ga2O3 catalyst: Insights from a microkinetic analysis. AIChE J. 2020, 66, e16232. [Google Scholar] [CrossRef]
- Huš, M.; Kopač, D.; Likozar, B. Kinetics of non-oxidative propane dehydrogenation on Cr2O3 and the nature of catalyst deactivation from first-principles simulations. J. Catal. 2020, 386, 126–138. [Google Scholar] [CrossRef]
- Madeira, L.M.; Portela, M.F. Catalytic oxidative dehydrogenation of n-butane. Catal. Rev. 2002, 44, 247–286. [Google Scholar] [CrossRef]
- Nawaz, Z. Light alkane dehydrogenation to light olefin technologies: A comprehensive review. Rev. Chem. Eng. 2015, 31, 413–436. [Google Scholar] [CrossRef]
- Wang, S.; Zhu, Z. Catalytic Conversion of Alkanes to Olefins by Carbon Dioxide Oxidative Dehydrogenation—A Review. Energy Fuels 2004, 18, 1126–1139. [Google Scholar] [CrossRef]
- Carrero, C.A.; Schloegl, R.; Wachs, I.E.; Schomaecker, R. Critical Literature Review of the Kinetics for the Oxidative Dehydrogenation of Propane over Well-Defined Supported Vanadium Oxide Catalysts. ACS Catal. 2014, 4, 3357–3380. [Google Scholar] [CrossRef]
- Gärtner, C.A.; van Veen, A.C.; Lercher, J.A. Oxidative Dehydrogenation of Ethane: Common Principles and Mechanistic Aspects. ChemCatChem 2013, 5, 3196–3217. [Google Scholar] [CrossRef]
- Vlachos, D.; Mhadeshwar, A.; Kaisare, N.S. Hierarchical multiscale model-based design of experiments, catalysts, and reactors for fuel processing. Comput. Chem. Eng. 2006, 30, 1712–1724. [Google Scholar] [CrossRef]
- Kopač, D.; Jurković, D.; Huš, M.; Likozar, B. First-principles-based multiscale modelling of non-oxidative butane dehydrogenation on Cr2O3(0001). ACS Catal. 2021. accepted. [Google Scholar]
- Huš, M.; Grilc, M.; Pavlišič, A.; Likozar, B.; Hellman, A. Multiscale modelling from quantum level to reactor scale: An example of ethylene epoxidation on silver catalysts. Catal. Today 2019, 338, 128–140. [Google Scholar] [CrossRef]
- Pavlišič, A.; Huš, M.; Prašnikar, A.; Likozar, B. Multiscale modelling of CO2 reduction to methanol over industrial Cu/ZnO/Al2O3 heterogeneous catalyst: Linking ab initio surface reaction kinetics with reactor fluid dynamics. J. Clean. Prod. 2020, 275, 122958. [Google Scholar] [CrossRef]
- Andersin, J.; Honkala, K. DFT study on complete ethylene decomposition on flat and stepped Pd. Surf. Sci. 2010, 604, 762–769. [Google Scholar] [CrossRef]
- Chen, Y.; Vlachos, D.G. Hydrogenation of Ethylene and Dehydrogenation and Hydrogenolysis of Ethane on Pt(111) and Pt(211): A Density Functional Theory Study. J. Phys. Chem. C 2010, 114, 4973–4982. [Google Scholar] [CrossRef]
- Hook, A.; Celik, F.E. Predicting Selectivity for Ethane Dehydrogenation and Coke Formation Pathways over Model Pt–M Surface Alloys with ab Initio and Scaling Methods. J. Phys. Chem. C 2017, 121, 17882–17892. [Google Scholar] [CrossRef]
- Xu, L.; Stangland, E.E.; Mavrikakis, M. Ethylene versus ethane: A DFT-based selectivity descriptor for efficient catalyst screening. J. Catal. 2018, 362, 18–24. [Google Scholar] [CrossRef]
- Yang, M.L.; Zhu, Y.A.; Fan, C.; Sui, Z.J.; Chen, D.; Zhou, X.G. DFT study of propane dehydrogenation on Pt catalyst: Effects of step sites. Phys. Chem. Chem. Phys. 2011, 13, 3257–3267. [Google Scholar] [CrossRef]
- Salciccioli, M.; Chen, Y.; Vlachos, D.G. Microkinetic Modeling and Reduced Rate Expressions of Ethylene Hydrogenation and Ethane Hydrogenolysis on Platinum. Ind. Eng. Chem. Res. 2011, 50, 28–40. [Google Scholar] [CrossRef]
- Fattahi, M.; Kazemeini, M.; Khorasheh, F.; Darvishi, A.; Rashidi, A.M. Fixed-Bed Multi-Tubular Reactors for Oxidative Dehydrogenation in Ethylene Process. Chem. Eng. Technol. 2013, 36, 1691–1700. [Google Scholar] [CrossRef]
- Hook, A.; Massa, J.D.; Celik, F.E. Effect of tin coverage on selectivity for ethane dehydrogenation over platinum–tin alloys. J. Phys. Chem. C 2016, 120, 27307–27318. [Google Scholar] [CrossRef]
- Xiao, L.; Ma, F.; Zhu, Y.A.; Sui, Z.J.; Zhou, J.H.; Zhou, X.G.; Chen, D.; Yuan, W.K. Improved selectivity and coke resistance of core-shell alloy catalysts for propane dehydrogenation from first principles and microkinetic analysis. Chem. Eng. J. 2019, 377, 120049. [Google Scholar] [CrossRef]
- Sun, X.; Liu, M.; Huang, Y.; Li, B.; Zhao, Z. Electronic interaction between single Pt atom and vacancies on boron nitride nanosheets and its influence on the catalytic performance in the direct dehydrogenation of propane. Chin. J. Catal. 2019, 40, 819–825. [Google Scholar] [CrossRef]
- Zha, S.; Sun, G.; Wu, T.; Zhao, J.; Zhao, Z.J.; Gong, J. Identification of Pt-based catalysts for propane dehydrogenation via a probability analysis. Chem. Sci. 2018, 9, 3925–3931. [Google Scholar] [CrossRef]
- Zhu, J.; Yang, M.L.; Yu, Y.; Zhu, Y.A.; Sui, Z.J.; Zhou, X.G.; Holmen, A.; Chen, D. Size-dependent reaction mechanism and kinetics for propane dehydrogenation over Pt catalysts. ACS Catal. 2015, 5, 6310–6319. [Google Scholar] [CrossRef]
- Wang, J.C. Effects of surface step on molecular propane adsorption. Surf. Sci. 2003, 540, 326–336. [Google Scholar] [CrossRef]
- Saelee, T.; Namuangruk, S.; Kungwan, N.; Junkaew, A. Theoretical insight into catalytic propane dehydrogenation on Ni (111). J. Phys. Chem. C 2018, 122, 14678–14690. [Google Scholar] [CrossRef]
- Darvishi, A.; Davand, R.; Khorasheh, F.; Fattahi, M. Modeling-based optimization of a fixed-bed industrial reactor for oxidative dehydrogenation of propane. Chin. J. Chem. Eng. 2016, 24, 612–622. [Google Scholar] [CrossRef]
- Fattahi, M.; Khorasheh, F.; Sahebdelfar, S.; Zangeneh, F.T.; Ganji, K.; Saeedizad, M. The effect of oxygenate additives on the performance of Pt–Sn/γ-Al2O3 catalyst in the propane dehydrogenation process. Sci. Iran. 2011, 18, 1377–1383. [Google Scholar] [CrossRef]
- Barghi, B.; Fattahi, M.; Khorasheh, F. Kinetic modeling of propane dehydrogenation over an industrial catalyst in the presence of oxygenated compounds. React. Kinet. Mech. Catal. 2012, 107, 141–155. [Google Scholar] [CrossRef]
- Barghi, B.; Fattahi, M.; Khorasheh, F. The modeling of kinetics and catalyst deactivation in propane dehydrogenation over Pt-Sn/γ-Al2O3 in presence of water as an oxygenated additive. Pet. Sci. Technol. 2014, 32, 1139–1149. [Google Scholar] [CrossRef]
- Rostom, S.; de Lasa, H. Downer fluidized bed reactor modeling for catalytic propane oxidative dehydrogenation with high propylene selectivity. Chem. Eng. Process.-Process Intensif. 2019, 137, 87–99. [Google Scholar] [CrossRef]
- Choi, S.W.; Sholl, D.S.; Nair, S.; Moore, J.S.; Liu, Y.; Dixit, R.S.; Pendergast, J.G. Modeling and process simulation of hollow fiber membrane reactor systems for propane dehydrogenation. AIChE J. 2017, 63, 4519–4531. [Google Scholar] [CrossRef]
- Zhang, X.; You, R.; Wei, Z.; Jiang, X.; Yang, J.; Pan, Y.; Wu, P.; Jia, Q.; Bao, Z.; Bai, L.; et al. Radical Chemistry and Reaction Mechanisms of Propane Oxidative Dehydrogenation over Hexagonal Boron Nitride Catalysts. Angew. Chem. Int. Ed. 2020, 59, 8042–8046. [Google Scholar] [CrossRef]
- Cao, L.; Dai, P.; Zhu, L.; Yan, L.; Chen, R.; Liu, D.; Gu, X.; Li, L.; Xue, Q.; Zhao, X. Graphitic carbon nitride catalyzes selective oxidative dehydrogenation of propane. Appl. Catal. B Environ. 2020, 262, 118277. [Google Scholar] [CrossRef]
- Raman, N.; Maisel, S.; Grabau, M.; Taccardi, N.; Debuschewitz, J.; Wolf, M.; Wittkämper, H.; Bauer, T.; Wu, M.; Haumann, M.; et al. Highly effective propane dehydrogenation using Ga–Rh supported catalytically active liquid metal solutions. ACS Catal. 2019, 9, 9499–9507. [Google Scholar] [CrossRef]
- Boudeville, Y.; Kolb, M.; Pantazidis, A.; Marquez-Alvarez, C.; Mirodatos, C.; Elokhin, V. Monte-Carlo methods for simulating the catalytic oxidative dehydrogenation of propane over VMgO catalyst. Chem. Eng. Sci. 1999, 54, 4295–4304. [Google Scholar] [CrossRef]
- Shelepova, E.; Vedyagin, A.; Mishakov, I.; Noskov, A. Mathematical modeling of the propane dehydrogenation process in the catalytic membrane reactor. Chem. Eng. J. 2011, 176, 151–157. [Google Scholar] [CrossRef]
- Ghasemzadeh, K.; Alinejad, M.M.; Ghahremani, M.; Zeynali, R.; Pourgholi, A. Theoretical Study of Palladium Membrane Reactor Performance During Propane Dehydrogenation Using CFD Method. Indones. J. Chem. 2017, 17, 113–118. [Google Scholar] [CrossRef]
- Lian, Z.; Ali, S.; Liu, T.; Si, C.; Li, B.; Su, D.S. Revealing the Janus character of the coke precursor in the propane direct dehydrogenation on Pt catalysts from a kMC simulation. ACS Catal. 2018, 8, 4694–4704. [Google Scholar] [CrossRef]
- Ha, N.N.; Huyen, N.D.; Cam, L.M. Study on the role of SBA-15 in the oxidative dehydrogenation of n-butane over vanadia catalyst using density functional theory. J. Mol. Model. 2013, 19, 3233–3243. [Google Scholar] [CrossRef] [PubMed]
- Hà, N.N.; Hue, T.T.; Tho, N.M. Periodic Density Functional Theory Study of the Oxidative Dehydrogenation of n-butane on the (001) Surface of V2O5. AIP Conf. Proc. 2009, 1102, 287–290. [Google Scholar]
- Ha, N.N.; Huyen, N.D.; Cam, L.M. Ab-initio study of effect of basic MgO to V2O5 catalyst on oxidative dehydrogenation of C3H8 and n-C4H10. Appl. Catal. A Gen. 2011, 407, 106–111. [Google Scholar] [CrossRef]
- Rubio, O.; Herguido, J.; Menendez, M.; Grasa, G.; Abanades, J. Oxidative dehydrogenation of butane in an interconnected fluidized-bed reactor. AIChE J. 2004, 50, 1510–1522. [Google Scholar] [CrossRef]
- Soler, J.; Téllez, C.; Herguido, J.; Menéndez, M.; Santamarıa, J. Modelling of a two-zone fluidised bed reactor for the oxidative dehydrogenation of n-butane. Powder Technol. 2001, 120, 88–96. [Google Scholar] [CrossRef]
- Téllez, C.; Menéndez, M.; Santamarıa, J. Simulation of an inert membrane reactor for the oxidative dehydrogenation of butane. Chem. Eng. Sci. 1999, 54, 2917–2925. [Google Scholar] [CrossRef]
- Assabumrungrat, S.; Rienchalanusarn, T.; Praserthdam, P.; Goto, S. Theoretical study of the application of porous membrane reactor to oxidative dehydrogenation of n-butane. Chem. Eng. J. 2002, 85, 69–79. [Google Scholar] [CrossRef]
- Jackson, S.D.; Rugmini, S.; Stair, P.C.; Wu, Z. A comparison of catalyst deactivation of vanadia catalysts used for alkane dehydrogenation. Chem. Eng. J. 2006, 120, 127–132. [Google Scholar] [CrossRef]
- Wu, C.; Wang, L.; Xiao, Z.; Li, G.; Wang, L. Understanding deep dehydrogenation and cracking of n-butane on Ni (111) by a DFT study. Phys. Chem. Chem. Phys. 2020, 22, 724–733. [Google Scholar] [CrossRef]
- Li, X.; Yan, B.; Yao, S.; Kattel, S.; Chen, J.G.; Wang, T. Oxidative dehydrogenation and dry reforming of n-butane with CO2 over NiFe bimetallic catalysts. Appl. Catal. B Environ. 2018, 231, 213–223. [Google Scholar] [CrossRef]
- Wu, C.; Wang, L.; Xiao, Z.; Li, G.; Wang, L. Effects of van der Waals interactions on the dehydrogenation of n-butane on a Ni (111) surface. Chem. Phys. Lett. 2020, 137299. [Google Scholar] [CrossRef]
- Kostetskyy, P.; Nolan, C.M.; Dixit, M.; Mpourmpakis, G. Understanding Alkane Dehydrogenation through Alcohol Dehydration on γ-Al2O3. Ind. Eng. Chem. Res. 2018, 57, 16657–16663. [Google Scholar] [CrossRef]
- Byron, C.; Bai, S.; Celik, G.; Ferrandon, M.S.; Liu, C.; Ni, C.; Mehdad, A.; Delferro, M.; Lobo, R.F.; Teplyakov, A.V. Role of Boron in Enhancing the Catalytic Performance of Supported Platinum Catalysts for the Nonoxidative Dehydrogenation of n-Butane. ACS Catal. 2019, 10, 1500–1510. [Google Scholar] [CrossRef]
- Silvestre-Albero, J.; Sanchez-Castillo, M.A.; He, R.; Sepúlveda-Escribano, A.; Rodríguez-Reinoso, F.; Dumesic, J. Microcalorimetric, reaction kinetics and DFT studies of Pt–Zn/X-zeolite for isobutane dehydrogenation. Catal. Lett. 2001, 74, 17–25. [Google Scholar] [CrossRef]
- Casanave, D.; Ciavarella, P.; Fiaty, K.; Dalmon, J.A. Zeolite membrane reactor for isobutane dehydrogenation: Experimental results and theoretical modelling. Chem. Eng. Sci. 1999, 54, 2807–2815. [Google Scholar] [CrossRef]
- Van der Mynsbrugge, J.; Janda, A.; Mallikarjun Sharada, S.; Lin, L.C.; Van Speybroeck, V.; Head-Gordon, M.; Bell, A.T. Theoretical analysis of the influence of pore geometry on monomolecular cracking and dehydrogenation of n-butane in Brønsted acidic zeolites. ACS Catal. 2017, 7, 2685–2697. [Google Scholar] [CrossRef]
- Janda, A.; Vlaisavljevich, B.; Lin, L.C.; Smit, B.; Bell, A.T. Effects of zeolite structural confinement on adsorption thermodynamics and reaction kinetics for monomolecular cracking and dehydrogenation of n-butane. J. Am. Chem. Soc. 2016, 138, 4739–4756. [Google Scholar] [CrossRef]
- Wang, G.; Zhang, S.; Zhu, X.; Li, C.; Shan, H. Dehydrogenation versus hydrogenolysis in the reaction of light alkanes over Ni-based catalysts. J. Ind. Eng. Chem. 2020, 86, 1–12. [Google Scholar] [CrossRef]
Publisher’s Note: MDPI stays neutral with regard to jurisdictional claims in published maps and institutional affiliations. |
© 2020 by the authors. Licensee MDPI, Basel, Switzerland. This article is an open access article distributed under the terms and conditions of the Creative Commons Attribution (CC BY) license (http://creativecommons.org/licenses/by/4.0/).