Article

Soot Combustion over Niobium-Doped Cryptomelane (K-OMS-2) Nanorods—Redox State of Manganese and the Lattice Strain Control the Catalysts Performance

1
Faculty of Chemistry, Jagiellonian University, ul. Gronostajowa 2, 30-387 Krakow, Poland
2
Institute of Nuclear Physics, Polish Academy of Sciences, ul. Radzikowskiego, 152, 31-342 Krakow, Poland
3
Institute of Catalysis for Energy and Environment, College of Chemistry and Chemical Engineering, Shenyang Normal University, Shenyang 110034, China
*
Authors to whom correspondence should be addressed.
Catalysts 2020, 10(12), 1390; https://doi.org/10.3390/catal10121390
Submission received: 19 October 2020 / Revised: 16 November 2020 / Accepted: 25 November 2020 / Published: 28 November 2020
(This article belongs to the Special Issue Catalytic Combustion of Soot)

Abstract

:
A series of Nb-doped (0–23 wt%) cryptomelane catalyst (Nb-K-OMS-2) was synthesized and thoroughly characterized by XRD, TEM/EDX, XRF, XPS, XAS, UV-Vis, and Raman techniques corroborated by the work function measurements. The obtained catalysts were tested for soot oxidation (Printex U) in model tight and loose contact modes. It was shown that the catalytic properties of the Nb-K-OMS-2 are controlled by the amount of Nb dopant in a strongly non-monotonous way. The introduction of niobium gives rise to the strain in the cryptomelane lattice, accompanied by significant Mn+3/Mn+4 ratio variations and concomitant work function changes. The isotopic exchange experiments revealed that the catalytic activity of the Nb-OMS-2 catalysts in soot combustion proceeds via the pathways, where both the activated suprafacial 18O and the surface 16O2− species participate together in the reaction. The niobium doping level controls the non-monotonous changes of the catalyst work function and the lattice strain, and variations of these parameters correlate well with the observed deSoot activity. To our best knowledge, the role of the lattice strain of the cryptomelane catalysts was documented for the first time in this study.

Graphical Abstract

1. Introduction

During combustion of fossil fuels in diesel engines soot particles are produced, being one of main components of the particulate matter (PM) [1]. Depending on many variables, the composition of PM is not constant, and can be described as a mixture of carbon in amorphous and crystalline forms, chain hydrocarbons, polycyclic aromatic hydrocarbons (PAH), nitro-PAH, as well as soluble organic fractions (SOF) [2]. The soot particles due to their tiny size (usually <2.5 μm) and chemical composition have a negative impact on both the environment and human health, as well [3,4]. Steady strengthening of the standards of PM emission from diesel engines (such as EURO 6) becomes a driving force for the development of new technologies for efficient soot emission reduction [5].
Typically, the soot particles are removed using ceramic DPFs filters, which can lower soot emission up to 99%. However, their use involves a mechanical filtration and combustion of the accumulated soot particles followed by subsequent regeneration [6,7]. The combustion temperature of soot particles (550–650 °C) is much higher than the temperatures of diesel exhaust gases (200−450 °C), therefore intensive fundamental and applied studies are carried out on the development of soot oxidation catalysts that may work at the relatively low temperature window. One of the strategies for diesel soot oxidation consists of the application of catalytic particle filters (CDPF) based on noble metals [8,9]. The shortage of the platinum group metals imposes a high price of such CDPF catalysts, therefore their cheaper alternatives are still receiving significant research attention [10].
Metal oxides of the perovskite and spinel structures, ceria-based systems, potassium–manganese oxide such as birnessite (K-OL) [11], or cryptomelane (K-OMS-2) [12,13], and many other transition metal oxide systems containing alkali cations (K, Na, Li, Rb, Cs) as surface or bulk dopants have been examined as the soot oxidation catalysts [14,15,16]. Among them, cryptomelane catalysts were the subject of many studies [9,11,12,13], as they can be produced from inexpensive substrates, and while exhibiting promising activity in the deSoot reaction, they are environmentally safe. Particular attention was paid to cryptomelane containing potassium since the presence of the loosely bound K+ ions within the channels is beneficial for the catalytic activity [12,13]. However, overheating of the K-OMS-2 catalysts, might lead to an excessive K loss, and decrease of the CDPF activity in subsequent cycles of the catalyst operation [17,18]. Improvement of the activity can be obtained by incorporation of other elements (such as Ag, In, Mg, Al, W, V, Fe, Co, Ni, Cu, Zn) into the octahedral molecular sieve matrix [18,19,20,21]. Manganese substitution by other metals affects both the physical and chemical properties of the cryptomelane catalysts [13,20], influencing the aspect ratio of the crystallites, the degree of their aggregation, thermal stability, the Mn3+/Mn4+ ratio, the electric conductivity, and catalytic activity. In most cases, the extent of Mn substitution in the cryptomelane octahedra with another metal is less than 5% [12]. However, preservation of the molecular sieve structure has been observed even at the doping levels up to 30% [20].
To establish the functionalization ability of K-OMS-2, replacement of Mn by ions of similar ionic radii, as mentioned above, were examined showing that the resultant materials maintain the one dimensional 2 × 2 octahedral framework, which is characteristic of the cryptomelane structure [12,13,22,23,24,25,26]. However, the substitution of transition metals of larger size for manganese (e.g., Nb, Mo, W for Mn) in the octahedral framework, and its impact on the changes in morphology, particle size, and deSoot activity of the resultant catalytic material has been investigated less intensively [20,21,27]. The introduction of larger elements allows obtaining not only cryptomelane with a larger volume of the channels, when compared to the non-modified material, but also materials in which the charge balance of the octahedral Mn sites is influenced by the presence of the penta- or hexa-valent metal cations within the K-MOS-2 structure. Furthermore, Wasalathanthri et al. [20] reported that incorporation of the Nb ions into the K-OMS-2 framework prevents sintering of cryptomelane crystals during calcination, and promotes the activity of the catalysts in the selective oxidation of methanol.
Recently, a significant improvement of the catalytic activity in loose contact soot oxidation upon vanadium doping of K-OMS-2 has been reported by us [13]. Therefore, a series of Nb/K-OMS-2 catalysts differing in the amount of niobium (up to 23 wt% of Nb) was prepared to elucidate the effect of the concentration of niobium, its ionic radius, and the valence state on the physicochemical properties of the cryptomelane catalysts (work function, lattice strain, and redox states of Mn) in the context of their activity in soot oxidation. The synthesized samples (Nb/K-OMS-2) were characterized in detail by spectroscopic and microscopic techniques with respect to their surface and bulk composition, structure, and morphology. Their catalytic activity in soot combustion was tested in the tight and loose contact modes, using a Degussa-PrintexU as a model soot. According to our knowledge, the cryptomelane promoted with niobium was not examined in the context of catalytic soot combustion so far.

2. Results and Discussion

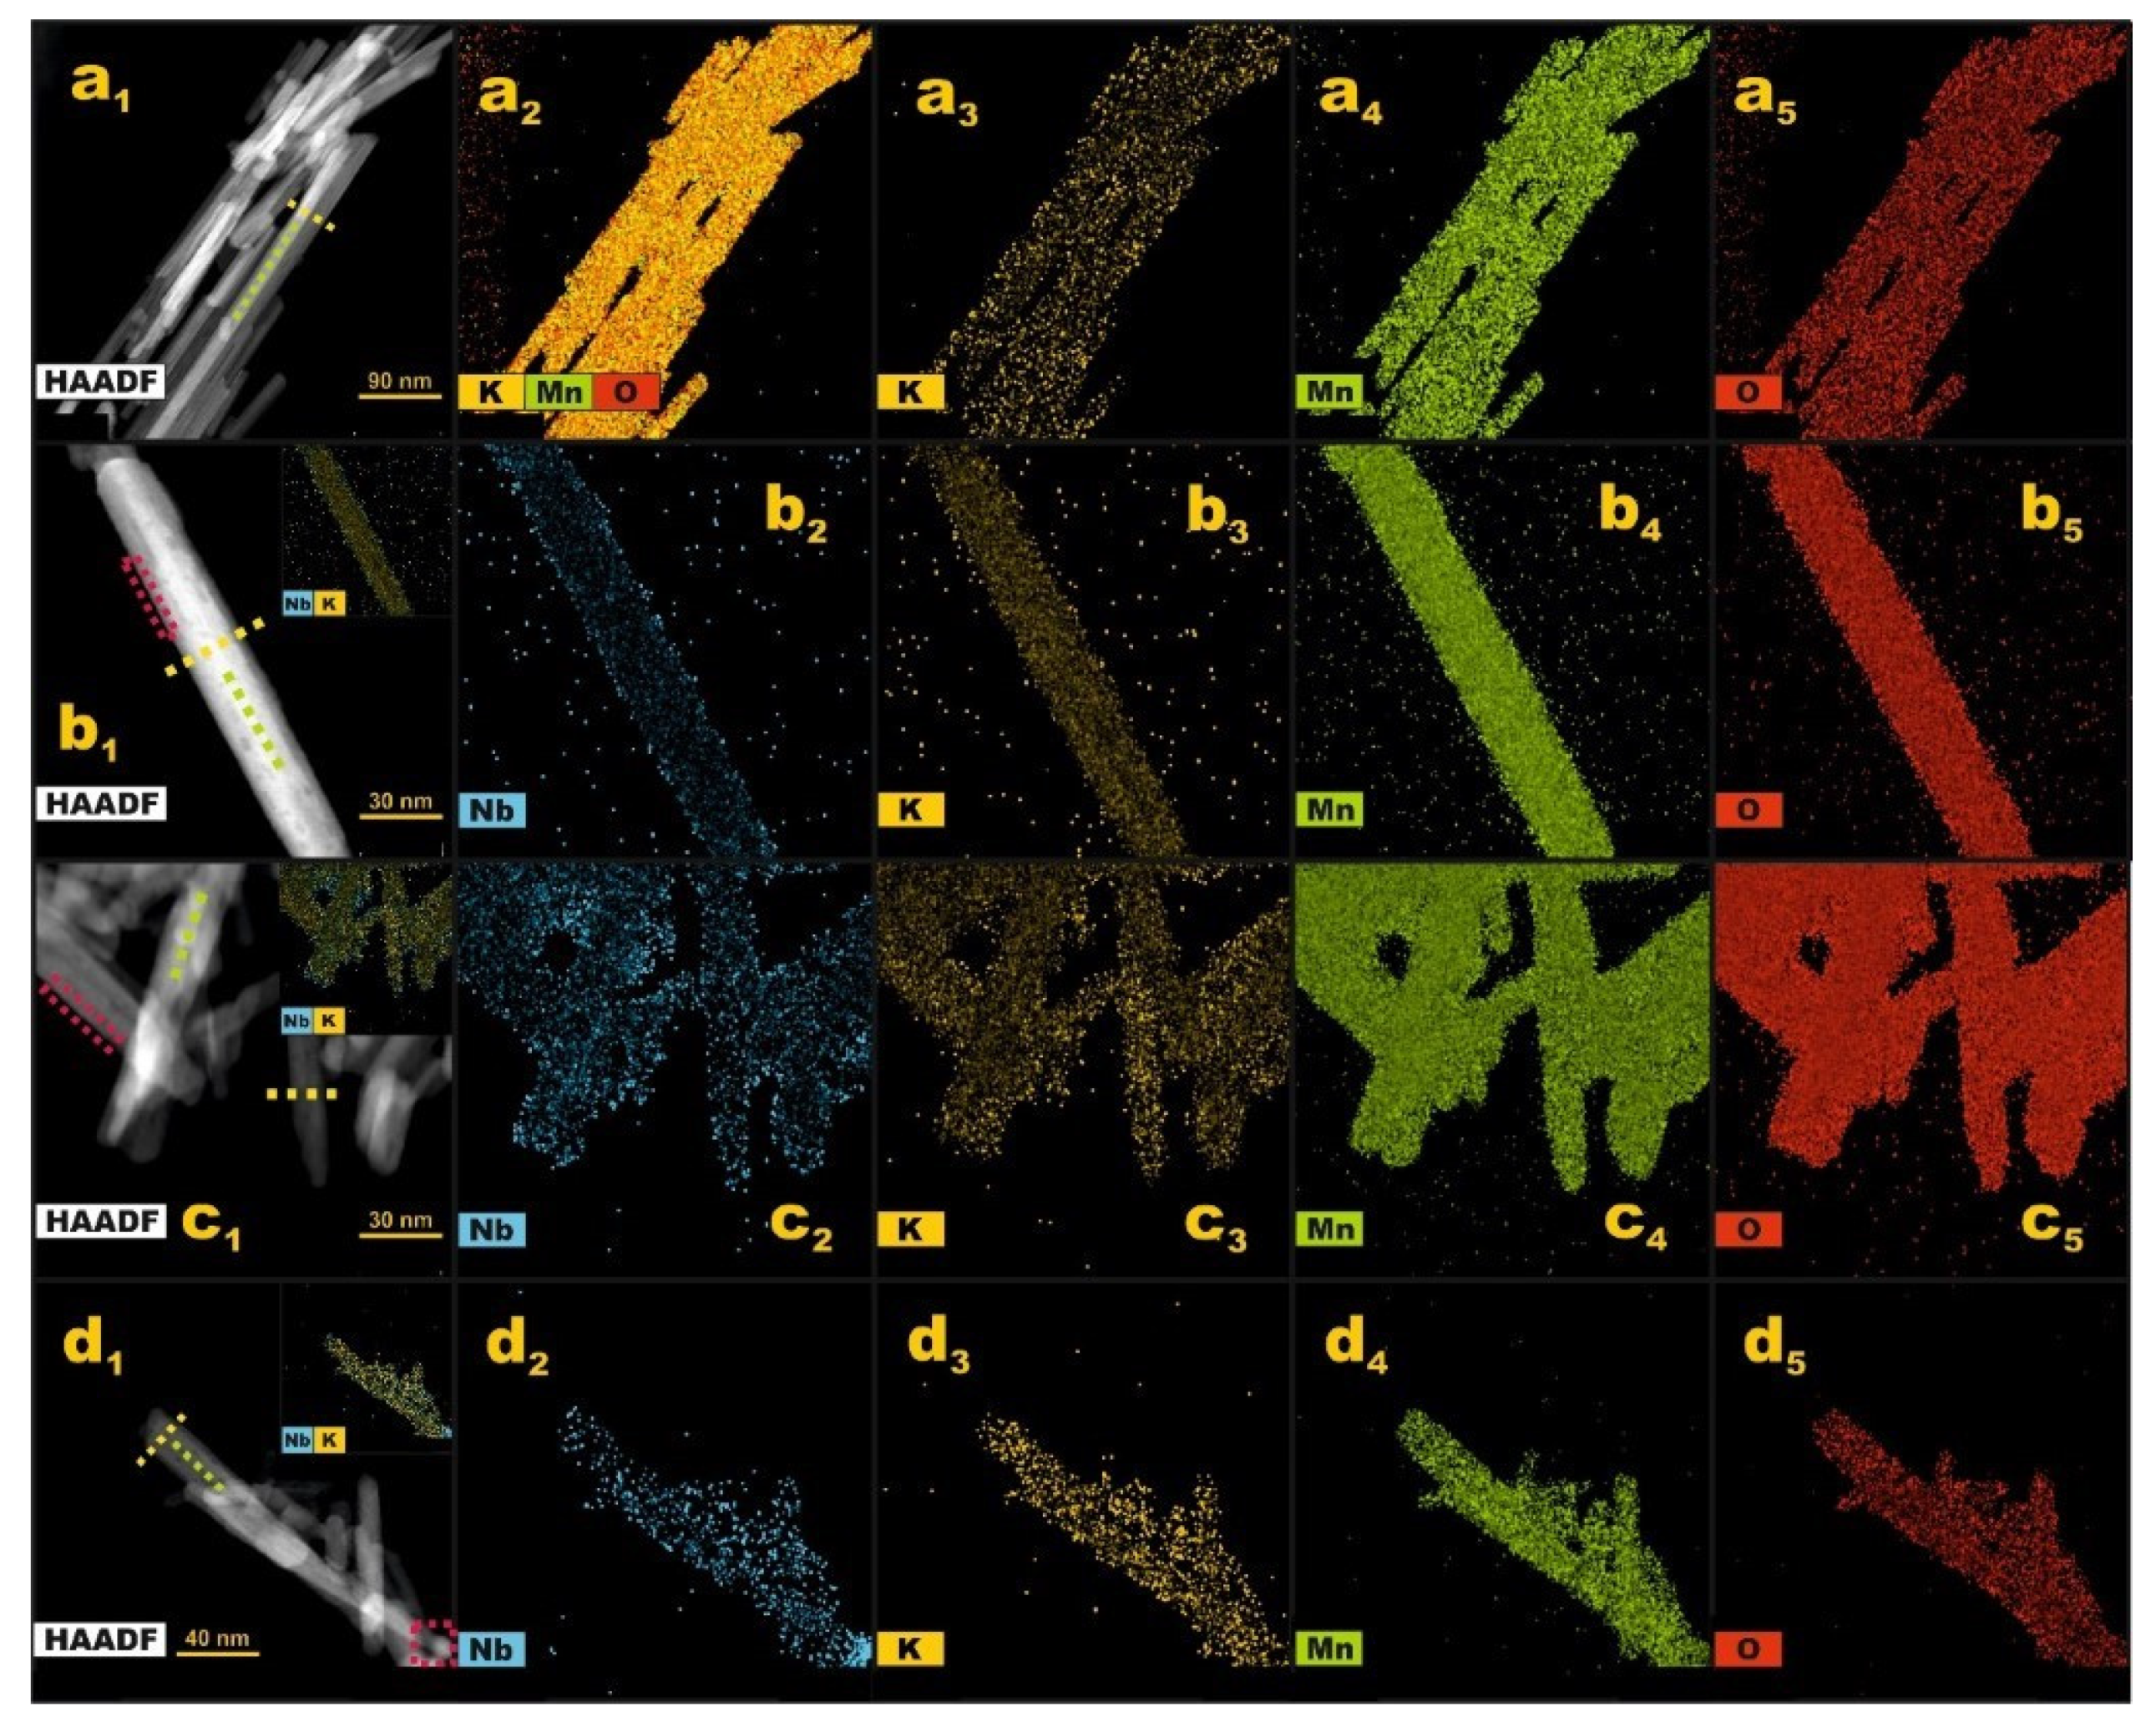
2.1. Structural and Morphological Characterization

The synthesized samples were examined by means of the X-ray diffraction and the obtained results are summarized in Figure 1a. As it can be seen, the well-developed reflection peaks attributed to the cryptomelane KMn8O16 phase (ICSD-59159) can be observed for all the investigated samples [28]. The reflections with large “l” values in the Miller (hkl) [29] labeling exhibit a narrower width of the corresponding peaks in comparison to those with the (hk0) indices, which implies a pronounced shape anisotropy of the cryptomelane nanocrystals, confirmed by the TEM analysis (see below). Along with an increasing niobium loading for the doped cryptomelane samples, a broadening of the XRD peaks assigned to KMn8O16 is also noticeable, indicating the presence of crystal size/strain effects [30]. For the Nb/K-OMS-2 samples containing 14 and 23 wt% of Nb, some additional reflections (marked with blue diamond signs) at 22.7, 24.4, and 30.0° 2Θ appear. They can be attributed to minor phases of potassium niobate KNbO3 (ICSD-9532 and ICSD-90920) [17] or to partially segregated Mn2O3 (ICSD-159865) [31], as it can be inferred from the comparison with Figure S1.
The average size of cryptomelane crystals, assessed by the Williamson-Hall method [32], varied in the range from 21 to 41 nm. It was observed that with the increasing niobium concentration up to 4 wt%, the size of crystals increased from 30 to 41 nm and then decreased to 21 nm, as can be inferred from Table 1. The variation of the lattice strain (ε) upon Nb doping (Table 1 and Figure 1b) initially increases from 0.52% to 0.84–0.87 wt% for the niobium content of 0.3–0.4 wt%, and then decreases to 0.35% for 3 wt% of Nb. Above this loading, it rises again to the level around 0.50–0.60%. Such non-linear behavior results from combined effects of the nonhomogeneous distribution of Nb within the cryptomelane nanorods with the increasing doping, and also from the Jahn-Teller distortion [33]. This issue is discussed below in more detail.
The Raman spectra collated in Figure 1c corroborate the XRD results. Among the 6Ag + 6Bg + 3Eg Raman active modes, predicted by the C4h factor group analysis of the cryptomelane I4/m space group, seven bands were observed in the case of the investigated samples. The two intense peaks at 630 and 574 cm−1, both of the Ag symmetry, are associated with the Mn–O stretching vibrations of the edge sharing octahedra in the cryptomelane structure [28]. The intensity of the band at 630 cm−1 that strongly depends on the nature of cations present in the tunnels, may be connected with the Mn–O vibrations perpendicular to the MnO6 double chains [34]. The band at 575 cm−1, in turn, can be associated with displacements of the oxygen atoms relative to the manganese cations along the octahedral chains. The third intense and narrow band at 180 cm−1 is considered as a vibration resulting from the translational motion of the MnO6 octahedra. The weaker bands at 386 cm−1 is associated with the O–Mn–O bending vibrations, whereas the band at 758 cm−1 may be related to the antisymmetric Mn–O stretching vibrations [34]. The thermal stability for synthesized materials were plotted in Figure S2.
The positions of the most intense Raman peaks characteristic of cryptomelane (180, 574, and 630 cm−1) were plotted in Figure 1d as a function of the Nb concentration in the samples. One can recognize immediately, that the variations of the peak positions with the Nb content is strongly non-monotonous. Whereas, the A1g peaks due to breathing vibrations of the Mn–O octahedra are apparently sensitive to the strain changes revealed by the XRD analysis, the shifts of the band at 180 cm−1 due to the deformation vibrations reflect fairly well the particle size variation. Indeed, it has been well documented that small dimensions of the light scattering nanocrystals lead to a shift and broadening of the first order Raman peaks through a phonon confinement effect. The compressive stress imposed by the introduction of Nb ions with a larger ionic radius than that of Mn4+ affects the 630 cm−1 Raman line by a blueshift [35]. Once the strain is released upon crossing the Nb loading of 3 wt% (see Figure 1b), the band position moves toward lower frequency values, and then rises again in parallel with the strain as the niobium content increases. The observed non-monotonous changes are associated with the varying state of Nb in the K-OMS-2 matrix with the increasing doping level, leading to a substitutional disorder that can introduce changes in the position of the Raman bands, as observed previously for the Zn1−xMnxO system [36]. Analogous shifting of the corresponding Raman bands has also been observed in the case of TiO2, and ascribed to distortions of the TiO6 octahedra under the influence of the lattice strain and confinement effect associated not only with small physical dimensions of the nanocrystals, but also by the presence of anionic vacancies [36].
The values of specific surface area (SSA) of the seven different niobium-loaded samples are compiled in Table 1. For the K-OMS-2 sample, the value of SSA was equal to 57 m2·g−1, while in the case of Nb/K-OMS-2 samples, it varies from 57 to 75 m2·g−1. At low levels of the Nb doping (0.3 and 0.4 wt%) the SSA value remains unaltered, and steadily increases with the niobium content to reach the value of 75 m2·g−1 above 14 wt% of Nb.
A detailed analysis of the morphology, structure, and elemental composition of bare- and niobium-doped cryptomelane nanorods is presented in Figure 2 and Figure 3, as well as Table 2. Conventional TEM imaging (Figure 2(a1)) of the cryptomelane specimens revealed their clear nanorod shape with a high value of the average aspect ratio (<AR> = 20.7), which grow along the [1] direction with a uniform diameter. The length of the nanorods varies from 170 to 530 nm with the average value of 350 nm. The nanorods are apparently woven into a ball-like shape. As it can be inferred from the SAED patterns (Figure 2(a2)), the observed nanorods preserve well the phase integrity of the cryptomelane structure (confirmed by the diffraction rings marked in yellow, Figure 2(a2)), as well as the high monocrystallinity of the nanorods. As shown in the high resolution TEM images (Figure 2(a3,a4)), the nanorods exhibit occasional structural line defects such as edge dislocations marked in yellow in Figure 2(a4). Moreover, the nanorods exhibit morphological features of elongated shape resulting from their irregular thickness (marked by a green arrow in Figure 2(a4)), which appear in each examined sample regardless of the amount of the Nb dopant. Despite these defects, the nanorods possess sharp edges with well-developed faceting dominated by the (110) and (111) planes.
Niobium addition modifies the morphology of the nanorods. For the sample doped with 3 wt% of niobium, the nanorods still preserve the elongated morphology (Figure 2(b1,b3)), however, their aspect ratio decreases significantly (<AR> = 5.9). Their length varies from 25 to 170 nm with the average value of 87 nm. The SAED patterns confirm the sole presence of the cryptomelane phase (Figure 2(b2)), however, the diffraction rings are slightly blurred showing that the sample crystallinity is reduced. High resolution images (Figure 2(b3,b4)) confirm this observation. For the sample doped with 7 wt% of niobium (Figure (2c1)), the length of the nanorods changes from 56 to 190 nm with the average values of 123 nm (<AR> = 8.2). The well-resolved SAED patterns (Figure 2(c2)) along with the high resolution images (Figure 2(c3,c4)) confirm again the presence of the highly crystalline cryptomelane phase. The termination planes are, however, slightly irregular. The most dramatic changes were observed for the sample containing 23 wt% of niobium. The nanorods are evidently shortened (Figure 2(d1)), and their length vary from 20 to 95 nm with the average of 47 nm (<AR> = 3.8). Yet, the SAED patterns (Figure 2(d2)) prove that they still preserve the cryptomelane phase. As can be inferred from the high resolution TEM images (Figure 2(d3,d4)), the edges are now corrugated and rather poorly defined, whereas the interiors are still crystalline, revealing the importance of Nb for the nanocrystal growth at higher doping levels. For the sake of clarity, all these results are additionally summarized in Table 2.
To supplement morphological and structural data, an analysis of the elemental composition of each sample was performed by means of the EDX technique, and the obtained results are presented in Figure 3.
The EDX analysis of the bare cryptomelane, performed along the (110) direction in the region presented in HAADF STEM (Figure 3(a1)), revealed an overall elemental composition of the observed nanorods (K/Mn = 0.12, Mn/O = 0.63, Figure 3(a2)), and an even distribution of the constituting K, Mn, and O elements (Figure 3(a3–a5)). In order to verify a possible spatial variation of the elemental composition of the cryptomelane nanorods, a quantitative EDX analysis was performed along (green dashed line in Figure 3(a1)) and across (yellow dashed line in Figure 3(a1)) the selected nanorods. The results show that the K/Mn and O/Mn ratios along and across the nanorods are uniform and consistent with the overall K/Mn and O/Mn values, thus there is no significant change in the nanorods composition across the crystallites within the spatial resolution limit of the EDX technique.
For the nanorods doped with 3% of Nb, an overall composition of K/Mn = 0.14 and Mn/O = 0.61 in the region of interest shown in Figure 3(b1) was determined. The spatial distribution of the Nb, K, Mn, and O elements is shown in Figure 3(b2–b5). As it can be seen in Figure 3(b2), the niobium dopant exhibits an appreciable tendency to accumulate on the surface of the cryptomelane nanorods. However, an EDX quantitative analysis performed for the region presented in Figure 3(b1) (red dashed line) showed that the Nb/Mn ratio calculated for this region is consistent with the Nb/Mn ratio calculated for the overall image (0.02), implying that the EDX technique is not sensitive enough to quantify the corresponding changes in the Nb distribution in an adequate way at such doping levels. The EDX analysis performed along (green dashed line in Figure 3(b1)) and across (yellow dashed line in Figure 3(b1)) the selected nanorods shows that the corresponding K/Mn and O/Mn ratios are consistent with the total K/Mn and O/Mn values.
For the cryptomelane nanorods doped with 7% of Nb (Figure 3(c1)), the overall composition was equal to K/Mn = 0.09 and Mn/O = 0.68. The distribution of Nb, K, Mn, and O over the examined nanorods is presented in Figure 3(c2–c5). The niobium component exhibits a tendency to accumulate on the surface of the nanorods, which was also observed by the quantitative EDX line scan analysis (red dashed line in Figure 3(c1)). The calculated Nb/Mn ratio (0.11) is higher in the subsurface region in comparison to the overall composition (0.04), whereas the K/Mn and O/Mn ratios remain constant across and along the nanorods.
In the case of the samples doped with 23% of Nb (Figure 3(d1)), the overall composition is equal to K/Mn = 0.11 and Mn/O = 0.59. The distribution of the Nb, K, Mn, and O elements is shown in Figure 3(d2–d5), respectively. At such level of doping, niobium has the tendency not only to accumulate on the surface of the nanorods, but also to agglomerate and form small Nb clusters, as clearly seen in Figure 3(d2). The Nb/Mn ratio calculated for one of the clusters (0.17) is accordingly much higher than for the overall composition (0.06). In contrast to Nb, no spatial deviations of the Mn and O ratio were observed.
Summarizing the EDX results, it can be inferred that whereas the K/Mn ratio is nearly constant (0.12 ± 0.02), the changes in the Mn/O ratio are much more pronounced and exhibit a non-monotonous character implying that the oxidation state of manganese changes also in such fashion with the Nb-loading (see below). The observed segregation of niobium at the highest doping level is consistent with the XRD results where the spurious niobate phase was detected.

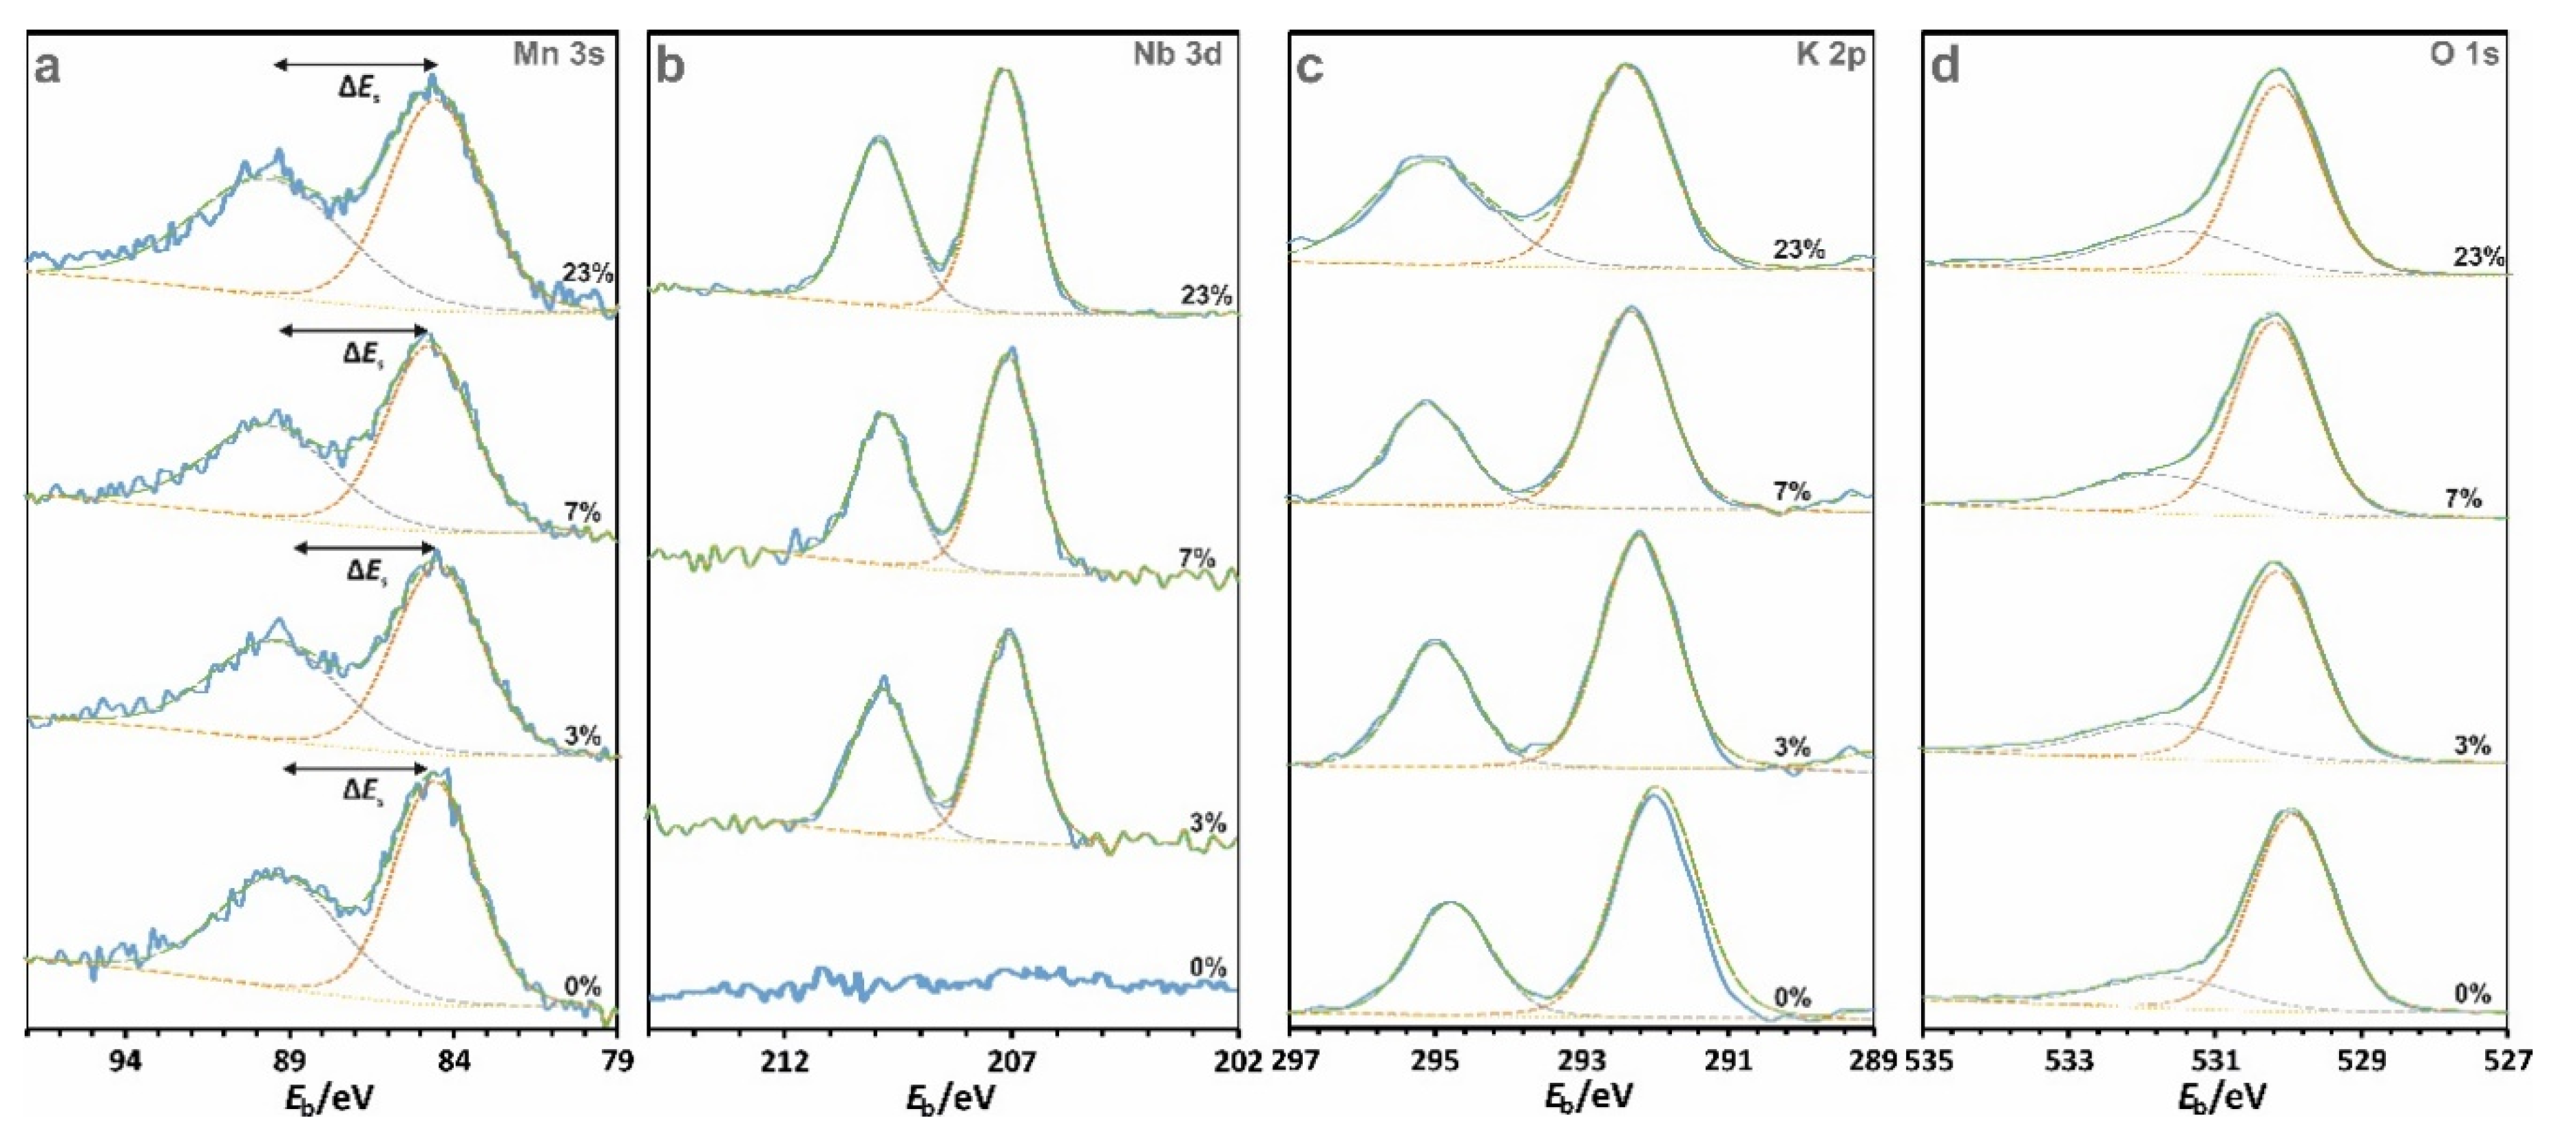
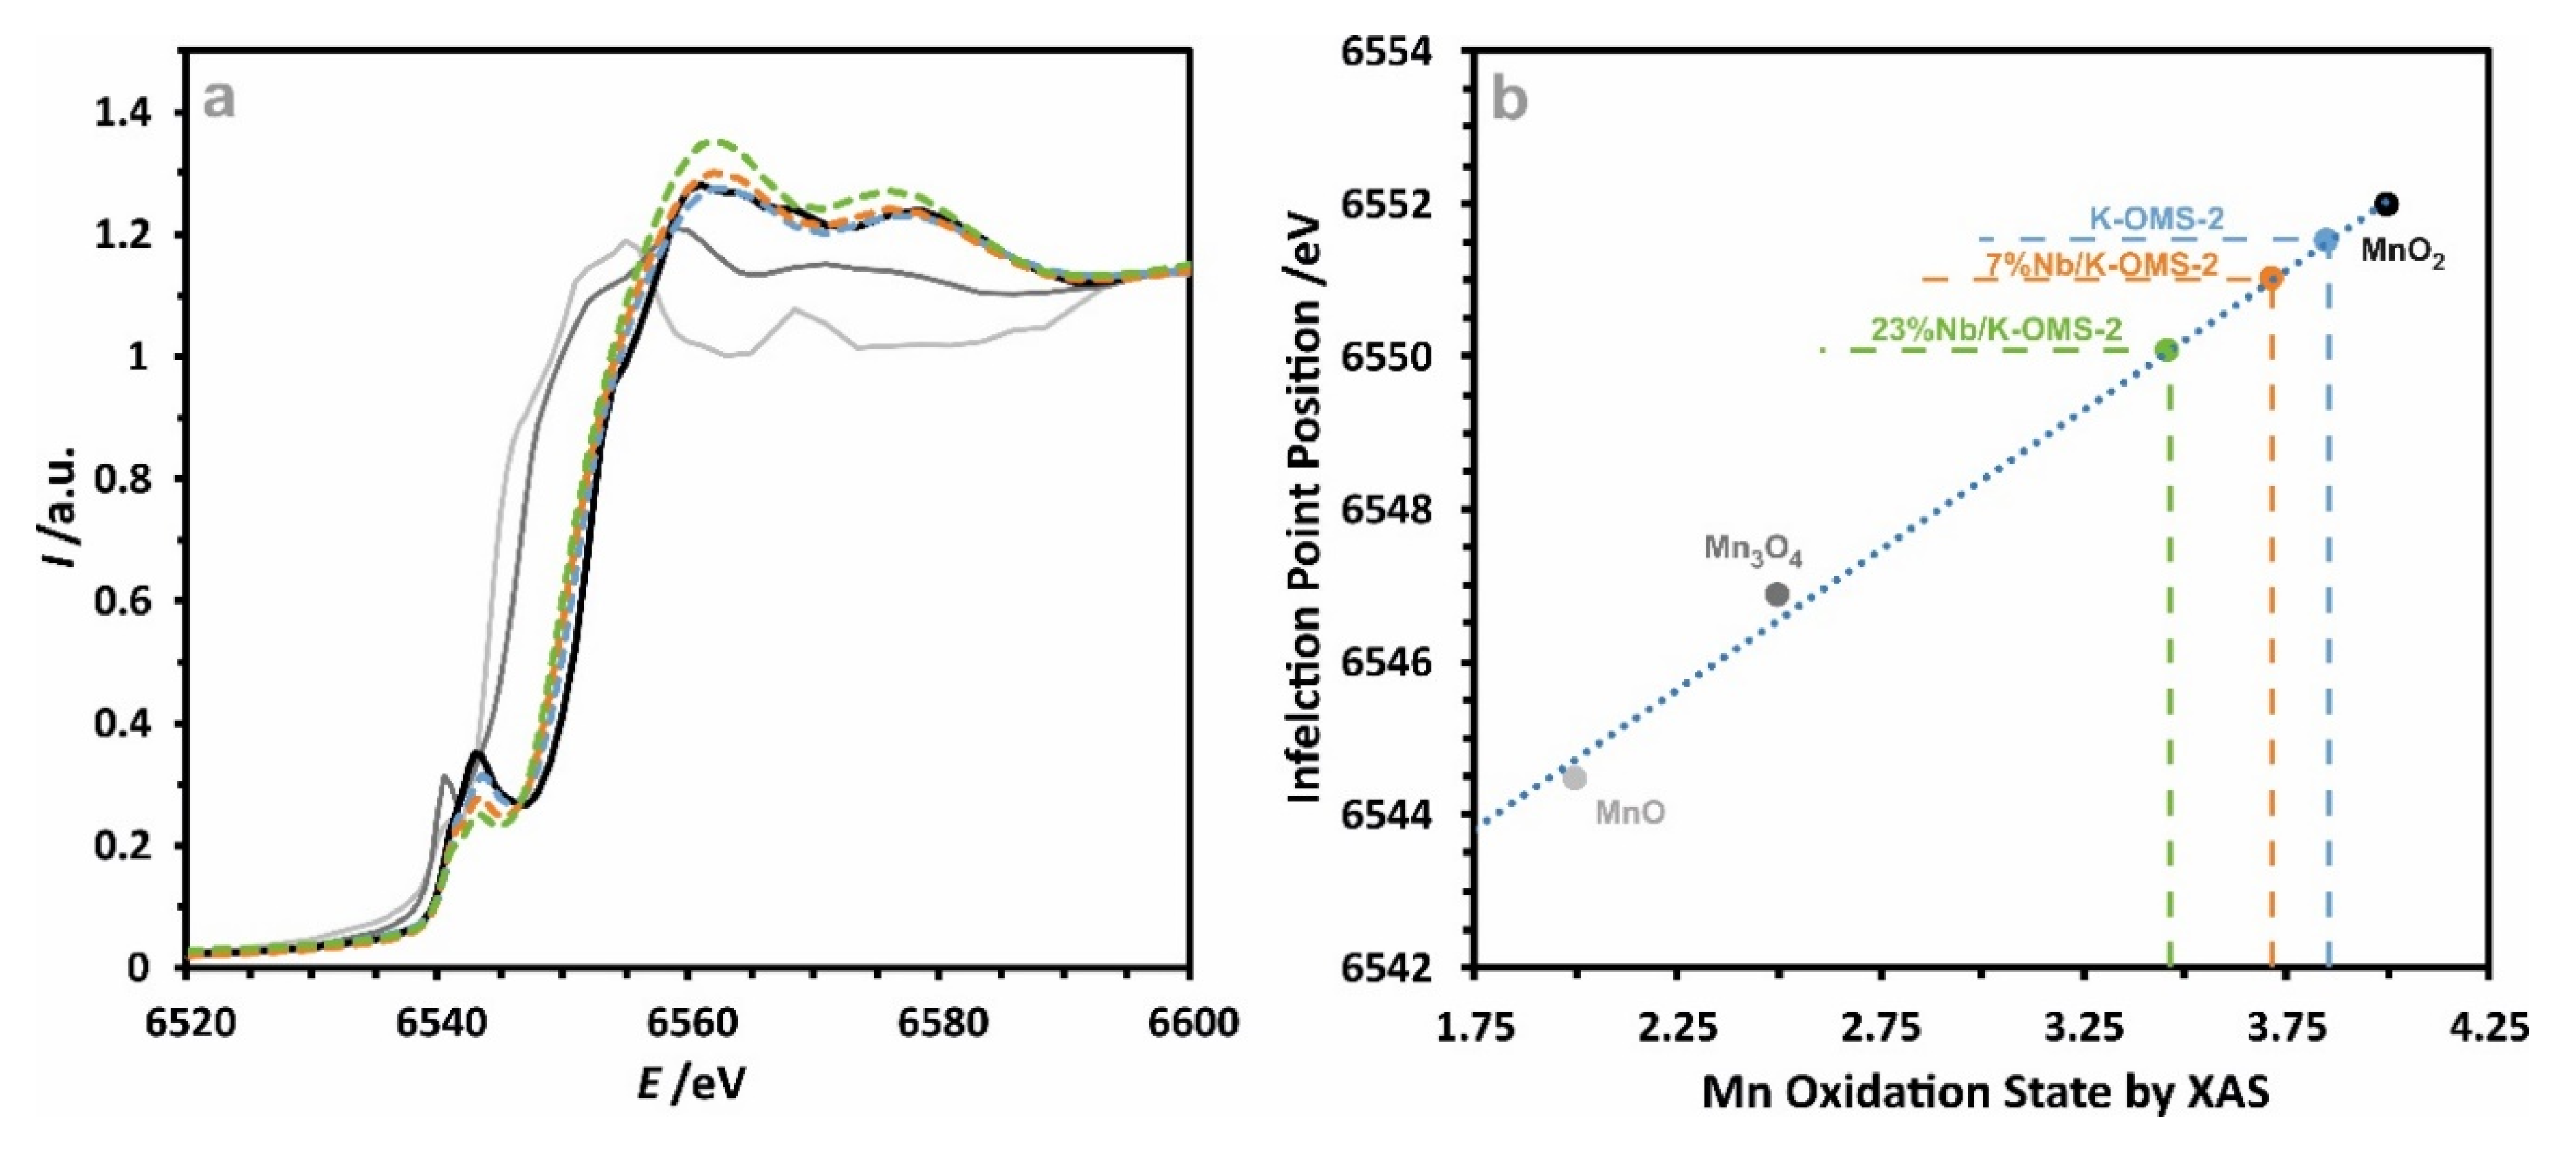
2.2. Chemical Composition and Manganese Redox State Analysis

The microscopic studies were corroborated by XFR, XPS, XAS, and UV-Vis measurements to determine the bulk and surface composition of the samples, and to obtain an insight into the oxidation state of manganese and niobium cations.
The optical absorption spectra of the Nb/K-OMS-2 nanorods are shown in Figure S4. For all the measured samples they are featured by broad absorption bands ranging from 200 to 600 nm with three maxima revealed by the curve fitting and centered around 210–230, 260–290, and 380–430 nm. The individual bands are slightly shifted with the increasing Nb content. Following the literature, the observed components may be associated with the O2−→Mn2+, O2−→Mn3+, and O2−→Mn4+ charge transfer transitions along with a mixture of the Mn d–d transitions in the partially distorted octahedral crystal field of the cryptomelane framework [37,38,39,40,41]. Due to a possible overlapping of the absorption bands below 400 nm [42,43], it is rather difficult to identify any characteristic features in the recorded spectra attributable to the presence of niobia or niobates. However, it is apparent that the positions and relative intensities of the observed bands are influenced by the Nb presence. This point was further elucidated employing the XPS spectroscopy.
For all the Nb/K-OMS-2 samples, more detailed XPS analyses in the C 1s, K 2p, Mn 3s, Mn 2p, and Nb 3d regions were performed, and the representative spectra of the K-OMS and Nb/K-OMS-2 samples (containing 3, 7, and 23 wt% of niobium) are presented in Figure 4, as an example.
An analysis of the Mn 2p region to determine changes in the oxidation state in the examined samples is burdened with some uncertainty [44]. Therefore, following the previous literature [45,46,47,48], the observed pronounced multiplet splitting of the Mn 3s band (ΔEs), shown in Figure 4a, was used for a more reliable assessment of an average oxidation state (AOS) of the Mn cations.
The ΔEs splitting originates from the exchange coupling between the 3s hole and the 3d electrons of Mn, and depends on the spin multiplicity (2S + 1) of the given 3dn configuration (the peak at a lower energy corresponds to the parallel spin alignment, whereas the peak at a higher energy to the anti-parallel one). The lower the oxidation state of the Mn ions, the larger the splitting between the main 3s band and the satellite peak, which is accounted for by the simple empirical formula [49]:
AOS = 8.956 − 1.126·ΔEs
The obtained AOS values, vary in the range from 3.76–3.50, with an exception of the samples with the highest Nb doping (23 wt%), where it drops to 3.32. The variation of the average oxidation state of Mn as a function of the niobium doping level is plotted in Figure 7b. The position of the Nb 3d5/2 band (Figure 4b) varies only slightly, from 206.95 to 207.28 eV (Table 3), and is diagnostic for the oxidation state +5 of the niobium dopant in all the samples [50]. The changes in the potassium XPS signal (Figure 4c) are irrelevant, implying that its chemical state is not altered by the Nb doping. In contrast, the oxygen 1s band, with two distinct components is clearly sensitive to the presence of niobium. The O 1s spectral region was deconvoluted into the Mn–O–Mn lattice oxygen (Olatt) at 529.7–530.0 eV and surface oxygen/Mn–Osurf (OH) at 531.4–531.7 eV. A comparison of the relative areas shows that the contribution of surface oxygen in all samples (shown in Table 3) changes with the Nb loading. It should be noted here, that the surface oxygen at 531.4 eV was considered to be more reactive in the oxidation processes owing to its presumable higher mobility [51].
The chemical bulk and surface compositions of all the Nb/K-OMS-2 and bare K-OMS-2 samples were evaluated by XRF and XPS techniques, and the results are summarized in Table 3. A comparison of the XPS and XRF results shows that at lower niobium loadings (up to 4 wt%), the surface niobium concentration is higher than that in the bulk, while for the higher Nb doping levels, the surface concentration is apparently lower. The presence of which is in line with the segregation of niobium, as revealed by the TEM/EDX results (Figure 2 and Figure 3), can be explained by the formation of potassium niobate entities on the surface (see XRD results, Figure 1).
Generally, the NbXPS/NbXRF ratio decreases steadily with the niobium content. The high proportion of potassium on the surface of the Nb/K-OMS-2 containing 23 wt% of niobium, in comparison with the remaining samples, results also from scarce potassium niobate formation during the thermal treatment. Moreover, niobium addition to the K-OMS-2 led to an appreciable variation of the MnXPS/OXPS ratio (Table 3), and this value even for the highest Nb doping (0.56) is above the nominal one (~0.5), implying the presence of abundant oxygen vacancies in the subsurface region.
Noting a significant modification of the catalysts stoichiometries, X-ray absorption spectroscopy (XAS) was employed to independently determine the average oxidation state of Mn in the Nb/K-OMS-2 samples with 0, 7, and 23 wt% of the niobium content. The measured XAS data for the examined samples, as well as for manganese oxide references are plotted in Figure 5a. The inflection point analysis was employed to correlate the variation in the energy position of the absorption edge with an average oxidation state of Mn in the Nb/K-OMS-2 samples. The relevant calibration curve is shown in Figure 5b, together with the individual data points for the MnO, Mn3O4, and MnO2 references. For the bare K-OMS-2, the average Mn oxidation states amounts to AOS = 3.85 ± 0.1, while the systematic Mn reduction is observed for 7 and 23 wt% of the Nb content with the Mn oxidation state values of 3.72 ± 0.1 and 3.46 ± 0.1, respectively.
The observed significant excess of Mn is consistent with the EDX, XPS, and XAS results described above, and implies that apart from Mn3+ a fraction of the manganese cations is reduced also to Mn2+. Indeed, their presence (along with Mn4+ and Mn3+) was implied by analysis of the UV spectra (see Figure S4). Therefore, the resultant formulation of the examined samples can be expressed as Mn4+1−2xyMn3+2xMn2+yO2−2xy, and the possible x and y values that are compatible with the observed AOS of Mn are shown in Figure S5.

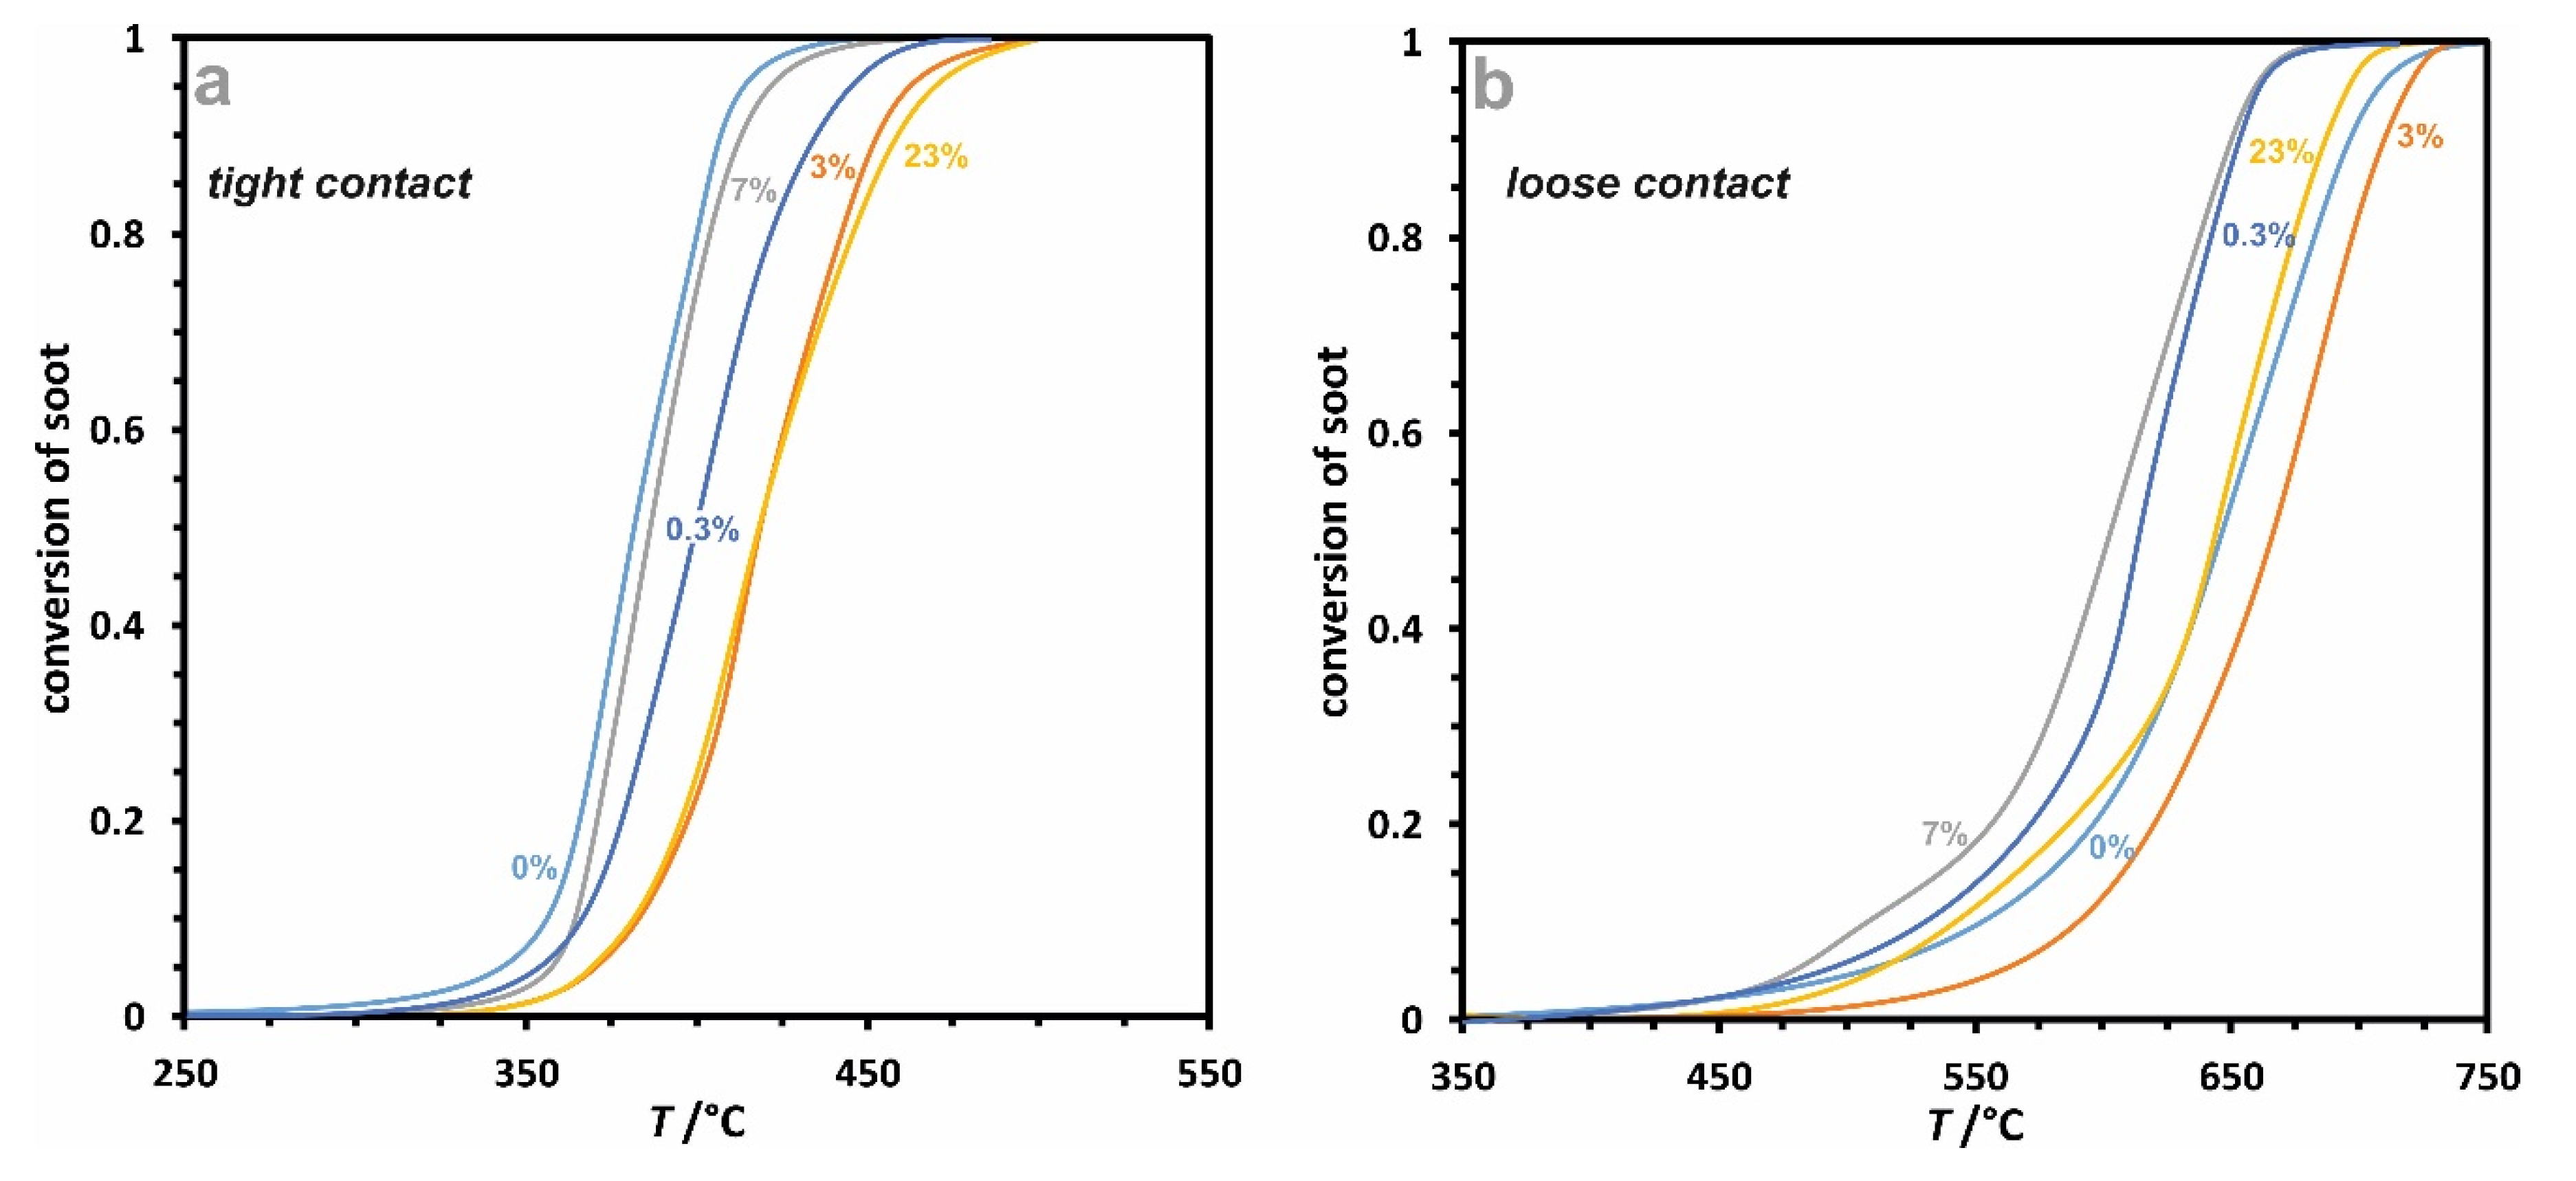
2.3. Catalytic Activity

All the investigated K-OMS-2 and Nb/K-OMS-2 samples were screened for catalytic soot combustion in model conditions. Since we are interested in establishing the relationship between the intricate structure modifications upon Nb doping and the catalyst reactivity, to simplify the conditions the relevant tests were limited to model tight and loose contact modes in the presence of oxygen only. Regardless of the amount of niobium introduced in the cryptomelane, the observed temperature windows of soot combustion remained within the temperature range of 300–500 °C for tight contact and 400–700 °C for loose contact (Figure 6).
The activity of niobium-doped cryptomelane in the soot combustion changes dramatically in a distinctly non-monotonic way, both in the tight and the loose contact modes (Figure 7a). In the loose contact the addition of niobium leads initially to a sharp activity increase, with the T50% minimum at 0.3 wt%, then the activity decreased with T50% maximum at 3 wt%, and upon passing the second local minimum of T50% at 7 wt% of Nb, it further decreases with the growing niobium content. Except of the first minimum, the T50% profile for the tight contact mode follows that of the loose contact one. The observed intriguing changes in the catalytic activity with the Nb loading, correlate quite well with the variation of the average oxidation state of Mn (the AOS values determined from XPS measurements, Figure 7b and with the changes in the work function of the catalysts (Figure 7c). These findings imply that the catalysts redox properties (gauged by the Mn4+/Mn3+(Mn2+) ratio) associated with their ability to activate oxygen via the interfacial electron transfer (controlled by the catalyst work function) play a crucial role in the soot combustion. Furthermore, as the strong Jahn-Teller effect of the Mn3+ ions (d3) leads to distortion of the MnO6 octahedra [52,53,54], the resultant lattice strain fluctuations with the varying Nb doping level (see the XRD and Raman spectra result shown in Figure 1b,d) exert direct influence on the corresponding changes in the catalytic activity. Indeed, a tight dependence of the soot oxidation on the catalyst work function was observed previously for other oxide systems [55,56,57], and this study provides yet another argument confirming the general merit of the work function as one of the prime descriptors of the deSoot activity.
In the particular case of the Nb-doped cryptomelane catalysts, the addition of niobium, due to its ionic radius which is much higher than that of Mn4+ (0.78 vs. 0.67 Å), leads to an unusual way of Nb+5 incorporation into the K-OMS-2 matrix, in comparison to akin V+5 with an ionic radius similar to Mn+4 [13]. Based on the EDX and XPS results, for Nb < 0.3 wt% the following redox mechanism can be proposed to operate in the near surface region:
3Mn4+ + O2− → Nb5+ + 3Mn3+ + VO
The arisen Jahn-Teller Mn3+ cations generate a high lattice strain (Figure 1b), which may be released by reoxidation of the catalyst, or which takes place up to 3 wt%, as it can be inferred from the decrease of the Mn/O ratio determined by XPS (Table 3). Yet, further introduction of the pentavalent Nb5+ leads to a steady increase of the amount of the Mn3+ cations, which may be accounted for by domination of the valence pinning effect (replacement of two Mn4+ cations by a Nb5+ and Mn3+ pair in the bulk without oxygen vacancy formation to satisfy the charge balance, even if only part of the added niobium is incorporated into the K-OMS-2 framework).
These processes are accompanied by the surface oxygen release and formation of the corresponding vacancies, VO, and Mn2+ cations:
Mn4+ + O2− → Mn2+ + ½O2
Alternatively, trivalent manganese cations may be formed by the disproportionation of 2Mn3+ into Mn4+ and Mn2+, favored by the strain release. Such disproportionation of near-surface Mn(III) has been previously reported for lithium manganate spinel [58]. Here, it has been argued that at interfaces of LiMn2O4 (001), a Mn3+ cation is predicted to transform into Mn2+, when displaced by a small distance from its equilibrium position by thermal fluctuations.
These results imply that, apart from the work function, the lattice strain should be identified as another key factor influencing the catalyst performance, by controlling the lattice oxygen energetic state, and its participation in the soot combustion process, as well as by influencing the redox state of the manganese cations.
A specific involvement of the surface vs. bulk oxygen in the soot combustion reaction was then examined by using isotopically labelled 18O2 on the selected 7% Nb/K-OMS-2 catalyst. As presented in Figure 8, in the whole reaction temperature range (from 350 to 500 °C), the main observed products were C18O2 and C16O18O, in comparable amounts. The concentration of C16O2 was distinctly lower. Once the soot combustion is accomplished (above 550 °C), 18O2 and 16O18O isotopomers dominate in the gas phase, whereas the 16O2 isotopomer is transiently appearing in the temperature range from 600–700 °C, i.e., distinctly beyond the soot combustion window. Therefore, it can be concluded that in the catalytically relevant temperature range, the gaseous 18O2 is exchanged with one surface oxygen only, producing 16O18O according to the R1 mechanism [59]. Above 500 °C, similar temperature changes in the isotopic composition of the gaseous dioxygen molecules (18O2, 16O18O, and 16O2) were also observed in a blank experiment in the absence of the soot particles.
These preliminary results imply that the dioxygen reactant is readily dissociated while interacting with the K-OMS-2 surface, and the soot particles are oxidized jointly by the O-18 (from the gas phase) and O-16 (catalyst surface) species. We may then conclude that a mixed Langmuir-Hinshelwood (LH) and Mars van Krevelen (MvK) mechanism of soot combustion operates over the Nb-OMS-2 catalysts, where reduced Mn centers are beneficial for oxygen dissociative activation, whereas the lattice strain favors surface oxygen release and the corresponding vacancies formation.

3. Materials and Methods

3.1. Catalyst Synthesis

The parent cryptomelane was synthesized using the method described by Wasalathanthri et al. [20]. In a 100 mL flask, a solution of MnSO4·H2O (Sigma-Aldrich 99+%, (St. Louis, MO, USA)) was prepared by mixing solid manganese sulfate (5.07 g) with deionized water (18 mL). The pH of the solution was fixed by adding 1.8 mL of HNO3 (Avantor, 65%, (Gliwice, Poland)). In a separate flask, 3.51 g of KMnO4 (Sigma-Aldrich 99+%, (St. Louis, MO, USA)) was dissolved in 60 mL of distilled water. The solution of manganese sulfate was transferred to a 300 mL round-bottom flask, and the potassium permanganate solution was added dropwise to the manganese sulfate solution under constant stirring. The resulting mixture was kept at 100–110 °C under reflux with vigorous stirring overnight. The obtained material was filtered, washed with distilled water until a neutral pH~7 was achieved, dried at 120 °C overnight, and finally calcined at 500 °C for 4 h. The niobium cryptomelane catalysts were prepared as described above by addition of the dopant precursor (Nb(OEt)5, Sigma-Aldrich, 99.95%, (St. Louis, MO, USA)) to the reaction mixture immediately after the introduction of the potassium permanganate solution. The desired niobium to manganese ratio was adjusted by controlling the amount of added Nb(OEt)5. The obtained series of the niobium-doped cryptomelane catalysts was denoted as Nb/K-OMS-2.

3.2. Catalyst Characterization

The specific surface area (SSA, m2·g−1) of the samples was measured by means of the five-point N2 adsorption BET (Boynton Beach, FL, USA) method at −196 °C with p/p0 ranging from 0.002 to 0.995, using a Quantasorb-1 analyzer. Prior to the N2 adsorption measurement, the samples were degassed at 180 °C under a flow of helium for 4 h to ensure the complete removal of the adsorbed impurities.
Powder X-ray diffraction (XRD, (Tokyo, Japan)) was recorded on a Rigaku MiniFlex (PANalytical) instrument with CuKα radiation (0.15406 nm, 40 kV, 15 mA). Scanning was carried out in 0.02 steps, and counting time of 0.8 s−1 per step in the range of 2θ = 10–80°. The crystallographic phase of cryptomelane was identified by comparing the XRD pattern with the Joint Committee on the Powder Diffraction Society (JCPDS) database.
A detailed analysis of the structure, morphology, and elemental composition of the samples was performed by means of transmission electron microscopy (TEM, (Hillsboro, OR, USA)), using a FEI Tecnai Osiris microscope equipped with an X-FEG Schottky field emitter (200 kV). SAED patterns were collected with the aperture of 40 μm diameter. The Z-contrast imaging was performed using a High Angle Annular Dark Field (HAADF) detector in the scanning mode (STEM). The camera length was kept in the range from 330–550 mm, to maximize the HAADF signal intensity. Spatially resolved information about the elements repartition in the examined specimens was obtained by the Energy Dispersive X-ray (EDX) analysis, using a Super-X EDX windowless detector system with a 4-sector silicon drift detector (SDD), and the Bruker Esprit software. Prior to the microscopic analysis, the samples were deposited on a holey carbon film supported on a copper grid (Agar Scientific, London, UK, 400 mesh).
X-ray photoelectron spectra (XPS, (Rogów, Poland)) were recorded on a Prevac photoelectron spectrometer equipped with a hemispherical VG Scienta R3000 analyzer, using the Al Kα radiation (λ = 1486.6 eV). The spectra were recorded with a constant pass energy of 100 eV for survey and narrow scans. Due to the static charging of the samples, correction of the energy shifts was amended with respect to the C 1s peak transition at 285 eV. All XPS spectra were analyzed and processed by means of the CasaXPS software (version 2.3.22PR1.0).
X-ray absorption spectra (XAS) were measured at the SuperXAS beamline of Swiss Light Source, Paul Scherrer Institute, Switzerland. X-rays delivered by the bending magnet were collimated by Si mirror and monochromatized with a pair of Si(111) crystals. The X-ray beam spot of 100 × 100 μm on the sample was obtained by means of the toroidally bent Pt mirror. The incidence beam was monitored with the ionization chamber and the X-ray fluorescence from the sample was acquired with the SDD detector. Spectra were measured around the Mn K-absorption edge, and the incidence beam energy was calibrated with Mn foil reference spectra. Samples were in the form of powder placed inside the quartz capillary tube, with a 10 μm wall and 1 mm inside the diameter.
The chemical composition of the cryptomelane samples was determined by the X-ray fluorescence technique (XRF) using an ARL QUANT’X spectrometer (Thermo Scientific, Waltham, MA, USA) with the Rh anode (4–50 kV with a 1 kV step). In all measurements, the 1 mm size beam and 3.5 mm Si(Li) drifted crystal detector with a Peltier cooling ~ 185 K were used. Concentrations of each element in the investigated samples were determined using the UniQuant software, and the metallic calibration standards.
Micro-Raman spectra (Wotton-under-Edge, UK) were registered in the range between 100 and 3000 cm−1 at room temperature using a Renishaw InVia spectrometer equipped with a Leica DM LM confocal microscope and CCD detector, with an excitation wavelength of 785 nm. The laser intensity at the sample position was reduced to 0.5% of the total power, and at least nine scans were collected for each sample to ensure an adequate signal-to-noise ratio.
The diffuse reflectance ultraviolet/visible (UV/Vis-DR, (Waltham, MA, USA)) spectra of the investigated samples were recorded using a Perkin-Elmer Lambda 650 UV/Vis spectrophotometer with Praying Mantis (Harrick). The measurements were performed in the range of 200–900 nm with a resolution of 1 nm. The spectra were recorded under ambient conditions, and the data were transformed according to the Kubelka-Munk equation. Deconvolution of the spectra was carried out using the Fityk software.
The activity of the synthesized catalysts was determined by the temperature-programmed oxidation of soot. The catalytic tests were performed in a quartz fixed-bed reactor coupled with a quadrupole mass spectrometer (Hiden) for CO, CO2, NO, NO2, and O2 monitoring. The model soot (Degussa-PrintexU) was mixed with the catalyst in the mass ratio of 1:10 by simple shaking for 10 s in an Eppendorf tube (loose contact) or mixing in a mortar by grinding for 10 min (tight contact). For the combustion tests, the 50 mg samples of the catalyst mixed with soot were used. The reactions were performed under the gas flow of 60 mL·min−1 (5% O2 in He), and the heating rate of 10 °C·min−1. The conversion of soot was calculated by integration of the QMS signal of CO2. The observed signal of CO results from the CO2 fragmentation during QMS detection, and thus was taken into consideration.
Work function measurements of the samples were performed to evaluate the electron donor properties of synthesized materials using a Kelvin probe (KP6500, McAllister with a reference steel electrode of d = 3 mm and Φref. = 4.1 eV, (Berkeley, CA, USA)). Prior to the measurements, 0.1 g of cryptomelane was shaped into the tablets, and then heated at 400 °C for 15 min in a vacuum. The actual work function measurements were conducted at 150 °C at the chamber pressure of 10−7 mbar.

4. Conclusions

Detailed investigations of niobium-doped cryptomelane catalysts (K-OMS-2) for soot oxidation showed that their properties are controlled by the amount of Nb dopant in a strongly non-monotonous way. The addition of niobium leads to changes in the lattice strain of the cryptomelane nanobars, and to the pronounced variations of the catalysts work function by tuning the Mn+3/Mn+4 ratio. The catalytic behavior of the Nb/K-OMS-2 materials in total soot oxidation is featured by a mechanism, where both the activated suprafacial and the surface O2− anions of low coordination participate jointly in the reaction. Niobium loading is reflected in the observed changes in oxidation states of manganese, and controls the non-monotonous changes of the catalyst work function and the lattice strain, and apparently variations of these parameters correlate well with the observed activity changes. To our best knowledge, the role of the lattice strain of the cryptomelane catalysts was documented for the first time.

Supplementary Materials

The following are available online at https://www.mdpi.com/2073-4344/10/12/1390/s1. Figure S1: Reference diffractograms of Mn2O3 and two polymorphs of KNbO3; Figure S2: Stability of Nb/K-OMS-2 samples in reaction conditions; Figure S3: Raman spectra of Nb/K-OMS-2 after the test of stability. Bands attributed to birnessite were marked with squares, while those for Mn3O4 with circles; Figure S4: Deconvoluted UV-Vis spectra of Nb/K-OMS-2 samples; Figure S5: Possible AOS of Mn in K-OMS-2 with an area of measured values by XPS.

Author Contributions

Conceptualization, Z.S. and A.K.; data curation, P.L., M.F., J.G., A.W., and J.J.; investigation, J.S., A.K., Z.S., A.A., P.L., M.F., J.G., and A.W.; methodology, J.S., A.K., Z.S., A.A., P.L., M.F., J.G., A.W., Z.Z., and X.Y.; writing—original draft, P.L., M.F., and J.G.; writing—review and editing, J.S., A.K., Z.S., A.A., P.L., M.F., J.G., A.W., Z.Z., and X.Y. All authors have read and agreed to the published version of the manuscript.

Funding

The work was carried out within the MOST program for bilateral collaboration between Poland and China, which is financially supported by The National Centre for Research and Development, Poland, grant PNOX no. WPC1/PNOX/2019, from the China side by the Key Research and Development Program of MOST (2017YFE0131200).

Conflicts of Interest

The authors declare no conflict of interest.

References

  1. Van Setten, B.A.A.L.; Makkee, M.; Moulijn, J.A. Science and technology of catalytic diesel particulate filters. Catal. Rev. Sci. Eng. 2001, 43, 489–564. [Google Scholar] [CrossRef]
  2. Fino, D. Diesel emission control: Catalytic filters for particulate removal. Sci. Technol. Adv. Mater. 2007, 8, 93–100. [Google Scholar] [CrossRef]
  3. Wei, E.T.; Shu, H.P. Nitroaromatic carcinogens in diesel soot: A review of laboratory findings. Am. J. Public Health 1983, 73, 1085–1088. [Google Scholar] [CrossRef] [PubMed] [Green Version]
  4. Legutko, P.; Jakubek, T.; Kaspera, W.; Stelmachowski, P.; Sojka, Z.; Kotarba, A. Strong Enhancement of deSoot Activity of Transition Metal Oxides by Alkali Doping: Additive Effects of Potassium and Nitric Oxide. Top. Catal. 2017, 60, 162–170. [Google Scholar] [CrossRef] [Green Version]
  5. Johnson, T.V. Diesel emission control in review. SAE Int. J. Fuels Lubr. 2009, 2, 1–12. [Google Scholar] [CrossRef]
  6. Caroca, J.; Villata, G.; Fino, D.; Russo, N. Comparison of different diesel particulate filters. Top. Catal. 2009, 52, 2076–2082. [Google Scholar] [CrossRef]
  7. Cui, B.; Zhou, L.; Li, K.; Liu, Y.Q.; Wang, D.; Ye, Y.; Li, S. Holey Co-Ce oxide nanosheets as a highly efficient catalyst for diesel soot combustion. Appl. Catal. B Environ. 2020, 267, 118670. [Google Scholar] [CrossRef]
  8. Gardini, D.; Christensen, J.M.; Damsgaard, C.D.; Jensen, A.D.; Wagner, J.B. Visualizing the mobility of silver during catalytic soot oxidation. Appl. Catal. B Environ. 2016, 183, 28–36. [Google Scholar] [CrossRef] [Green Version]
  9. Hernández-Giménez, A.M.; Castelló, D.L.; Bueno-López, A. Diesel soot combustion catalysts: Review of active phases. Chem. Pap. 2014, 68, 1154–1168. [Google Scholar] [CrossRef] [Green Version]
  10. Álvarez-Docio, C.M.; Portela, R.; Reinosa, J.J.; Rubio-Marcos, F.; Granados-Miralles, C.; Pascual, L.; Fernández, J.F. Pt-free CoAl2O4 catalyst for soot combustion with NOx/O2. Appl. Catal. A Gen. 2020, 591, 117404. [Google Scholar] [CrossRef]
  11. Jakubek, T.; Hudy, C.; Gryboś, J.; Manyar, H.; Kotarba, A. Thermal Transformation of Birnessite (OL) Towards Highly Active Cryptomelane (OMS-2) Catalyst for Soot Oxidation. Catal. Lett. 2019, 149, 2218–2225. [Google Scholar] [CrossRef] [Green Version]
  12. Chen, X.; Shen, Y.F.; Suib, S.L.; O’Young, C.L. Characterization of manganese oxide octahedral molecular sieve (M-OMS-2) materials with different metal cation dopants. Chem. Mater. 2002, 14, 940–948. [Google Scholar] [CrossRef]
  13. Kaspera, W.; Indyka, P.; Sojka, Z.; Kotarba, A. Bridging the gap between tight and loose contacts for soot oxidation by vanadium doping of cryptomelane nanorods catalyst using NO2 as an oxygen carrier. Catal. Sci. Technol. 2018, 8, 3183–3192. [Google Scholar] [CrossRef]
  14. Jiménez, R.; García, X.; López, T.; Gordon, A.L. Catalytic combustion of soot. Effects of added alkali metals on CaO-MgO physical mixtures. Fuel Process. Technol. 2008, 89, 1160–1168. [Google Scholar] [CrossRef]
  15. Jakubek, T.; Kaspera, W.; Legutko, P.; Stelmachowski, P.; Kotarba, A. How to Efficiently Promote Transition Metal Oxides by Alkali Towards Catalytic Soot Oxidation. Top. Catal. 2016, 59, 1083–1089. [Google Scholar] [CrossRef] [Green Version]
  16. Jakubek, T.; Kaspera, W.; Legutko, P.; Stelmachowski, P.; Kotarba, A. Surface versus bulk alkali promotion of cobalt-oxide catalyst in soot oxidation. Catal. Commun. 2015, 71, 37–41. [Google Scholar] [CrossRef]
  17. Pecchi, G.; Cabrera, B.; Delgado, E.J.; García, X.; Jimenez, R. Activity of KNbO3 as catalyst for soot combustion: Effect of the preparation method. Appl. Catal. A Gen. 2013, 453, 341–348. [Google Scholar] [CrossRef]
  18. Neyertz, C.A.; Banús, E.D.; Miró, E.E.; Querini, C.A. Potassium-promoted Ce0.65Zr0.35O2 monolithic catalysts for diesel soot combustion. Chem. Eng. J. 2014, 248, 394–405. [Google Scholar] [CrossRef]
  19. Wagloehner, S.; Kureti, S. Study on the mechanism of the oxidation of soot on Fe2O3 catalyst. Appl. Catal. B Environ. 2012, 125, 158–165. [Google Scholar] [CrossRef]
  20. Wasalathanthri, N.D.; Guild, C.; Nizami, Q.A.; Dissanayake, S.L.; He, J.; Kerns, P.; Fee, J.; Achola, L.; Rathnayake, D.; Weerakkody, C.; et al. Niobium-substituted octahedral molecular sieve (OMS-2) materials in selective oxidation of methanol to dimethoxymethane. RSC Adv. 2019, 9, 32665–32673. [Google Scholar] [CrossRef] [Green Version]
  21. Chen, C.H.; Njagi, E.C.; Chen, S.Y.; Horvath, D.T.; Xu, L.; Morey, A.; Mackin, C.; Joesten, R.; Suib, S.L. Structural Distortion of Molybdenum-Doped Manganese Oxide Octahedral Molecular Sieves for Enhanced Catalytic Performance. Inorg. Chem. 2015, 54, 10163–10171. [Google Scholar] [CrossRef] [PubMed]
  22. Son, J.H.; Wang, J.; Casey, W.H. Structure, stability and photocatalytic H2 production by Cr-, Mn-, Fe-, Co-, and Ni-substituted decaniobate clusters. Dalt. Trans. 2014, 43, 17928–17933. [Google Scholar] [CrossRef] [PubMed] [Green Version]
  23. Becerra, M.-E.; Arias, N.-P.; Giraldo, O.-H.; López-Suárez, F.-E.; Illán-Gómez, M.-J.; Bueno-López, A. Alumina-Supported Manganese Catalysts for Soot Combustion Prepared by Thermal Decomposition of KMnO4. Catalysts 2012, 2, 352–367. [Google Scholar] [CrossRef] [Green Version]
  24. Becerra, M.E.; Arias, N.P.; Giraldo, O.H.; López Suárez, F.E.; Illán Gómez, M.J.; Bueno López, A. Soot combustion manganese catalysts prepared by thermal decomposition of KMnO4. Appl. Catal. B Environ. 2011, 102, 260–266. [Google Scholar] [CrossRef]
  25. Sultana, S.; Ye, Z.; Veerapandian, S.K.P.; Löfberg, A.; De Geyter, N.; Morent, R.; Giraudon, J.M.; Lamonier, J.F. Synthesis and catalytic performances of K-OMS-2, Fe/K-OMS-2 and Fe-K-OMS-2 in post plasma-catalysis for dilute TCE abatement. Catal. Today 2018, 307, 20–28. [Google Scholar] [CrossRef]
  26. Legutko, P.; Pęza, J.; Villar Rossi, A.; Marzec, M.; Jakubek, T.; Kozieł, M.; Adamski, A. Elucidation of Unexpectedly Weak Catalytic Effect of Doping with Cobalt of the Cryptomelane and Birnessite Systems Active in Soot Combustion. Top. Catal. 2019, 62, 599–610. [Google Scholar] [CrossRef] [Green Version]
  27. Ding, Y.S.; Shen, X.F.; Sithambaram, S.; Gomez, S.; Kumar, R.; Crisostomo, V.M.B.; Suib, S.L.; Aindow, M. Synthesis and catalytic activity of cryptomelane-type manganese dioxide nanomaterials produced by a novel solvent-free method. Chem. Mater. 2005, 17, 5382–5389. [Google Scholar] [CrossRef]
  28. Stelmachowski, P.; Legutko, P.; Jakubek, T.; Indyka, P.; Sojka, Z.; Holmlid, L.; Kotarba, A. Emission of highly excited electronic states of potassium from cryptomelane nanorods. Phys. Chem. Chem. Phys. 2015, 17, 26289–26294. [Google Scholar] [CrossRef]
  29. Ortiz, A.L.; Shaw, L. X-ray diffraction analysis of a severely plastically deformed aluminum alloy. Acta Mater. 2004, 52, 2185–2197. [Google Scholar] [CrossRef]
  30. Cheney, M.A.; Birkner, N.R.; Ma, L.; Hartmann, T.; Bhowmik, P.K.; Hodge, V.F.; Steinberg, S.M. Synthesis and characterization of inorganic double helices of cryptomelane nanomaterials. Colloids Surf. A Physicochem. Eng. Asp. 2006, 289, 185–192. [Google Scholar] [CrossRef]
  31. Stelmachowski, P.; Legutko, P.; Jakubek, T.; Kotarba, A. Phase evolution and electronic properties of cryptomelane nanorods. J. Alloys Compd. 2018, 767, 592–599. [Google Scholar] [CrossRef]
  32. Venkateswarlu, K.; Chandra Bose, A.; Rameshbabu, N. X-ray peak broadening studies of nanocrystalline hydroxyapatite by WilliamsonHall analysis. Phys. B Condens. Matter 2010, 405, 4256–4261. [Google Scholar] [CrossRef]
  33. Englman, R.; Dow, J.D. The Jahn–Teller Effect in Molecules and Crystals. Phys. Today 1974, 27, 57. [Google Scholar] [CrossRef]
  34. Gao, T.; Glerup, M.; Krumeich, F.; Nesper, R.; Fjellvâg, H.; Norby, P. Microstructures and spectroscopic properties of cryptomelane-type manganese dioxide nanofibers. J. Phys. Chem. C 2008, 112, 13134–13140. [Google Scholar] [CrossRef]
  35. Campbell, I.H. The Effects of Microcrystal Size and Shape on the One Phonon Raman Spectra of crystalline semiconductors. Semiconductors 1986, 58, 739–741. [Google Scholar] [CrossRef]
  36. Wang, J.B.; Zhong, H.M.; Li, Z.F.; Lu, W. Raman study for E 2 phonon of ZnO in Zn1−xMnxO nanoparticles. J. Appl. Phys. 2005, 97, 086105. [Google Scholar] [CrossRef]
  37. Xing, S.; Chun, H.U.; Jiuhui, Q.U.; Hong, H.E.; Yang, M.I.N. Characterization and Reactivity of MnOx Supported on Mesoporous Zirconia for Herbicide 2,4-D Mineralization with Ozone. Environ. Sci. Technol. 2008, 42, 3363–3368. [Google Scholar] [CrossRef]
  38. Ye, Y.; Shen, F.; Wang, H.; Chen, R. SSZ-13-supported manganese oxide catalysts for low temperature selective catalytic reduction of NOx by NH3. J. Chem. Sci. 2017, 129, 765–774. [Google Scholar] [CrossRef]
  39. Fernández López, E.; Sánchez Escribano, V.; Gallardo-Amores, J.M.; Resini, C.; Busca, G. Structural and morphological characterization of Mn-Zr mixed oxides prepared by a sol-gel method. Solid State Sci. 2002, 4, 951–961. [Google Scholar] [CrossRef]
  40. Velu, S.; Shah, N.; Jyothi, T.M.; Sivasanker, S. Effect of manganese substitution on the physicochemical properties and catalytic toluene oxidation activities of Mg-Al layered double hydroxides. Microporous Mesoporous Mater. 1999, 33, 61–75. [Google Scholar] [CrossRef]
  41. Liu, W.X.; Zhu, X.L.; Liu, S.Q.; Gu, Q.Q.; Meng, Z. Da Near-Infrared-Driven Selective Photocatalytic Removal of Ammonia Based on Valence Band Recognition of an α-MnO2/N-Doped Graphene Hybrid Catalyst. ACS Omega 2018, 3, 5537–5546. [Google Scholar] [CrossRef] [PubMed]
  42. Morais, L.A.; Adán, C.; Araujo, A.S.; Guedes, A.P.M.A.; Marugán, J. Synthesis, Characterization, and Photonic Efficiency of Novel Photocatalytic Niobium Oxide Materials. Glob. Chall. 2017, 1, 1700066. [Google Scholar] [CrossRef] [PubMed]
  43. Yan, J.; Wu, G.; Guan, N.; Li, L. Nb2O5/TiO2 heterojunctions: Synthesis strategy and photocatalytic activity. Appl. Catal. B Environ. 2014, 152–153, 280–288. [Google Scholar] [CrossRef]
  44. Ilton, E.S.; Post, J.E.; Heaney, P.J.; Ling, F.T.; Kerisit, S.N. XPS determination of Mn oxidation states in Mn (hydr)oxides. Appl. Surf. Sci. 2016, 366, 475–485. [Google Scholar] [CrossRef] [Green Version]
  45. Nelson, A.J.; Reynolds, J.G.; Roos, J.W. Core-level satellites and outer core-level multiplet splitting in Mn model compounds. J. Vac. Sci. Technol. Vac. Surf. Films 2000, 18, 1072–1076. [Google Scholar] [CrossRef] [Green Version]
  46. Nelson, A.J.; Reynolds, J.G.; Christou, G. Spin-state effects on the outer core-level multiplet structures for high-spin Mn molecular clusters. J. Appl. Phys. 2003, 93, 2536–2539. [Google Scholar] [CrossRef] [Green Version]
  47. Junta, J.L.; Hochella, M.F. Manganese (II) oxidation at mineral surfaces: A microscopic and spectroscopic study. Geochim. Cosmochim. Acta 1994, 58, 4985–4999. [Google Scholar] [CrossRef]
  48. Galakhov, V.R.; Demeter, M.; Bartkowski, S.; Neumann, M.; Ovechkina, N.A.; Kurmaev, E.Z.; Lobachevskaya, N.I.; Mukovskii, Y.M.; Mitchell, J.; Ederer, D.L. Mn (formula presented) exchange splitting in mixed-valence manganites. Phys. Rev. B Condens. Matter Mater. Phys. 2002, 65, 1–4. [Google Scholar] [CrossRef]
  49. Li, X.; Zou, Q.; Wei, Y.; Zhou, X.; Wang, Z.; Xu, A.; Ruan, X. Graphite assisted room-temperature synthesis of structurally defected OMS-2 nanorods for peroxymonosulfate activation. Appl. Surf. Sci. 2019, 497, 143770. [Google Scholar] [CrossRef]
  50. Zhang, T.; Lei, W.; Liu, P.; Rodriguez, J.A.; Yu, J.; Qi, Y.; Liu, G.; Liu, M. Organic Pollutant Photodecomposition by Ag/KNbO3 Nanocomposites: A Combined Experimental and Theoretical Study. J. Phys. Chem. C 2016, 120, 2777–2786. [Google Scholar] [CrossRef]
  51. Deng, H.; Kang, S.; Ma, J.; Wang, L.; Zhang, C.; He, H. Role of Structural Defects in MnOx Promoted by Ag Doping in the Catalytic Combustion of Volatile Organic Compounds and Ambient Decomposition of O3. Environ. Sci. Technol. 2019, 53, 10871–10879. [Google Scholar] [CrossRef]
  52. Piszora, P. Temperature dependence of the order and distribution of Mn3+ and Mn4+ cations in orthorhombic LiMn2O4. J. Alloys Compd. 2004, 382, 112–118. [Google Scholar] [CrossRef]
  53. Chu, Q.; Wang, X.; Zhang, X.; Li, Q.; Liu, X. Buckled layers in K0.66Mn2O4·0.28H2O and K0.99Mn3O6·1.25H2O synthesized at high pressure: Implication for the mechanism of layer-to-tunnel transformation in manganese oxides. Inorg. Chem. 2011, 50, 2049–2051. [Google Scholar] [CrossRef]
  54. Li, X.; Ma, X.; Su, D.; Liu, L.; Chisnell, R.; Ong, S.P.; Chen, H.; Toumar, A.; Idrobo, J.C.; Lei, Y.; et al. Direct visualization of the Jahn-Teller effect coupled to Na ordering in Na5/8MnO2. Nat. Mater. 2014, 13, 586–592. [Google Scholar] [CrossRef]
  55. Legutko, P.; Stelmachowski, P.; Trȩbala, M.; Sojka, Z.; Kotarba, A. Role of electronic factor in soot oxidation process over tunnelled and layered potassium iron oxide catalysts. Top. Catal. 2013, 56, 489–492. [Google Scholar] [CrossRef] [Green Version]
  56. Legutko, P.; Kaspera, W.; Jakubek, T.; Stelmachowski, P.; Kotarba, A. Influence of potassium and NO addition on catalytic activity in soot combustion and surface properties of iron and manganese spinels. Top. Catal. 2013, 56, 745–749. [Google Scholar] [CrossRef] [Green Version]
  57. Legutko, P.; Kaspera, W.; Stelmachowski, P.; Sojka, Z.; Kotarba, A. Boosting the catalytic activity of magnetite in soot oxidation by surface alkali promotion. Catal. Commun. 2014, 56, 139–142. [Google Scholar] [CrossRef]
  58. Benedek, R. Role of Disproportionation in the Dissolution of Mn from Lithium Manganate Spinel. J. Phys. Chem. C 2017, 121, 22049–22053. [Google Scholar] [CrossRef]
  59. Muzykantov, V.S.; Panov, G.I.; Boreskov, G.K. Determination of the Types of Homo-Molecular Oxygen Exchange on Oxides. Kinet. Katal. 1973, 14, 948–955. [Google Scholar]
Figure 1. Diffraction patterns (a) and Raman spectra (c) of Nb/K-OMS-2 with different dopant loadings (0–23 wt%) together with lattice strain (b) and the corresponding Raman peaks position (d) as a function of the niobium loading.
Catalysts 10 01390 g001
Figure 2. Conventional BF TEM imaging of K-OMS-2 nanorods (a1) supplemented by the SAED analysis of the sample phase/crystallinity (a2) and HR TEM imaging of the sample structure (a3,a4). The corresponding analysis was performed for niobium-doped cryptomelane nanorods (Nb/K-OMS-2): 3 wt% Nb (b1b4), 7 wt% Nb (c1c4), 23 wt% Nb (d1d4), respectively.
Catalysts 10 01390 g002
Figure 3. HAADF STEM (a1) and EDX (a2a5) analysis of K-OMS-2 nanorods. The corresponding analysis was performed for niobium-doped cryptomelane nanorods (Nb/K-OMS-2): 3 wt% Nb (b1b5), 7 wt% Nb (c1c5), 23 wt% Nb (d1d5), respectively.
Catalysts 10 01390 g003
Figure 4. High resolution spectra of Mn 3s (a), Nb 3d (b), K 2p (c), and O 1s (d) regions on the surface of Nb/K-OMS-2 catalysts with various amounts of niobium.
Catalysts 10 01390 g004
Figure 5. X-ray absorption spectra of the bare and Nb-doped sample with 7 and 23% loading together with the reference spectra of MnO (light gray), Mn3O4 (gray), and MnO2 (black), respectively (a), and the correlation between the inflection point of the XAS spectra versus Mn average oxidation state (b). The average Mn oxidation states obtained for the bare (blue) and doped Nb 7 wt% (orange) and 23 wt% (green) samples is marked by the dashed lines.
Catalysts 10 01390 g005
Figure 6. Oxidation of soot over the K-OMS-2 and Nb/K-OMS-2 catalysts in the tight (a) and loose (b) contact.
Catalysts 10 01390 g006
Figure 7. Activity of the investigated catalysts in soot combustion, denoted as the temperature of 50% conversion in the tight (blue line) and loose (orange line) contact, as a function of the concentration of niobium dopant (a) together with the average oxidation state of surface manganese derived from XPS (circles) and bulk manganese derived from XAS (squares) measurements (b) and work function (c).
Catalysts 10 01390 g007
Figure 8. Soot combustion in 18O2 in tight contact as a function of temperature on Nb/K-OMS-2 containing 7 wt% of Nb.
Catalysts 10 01390 g008
Table 1. Structural and textural parameters of samples from the Nb/K-OMS-2 series.
Nb Loading/wt%dW-H/nm *ε/% **SSA/m2·g−1 ***
0300.5257
0.3320.8757
0.4370.8457
3350.3563
4410.4564
7360.6372
14220.5575
23210.5275
* dW-H: Crystallite size; ** ε: Lattice strain; *** SSA: Specific surface area.
Table 2. Structural and textural parameters of Nb/K-OMS-2 derived from TEM and EDX.
Nb Loading/wt%Average Length/nm<AR>K/MnMn/O
035020.70.120.63
3875.90.140.61
71238.20.090.68
23473.80.110.59
Table 3. Surface (XPS) and bulk (XRF) composition of investigated samples.
Nb Loading/wt% *XRF/Norm% **XPS/Norm%NbXPS/NbXRFMn/O
KMnNbKMnNbO ***
00.848.00-0.958.00-11.8-0.68
0.30.947.990.010.957.970.0312.33.000.65
0.40.777.980.020.777.960.0411.52.000.69
30.787.900.100.737.800.2012.02.000.65
40.727.800.200.787.800.2012.21.000.64
70.777.700.300.787.800.2012.10.670.65
140.787.300.700.787.700.3012.60.420.61
230.826.801.201.107.300.7013.00.420.56
* The niobium loading in the samples label was calculated as the mass % of niobium in the sample. ** The normalized % means a molar % normalized to the sum of the manganese and niobium cations in the cryptomelane formula unit equal to 8. *** The oxygen content was calculated from the total area of the O 1s XPS peak.
Publisher’s Note: MDPI stays neutral with regard to jurisdictional claims in published maps and institutional affiliations.

