Article

Development of FTIR Spectroscopy Methodology for Characterization of Boron Species in FCC Catalysts

BASF Corporation, 25 Middlesex-Essex Tpk., Iselin, NJ 08830, USA
*
Author to whom correspondence should be addressed.
Catalysts 2020, 10(11), 1327; https://doi.org/10.3390/catal10111327
Submission received: 23 October 2020 / Revised: 11 November 2020 / Accepted: 13 November 2020 / Published: 15 November 2020
(This article belongs to the Special Issue Fluid Catalytic Cracking)

Abstract

:
Fluid Catalytic Cracking (FCC) has maintained its crucial role in refining decades after its initial introduction owing to the flexibility it has as a process as well as the developments in its key enabler, the FCC catalyst. Boron-based technology (BBT) for passivation of contaminant metals in FCC catalysts represents one such development. In this contribution we describe Fourier Transform Infrared Spectroscopy (FTIR) characterization of boron-containing catalysts to identify the phase and structural information of boron. We demonstrate that FTIR can serve as a sensitive method to differentiate boron trioxide and borate structures with a detection limit at the 1000 ppm level. The FTIR analysis validates that the boron in the FCC catalysts studied are in the form of small borate units and confirms that the final FCC catalyst product contains no detectable isolated boron trioxide phase. Since boron trioxide is regulated in some parts of the world, this novel FTIR methodology can be highly beneficial for further FCC catalyst development and its industrial application at refineries around the world. This new method can also be applied on systems beyond catalysts, since the characterization of boron-containing materials is needed for a wide range of other applications in the fields of glass, ceramics, semiconductors, agriculture, and pharmaceuticals.

Graphical Abstract

1. Introduction

As one of the cornerstones of petroleum refining, Fluid Catalytic Cracking (FCC) is a key conversion processes that provides majority of gasoline consumed throughout the world in addition to other important transportation fuels and petrochemical feedstocks. In terms of the type of crude oil processed, the global trend has been towards heavier and more contaminated feedstocks in recent years; significantly increasing the importance of mitigating the negative effects of contaminants that come with these heavier crudes. Today, the significance of nickel as one of the most challenging contaminant metals on FCC catalysts has been thoroughly acknowledged and there has been considerable effort dedicated to developing technologies to be able to process feeds with elevated nickel levels. Boron Based Technology (BBT), represents one such development [1]; and since its industrial introduction, it has been used in many refineries around the world. This FCC catalyst technology utilizes boron compounds as precursors for introducing the novel nickel passivation feature to enhance in-unit performance such as lower levels of undesirable hydrogen and coke yields and increased yields of valuable hydrocarbon products [1].
Boron compounds are already widely used in different fields such as glass and ceramics, polymers, semiconductors, bleaching products, insecticides, agricultural fertilizers, etc. Among the variety of boron compounds, boron trioxide (B2O3) is commonly used as a raw material additive in glass, ceramics, and semiconductors to improve the electrical, thermal, and/or mechanical properties of these materials. Boron trioxide is composed of six-membered boroxol rings with 3-coordinate boron and 2-coordinate oxygen. Boron trioxide can react with oxide materials and turn to borate form at high temperatures. Direct contact, inhalation, or ingestion of boron trioxide may irritate eye, skin and respiratory system. Toxicity testing studies on animals indicate that extended exposure to high doses of boron trioxide may cause issues with reproduction, although statistical studies on workers at boron trioxide manufacturing sites did not support the results in this claim [2,3,4,5]. On the other hand, borate species are usually the final forms of boron-species in products after high temperature reactions between boron trioxide and other oxide materials. These borates are seen as benign with regards to reproductive health and are exempted from the regulated/controlled chemicals list of the European Chemicals Agency (ECHA) [6,7,8].
The aim of this study is to provide a spectroscopic characterization methodology to identify the boron species in FCC catalysts, to be able to categorize them as bulk boron trioxide or as borate species. This analysis is important from a regulatory perspective especially for the use of these products in regions where there are regulations in place for use of boron trioxide, such as in European Union with the regulatory requirements by ECHA [2,3].
Boron-containing materials are known to be challenging to characterize using scanning electron microscopy (SEM) and electron dispersive X-ray spectroscopy (EDS), owing to boron’s low atomic number, difficulty for ionization, and low fluorescence yield upon excitation. [9] It is also challenging to use X-ray photoelectron spectroscopy (XPS) to analyze boron directly using B 1s due to its low photoelectron cross-section and overlapping with P 2s and Si 2s plasmon peaks [10]. Nuclear Magnetic Resonance (NMR) spectroscopy can be a sensitive technique for detecting some boron species, especially for BO4 structure/phase; however, it is challenging to differentiate the BO3 in borate with BO3 in boron trioxide phase [11]. Infrared spectroscopy is an important tool to characterize the structural properties of amorphous materials, especially for boron-containing materials. When there is a change in the dipole moment of a bond vibration, infrared (IR) signals can be generated and detected due to the match of excitation light energy with the bond vibration energy level. Valid IR signals can come from surface-adsorbed gas molecules, or from the structural vibrations in the solid phases. In this contribution, IR-spectroscopic characterization of boron trioxide and several borate-containing materials is provided when the boron content is low in the materials, which provides a quick way to achieve the structural information about the nature of the boron species. This method can serve as an important tool for product development and commercial utilization for boron-containing catalysts as well as other materials, and help align these products with the regulatory requirements.

2. Results and Discussion

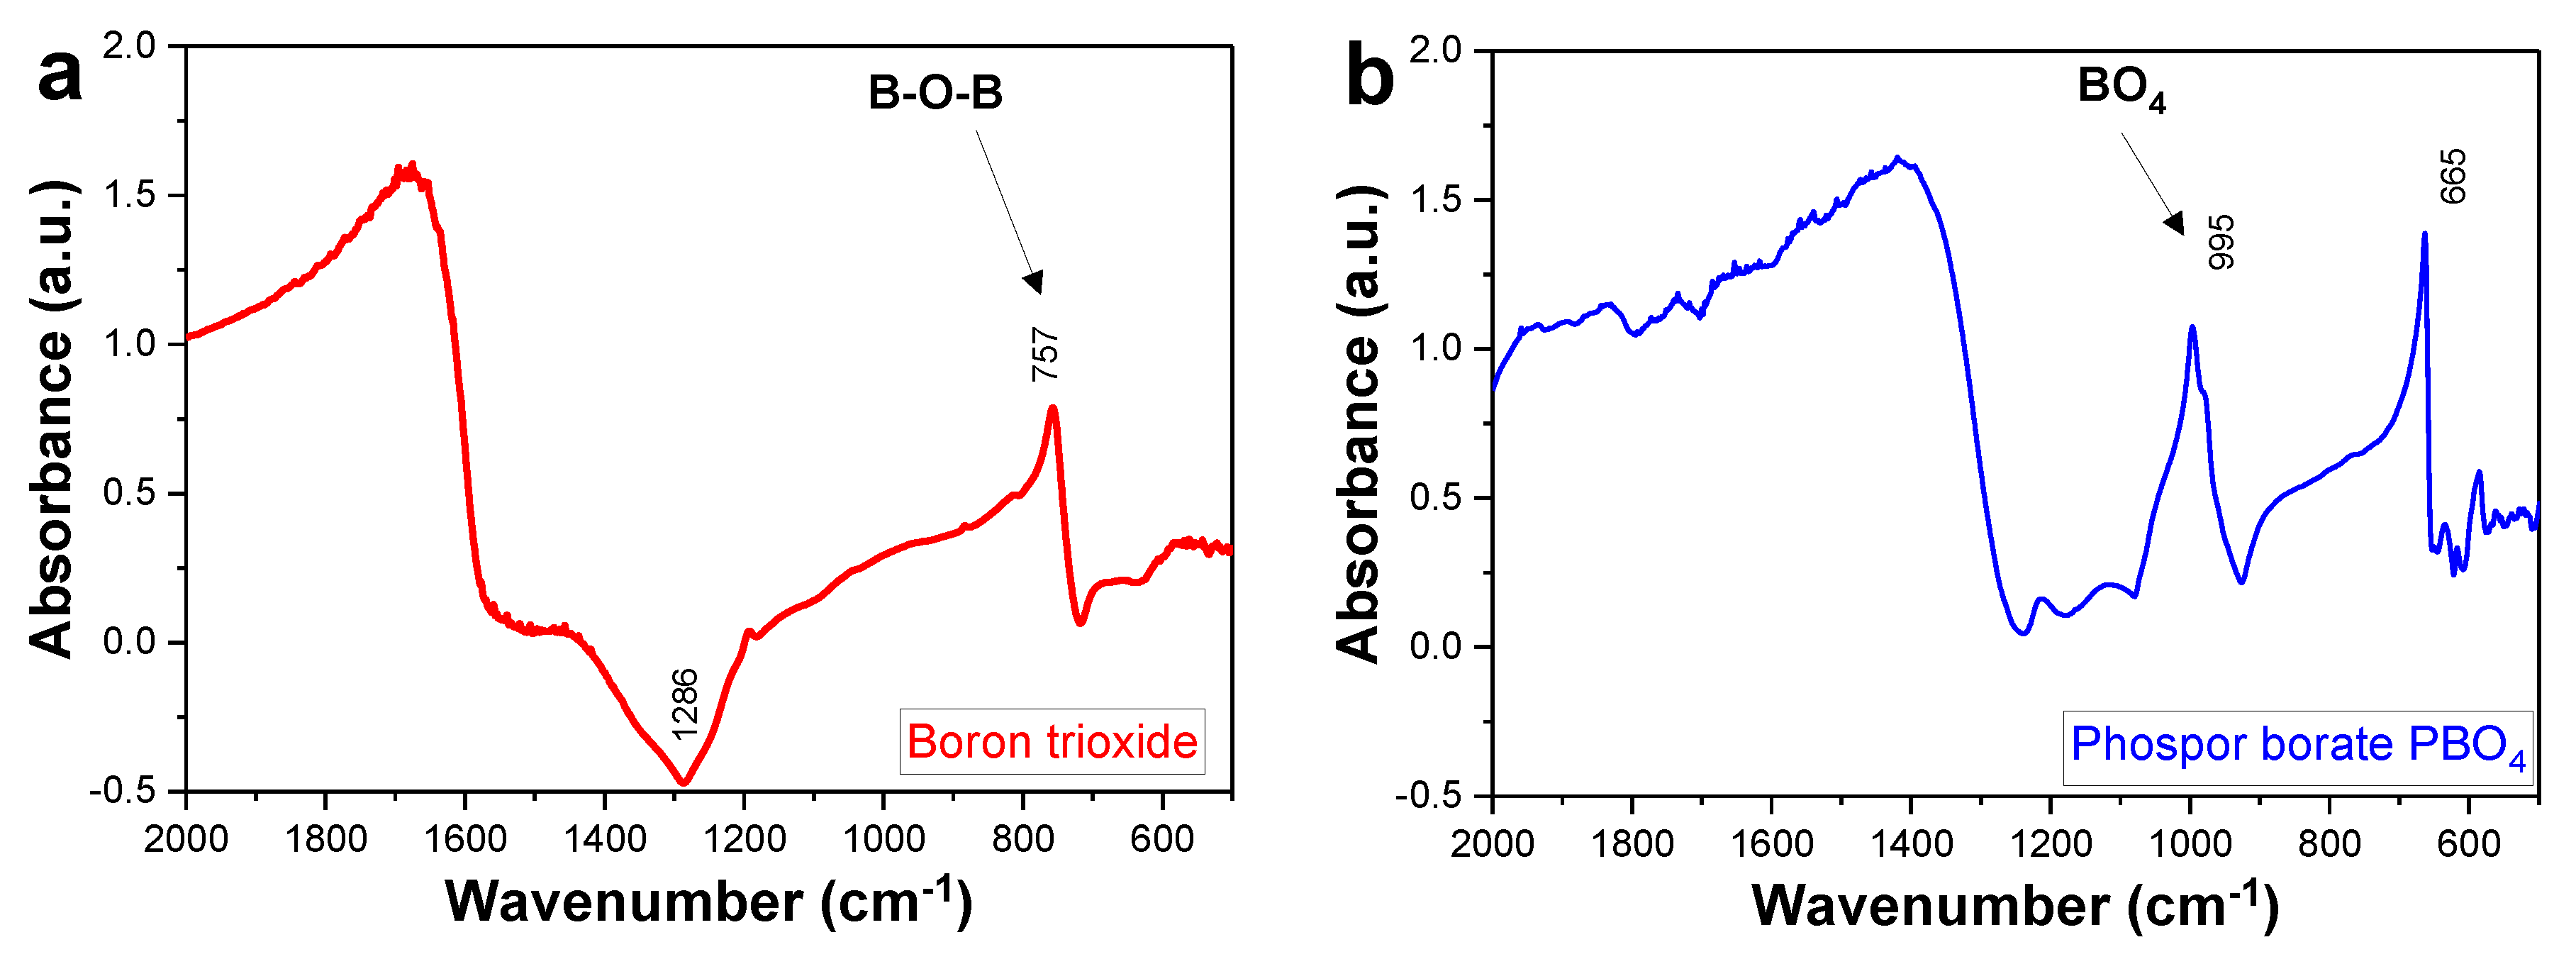
2.1. Boron Trioxide Characterization via FTIR

Boron trioxide is a well-known glass former that can form glass on its own under appropriate conditions. The vitreous glass structure of boron trioxide can be formed by simply heating boric acid to temperatures higher than 176 °C. The primary structure in vitreous boron trioxide glass consists of 6-member boroxol rings that maintain the short-range order, and bridged oxygen atoms to inter-connect the small units. The red plot in Figure 1a shows the FTIR spectrum for vitreous boron trioxide glass that was formed after heating ground boron trioxide powder at 200 °C for an hour. In literature, the vitreous boron trioxide glass shows two IR peaks at 1260–1280 cm−1 and 720–760 cm−1, which are assigned to transverse-optical-longitudinal-optical (TO-LO) splitting due to the IR light interaction propagated in longitudinal and transverse directions [12]. Some others also assigned the peak at ~740 cm−1 to the bending mode of B-O-B linkage structure in BO3 units [13]. In the higher wavenumber range (>1600 cm−1), the IR light is almost completely absorbed by the vitreous glass structure as shown in the cliff-like absorbance in the FTIR spectrum. The negative feature at 1286 cm−1 is likely due to light reflection at this wavenumber (energy/frequency) that enhances the signal in the detector.
Similarly, phosphor borate (PBO4) can also form a glass by itself. The blue plot in Figure 1b shows the FTIR spectrum collected on glassy PBO4 that was formed after being treated at 400 °C for dehydration. The sharp peak at 995 cm−1 is assigned to the BO4 structure, while the 665 cm−1 peak is due to PO4 vibrations [14,15]. The peak sharpness is related to the short-range ordering in the glass network as compared to broader absorbance in amorphous structures. The total absorbance cutoff is at ~1400 cm−1 for glassy PBO4.
When boron trioxide is mixed with other oxide materials, such as silica, and thermally treated at high temperatures, different types of borate structures can be formed [16]. The polymeric network of boroxol rings in pure boron trioxide is interrupted. Much smaller structural BO3 and BO4 units are formed as borate species. As the boron content gets lower, it becomes less likely that the boroxol ring structures remain intact, and more likely that small borate structures are formed. This phenomenon is simply due to higher mobility of small units of borate species at high temperatures, which tend to disperse uniformly in the solid solution.

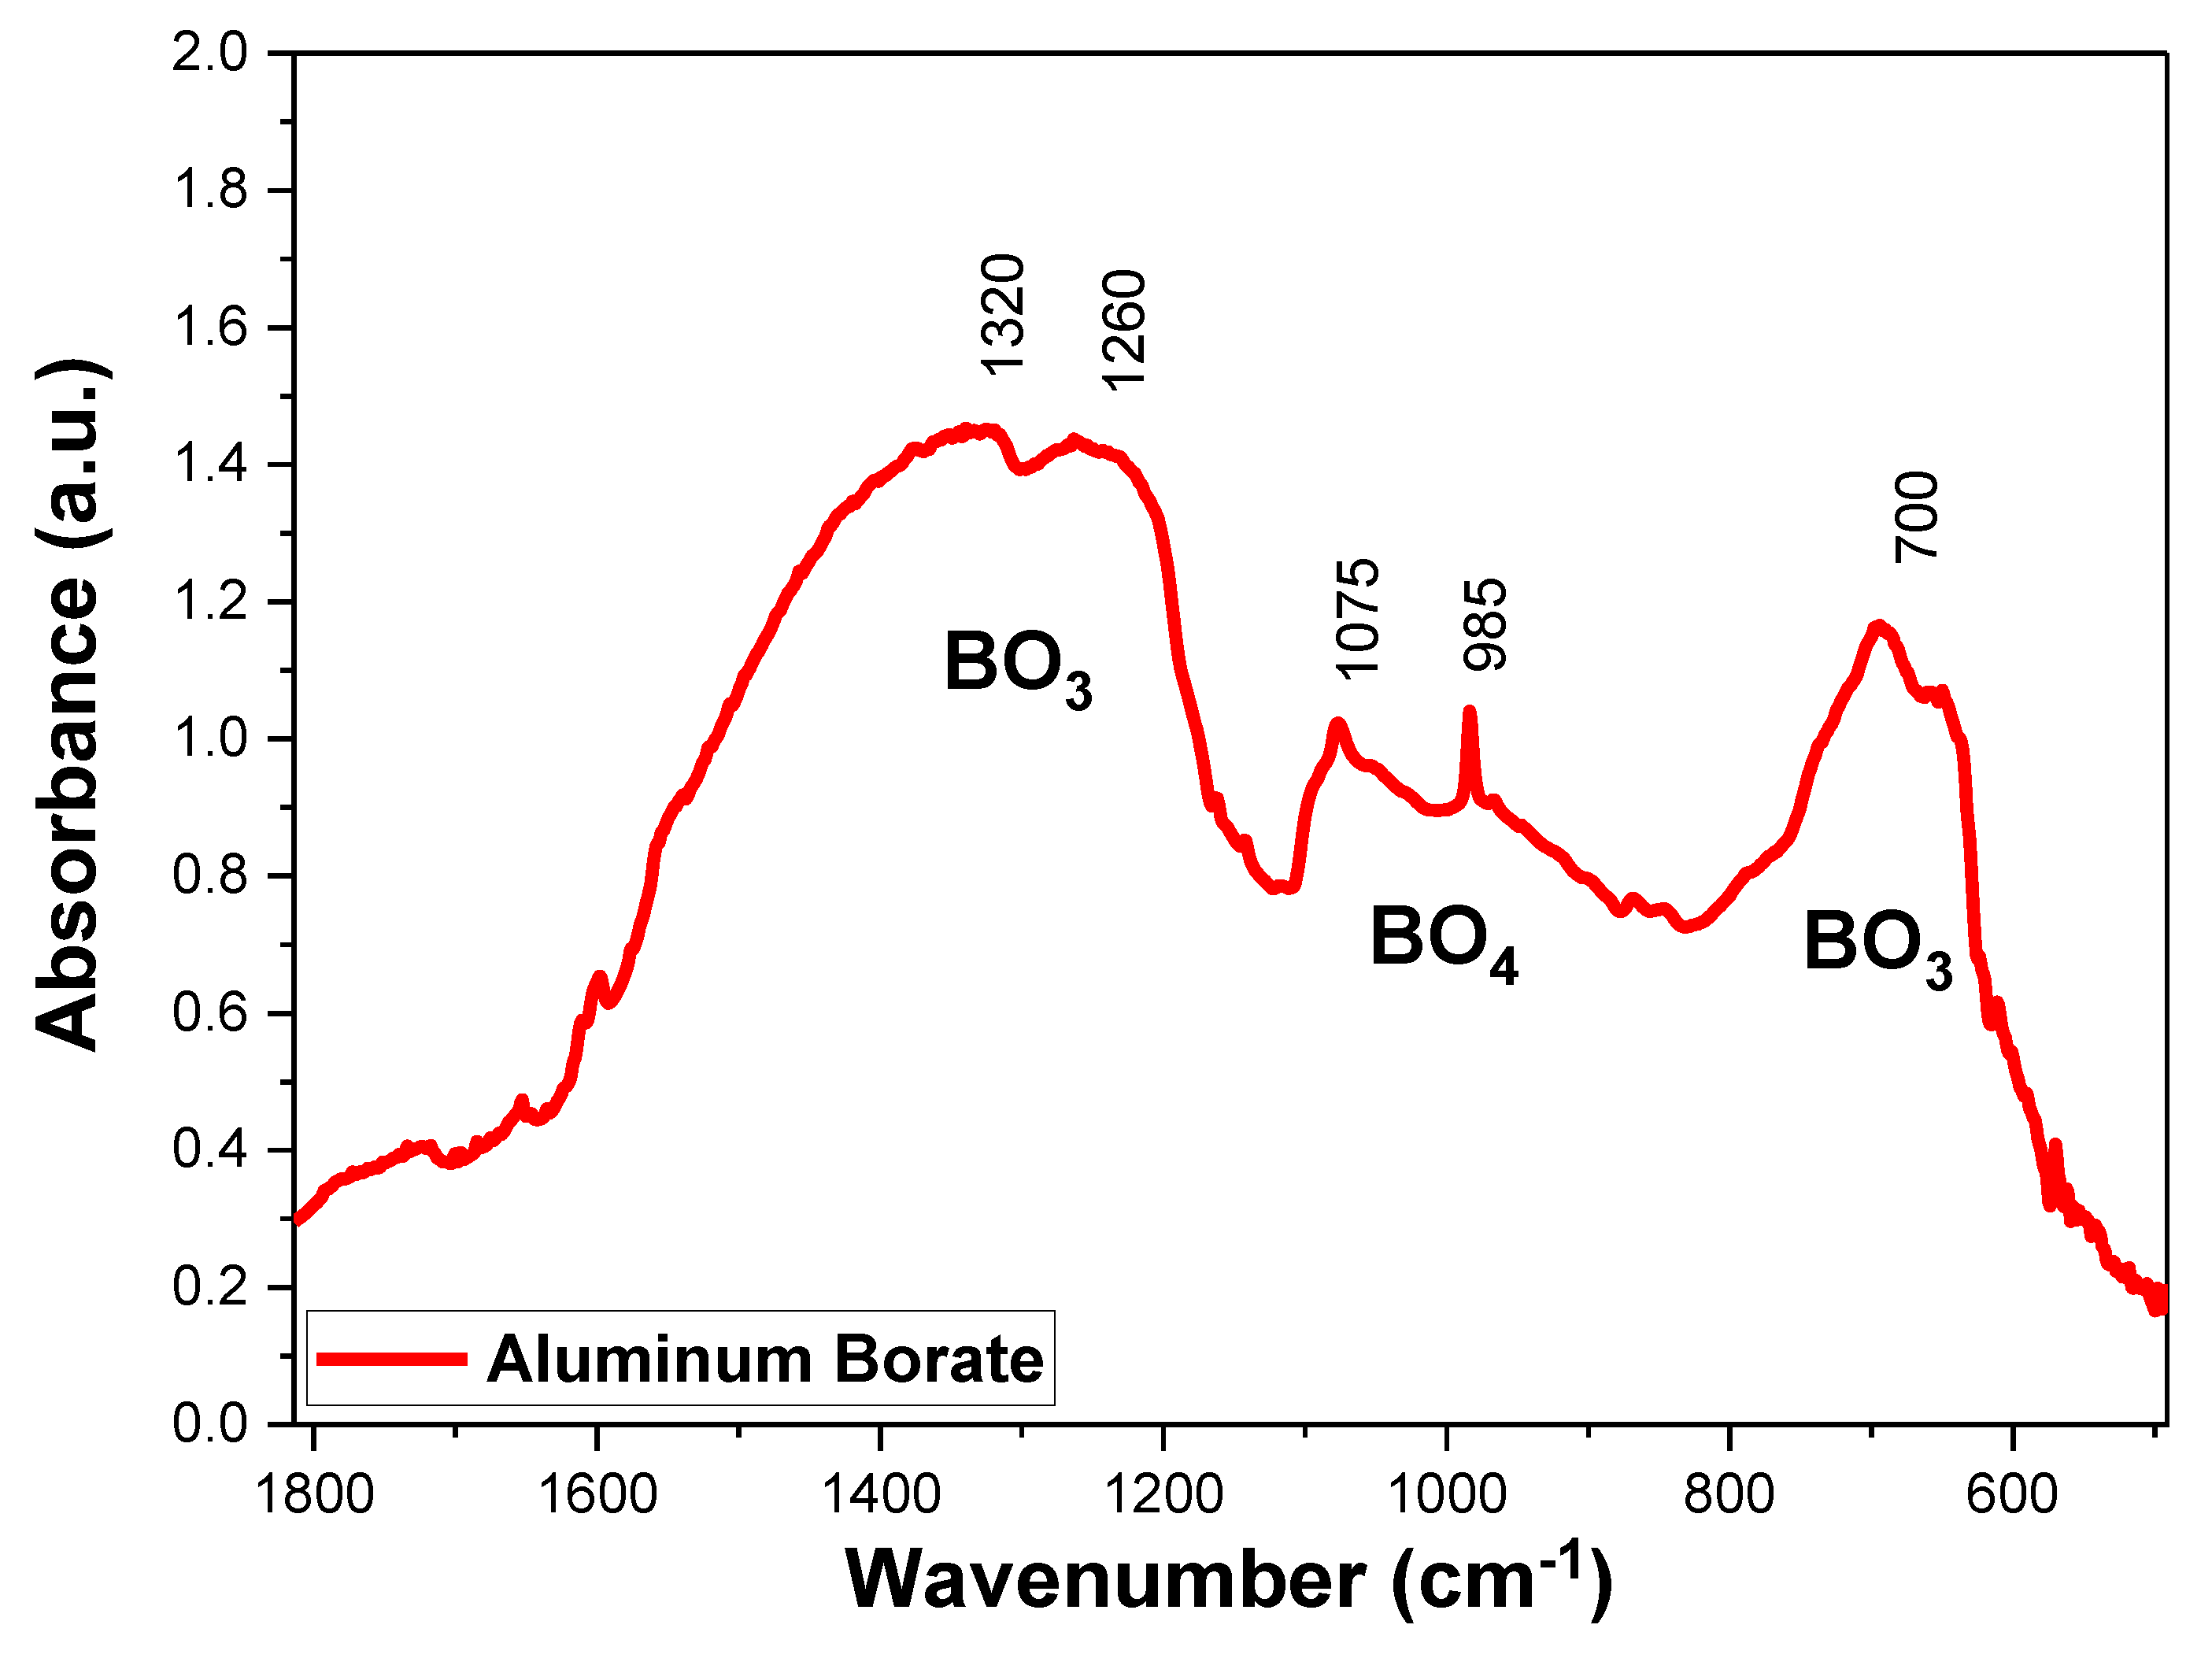
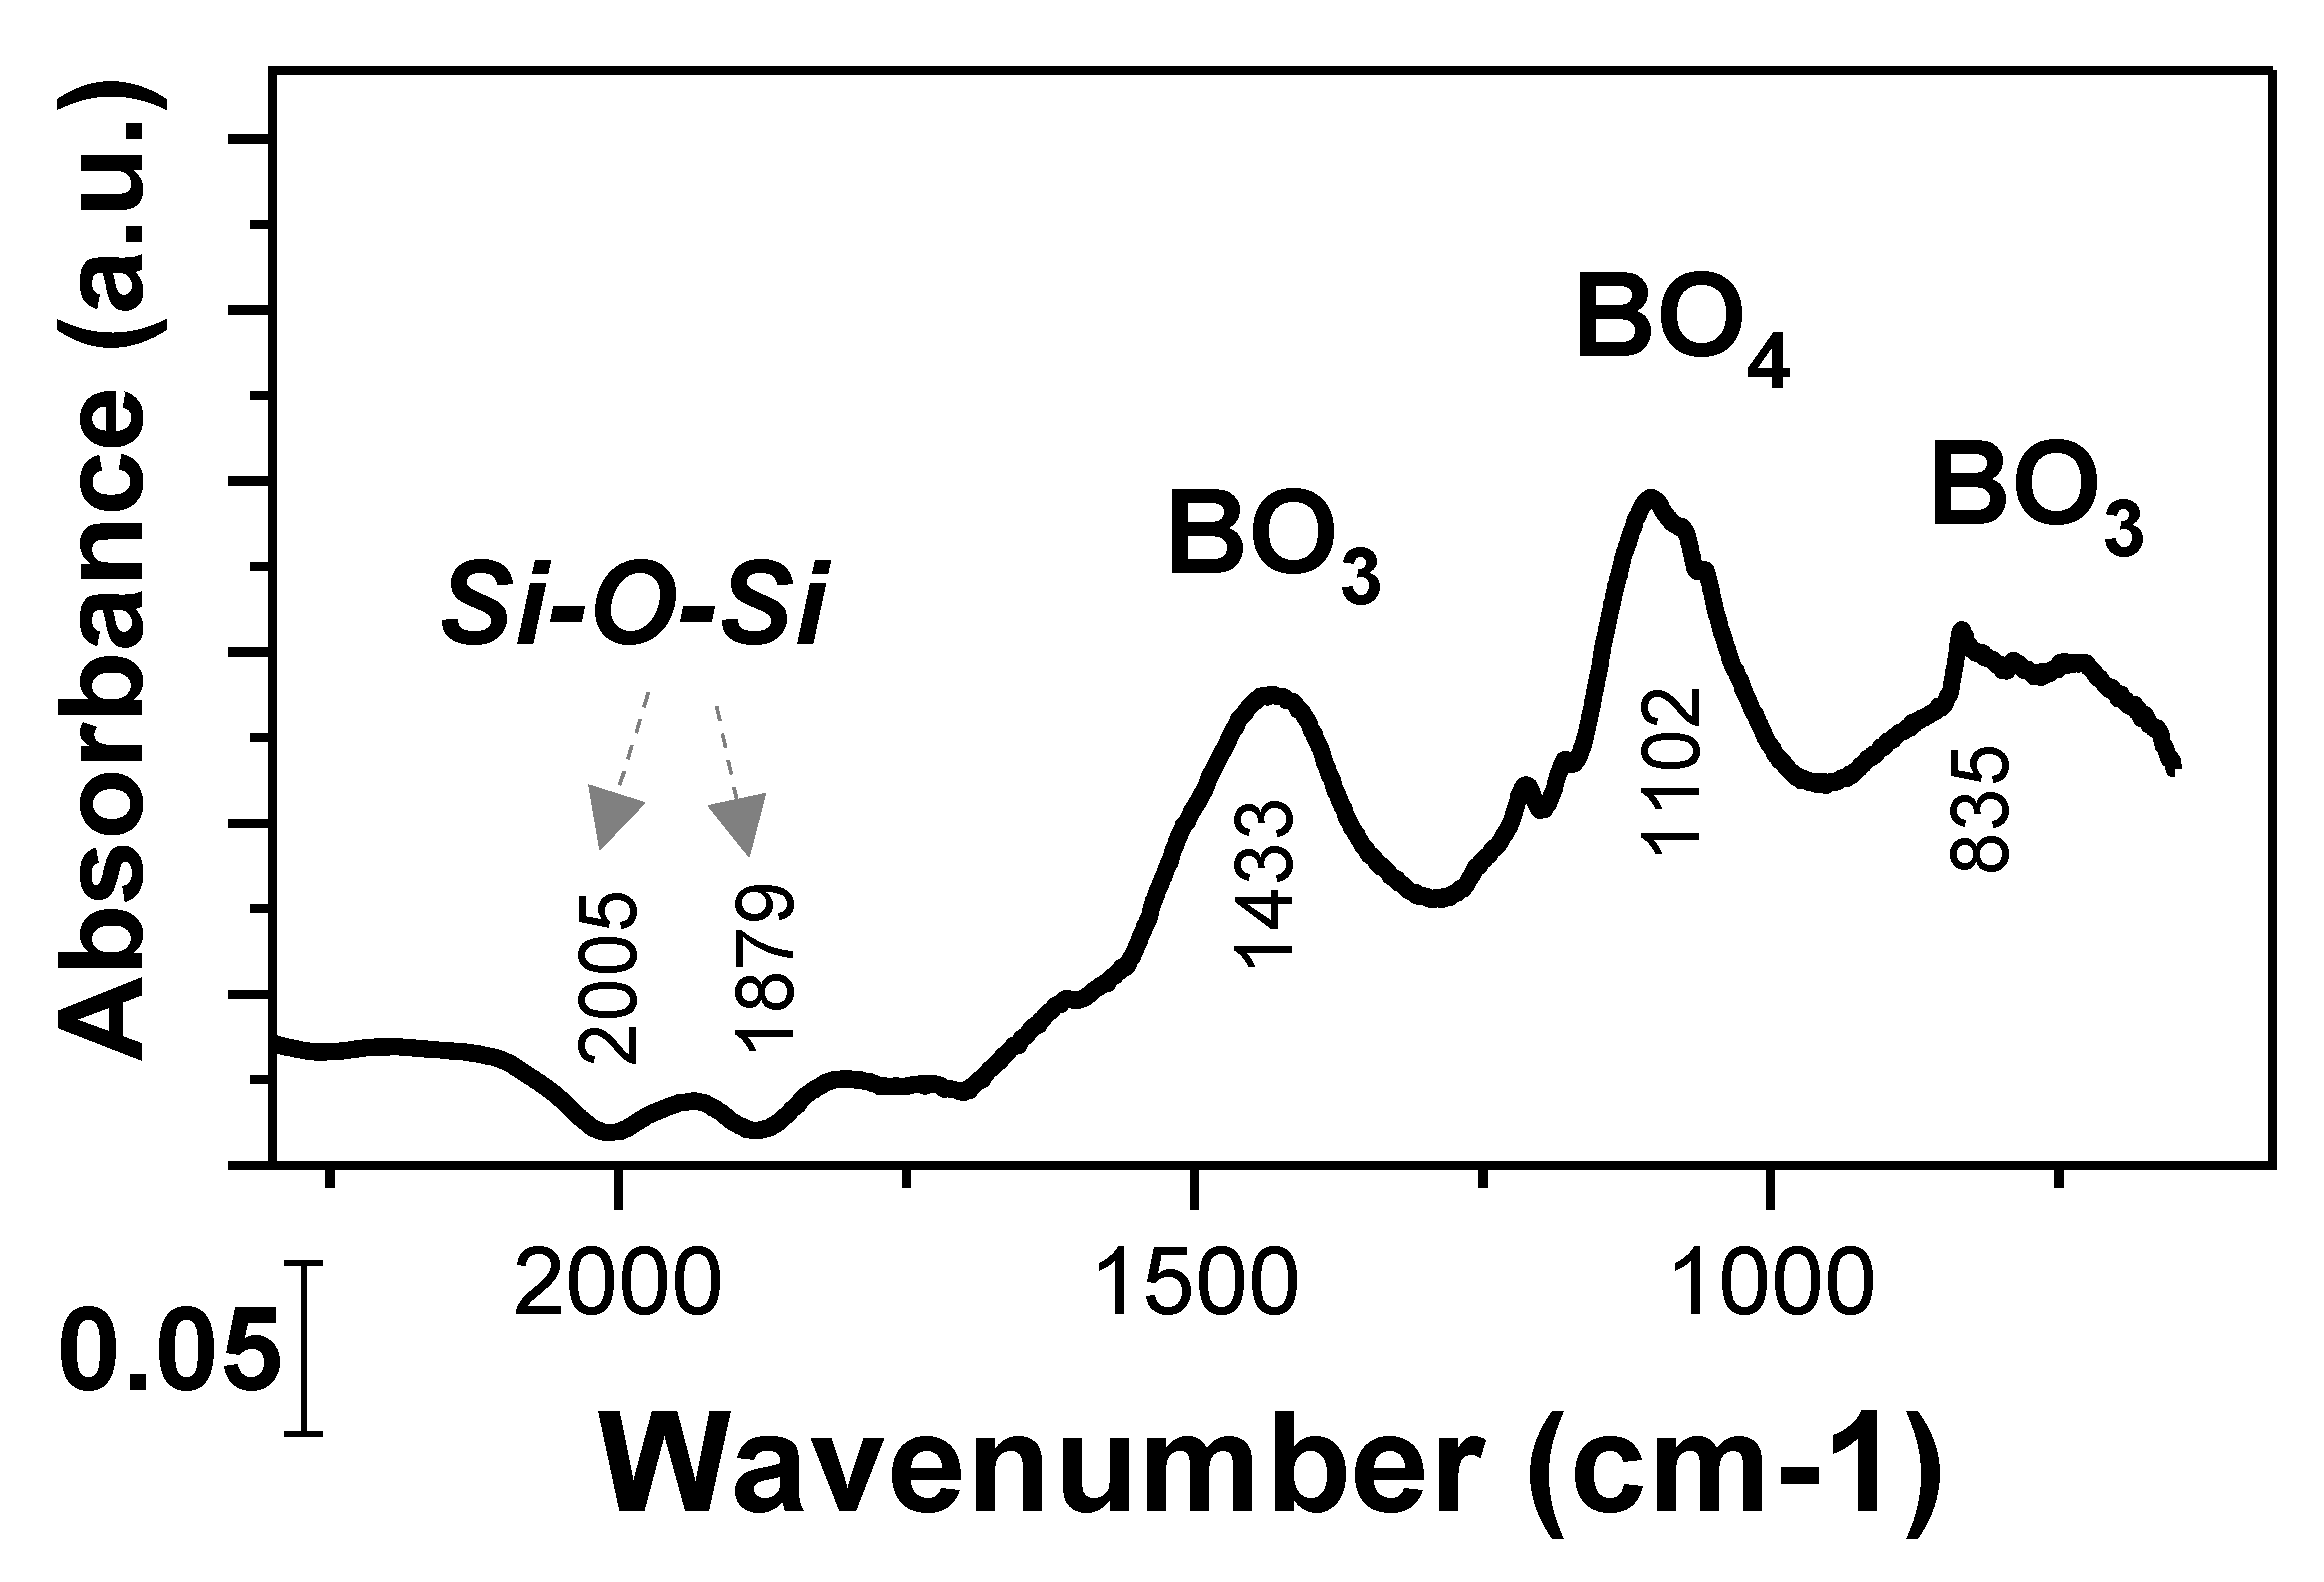
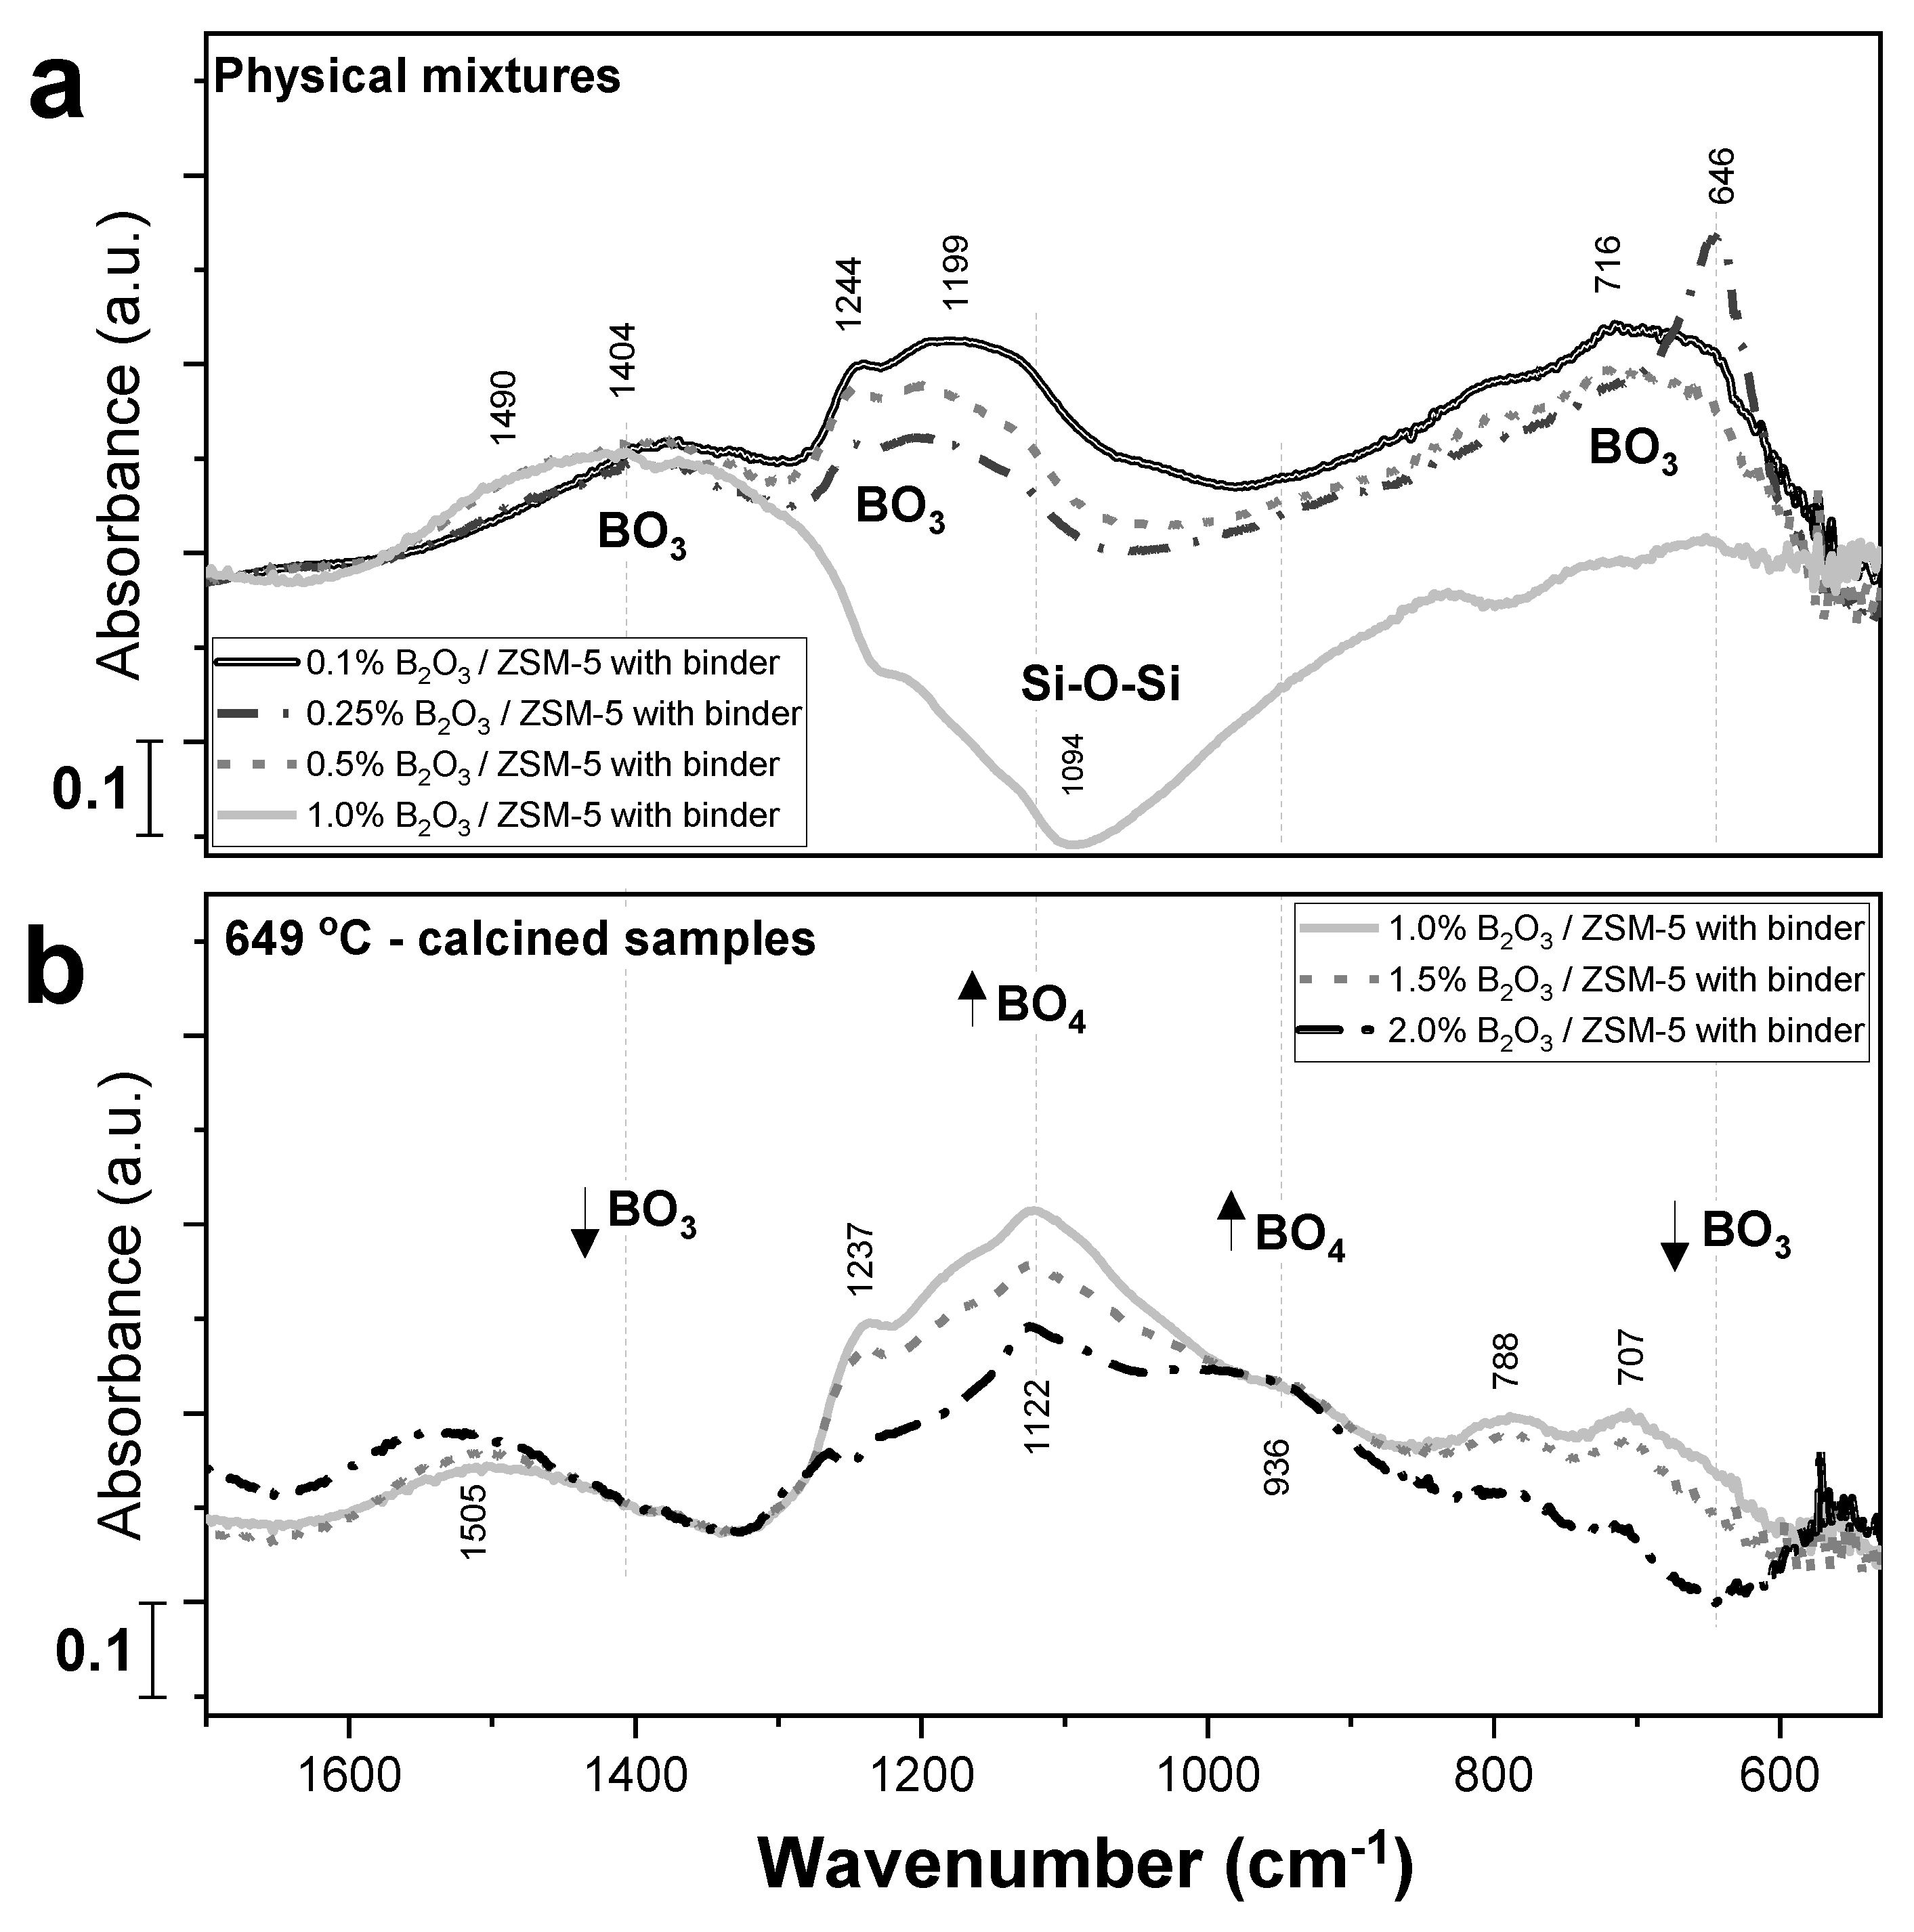
2.2. Borate Structure Characterization via FTIR

FTIR characterization of boron-containing materials is widely used in the field of glasses and ceramics. The borate vibration modes are detected in three main infrared regions. The IR absorbance in the 1200–1500 cm−1 range is assigned to asymmetric stretching of B-O bond in trigonal BO3 units. The B-O stretching in tetrahedral BO4 units is in the range of 800–1200 cm−1. The bending vibrations of bridging oxygen (B-O-B) between BO3 and BO4 units are active in the range of 600–800 cm−1 [17,18,19].
For alumina and boron trioxide mixtures, glassy structures, or polymeric network structures of boron trioxide cannot be formed even after high temperature treatments. Depending on the preparation temperature and the stoichiometric ratio between aluminum and boron, aluminum borate may form different cluster structures [20,21]. Figure 2 shows the FTIR spectrum collected for Al18B4O33 purchased from Alfa Aesar, which shows dominating BO3 structures centered at 1320, 1260, and 700 cm−1, and less amount of BO4 structures at 1075 and 985 cm−1.
Some of the novel FCC catalysts, such as those from Boron-based Technology (BBT), use boron species as precursor in the preparation processes [1]. The function of boron in this technology is to help passivate nickel in the fluid catalytic cracking unit to achieve higher yields of valuable hydrocarbons such as liquefied petroleum gas (LPG) and gasoline, reduction of unwanted hydrogen, and reduction of coke. As demonstrated in Figure 3 and discussed in detail below, the spectroscopic study confirms that during preparation/manufacturing of the catalysts, after the final calcination of the product, boron stays in borate structures (BO3 and BO4) in borate species rather than in boroxol rings in B2O3.
Since the boron content is usually at relatively low levels in FCC catalysts, a KBr reference background cannot be used to process the absorbance spectrum here. Using a KBr background would simply have the borate signals overwhelmed by much stronger absorbance signals from other major components in the catalysts. Instead, a background spectrum was collected on a specifically generated reference sample that has the identical composition and structure but without the boron species. Thus, the borate signals stand out by eliminating/canceling other IR signals during data processing. The proper selection of background spectra is the critical step in this methodology as it significantly lowers the detection limit to sub-percentage levels.
As shown in Figure 3, BO3 (at 1433 and 835 cm−1) and BO4 structures (at 1102 cm−1) are identified in IR spectra. The incorporation of borate in the support (containing silica, alumina, and zeolite) caused slight decrease in the Si-O-Si overtone signals at 2005 and 1879 cm−1, which indicates some silicon being replaced by boron in the support. This result is expected since after being subjected to high temperatures as part of the FCC manufacturing process, borate species are known to form upon interaction of boron-containing precursor species with the oxide materials (such as silicoaluminate phases in typical FCC catalysts and additives) that serve as the support structure.
In order to illustrate the interaction and transformation of boron trioxide with other materials used in FCC, two sets of experimental samples containing boron were prepared specifically for the FTIR characterization study. In order to achieve a cleaner comparison for this part of the study, an additive setup was chosen as the model system. ZSM-5 additives are typically used in FCC operations to boost propylene selectivity as well as to increase gasoline octane value [22,23]. They crack the gasoline range olefins into smaller hydrocarbons, and to serve that specific purpose they are typically simpler in design compared to base FCC catalysts since cracking matrices and metals traps that are part of the base resid-FCC catalysts are not included in the additive construct. To be able to provide information on the transformation of boron trioxide in an FCC microsphere production and use, samples prepared with an identical additive recipe were calcined at typical FCC catalyst/additive manufacturing conditions as a final step of the procedure. These comparisons were repeated at various boron loadings.
The first set of samples presented below in Figure 4 and Figure 5 contain the physical mixture of boron trioxide and ZSM-5 with alumina binder. The second set of samples contains the same ingredients (i.e., chemical composition of boron trioxide and ZSM-5 with alumina binder) but finished with a final calcination step at 649 °C by following a protocol typical to FCC catalyst/additive production. The comparison of the two sets of samples is shown in Figure 4 and Figure 5.
The physical mixtures of boron trioxide and ZSM-5 with alumina binder show a characteristic OH on boron trioxide at 3704 cm−1 (Figure 4a) and planar BO3 structures at 1404, 1244, 1199, 807, 716, and 646 cm−1 as shown in Figure 5a. Here the boron trioxide powders were prepared by grinding the glassy boron trioxide large particles into fine powders. Some nonuniformity may exist during the grinding and mixing processes that may affect the borate peak intensity slightly, for example the sharp peak at 646 cm−1 for the physical mixture sample with 0.25 wt.% B2O3 may indicate longer range ordering structures for larger particles. A noticeable boron-silicon exchange interaction can be clearly seen in the light blue spectrum for the physical mixture sample with 1.0 wt.% B2O3 with dramatically decreased Si-O-Si peak intensity at 1094 cm−1. The FTIR spectra on the physically mixed samples (B2O3/ZSM-5 with alumina binder) provide IR features associated with fine powder B2O3 with a characteristic B-OH (3704 cm−1) and planar BO3 structures.
The samples where the preparation was completed with a 649 °C calcination step are presented in Figure 4b and Figure 5b. Experiments were conducted at 1 wt.% B2O3 concentration in order to serve a comparison basis against the physical mixture samples; and also at 2 wt.% B2O3 level to see the nature of transformation at higher boron loadings. In both cases, after high temperature calcination, the characteristic B-OH peak disappears. The BO3 feature at 1404 cm−1 shifts to higher wavenumbers (~1505 cm−1), and the bending B-O-B for BO3 features (807, 716, and 646 cm−1) are significantly reduced. The BO4 feature at 936 cm−1 appears. These changes are associated with the breakdown of planar BO3 structures and formation of borate BO3 and BO4 units.
As shown in the results presented in Figure 4 and Figure 5, with the choice of right reference samples and control experiments, FTIR can serve as a sensitive technique for the characterization of boron trioxide and borate species. The isolated B2O3 phase can be detected by FTIR at low concentrations (0.1% by weight as in provided samples). The small borate BO3 and BO4 units can be detected at 0.5% by weight even in actual industrial catalyst samples as presented in Figure 3.

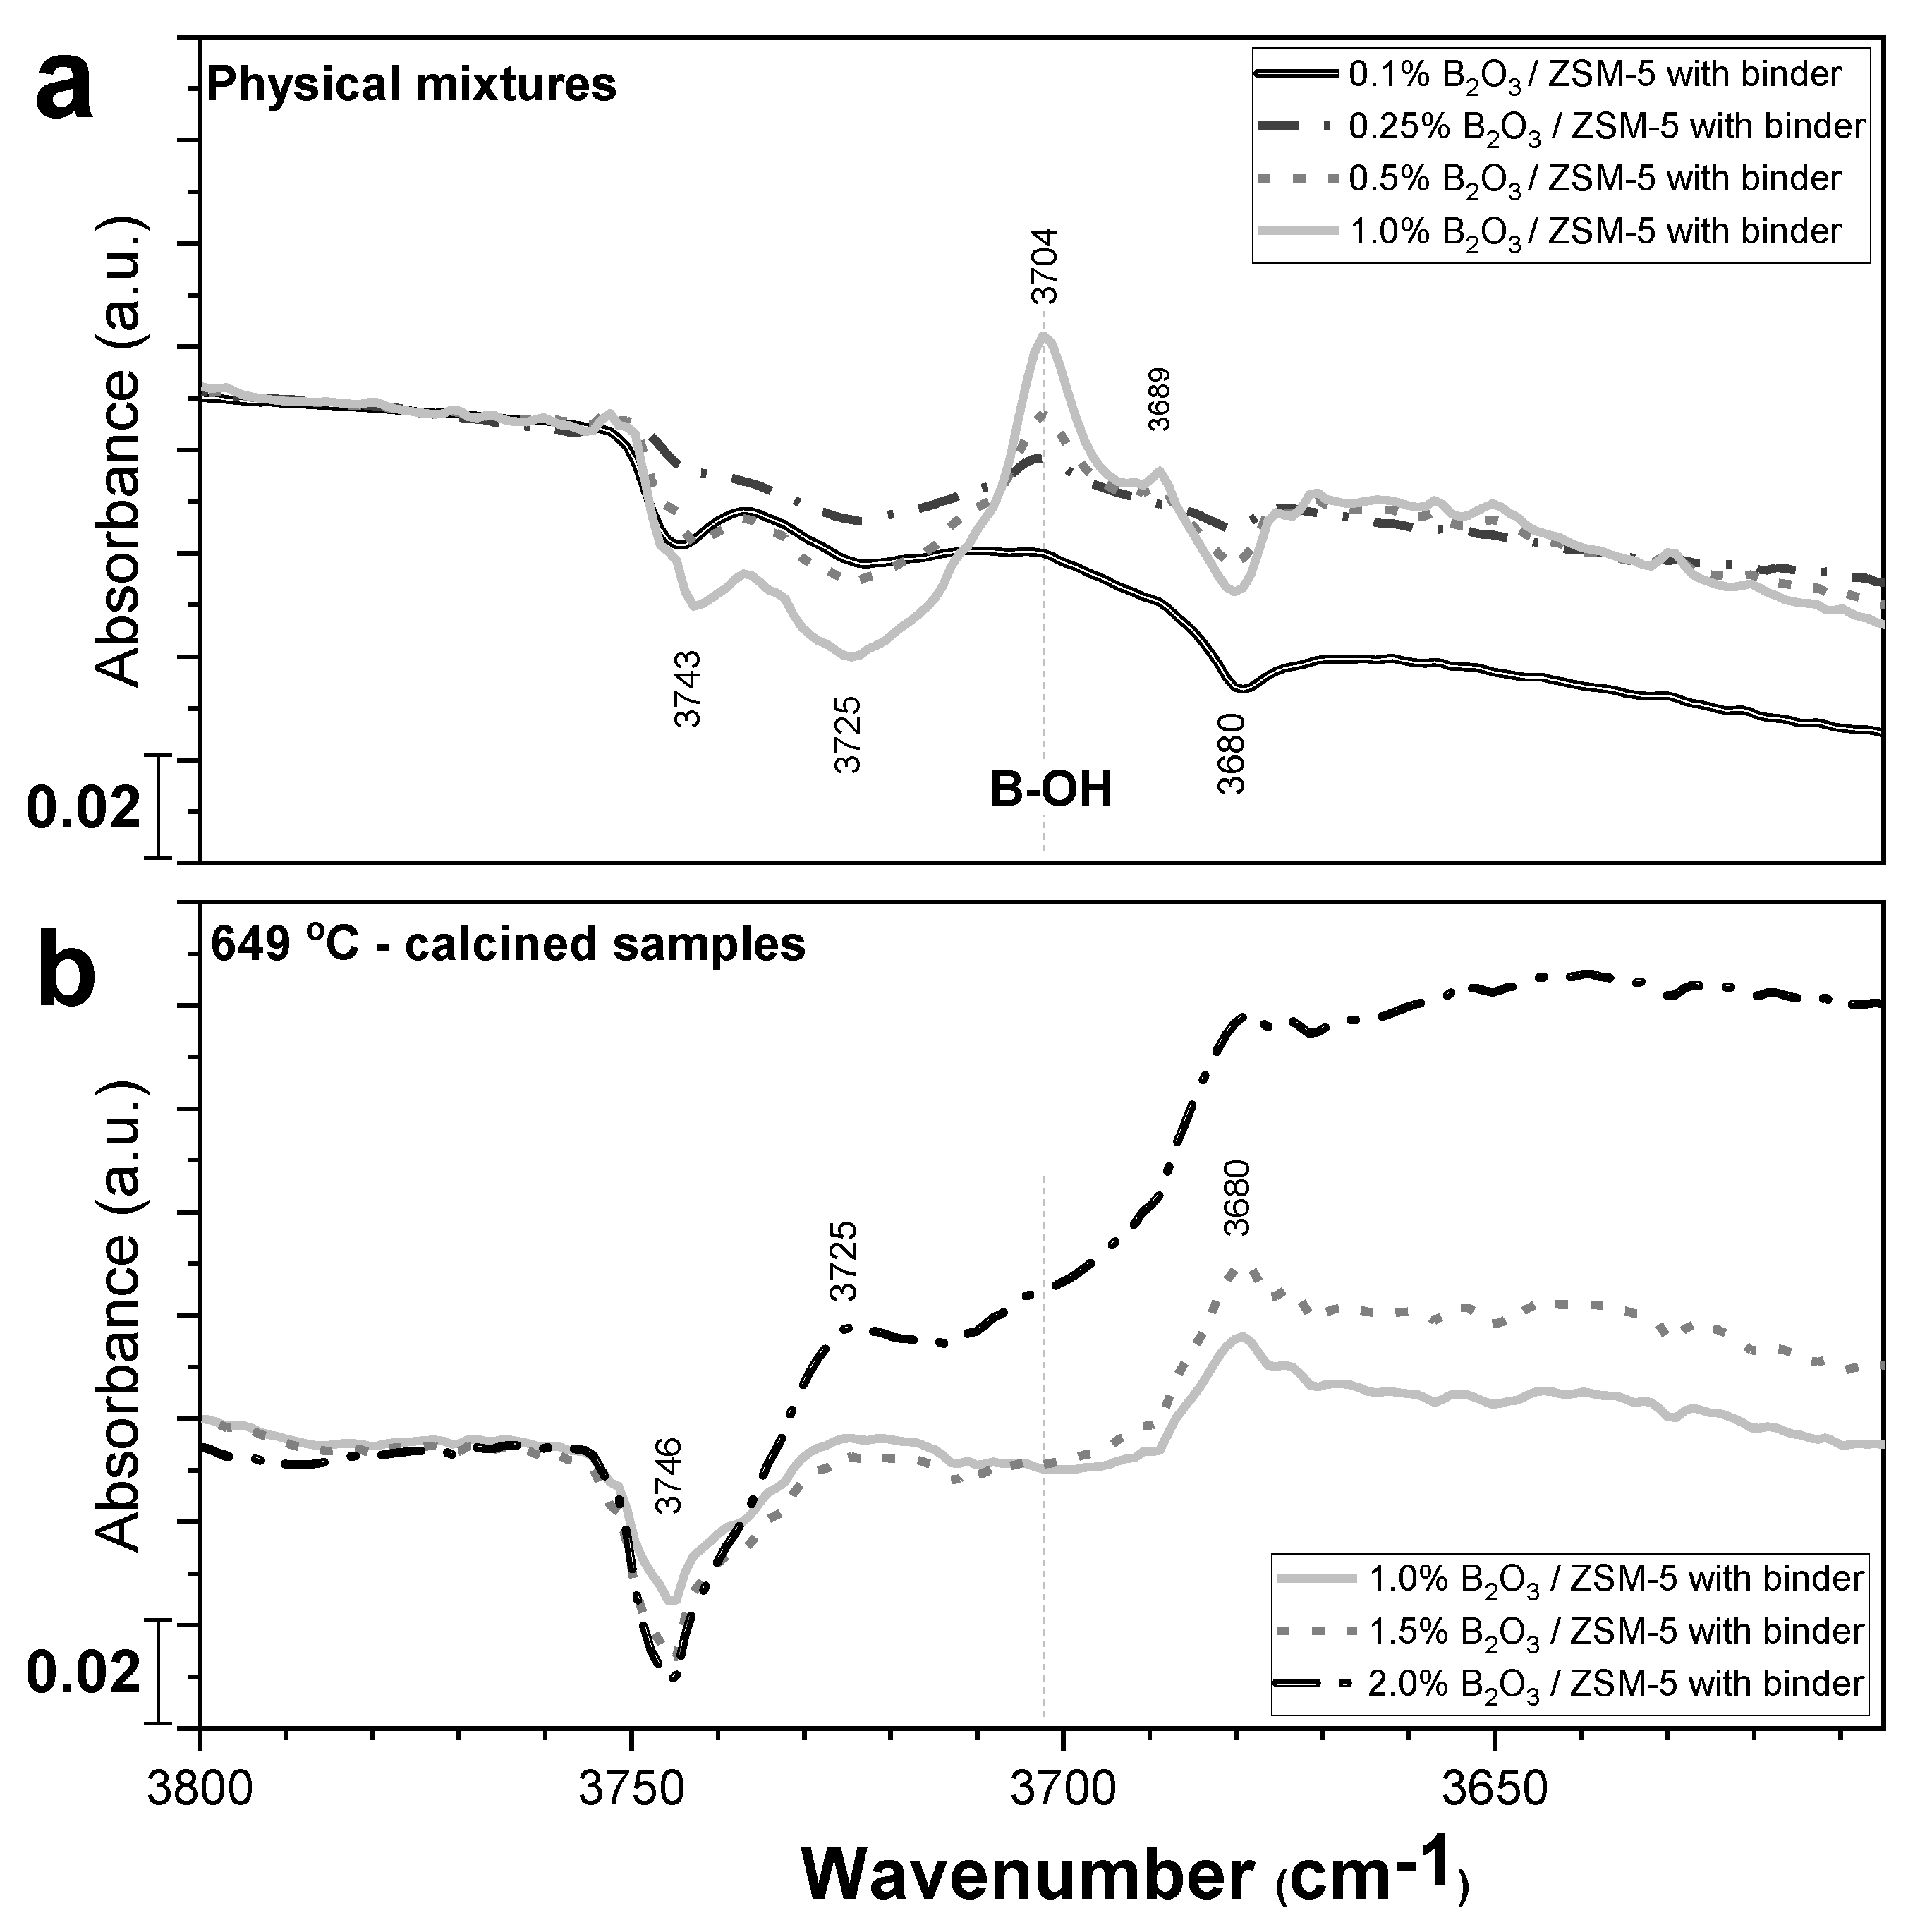
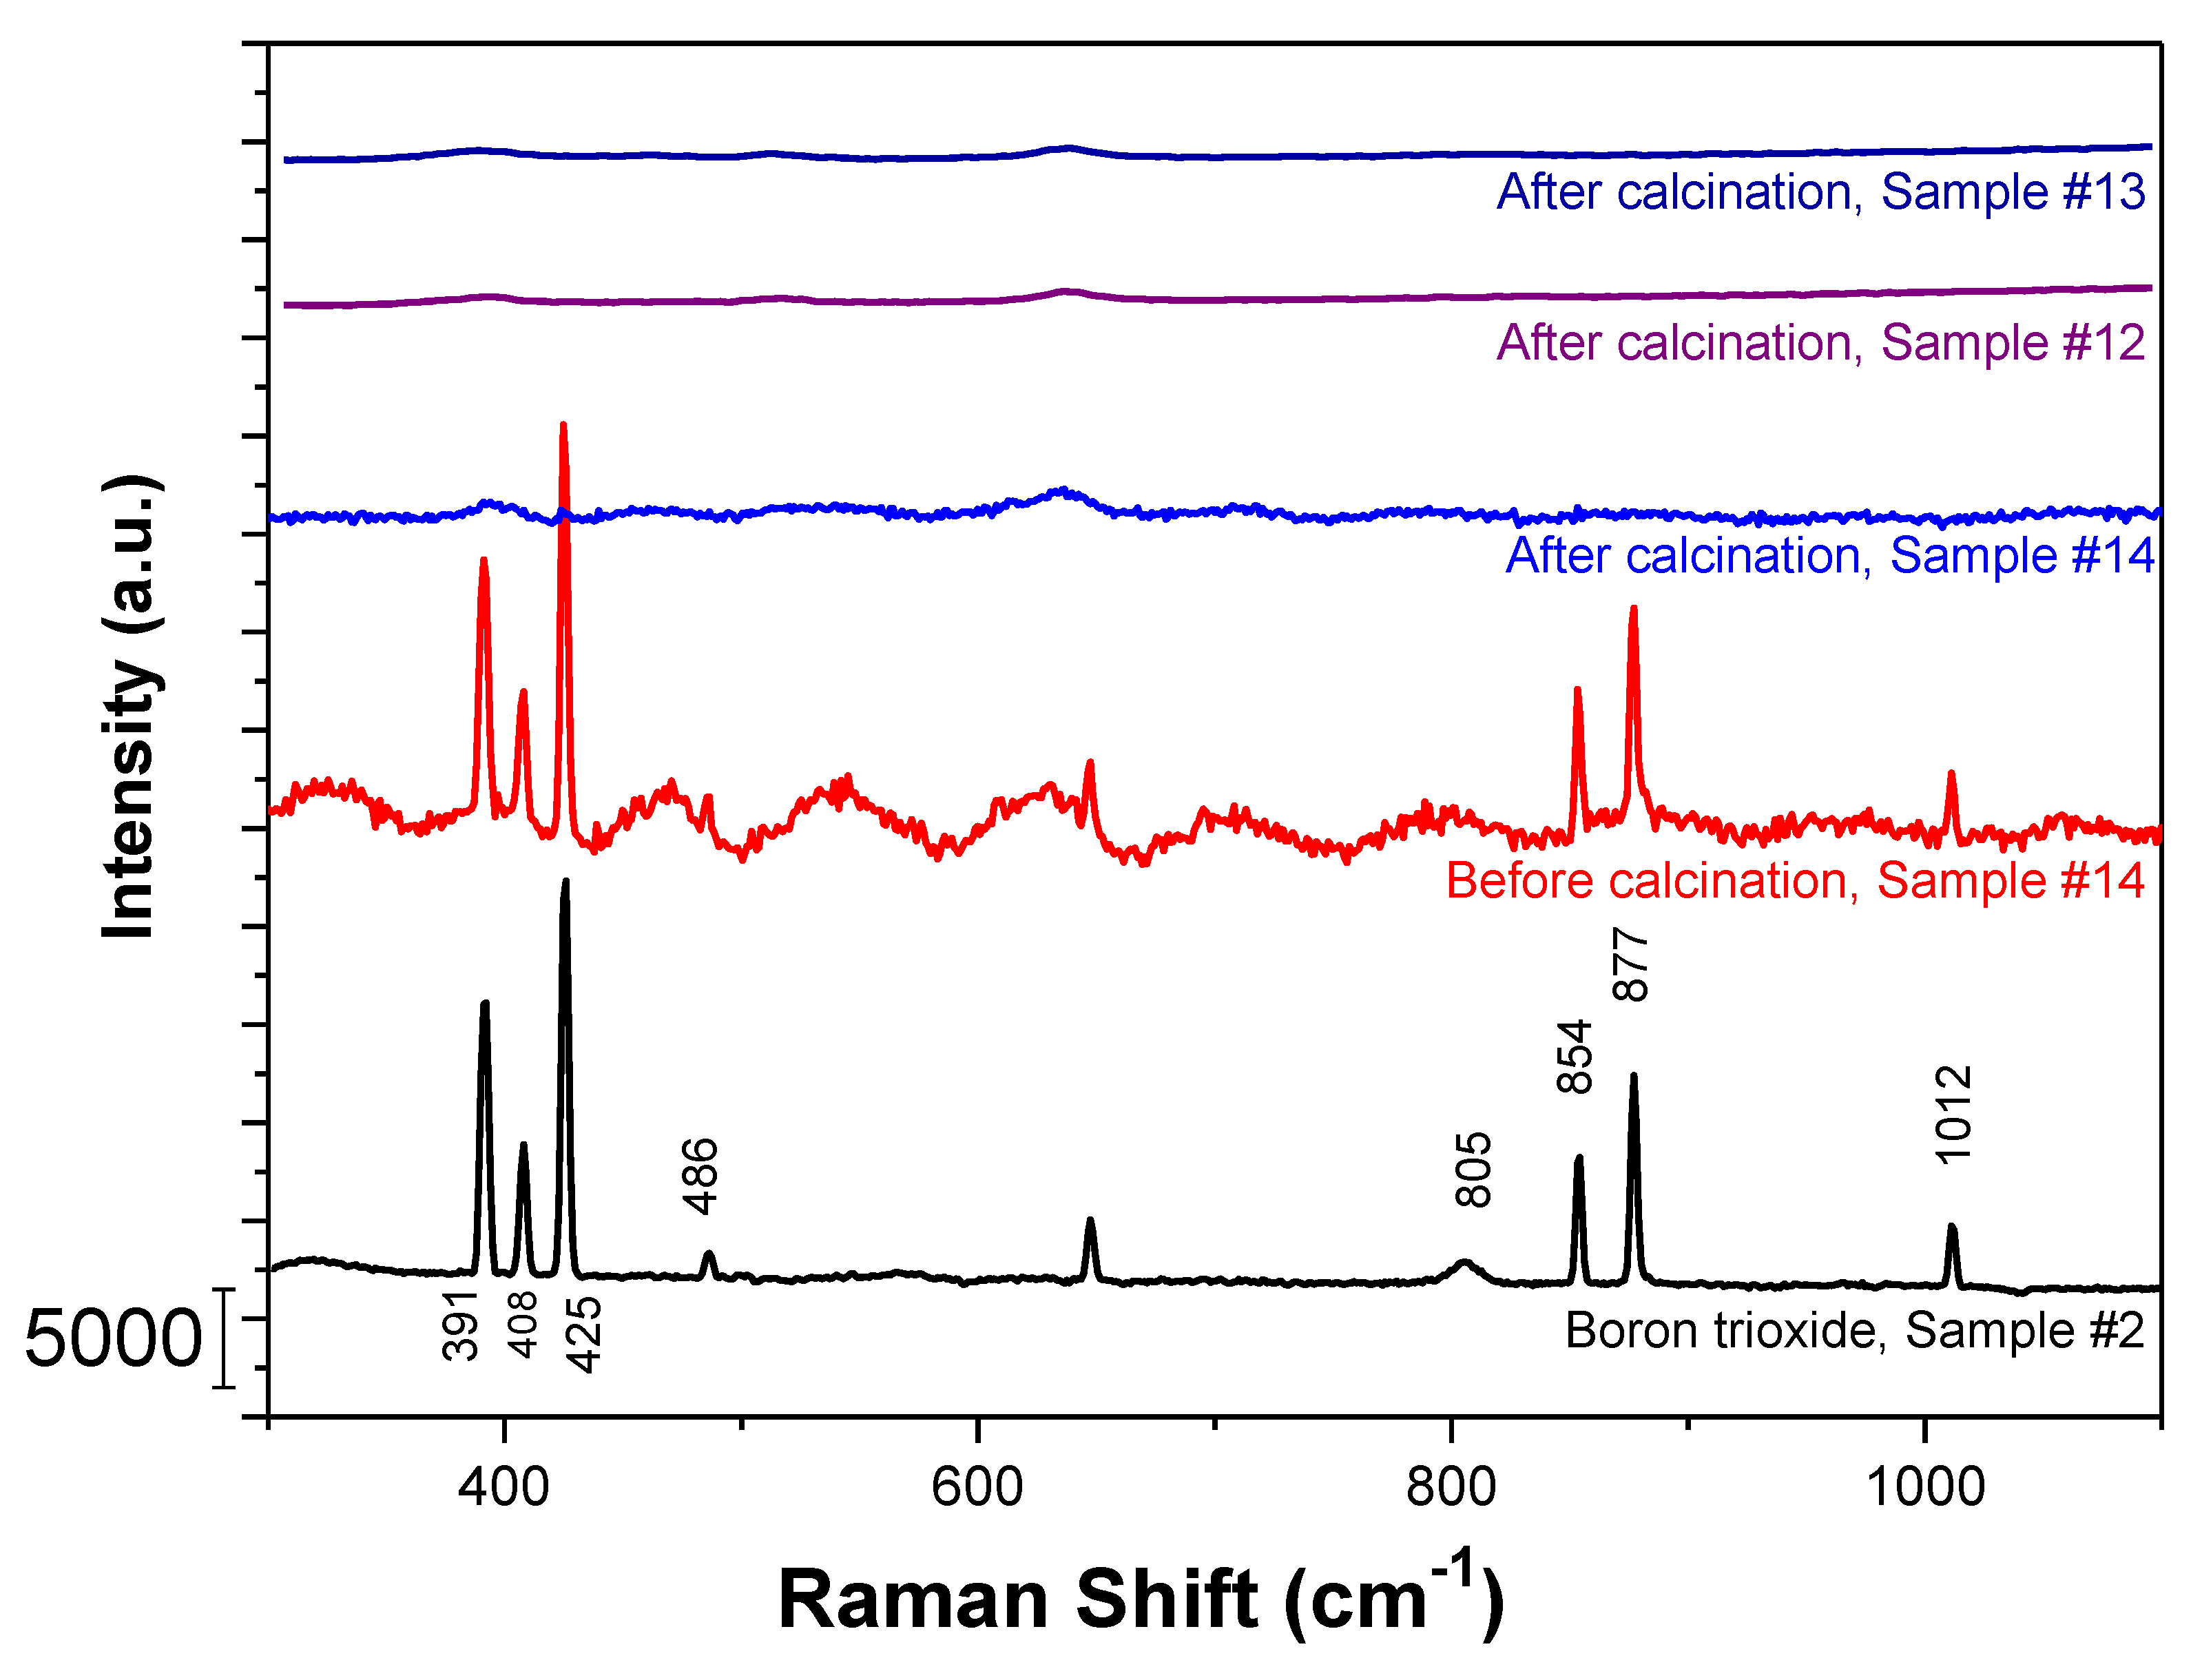
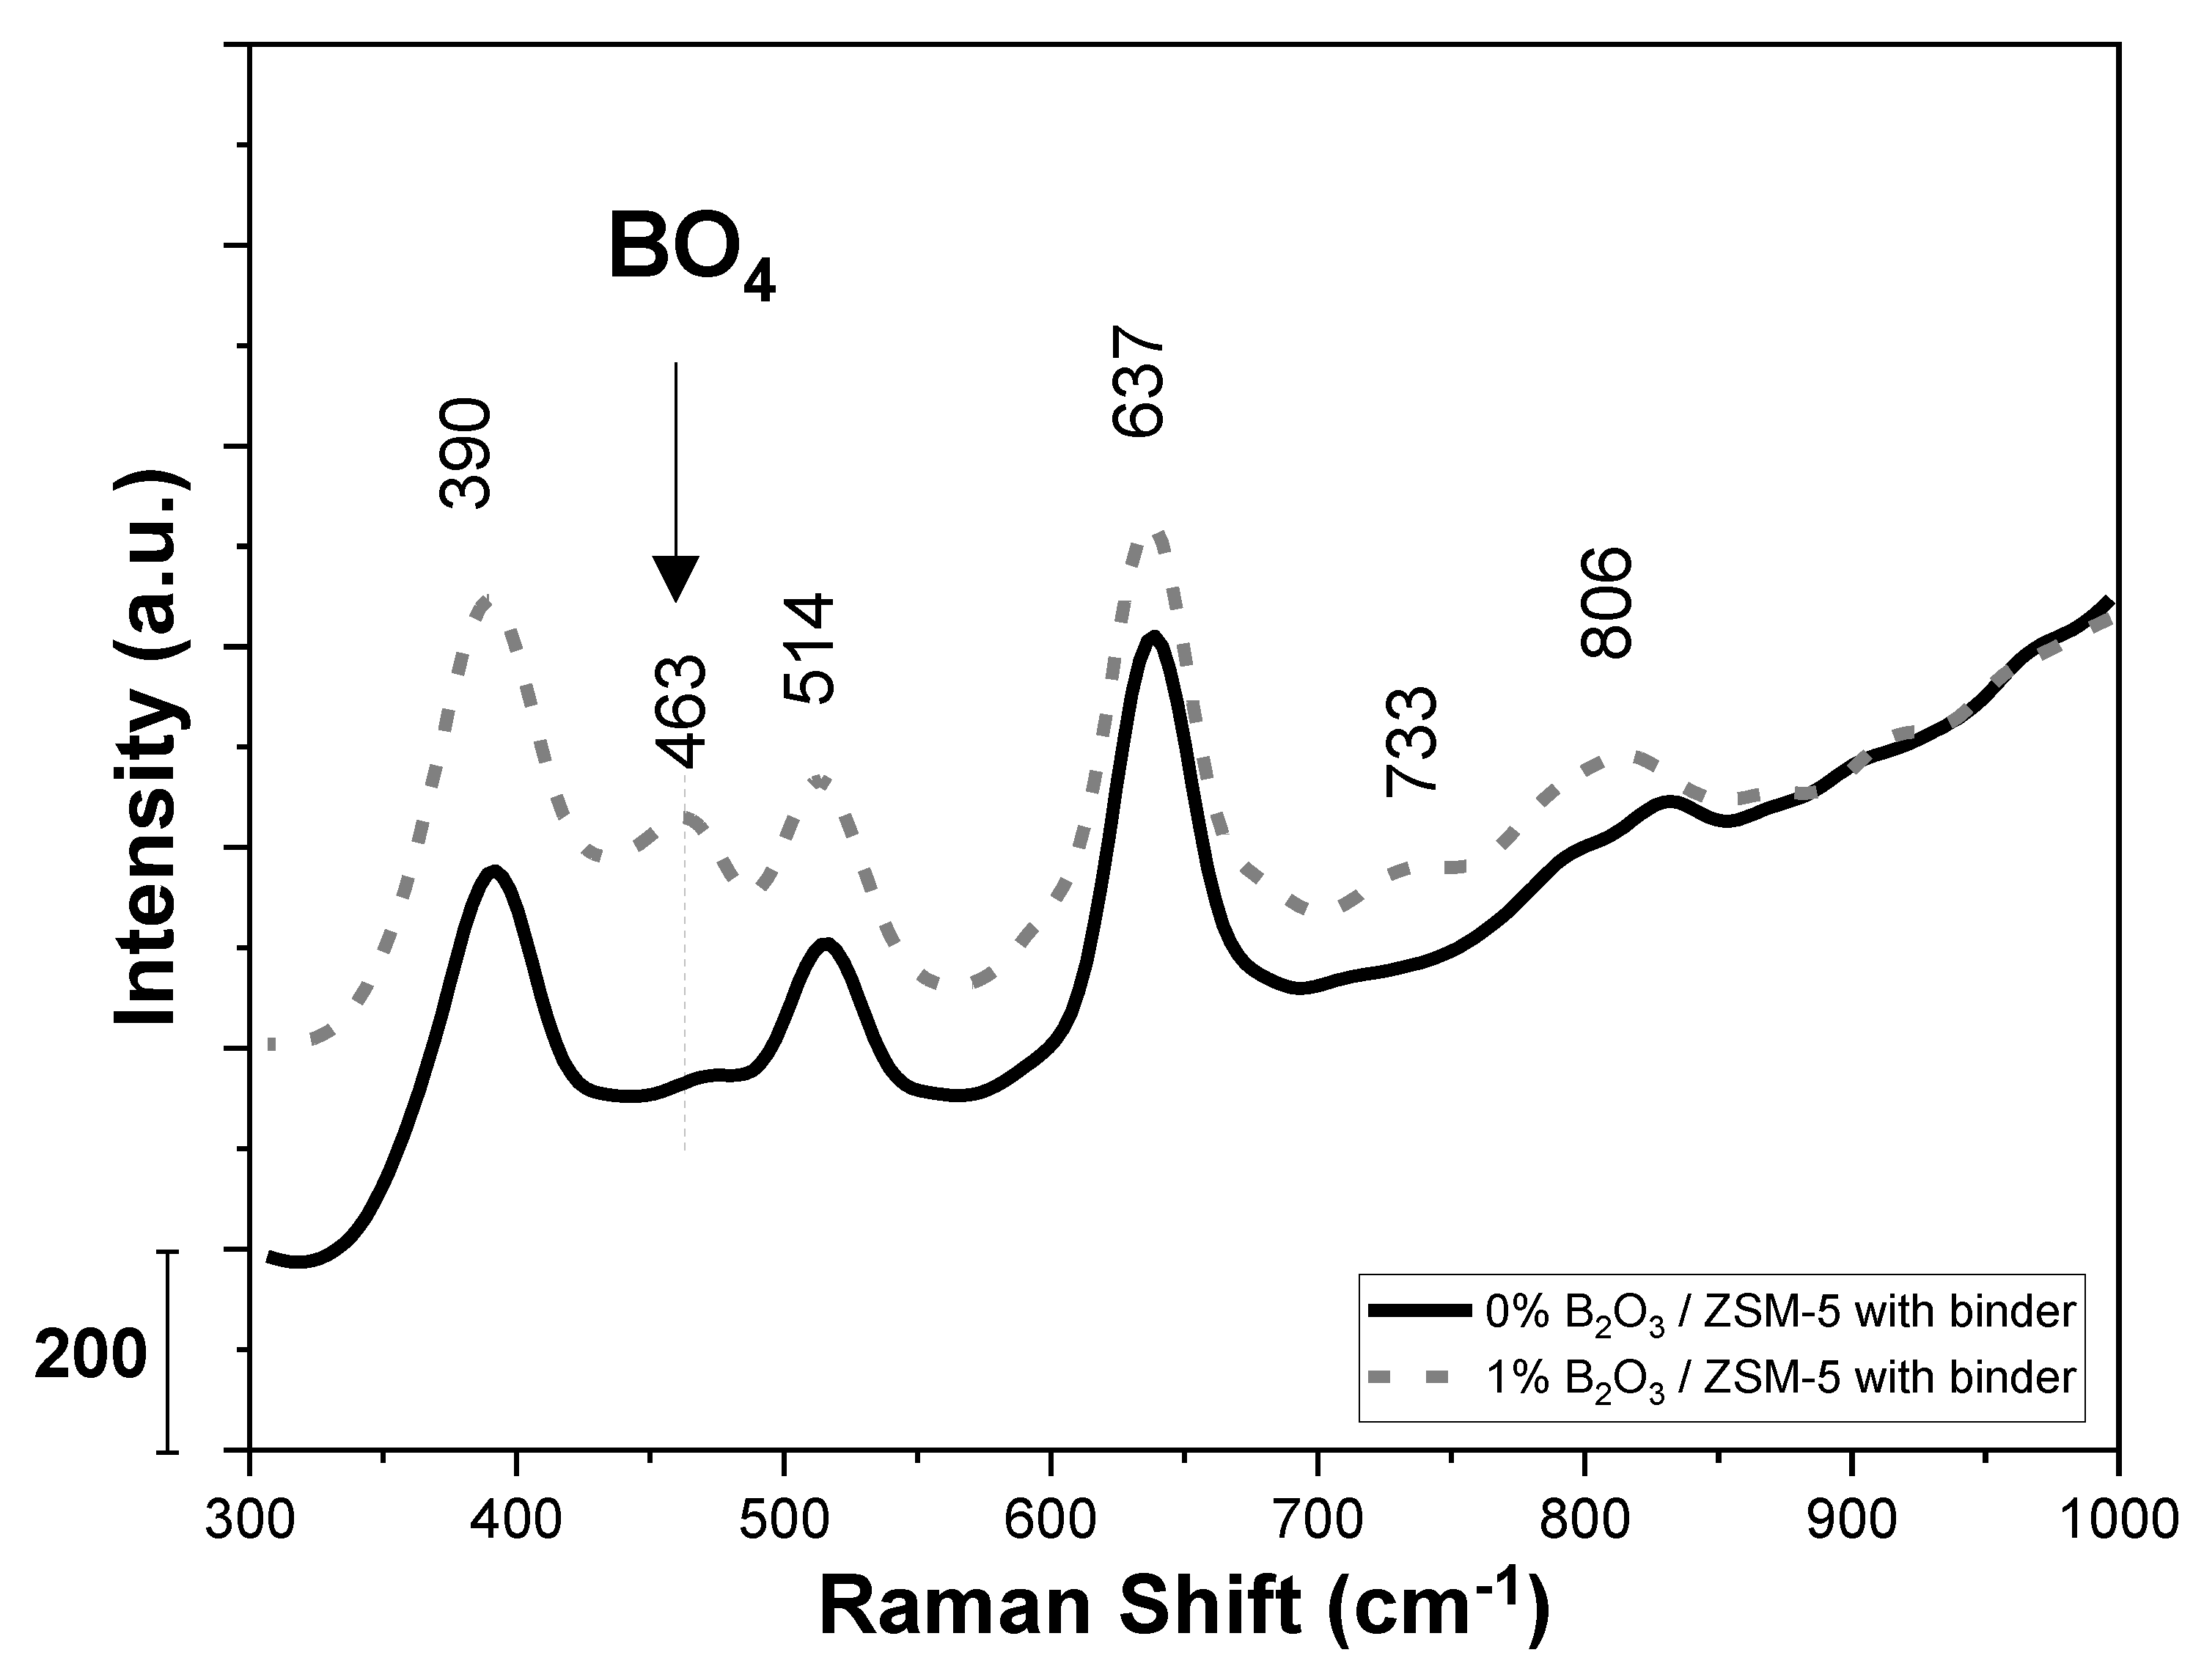
2.3. Characterization of Boron via Other Spectroscopic Techniques

For the second phase of the investigation other spectroscopic analyses, namely Raman, XPS and NMR, were carried out to explore their potential utilization for characterization of boron species in FCC catalysts and additives for Environmental Health and Safety (EHS) purposes as described above in Section 1. Again, the ZSM-5 additive system was chosen as the model case for this part of the study. Pilot-scale fluidizable FCC microsphere samples were prepared with 1 wt.% B2O3 loading as well as a reference sample without boron. For validating the complete transformation and disappearance of boron trioxide under typical FCC catalyst/additive processing conditions, a sample with higher B2O3 content was also prepared at 2 wt.% B2O3 loading. In order to ensure that there is no interference with other species, this sample contained only Boron on the silicoaluminate matrix support and was prepared without any zeolite or binder.
Raman Spectra in Figure 6 shows the comparison of calcined FCC additive Samples #12 and #13 (collected using a 488-nm laser) and a silicoaluminate support loaded with B2O3 before and after calcination using a 785-nm excitation laser, where the spectra collected under different lasers were normalized using peak intensity at 635 cm−1. In this experiment, a reference sample of standard pure boron trioxide was also included and showed Raman shifts at 258, 271, 391, 408, 425, 486, 648, 854, 877, 1012, and 1274 cm−1, where peaks at 258, 271, 391, 408, 425, 648, 854, 877 cm−1 are assigned to BO3 and peaks at 486, 1012, 1274 cm−1 are assigned to BO4 [24,25,26,27,28]. The silicoaluminate support loaded with B2O3 (before calcination) shows these B2O3 Raman peaks, while the calcined samples do not have any of these peaks. This result demonstrates that after calcination, the precursor B2O3 phase disappears, which is likely due to the formation of borate species.
Raman spectra in Figure 7 show a close look of the top two traces of spectra in Figure 6, which demonstrate the presence of BO4 borate unit in the ZSM-5 sample with boron. Compared to the reference sample #12 without any boron oxide precursor, the sample #13 with 1 wt.% B2O3 as precursor shows an additional signal at 463 cm−1, which is assigned to BO4 unit vibration based on the peak assignments using a commercial standard phosphor borate material. Other peaks at 390, 514, 637, 806 cm−1 exist both in the control sample (no boron) and the 1% boron addition sample, which are possibly due to some TiO2 present in the samples.
In addition to FTIR and Raman spectroscopy methods, additional characterization techniques such as XPS and NMR spectroscopy experiments were also conducted for boron material characterization as shown in the Supplementary Materials. Since the FCC catalysts/additives contains silicon oxide and some phosphor components/impurities, XPS analysis shows B 1s signal overwhelmed by P 2s and Si 2s plasma peaks, which agrees with results in literature [10]. As expected [11], the 11B NMR analysis shows very similar BO3 chemical shifts for standard materials aluminum borate and boron trioxide, which makes it challenging to precisely identify boron phases in practice.
In summary, the Boron characterization using infrared spectroscopy is clearly a better approach compared to the Raman spectroscopy, XPS and NMR. The borate signal can be significantly improved in FT-IR analysis with all other signals in the supporting materials subtracted when processed using a properly selected background spectrum. However, the Raman Spectrum reads counts directly, where the borate signals might be overwhelmed easily by other signals from the supporting materials.

3. Materials and Methods

3.1. Sample Information

The detailed sample information is listed in Table 1. The boron oxide content was analyzed and confirmed by X-ray fluorescence (XRF) spectroscopy analysis. Samples #1–11 were characterized in the boron trioxide and borate analysis. There are reference samples such as boron trioxide, phosphor borate and aluminum borate. Sample #4 is the industrial FCC catalyst sample utilizing the Boron Based Technology. Samples #5–8 are physical mixtures of boron trioxide with ZSM-5 additive microspheres that consist of ZSM-5 with alumina binder, P2O5 and clay to serve as control experiments against Samples #9–11 are identical to Samples #5–8 in composition but are subjected a calcination step typical to FCC catalyst/additive manufacturing as a final step. Samples #5–11 are representing the main ingredients of an FCC additive preparation recipe with various amounts of boron loaded on ZSM-5 additive microspheres as supporting materials; but only for Samples #9–11 the preparation is finished by a calcination step to demonstrate the impact of that step on the nature of boron species in a typical FCC catalyst/additive manufacturing procedure. A typical ZSM-5 additive recipe consisting of ZSM-5 with alumina binder, P2O5 and clay was chosen as the model system to study via controlled experiments with tailor-made reference samples in order to achieve a cleaner comparison. This is mainly because ZSM-5 additives are typically simpler in design compared to base FCC catalysts since cracking matrices and metals traps that are part of the resid-FCC catalyst design are typically not included in the additive construct [29,30]. Samples #12–13 are pilot-scale samples generated following a FCC additive preparation procedure with 0% and 2% B2O3 in a mixture of ZSM-5, alumina binder, P2O5, and clay, followed by a calcination step typical to FCC catalyst/additive manufacturing. The resulting materials are fluidizable ZSM-5 additive microspheres with physical properties characteristic of commercial FCC particles.

3.2. Raman Spectroscopy

Raman spectra were collected on a Renishaw InVia Raman microscope (Renishaw plc., Gloucestershire, United Kingdom) with a 785-nm laser as the excitation source. A Leica N PLAN microscope/50× objective lens (Leica Microsystems, Wetzlar, Germany) was used to focus the 785-nm laser beam on the sample surface at 1% in power usage.

3.3. Infrared Spectroscopy

Diffuse Reflectance Infrared Fourier Transform Spectroscopy (DRIFTS) experiments were performed on a Varian 7000 FTIR spectrometer (Agilent Technologies, Santa Clara, CA, United States) equipped with an MCT detector and a DiffusIR high-temperature environmental chamber with a KBr window (Pike Technologies, Madison, WI, USA). Spectrum collection was performed under diffuse reflection mode. The samples were ground into fine powders with a mortar and pestle, and then packed into the sample cup. The samples were dehydrated in Ar at 200 or 400 °C for 1 h with a ramp rate of 20 °C/min. IR spectra were collected after dehydration, once the chamber had been cooled to 30 °C.

4. Conclusions

Environmental Health and Safety (EHS) classification of industrial catalysts requires suitable methods to be able to analyze and identify—as well as confirm the absence of—regulated species. In this contribution an FTIR Spectroscopy methodology that provides phase and structural characterization of boron-containing FCC catalysts is presented. It shows that FCC catalysts with Boron Based Technology (BBT) do not contain any detectable amount of boron trioxide. It also shows that the typical FCC catalyst synthesis procedures would transform boron trioxide if it were used, since the FCC microspheres go through the high-temperature calcination process that breaks down boron trioxide planar BO3 network structures to form small borate BO3 and BO4 units. FTIR proves to be a sensitive method to differentiate boron trioxide and borate structures with a detection limit at 0.1% by weight.
Other spectroscopic techniques such as Raman, NMR, and XPS were also utilized as part of this investigation. Even though Raman spectroscopy provides insights on the complete transformation of any boron trioxide (if it were to be used as a precursor) in the FCC catalysts/additive after calcination, and confirms the absence of boron trioxide in the final product, it did not provide clear signals of the new borate species at the same sensitivity level as FTIR. Thus, Raman spectroscopy together with XPS and NMR techniques were not seen as suitable standalone methods for phase identification. These observations highlight the importance of the FTIR based method for utilization in EHS studies. Since boron trioxide is regulated in parts of the world, this new FTIR method is beneficial for the application of boron-containing FCC catalysts as well as other wide range applications of boron-containing materials in the fields of glass, ceramics, semiconductors, agriculture, and pharmaceuticals.

Supplementary Materials

The following are available online at https://www.mdpi.com/2073-4344/10/11/1327/s1, Figure S1: XPS P 2s and B 1s spectra for FCC ZSM-5 additive samples without boron (top) vs. with 1 wt.% B2O3 (bottom). B 1s region is overlapping with P 2s region, Figure S2: 11B NMR spectrum of ZSM-5 additive with 1 wt.% B2O3, Figure S3: 11B NMR spectra for (a) Al-borate and (b) B-phosphate (c) Boron trioxide.

Author Contributions

Conceptualization, C.C.Z., X.G. and B.Y.; methodology, data curation, visualization, investigation, C.C.Z., X.G.; writing—original draft preparation, writing—review and editing, C.C.Z., X.G. and B.Y. All authors have read and agreed to the published version of the manuscript.

Funding

This research received no external funding.

Acknowledgments

The authors thank Jasmine Luo, Gary M. Smith, Sage Hartlaub, and Ivan Petrovic for their support for this work.

Conflicts of Interest

The authors declare no conflict of interest.

References

  1. Pan, S.; Shackleford, A.; McGuire, R., Jr.; Smith, G.M.; Yilmaz, B. Creative catalysis. Hydrocarb. Eng. 2015, 20, 46–52. [Google Scholar] [CrossRef] [Green Version]
  2. European Chemicals Agency. Available online: https://echa.europa.eu/registration-dossier/-/registered-dossier/6449/1 (accessed on 15 March 2019).
  3. European Chemicals Agency. Available online: https://echa.europa.eu/documents/10162/6b35228c-45c4-4ed8-88b0-823fafb0d795 (accessed on 15 March 2019).
  4. Duydu, Y.; Başaran, N.; Ustundag, A.; Aydın, S.; Ündeger, Ü.; Ataman, O.Y.; Aydos, K.; Düker, Y.; Ickstadt, K.; Waltrup, B.S.; et al. Assessment of DNA integrity (COMET assay) in sperm cells of boron-exposed workers. Arch. Toxicol. 2012, 86, 27–35. [Google Scholar] [CrossRef]
  5. Duydu, Y.; Başaran, N.; Ustundag, A.; Aydın, S.; Ündeger, Ü.; Ataman, O.Y.; Aydos, K.; Düker, Y.; Ickstadt, K.; Waltrup, B.S.; et al. Reproductive toxicity parameters and biological monitoring in occupationally and environmentally boron-exposed persons in Bandırma, Turkey. Arch. Toxicol. 2011, 85, 589–600. [Google Scholar] [CrossRef]
  6. Glass Alliance Europe. Available online: https://www.glassallianceeurope.eu/images/cont/gae-reach-position-paper-on-boron-trioxide_1_file.pdf (accessed on 15 March 2019).
  7. IPC—Association Connecting Electronics Industries. Available online: http://www.ipc.org/4.0_Knowledge/4.1_Standards/Position-Statement-3-12d-TG_REACH-SVHC_E-Glass-B2O3.pdf (accessed on 15 March 2019).
  8. Intel. Available online: https://www.intel.com/content/dam/www/programmable/us/en/pdfs/support/reliability/environmental/reach/intel-dcl-product-content-reach-oct2017.pdf (accessed on 15 March 2019).
  9. Berlin, J. Analysis of boron with energy dispersive X-ray spectrometry. Imaging Microsc. 2011, 13, 19–21. [Google Scholar]
  10. Ong, C.W.; Huang, H.; Zheng, B.; Kwok, R.W.M.; Hui, Y.Y.; Lau, W.M. X-ray photoemission spectroscopy of nonmetallic materials: Electronic structures of boron and BxOy. J. Appl. Phys. 2004, 95, 3527. [Google Scholar] [CrossRef] [Green Version]
  11. Sen, S.; Xu, Z.; Stebbins, J.F. Temperature dependent structural changes in borate, borosilicate and boroaluminate liquids: High-resolution 11B, 29Si and 27Al NMR studies. J. Non-Cryst. Solids 1998, 226, 29–40. [Google Scholar] [CrossRef]
  12. Galeener, F.L.; Lucovsky, G.; Mikkelsen, J.C., Jr. Vibrational spectra and the structure of pure vitreous B2O3. Phys. Rev. B 1980, 22, 3983–3990. [Google Scholar] [CrossRef]
  13. Gautam, C.; Yadav, A.K.; Singh, A.K. A review on infrared spectroscopy of borate glasses with effects of different additives. ISRN Ceram. 2012, 2012, 17. [Google Scholar] [CrossRef] [Green Version]
  14. Kmeel, P.; Bukovee, P. Boron phosphate: Its synthesis, gradual crystallisation and characterisation of bulk properties. Acta Chim. Slov. 1999, 46, 161–171. [Google Scholar]
  15. Baykal, A.; Kizilyalli, M.; Toprak, M.; Kniep, R. Hydrothermal and microwave synthesis of boron phosphate, BPO4. Turk. J. Chem. 2001, 25, 425–432. [Google Scholar]
  16. Kamitsos, E.; Patsis, A.; Karakassides, M.; Chryssikos, G. Infrared reflectance spectra of lithium borate glasses. J. Non-Cryst. Solids 1990, 126, 52–67. [Google Scholar] [CrossRef]
  17. Stoch, L.; Środa, M. Infrared spectroscopy in the investigation of oxide glasses structure. J. Mol. Struct. 1999, 511–512, 77–84. [Google Scholar] [CrossRef]
  18. Ram, S. Infrared study of the dynamics of boroxol rings in the crystallization of BaFe12O19 microcrystals in borate glasses. Phys. Rev. B 1995, 51, 6280. [Google Scholar] [CrossRef] [PubMed]
  19. Pisarski, W.A.; Pisarska, J.; Ryba-Romanowski, W. Structural role of rare earth ions in lead borate glasses evidenced by infrared spectroscopy: BO3 <-> BO4 conversion. J. Mol. Struct. 2005, 744–747, 515–520. [Google Scholar] [CrossRef]
  20. Gielisse, P.J.M.; Foster, W.R. The system Al2O3–B2O3. Nature 1962, 195, 69. [Google Scholar] [CrossRef]
  21. Gutsev, G.L.; Weatherford, C.A.; Johnson, L.E.; Jena, P. Structure and properties of the aluminum borates Al(BO2)n and Al(BO2)n−, (n = 1–4). J. Comput. Chem. 2011, 33, 416–424. [Google Scholar] [CrossRef]
  22. Blay, V.; Louis, B.; Miravalles, R.; Yokoi, T.; Peccatiello, K.A.; Clough, M.; Yilmaz, B. Engineering zeolites for catalytic cracking to light olefins. ACS Catal. 2017, 7, 6542–6566. [Google Scholar] [CrossRef]
  23. Clough, M.; Pope, J.C.; Lin, L.T.X.; Komvokis, V.; Pan, S.S.; Yilmaz, B. Nanoporous materials forge a path forward to enable sustainable growth: Technology advancements in fluid catalytic cracking. Microporous Mesoporous Mater. 2017, 254, 45–58. [Google Scholar] [CrossRef]
  24. Rulmont, A.; Almou, M. Vibrational spectra of metaborates with infinite chain structure: LiBO2, CaB2O4, SrB2O4. Spectrochim. Acta Part A Mol. Spectrosc. 1989, 45, 603–610. [Google Scholar] [CrossRef]
  25. Umari, P.; Pasquarello, A. Fraction of boroxol rings in vitreous boron oxide from a first-principles analysis of raman and NMR spectra. Phys. Rev. Lett. 2005, 95, 137401. [Google Scholar] [CrossRef]
  26. Simon, G.; Hehlen, B.; Vacher, R.; Courtens, E. Courtens, Hyper-Raman scattering analysis of the vibrations in vitreous boron oxide. Phys. Rev. B 2007, 76, 054210. [Google Scholar] [CrossRef] [Green Version]
  27. Voronko, Y.K.; Sobol, A.A.; Shukshin, V.E. Structure of boron-oxygen groups in crystalline, molten, and glassy alkali-metal and alkaline-earth metaborates. Inorg. Mater. 2012, 48, 732–737. [Google Scholar] [CrossRef]
  28. Barrio, R.A.; Castillo-Alvarado, F.L.; Galeener, F.L. Structural and vibrational model for vitreous boron oxide. Phys. Rev. B 1991, 44, 7313. [Google Scholar] [CrossRef] [PubMed]
  29. Pan, S.S.; Lin, L.T.X.; Komvokis, V.; Spann, A.; Clough, M.; Yilmaz, B. Nanomaterials fueling the world. In Nanomaterials for Sustainable Energy; ACS Symposium Series; American Chemical Society: Washington, DC, USA, 2015. [Google Scholar]
  30. Komvokis, V.; Tan, L.X.; Clough, M.; Yilmaz, B. Zeolites in fluid catalytic cracking (FCC). In Zeolites in Sustainable Chemistry; Springer: Berlin/Heidelberg, Germany, 2016. [Google Scholar]
Figure 1. FTIR spectra for (a) glassy boron trioxide and (b) glassy phosphor borate (PBO4).
Catalysts 10 01327 g001
Figure 2. FTIR spectrum for aluminum borate (Al18B4O33), which was obtained by processing the single beam spectrum using a KBr reference spectrum.
Catalysts 10 01327 g002
Figure 3. FTIR spectrum of a Fluid Catalytic Cracking (FCC) catalyst (Sample #4) showing BO3, BO4 borate structures.
Catalysts 10 01327 g003
Figure 4. FTIR spectra in the OH region for (a) physical mixtures (Samples #5–8), and (b) 649 °C—calcined boron trioxide with ZSM-5 (Samples #9–11).
Catalysts 10 01327 g004
Figure 5. FTIR spectra in the borate region for (a) physical mixtures (Samples #5–8), and (b) 649 °C – calcined boron trioxide with ZSM-5 (Samples #9–11).
Catalysts 10 01327 g005
Figure 6. Raman spectra collected for FCC additive samples (#12 and #13) using a 488-nm laser and an FCC catalyst sample #14 using a 785-nm laser before (the 4th trace from top) and after (the 1st, 2nd and 3rd traces from top) calcination with comparison to pure boron trioxide (bottom trace) reference show that boron trioxide phase disappears after calcination. The top three spectra were normalized based on the peak intensity at 635 cm−1 to the elemental content of TiO2 in the two samples.
Catalysts 10 01327 g006
Figure 7. Raman spectra collected using a 488-nm laser for Samples #12 and #13. This is a higher-resolution view of the top two traces of spectra in Figure 6.
Catalysts 10 01327 g007
Table 1. Powder sample IDs and detail description.
Sample IDDescriptionSample Contents and Treatment
1Phosphor borate, PBO4, Alfa Aesarcommercial material
2Boron trioxidecommercial material
3aluminum borate, Al18B4O33, BOC Sciencescommercial material
40.5% B2O3/USY zeolite, (silico)aluminate matricesCyclic Propylene Steaming (CPS) deactivated
50.1% B2O3/ZSM-5 with alumina binderphysical mixture
60.25% B2O3/ZSM-5 with alumina binderphysical mixture
70.5% B2O3/ZSM-5 with alumina binderphysical mixture
81% B2O3/ZSM-5 with alumina binderphysical mixture
91% B2O3/ZSM-5 with alumina binder649 °C-calcination
101.5% B2O3/ZSM-5 with alumina binder649 °C-calcination
112% B2O3/ZSM-5 with alumina binder649 °C-calcination
120% B2O3 ZSM-5 with alumina binderFluidizable microspheres
131% B2O3/ZSM-5 with alumina binderFluidizable microspheres
142% B2O3/Silicoaluminate matrixFluidizable microspheres
Publisher’s Note: MDPI stays neutral with regard to jurisdictional claims in published maps and institutional affiliations.

