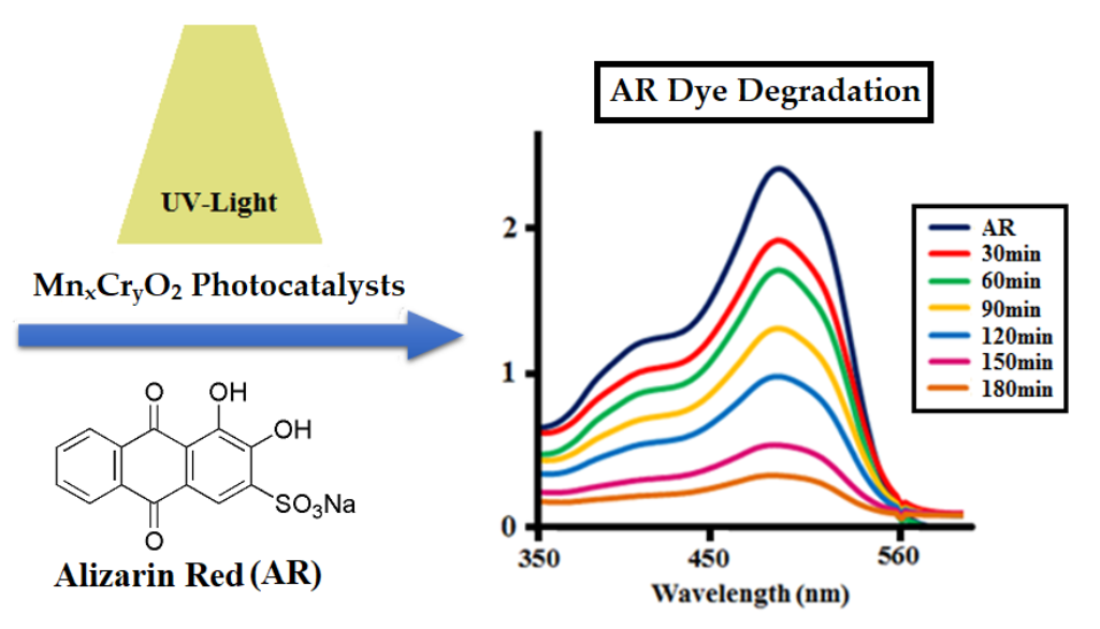
Catalytic Removal of Alizarin Red Using Chromium Manganese Oxide Nanorods: Degradation and Kinetic Studies


 , , and
Abstract

1. Introduction
2. Results and Discussion
2.1. Characterization of Nanomaterials (MH1–MH5)
2.1.1. Elemental Analysis by EDX
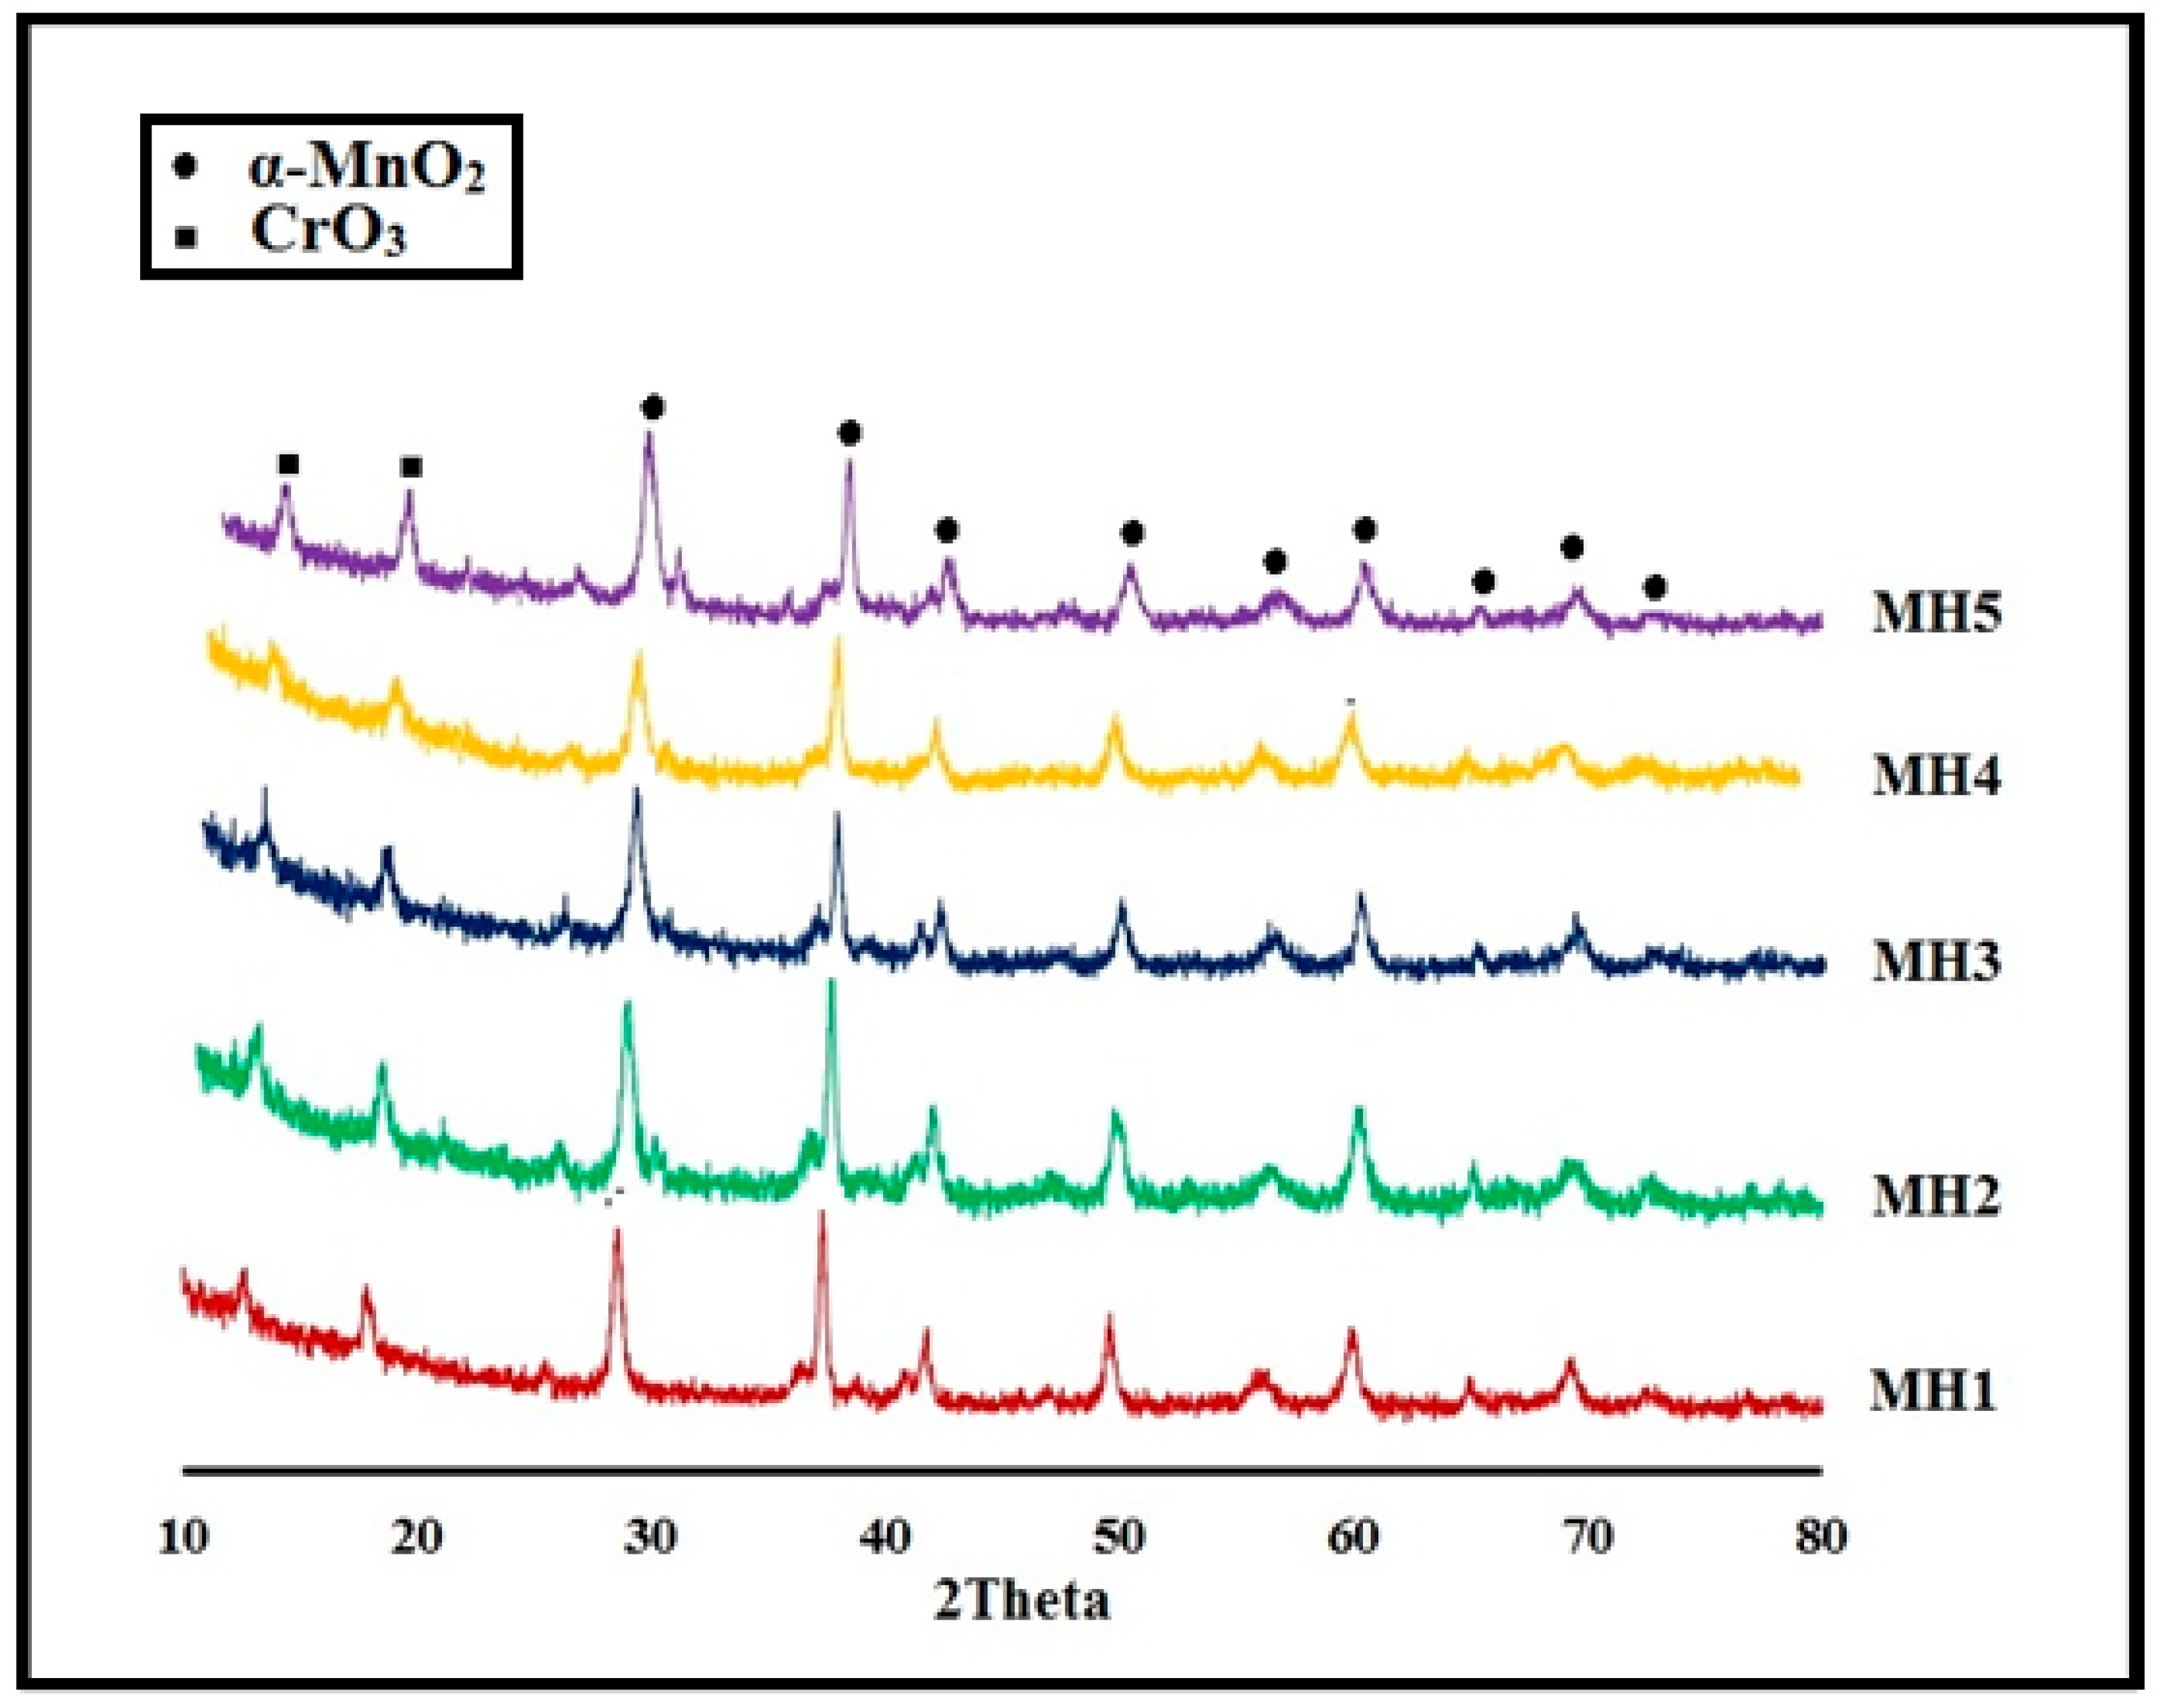
2.1.2. Powder X-Ray Diffraction (PXRD) Analysis
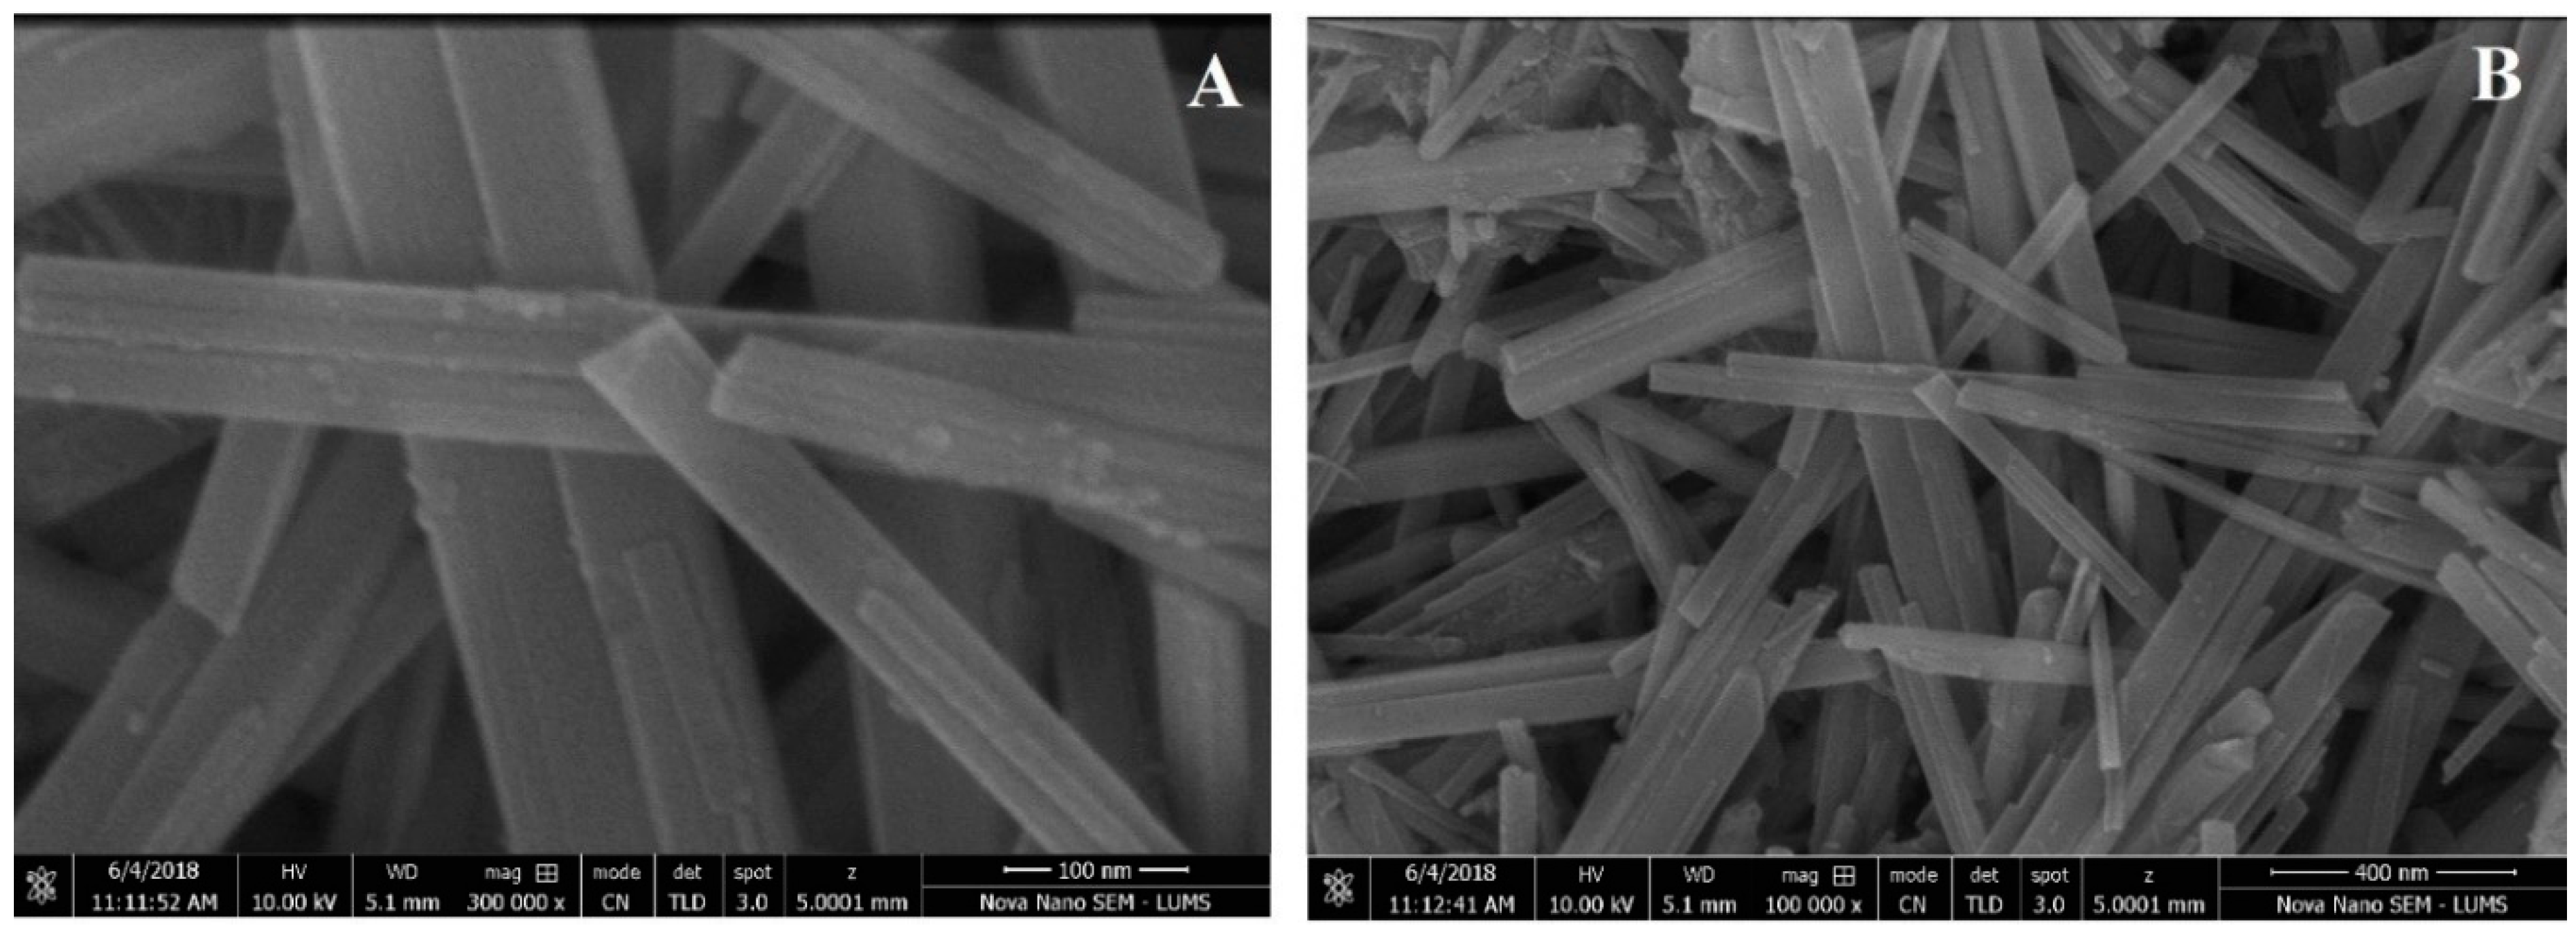
2.1.3. Scanning Electron Microscopy (SEM) Analysis
2.1.4. Brunauer–Emmett–Teller (BET) Analysis
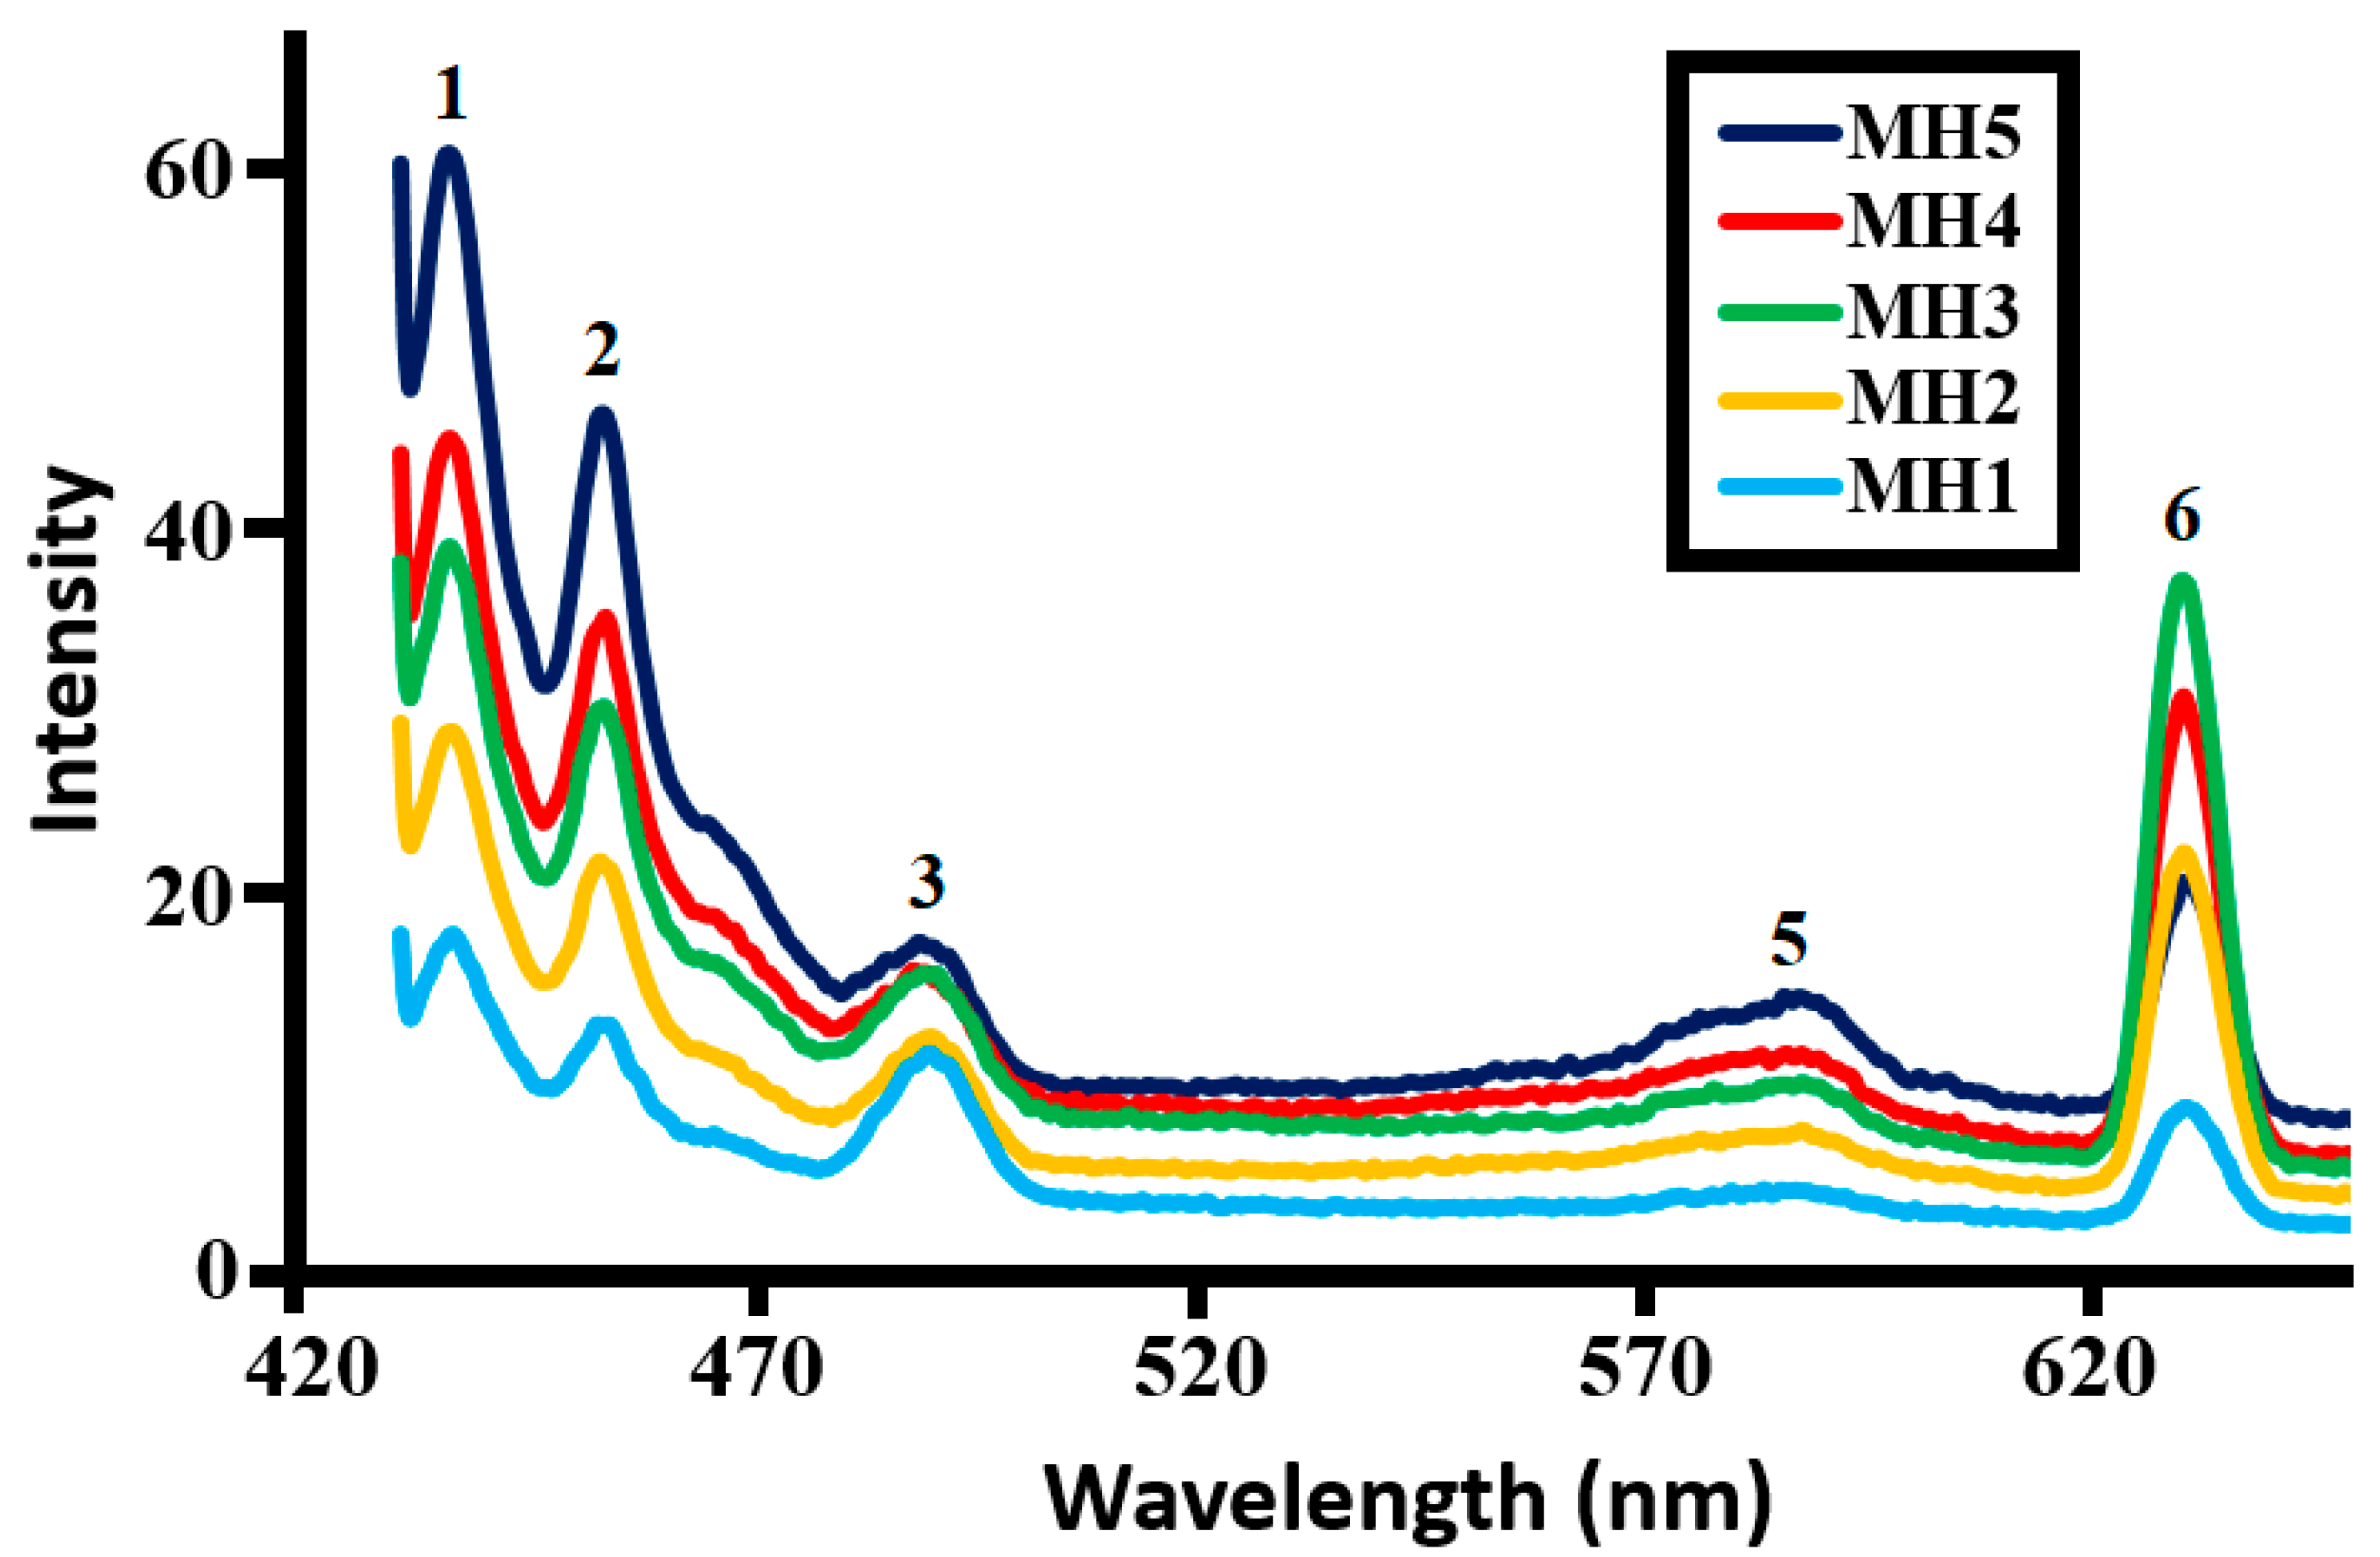
2.1.5. Photoluminescence (PL) Study
2.2. Catalytic Activity Studies
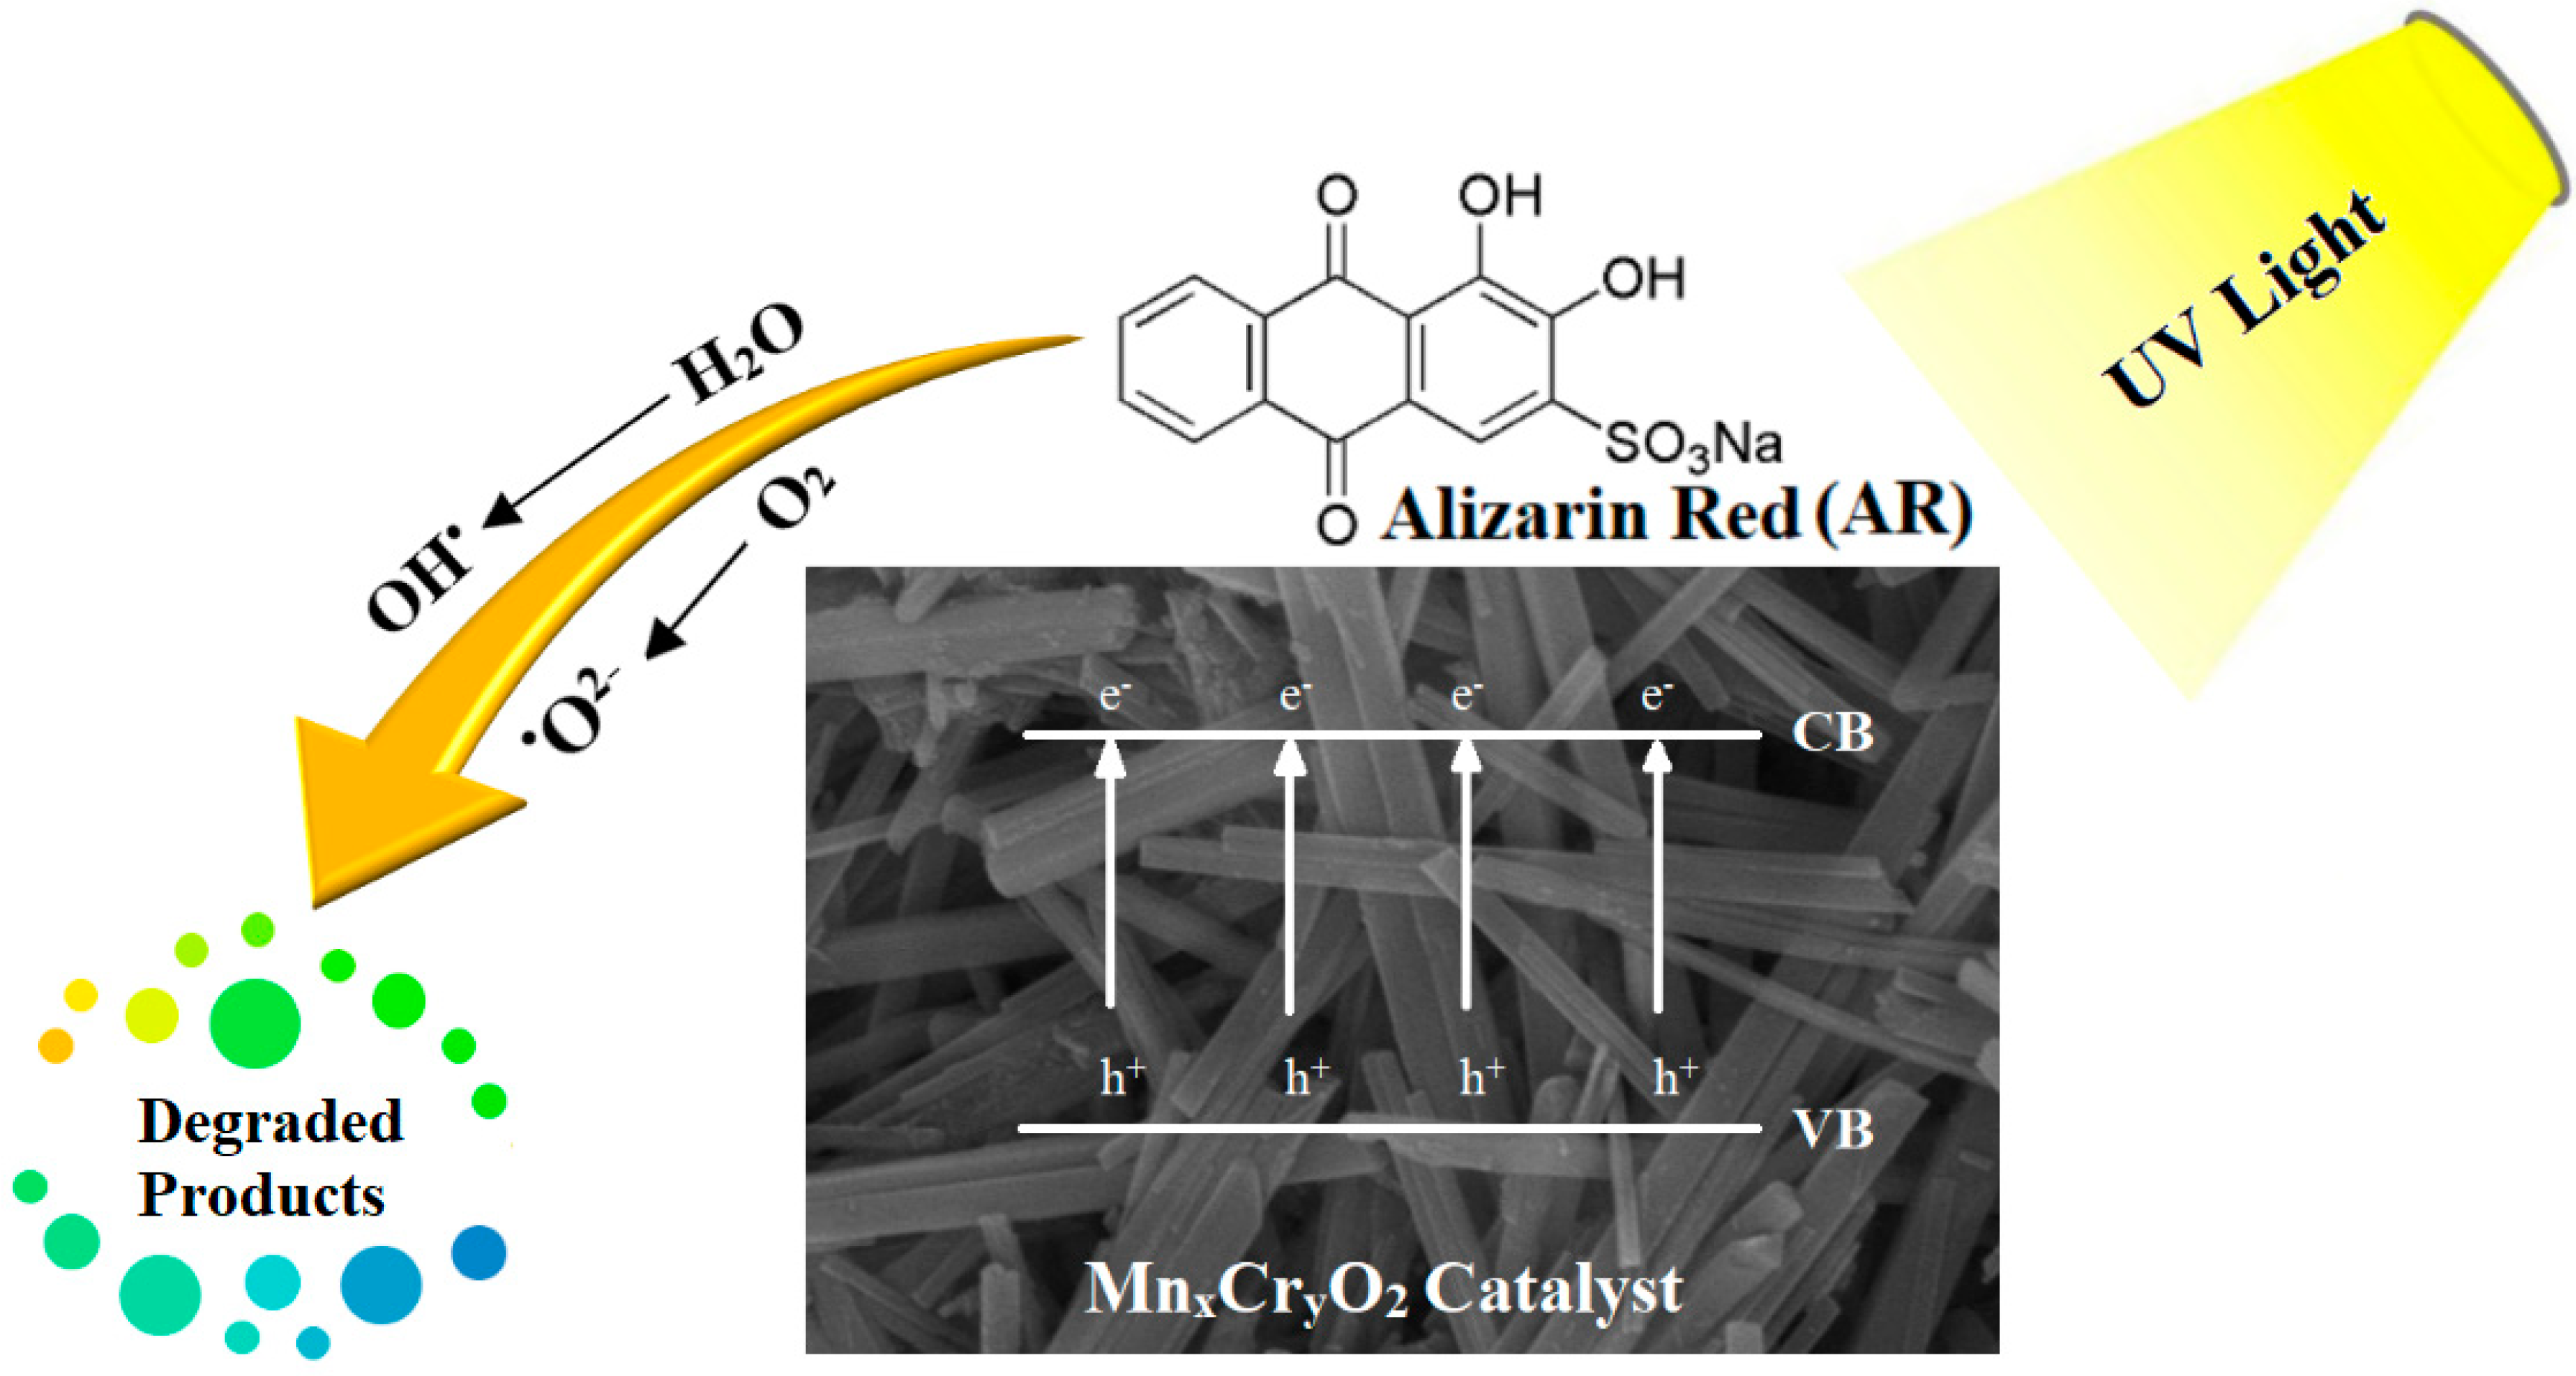
2.2.1. Photocatalytic Degradation of AR by Nanocatalysts (MH1–MH5)
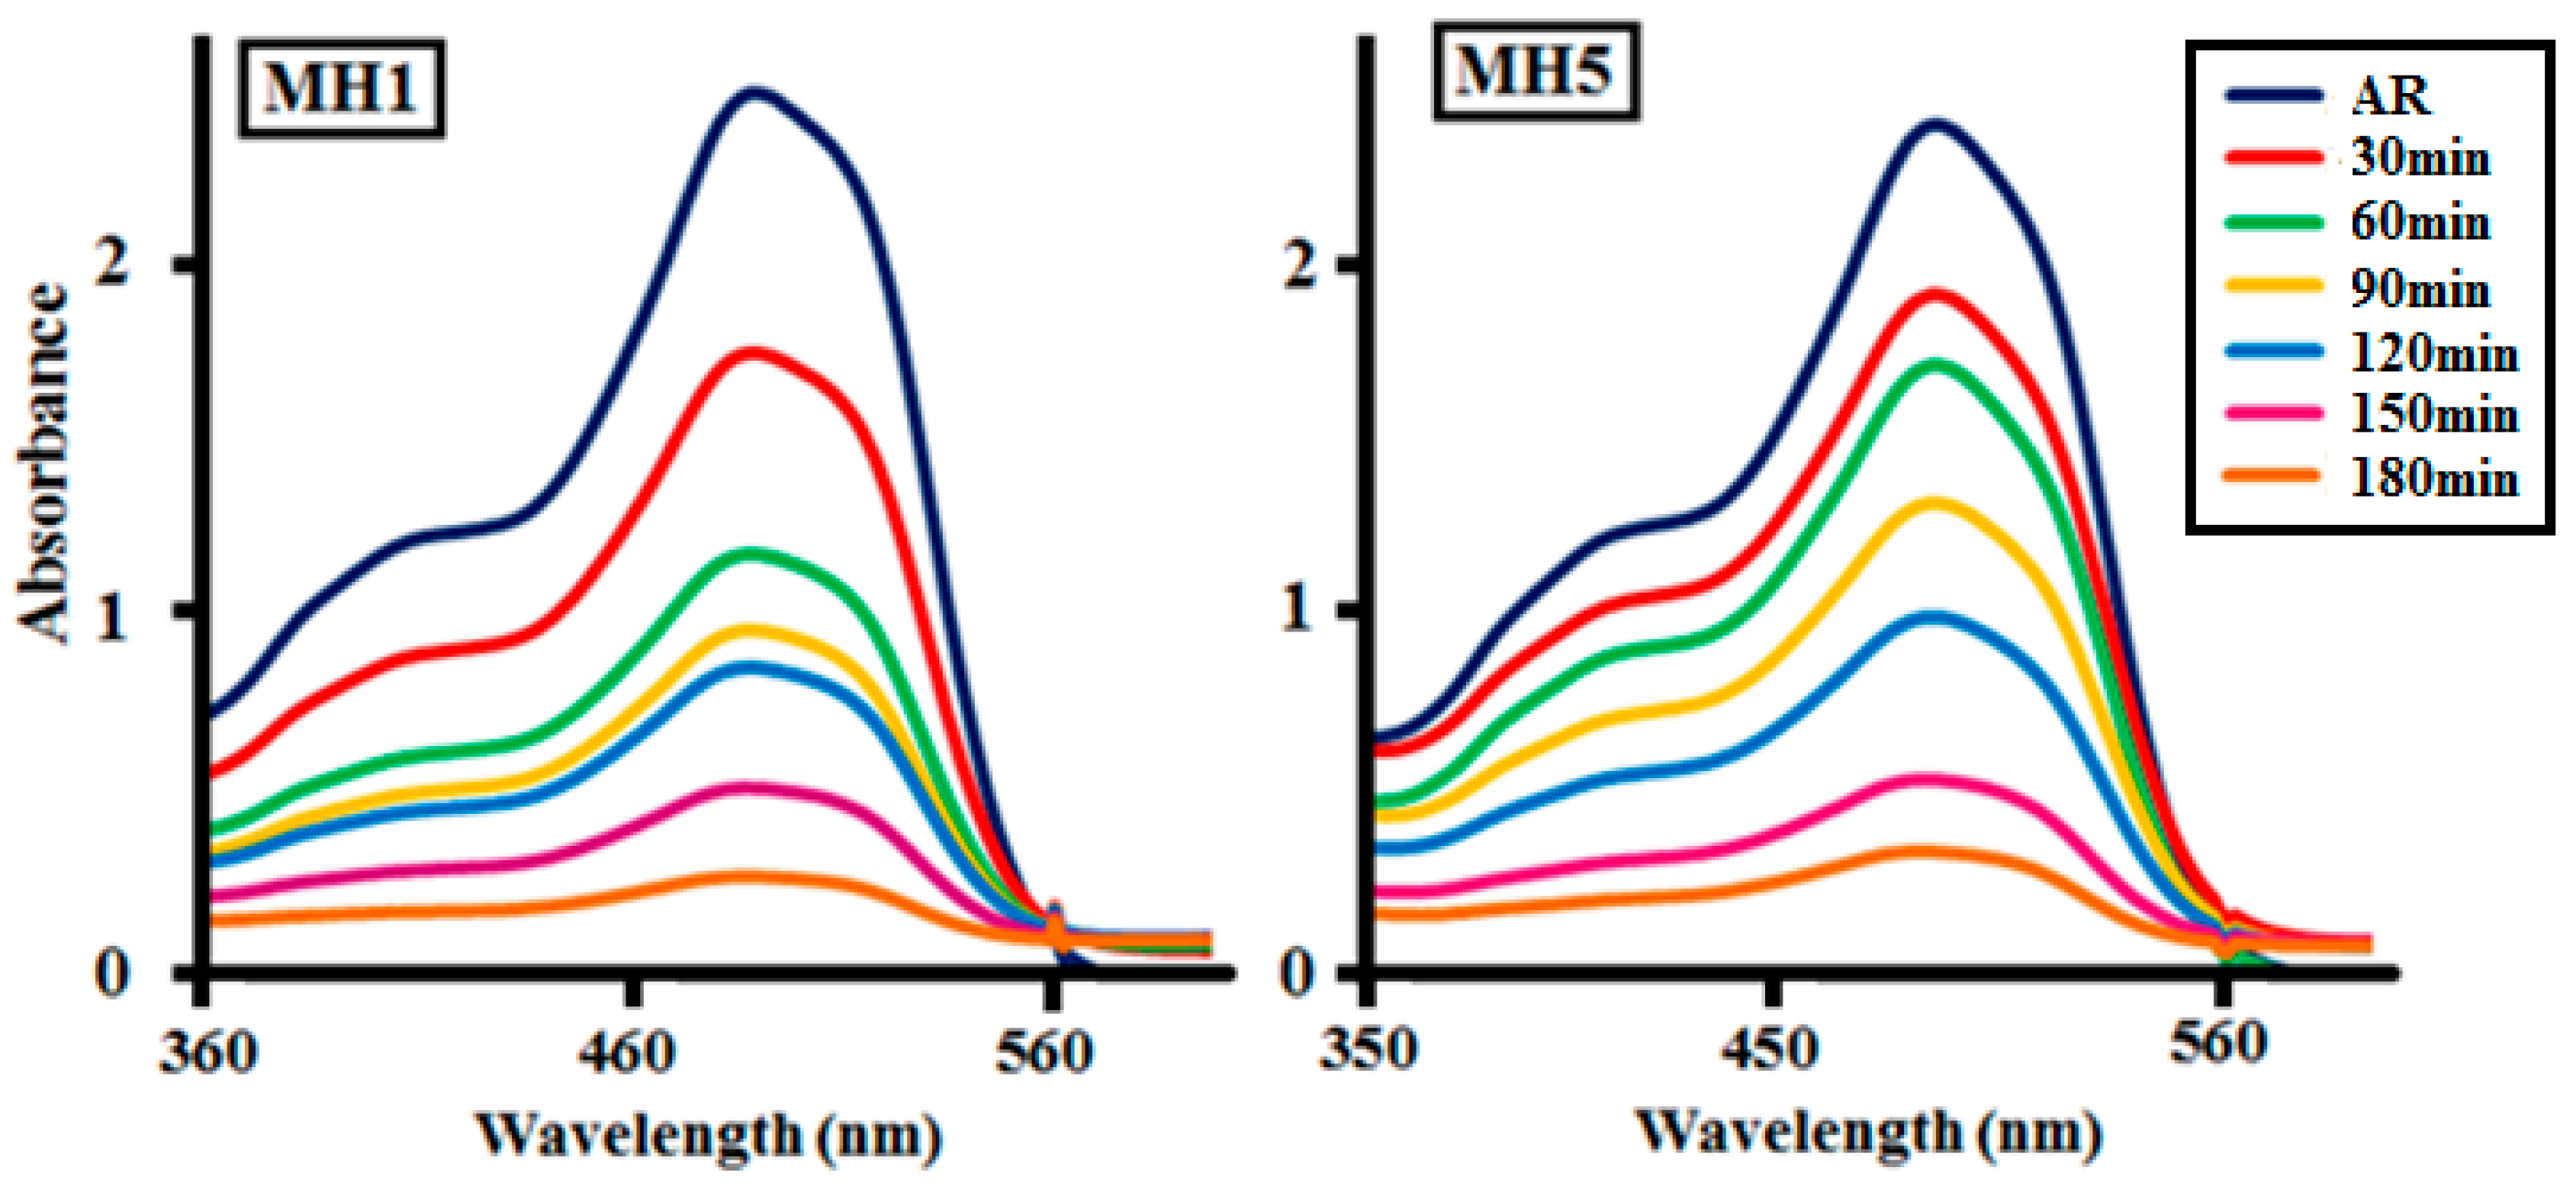
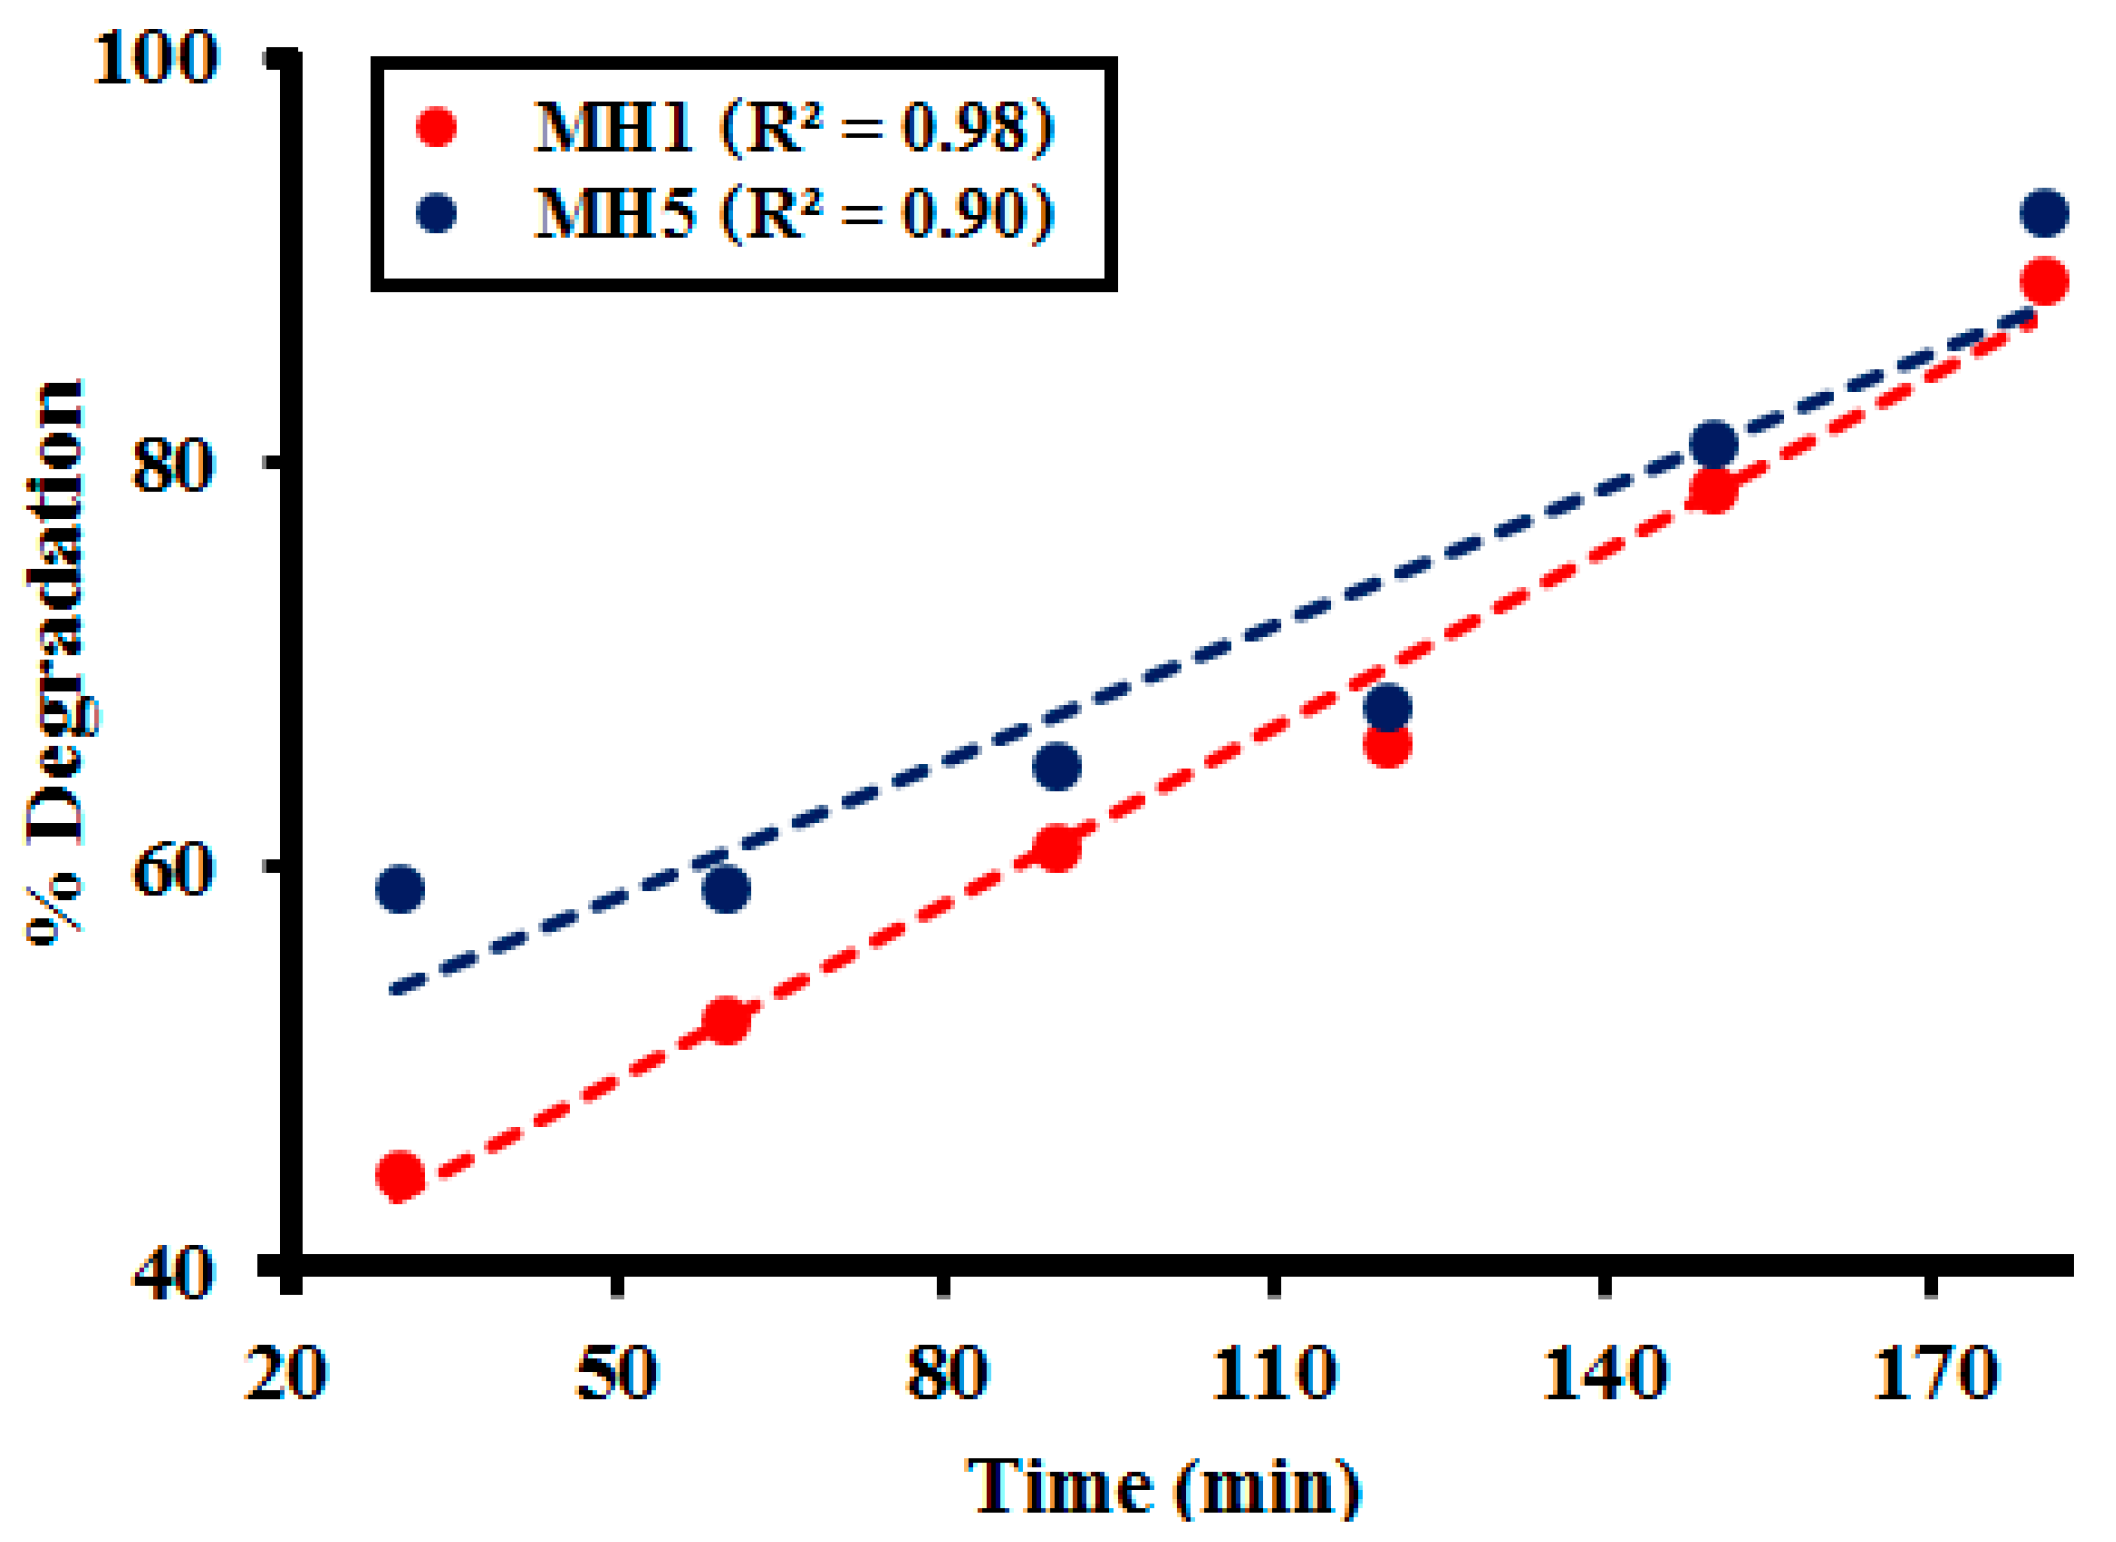
2.2.2. Effect of Time
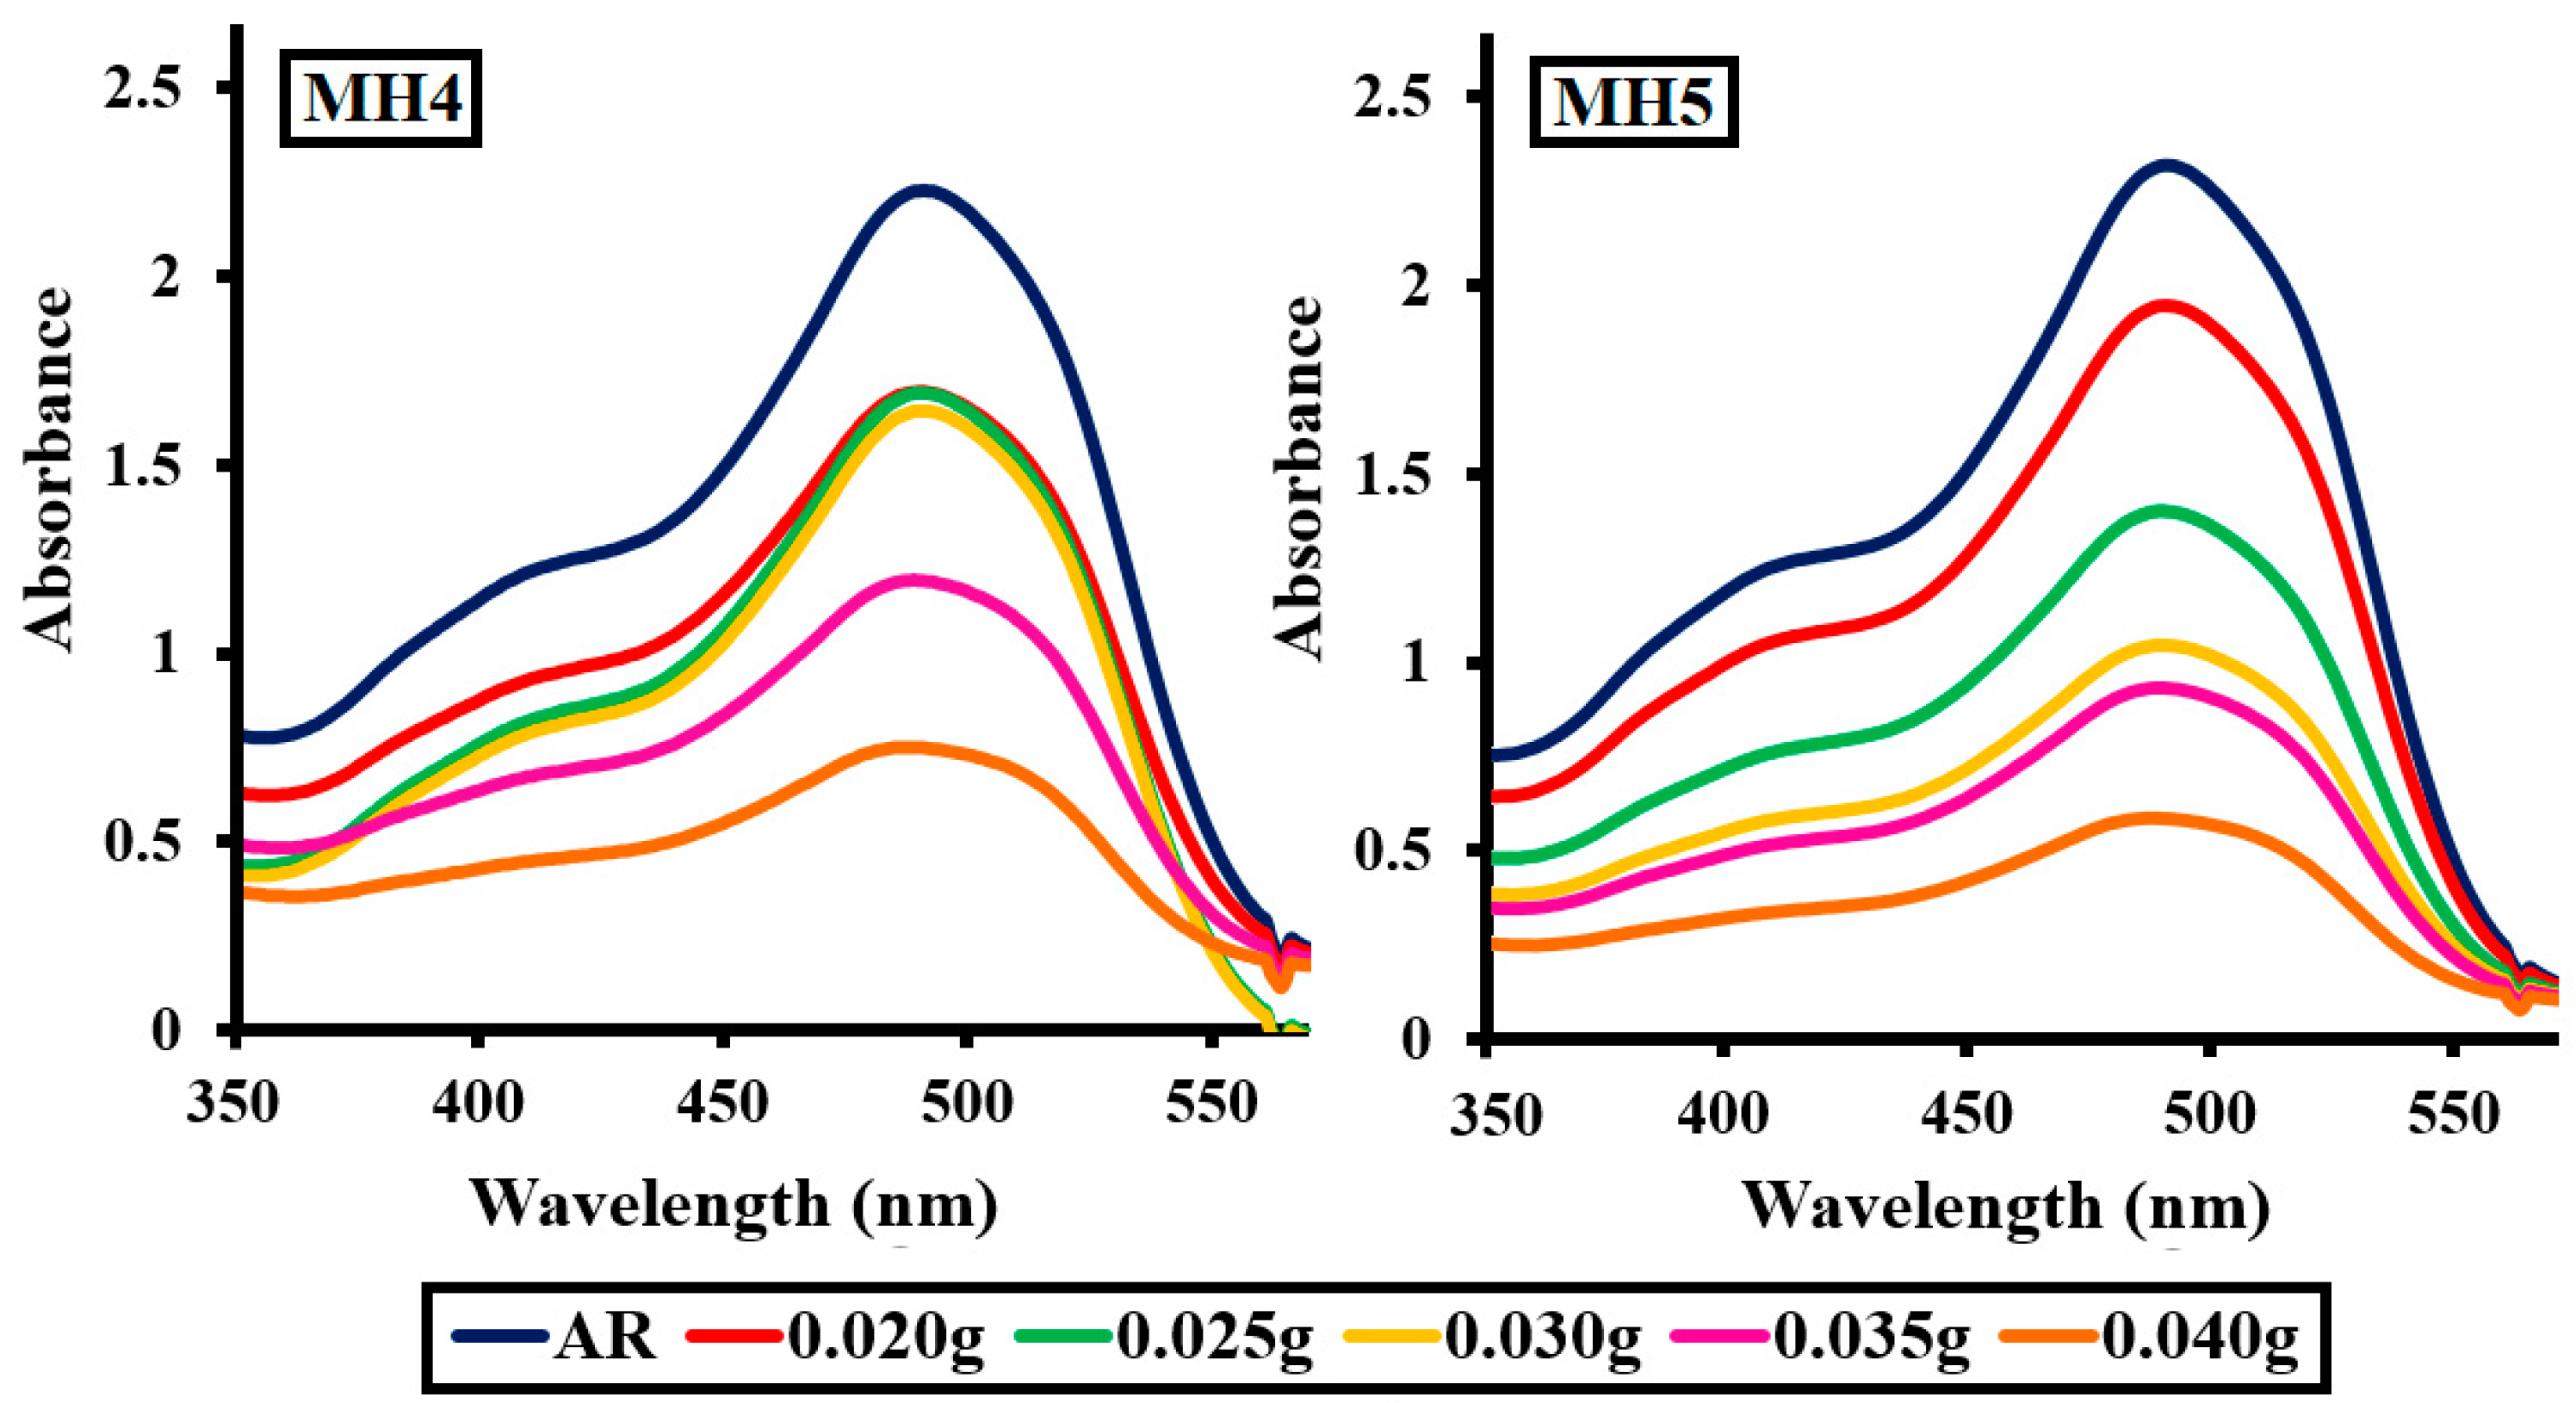
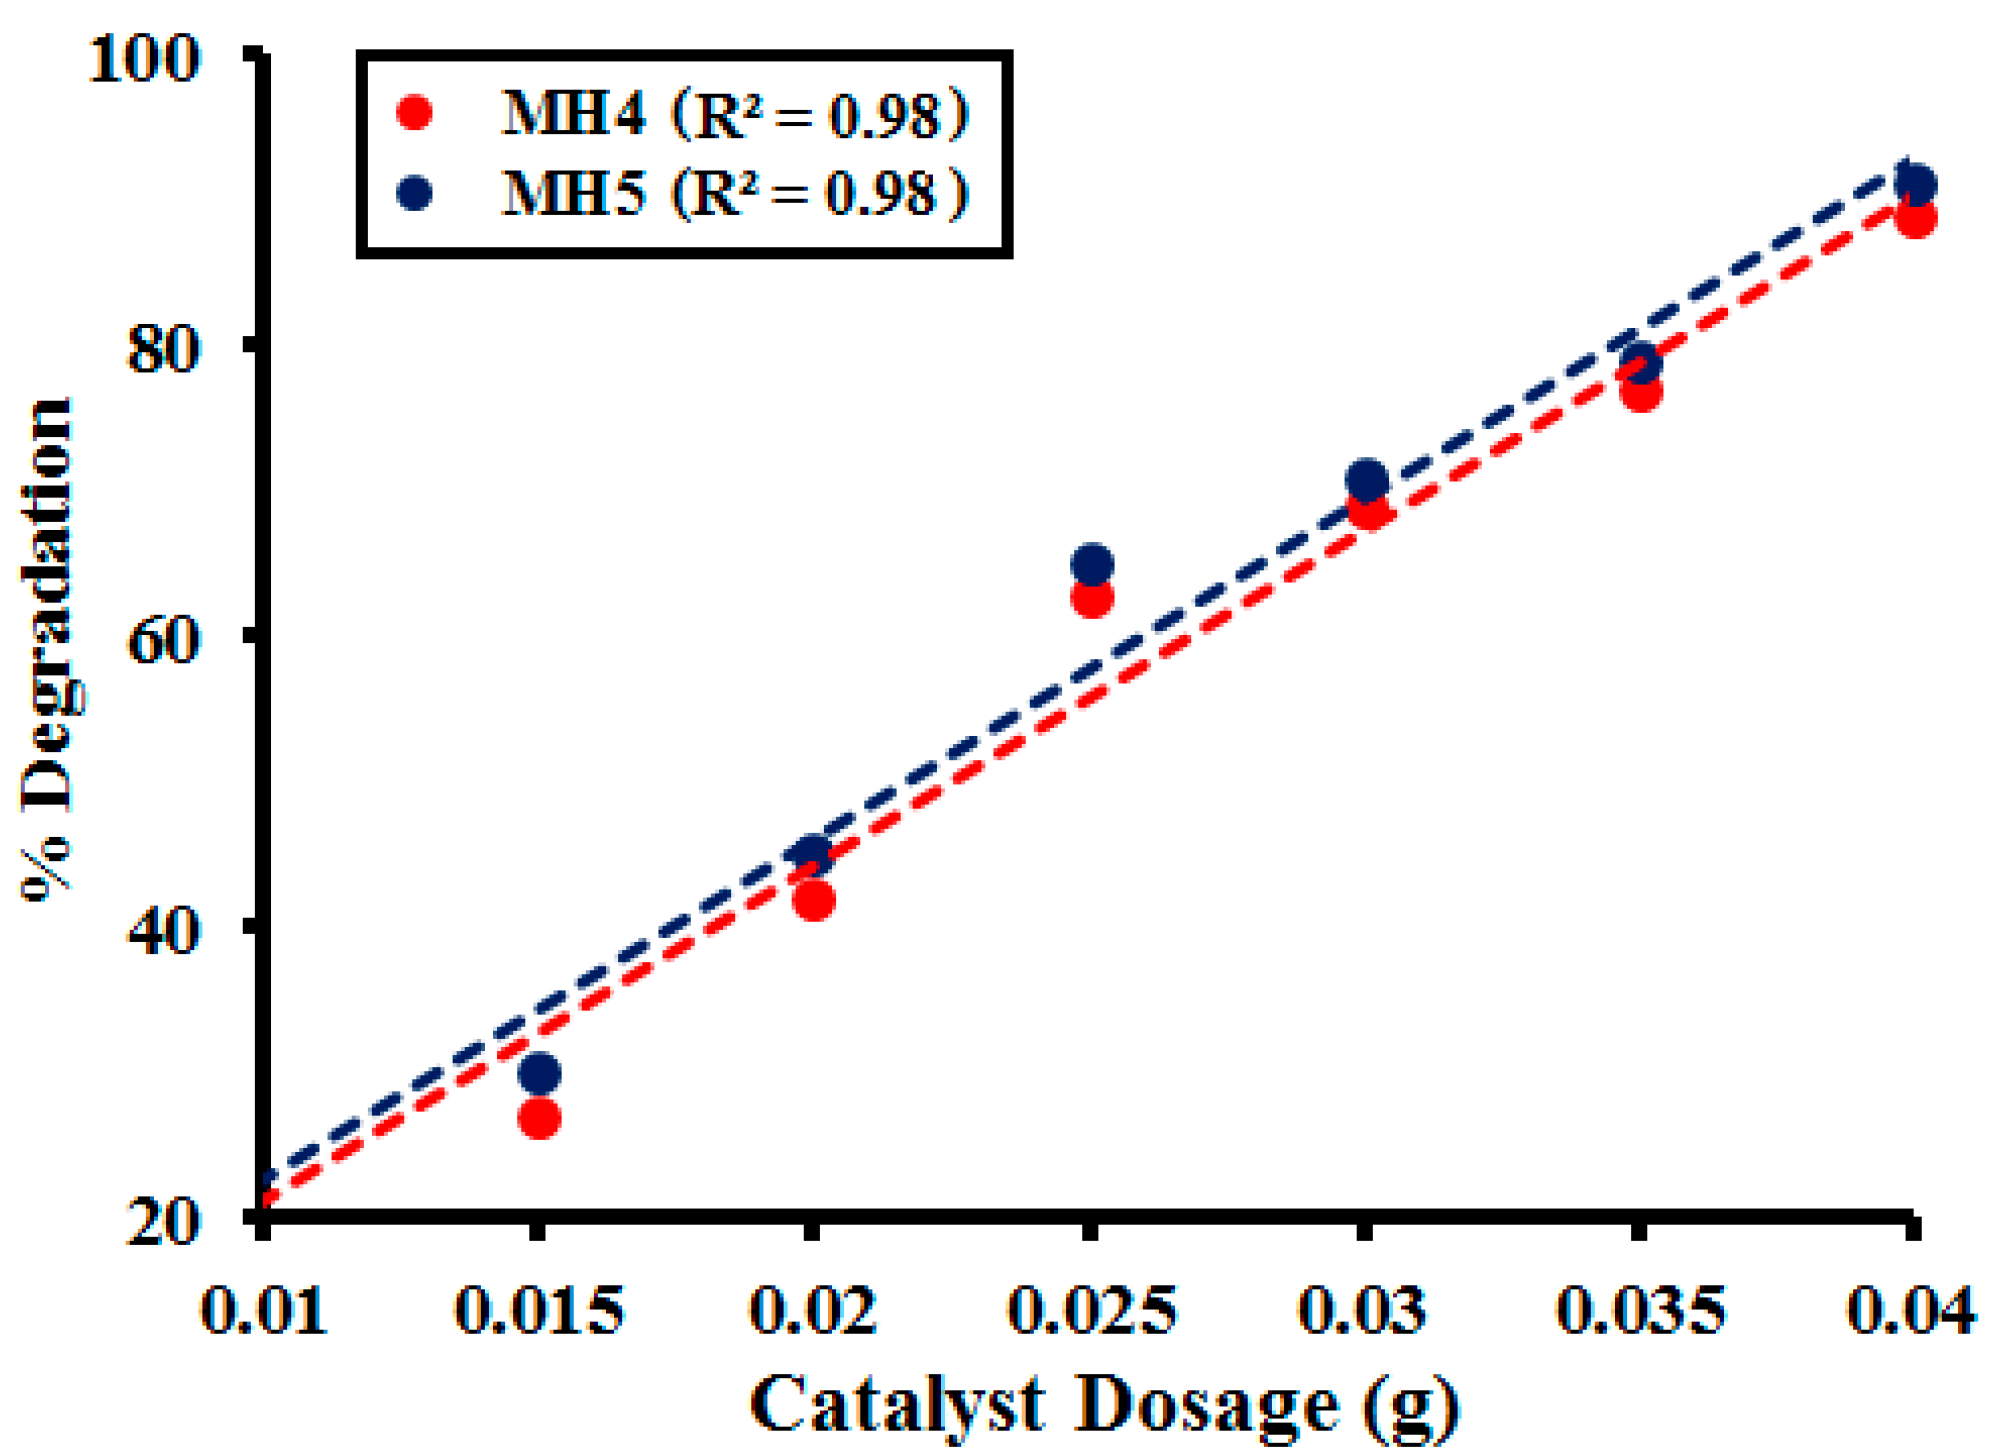
2.2.3. Effect of Photocatalyst Dosage
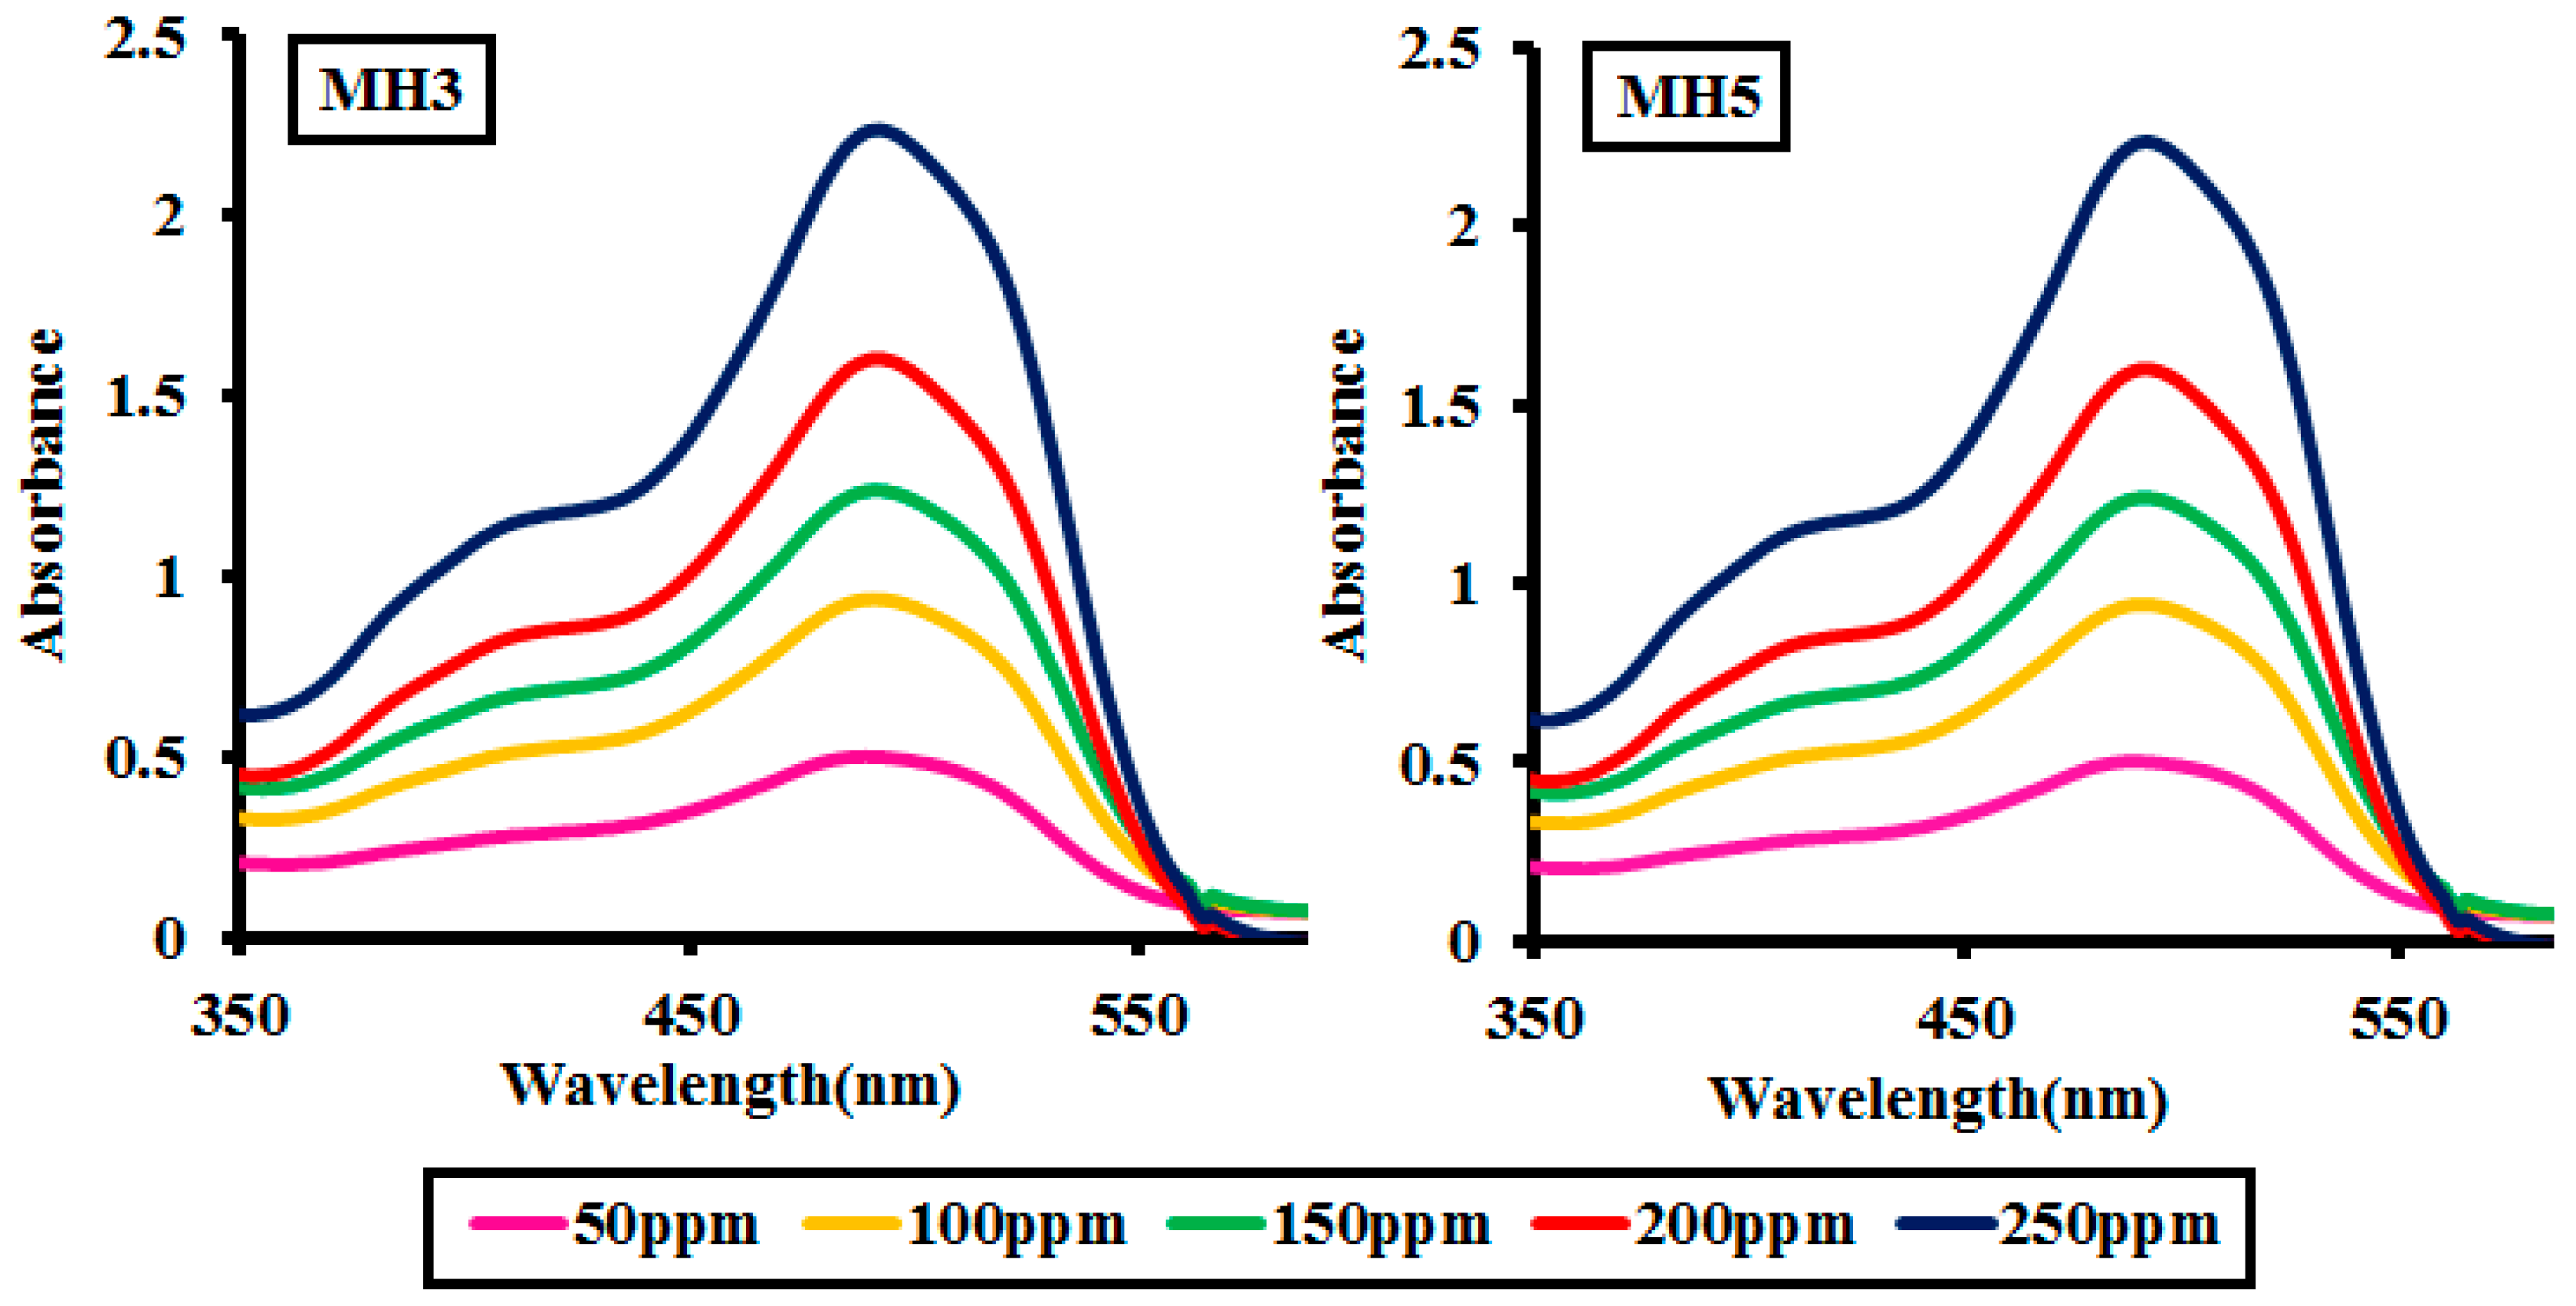
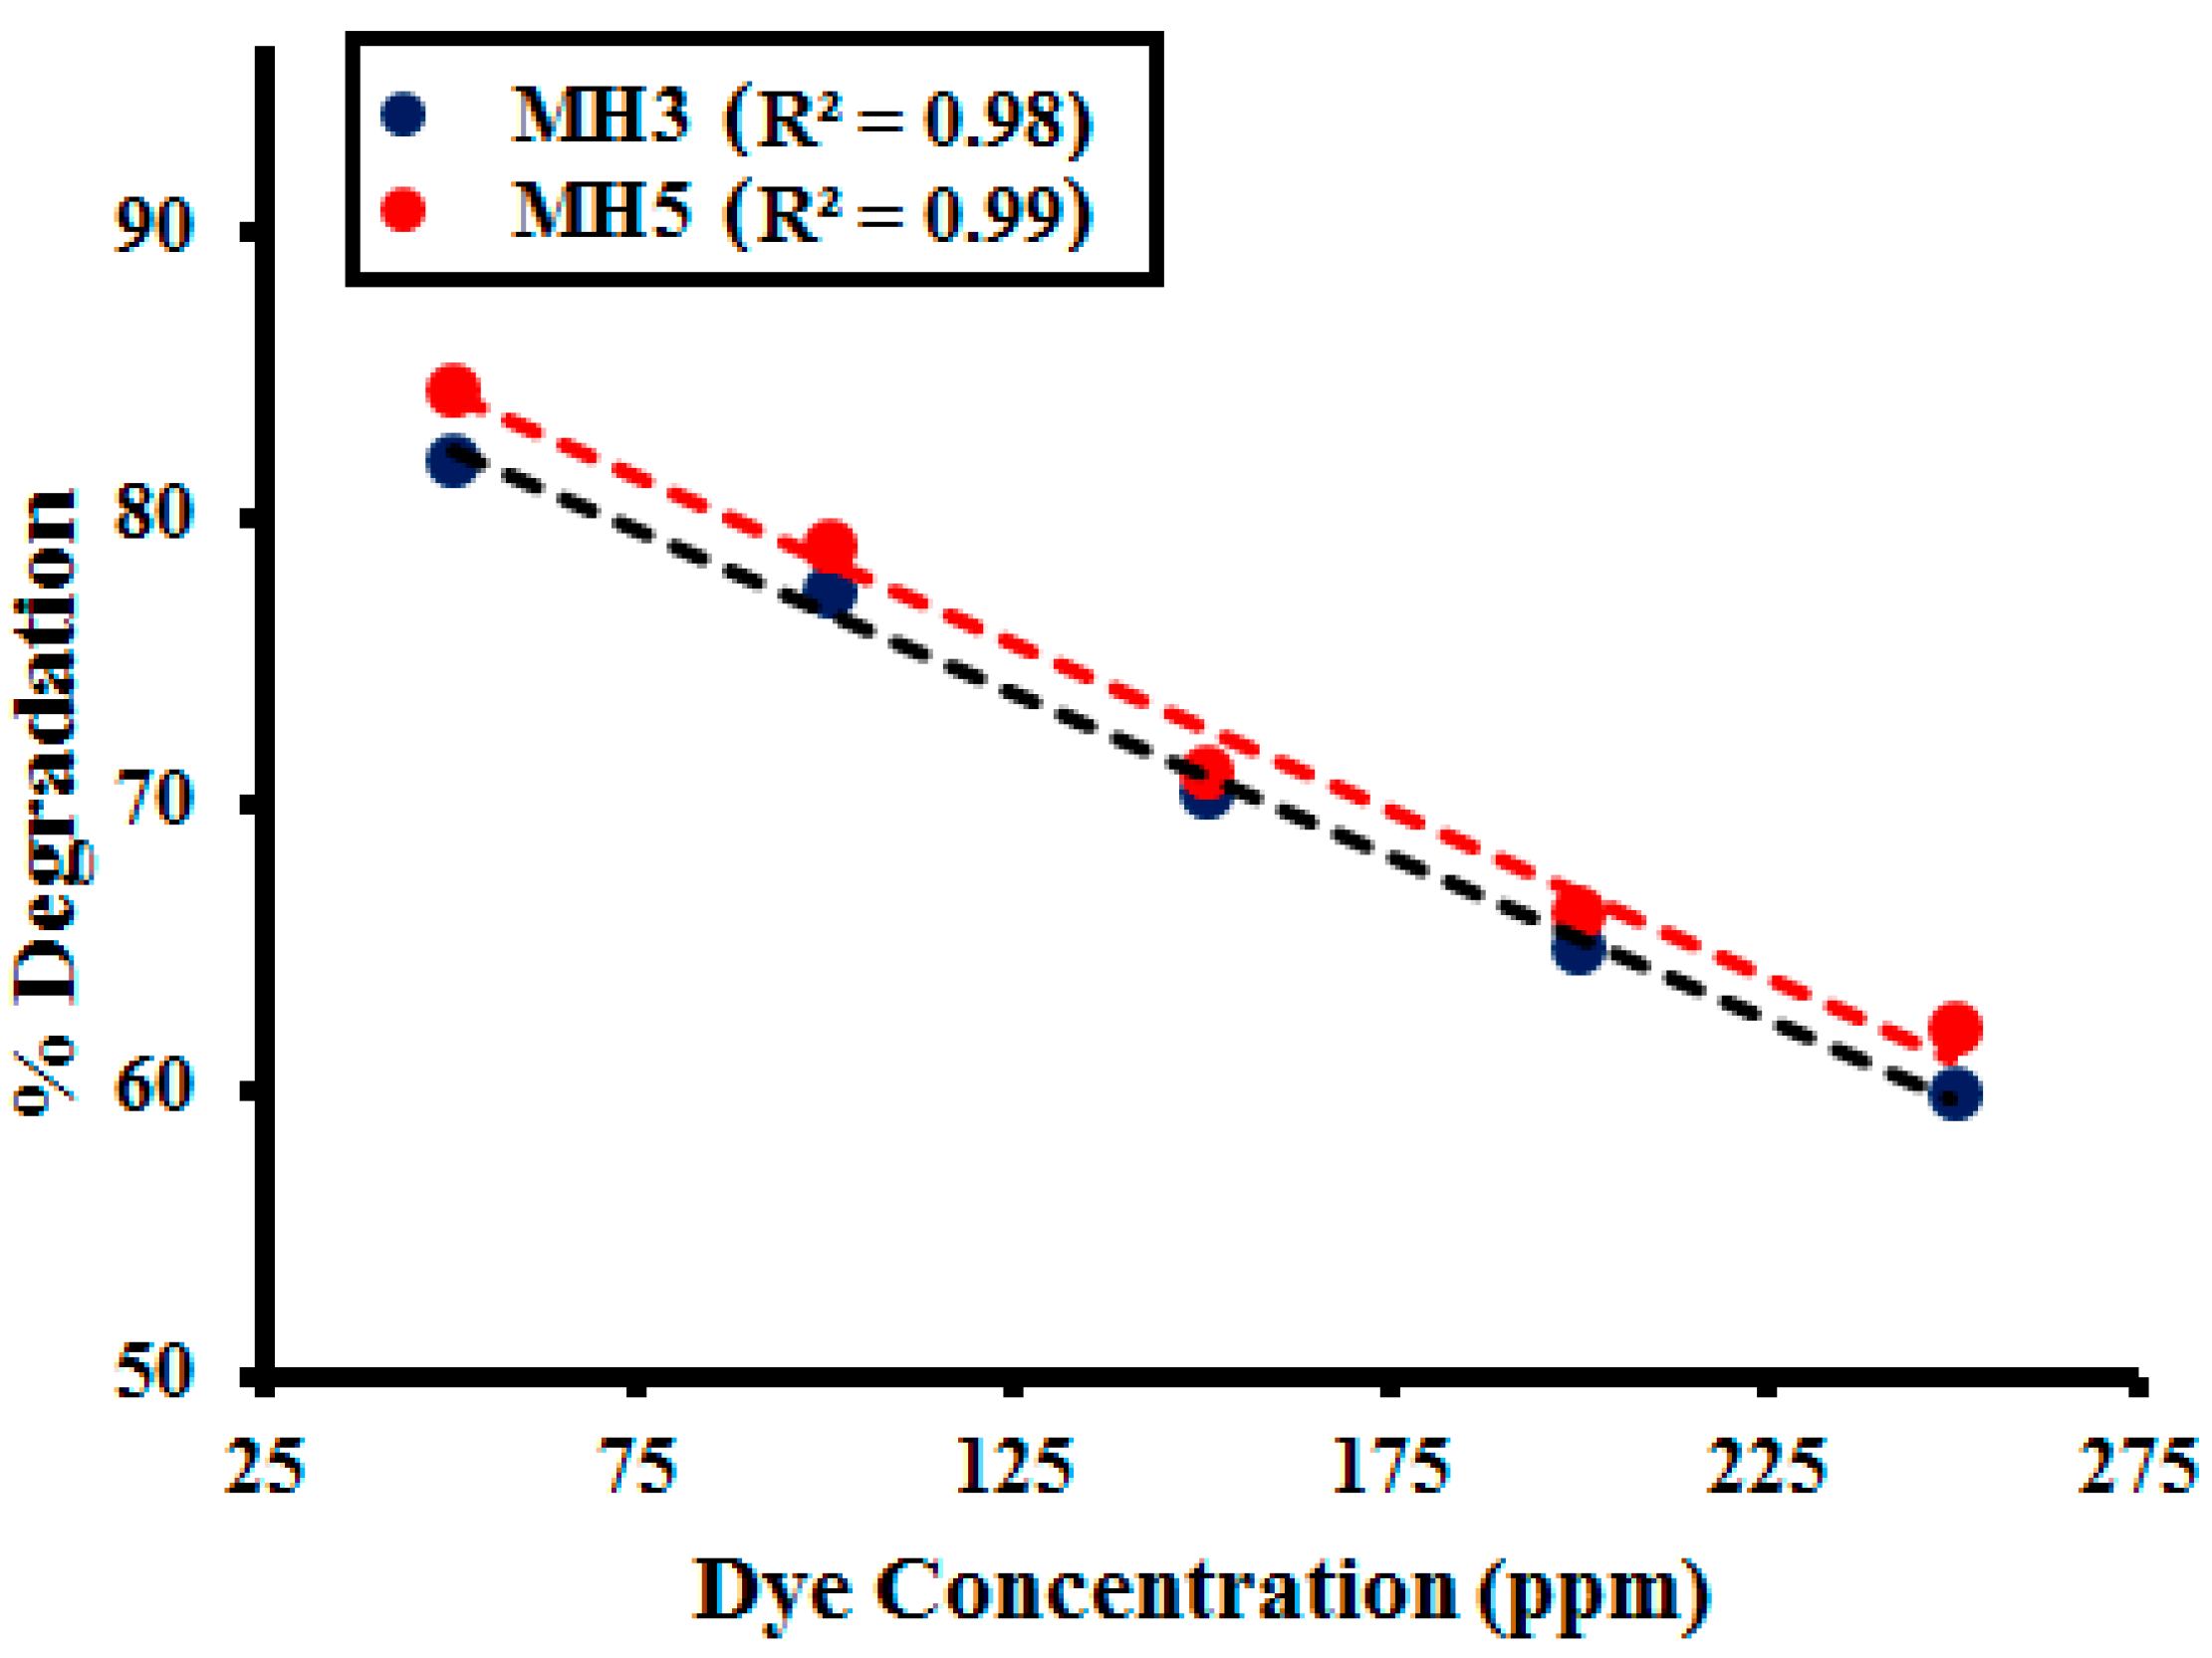
2.2.4. Effect of Dye Concentration
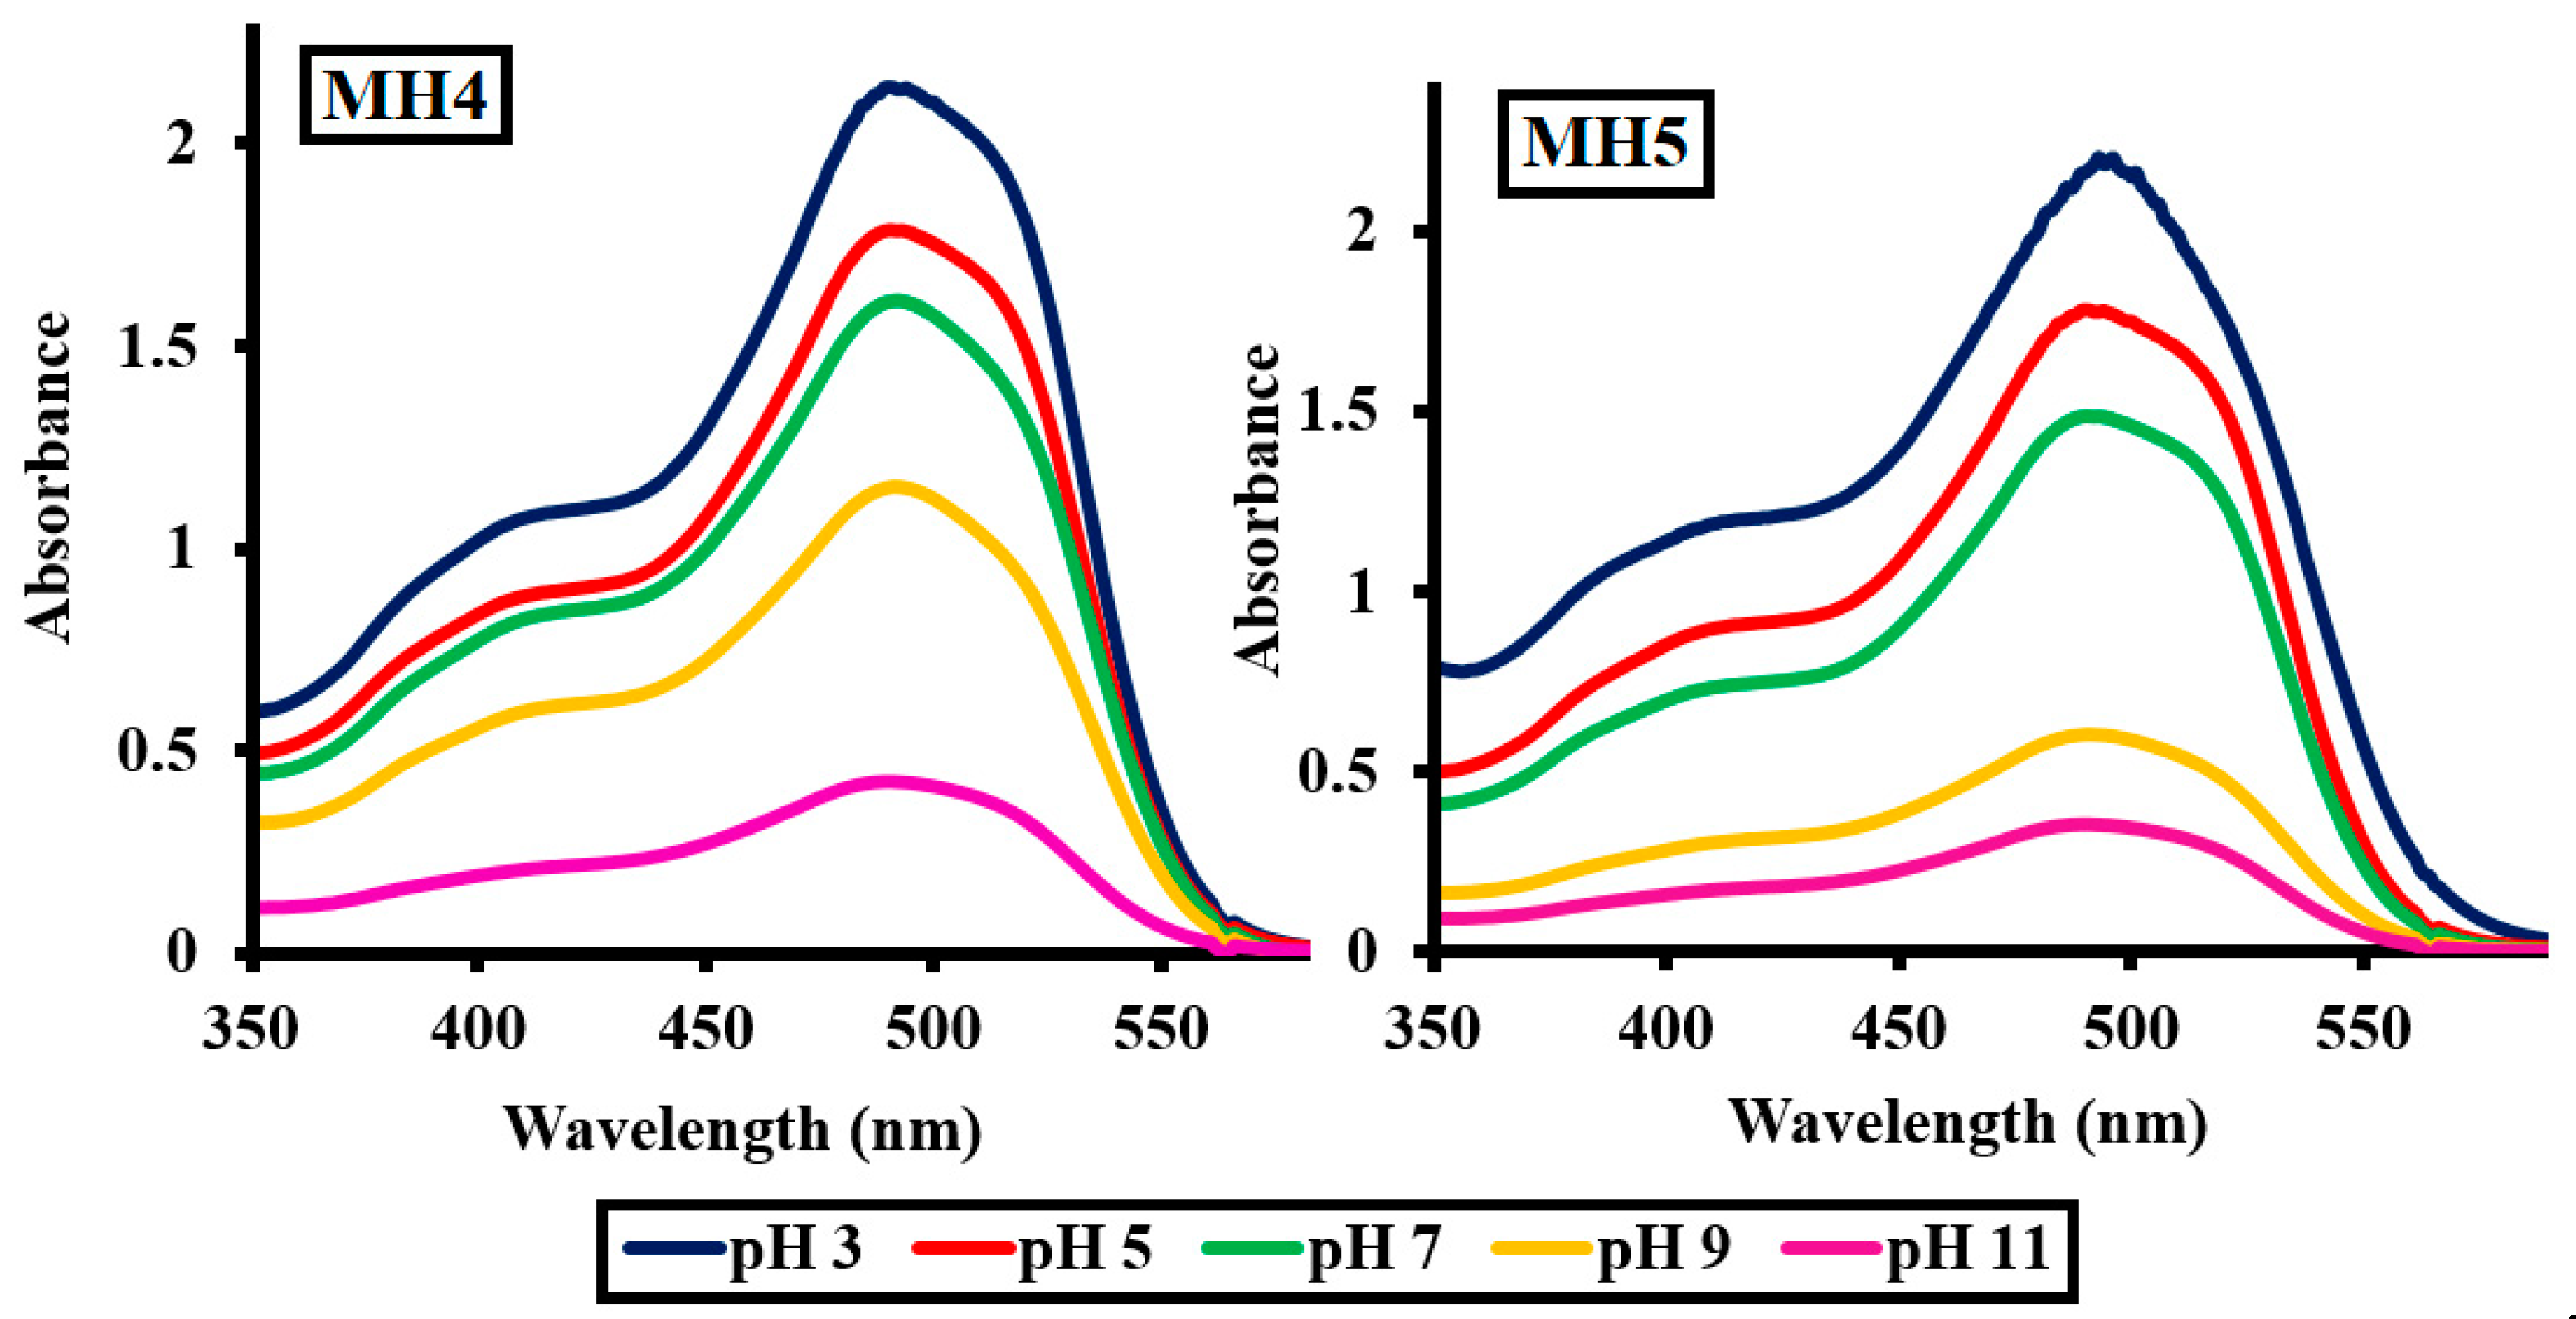
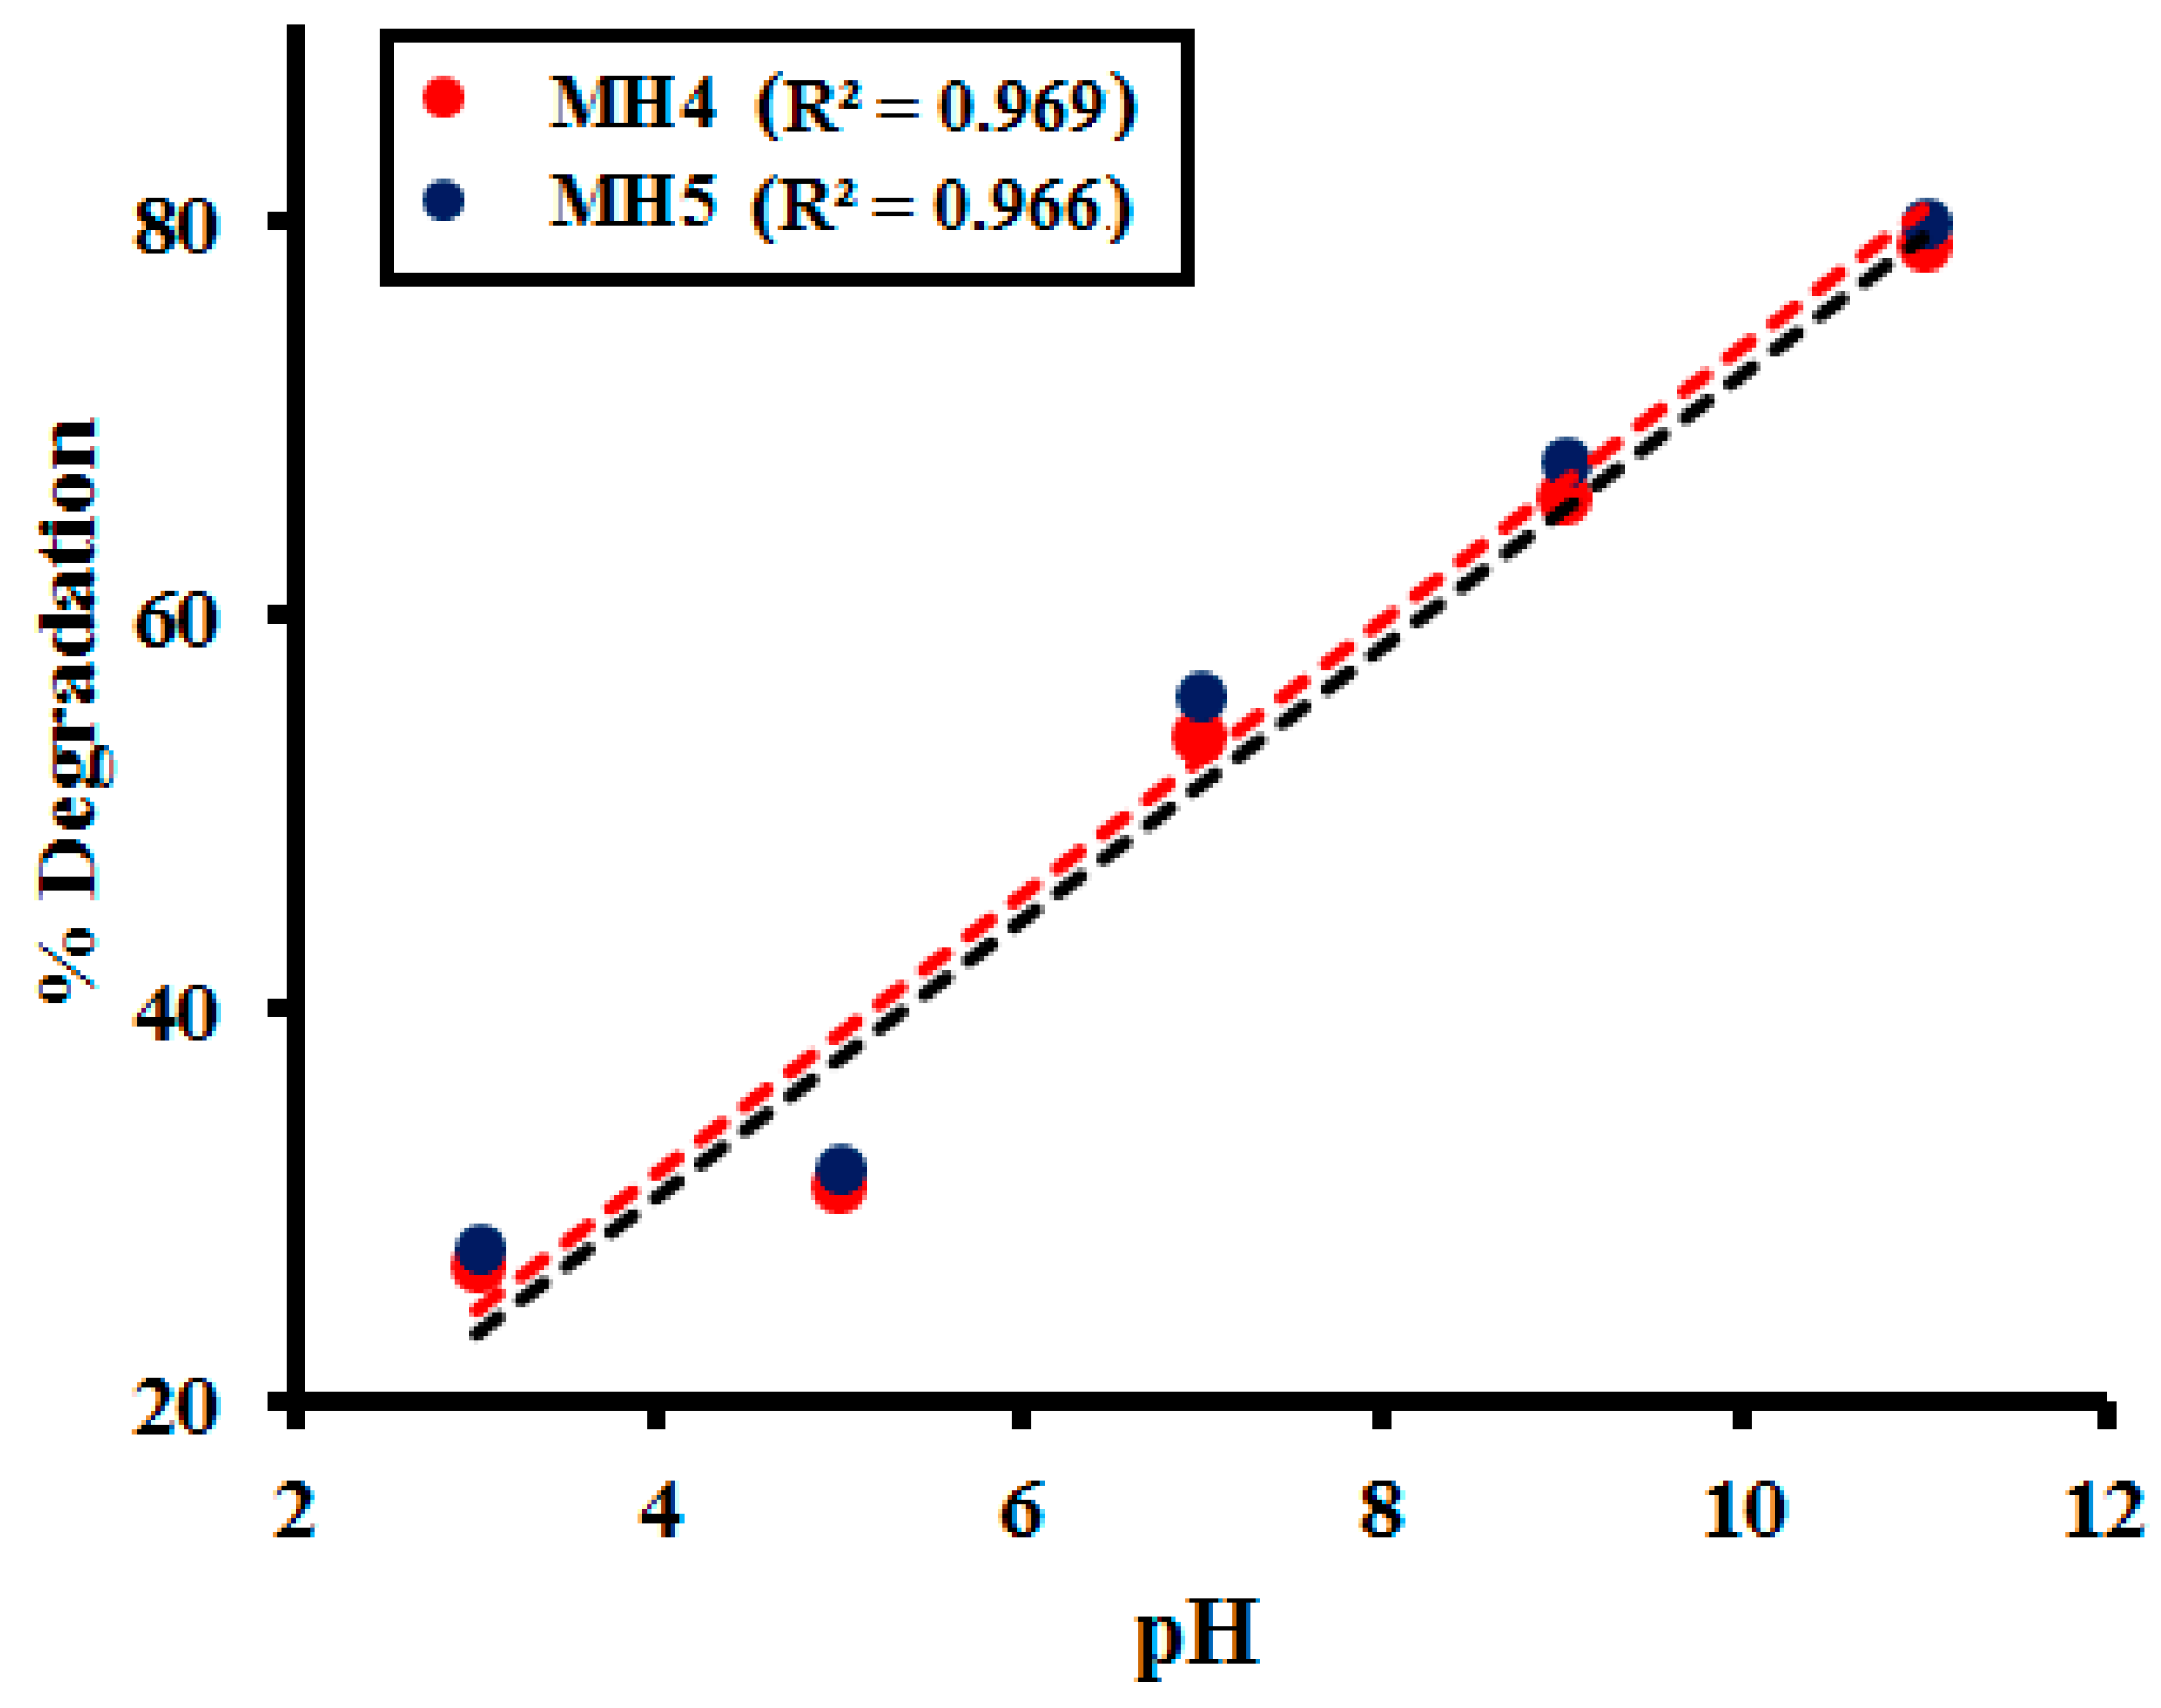
2.2.5. Effect of pH of the Medium
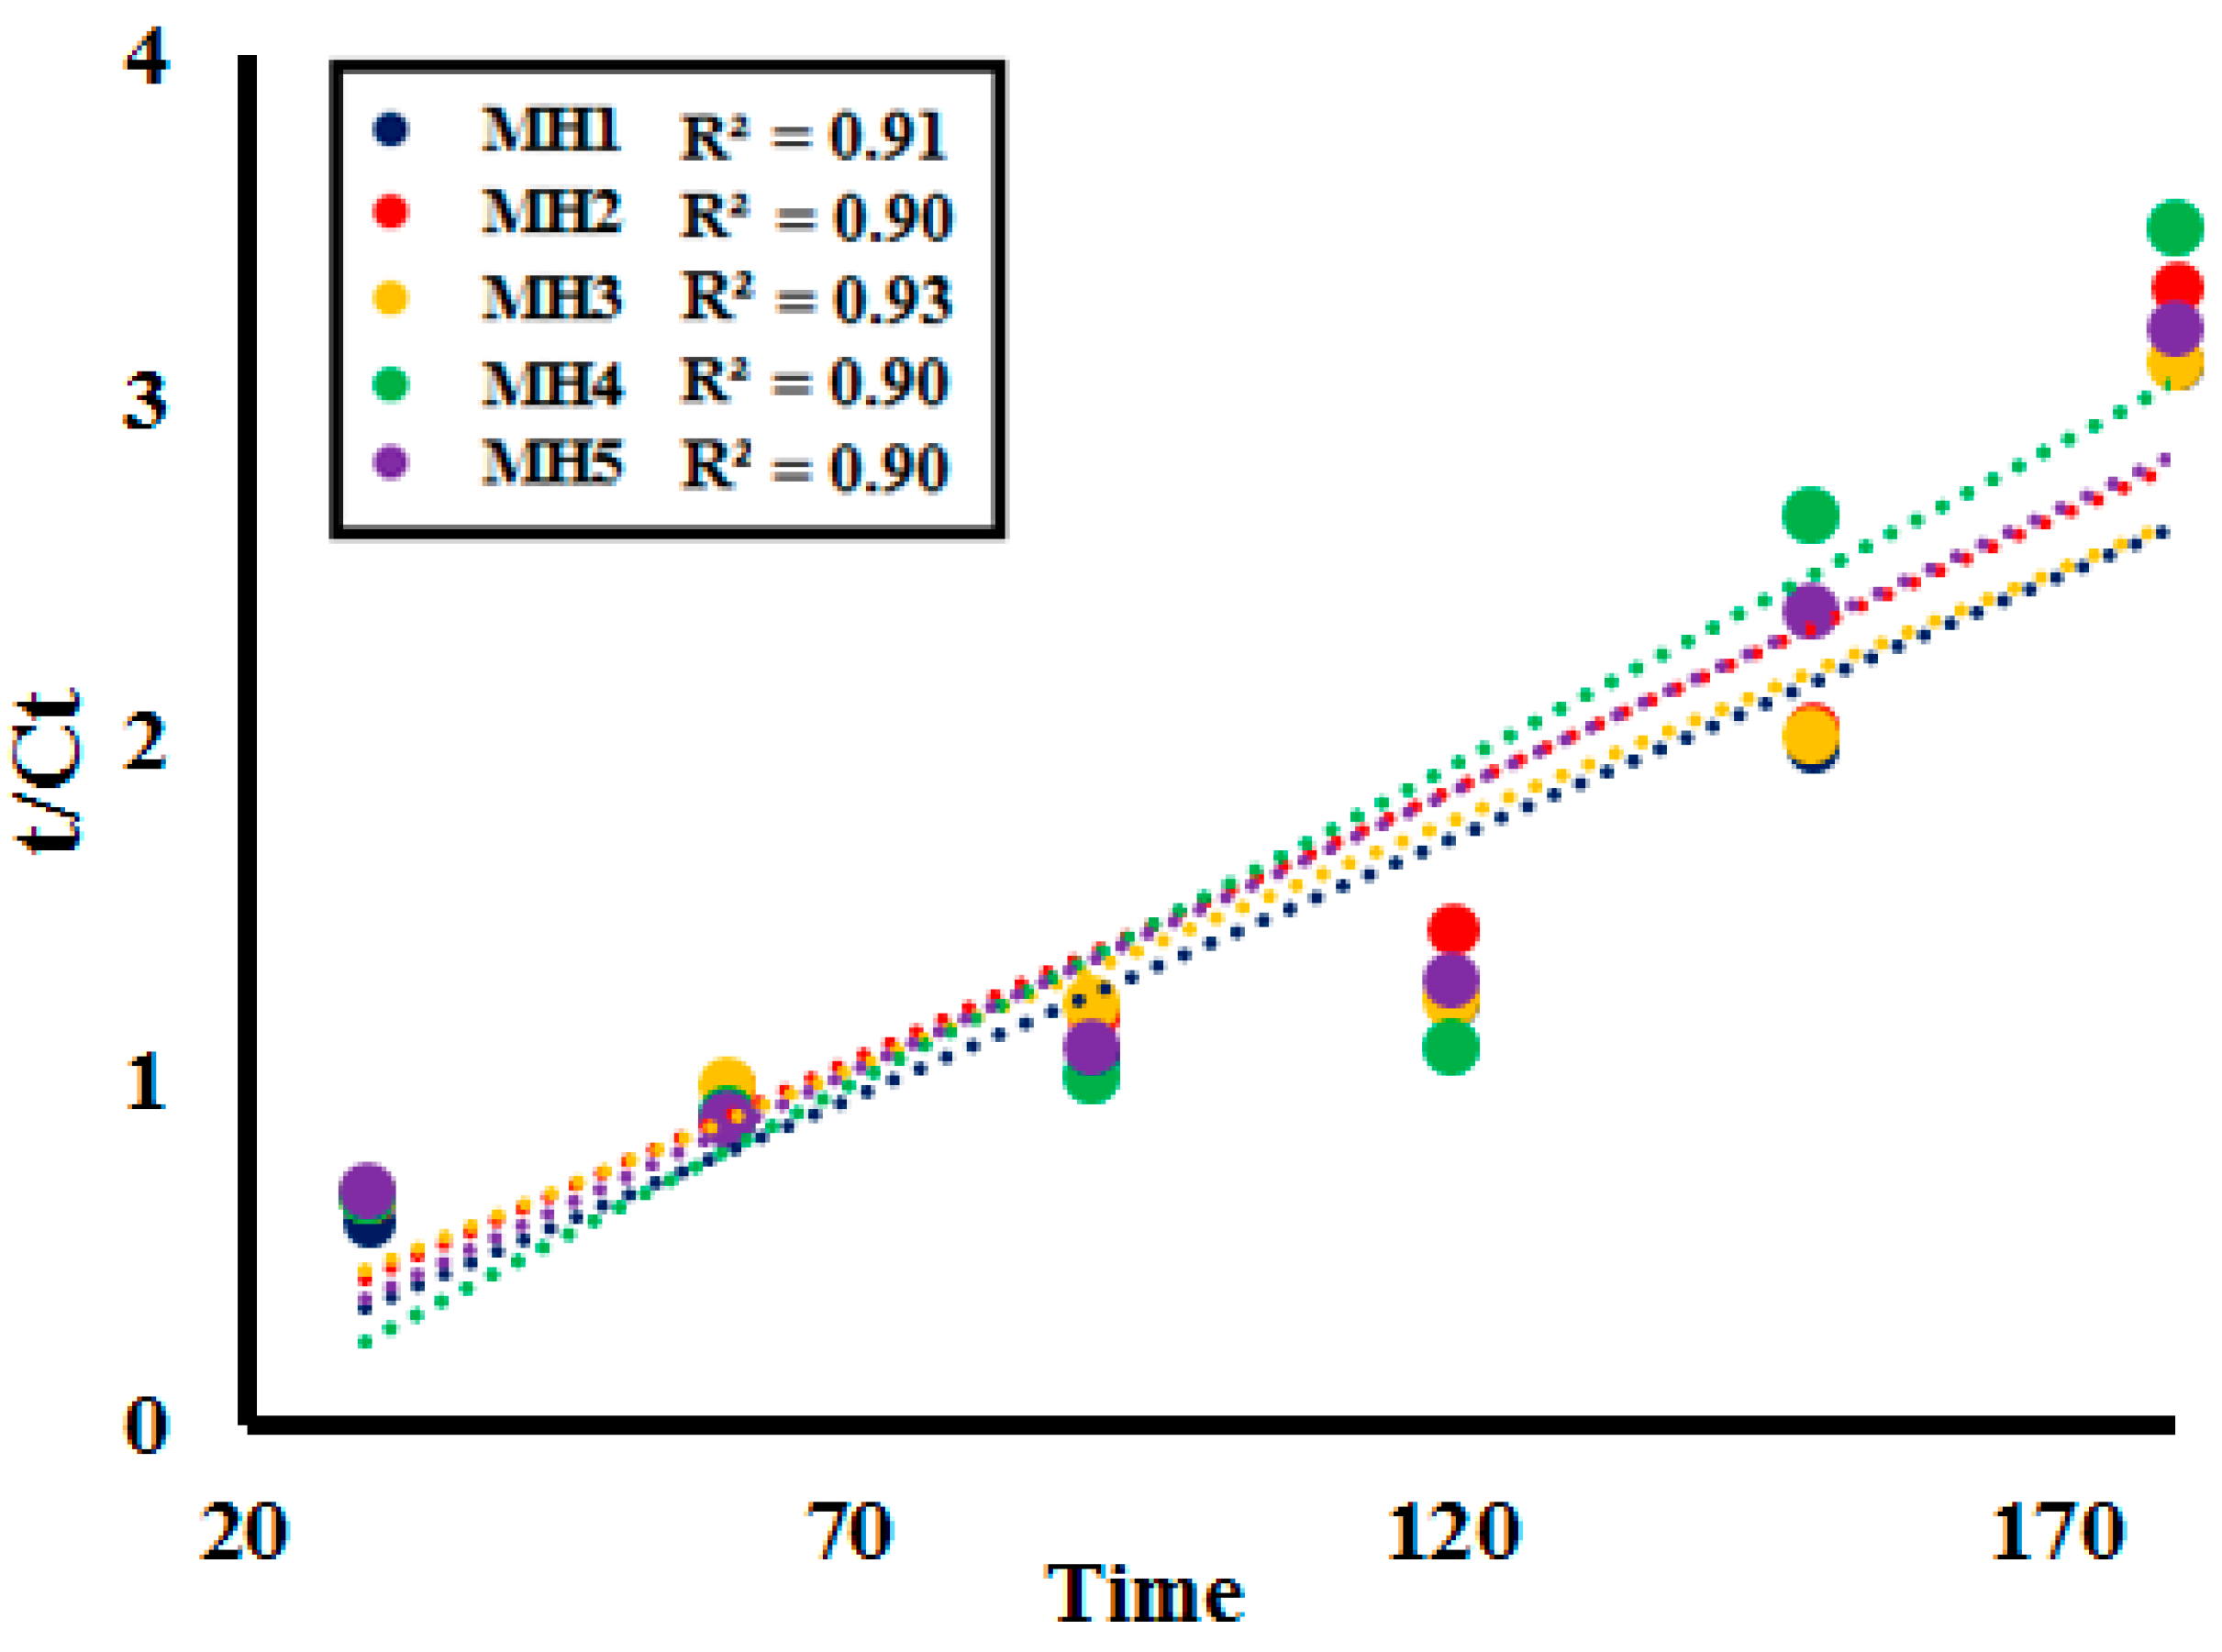
2.3. Kinetic Study
3. Materials and Methods
3.1. Chemicals and Reagents
3.2. Synthesis of Chromium Manganese Oxide Nanomaterials (MH1–MH5)
3.3. Characterization Techniques
3.4. Photocatalytic Activity
4. Conclusions
Supplementary Materials
Author Contributions
Funding
Acknowledgments
Conflicts of Interest
References
- Jain, R.; Sharma, S.; Manoj, S.; Bansal, S.; Gupta, K. Application of titanium dioxide semiconductor photocatalysis in the photomineralization of dyes in textile industry effluents. Indian J. Environ. Prot. 2004, 23, 63–68. [Google Scholar]
- Natarajan, S.; Bajaj, H.C.; Tayade, R.J. Recent advances based on the synergetic effect of adsorption for removal of dyes from waste water using photocatalytic process. J. Environ. Sci. 2018, 65, 201–222. [Google Scholar] [CrossRef] [PubMed]
- Oller, I.; Malato, S.; Pérez, J.S. Combination of Advanced Oxidation Processes and biological treatments for wastewater decontamination—A review. Sci. Total Environ. 2011, 409, 4141–4166. [Google Scholar] [CrossRef] [PubMed]
- Li, Z.; Liu, J.; Zhang, F.-J.; Oh, W.-C. UV and visible light photodegradation effect on Fe–CNT/TiO2 composite catalysts. Bull. Mater. Sci. 2013, 36, 293–299. [Google Scholar] [CrossRef]
- Hussain, K.I.; Usman, M.; Siddiq, M.; Rasool, N.; Nazar, M.F.; Ahmad, I.; Holder, A.A.; Altaf, A.A. Application of micellar enhanced ultrafiltration for the removal of sunset yellow dye from aqueous media. J. Dispersion Sci. Tech. 2017, 38, 139–144. [Google Scholar] [CrossRef]
- Ponnusamy, V.; Lakshmi, G. Enhanced photocatalytic performance of (ZnO/CeO2)-β-CD system for the effective decolorization of Rhodamine B under UV light irradiation. Appl. Water Sci. 2017, 7, 4025–4036. [Google Scholar] [CrossRef]
- Mantzavinos, D.; Psillakis, E. Enhancement of biodegradability of industrial wastewaters by chemical oxidation pre-treatment. J. Chem. Technol. Biotechnol. 2004, 79, 431–454. [Google Scholar] [CrossRef]
- Saeed, K.; Zada, N.; Khan, I. Photocatalytic degradation of alizarin red dye in aqueous medium using carbon nanotubes/Cu-Ti oxide composites. Sep. Sci. Technol. 2018, 54, 2729–2737. [Google Scholar] [CrossRef]
- Saroj, S.; Kumar, K.; Pareek, N.; Prasad, R.; Singh, R. Biodegradation of azo dyes Acid Red 183, Direct Blue 15 and Direct Red 75 by the isolate Penicillium oxalicum SAR-3. Chemosphere 2014, 107, 240–248. [Google Scholar] [CrossRef]
- Iqbal, M.J.; Ashiq, M.N. Thermodynamics of adsorption of dyes from aqueous media on activated charcoal. J. Res. Sci. 2007, 18, 91–99. [Google Scholar]
- Rauf, M.; Ashraf, S. Radiation induced degradation of dyes—An overview. J. Hazard. Mater. 2009, 166, 6–16. [Google Scholar] [CrossRef]
- Akpan, U.; Hameed, B. Parameters affecting the photocatalytic degradation of dyes using TiO2-based photocatalysts: A review. J. Hazard. Mater. 2009, 170, 520–529. [Google Scholar] [CrossRef] [PubMed]
- Qu, X.; Alvarez, P.J.J.; Li, Q. Applications of nanotechnology in water and wastewater treatment. Water Res. 2013, 47, 3931–3946. [Google Scholar] [CrossRef] [PubMed]
- Nakata, K.; Fujishima, A. TiO2 photocatalysis: Design and applications. J. Photochem. Photobiol. C Photochem. Rev. 2012, 13, 169–189. [Google Scholar] [CrossRef]
- Arias, N.P.; Dávila, M.T.; Giraldo, O.H. Electrical behavior of an octahedral layered OL-1-type manganese oxide material. Ionics 2012, 19, 201–214. [Google Scholar] [CrossRef]
- Giraldo, O.; Arias, N.; Becerra, M. Electrical properties of TiO2-pillared bidimensional manganese oxides. Appl. Clay Sci. 2017, 141, 157–170. [Google Scholar] [CrossRef]
- Niederberger, M.; Pinna, N. Metal Oxide Nanoparticles in Organic Solvents; Springer Science and Business Media: New York, NY, USA, 2009. [Google Scholar]
- Arami, M.; Limaee, N.Y.; Mahmoodi, H.; Tabrizi, N.S. Removal of dyes from colored textile wastewater by orange peel adsorbent: Equilibrium and kinetic studies. J. Colloid Interface Sci. 2005, 288, 371–376. [Google Scholar] [CrossRef]
- Kausar, S.; Altaf, A.A.; Hamayun, M.; Rasool, N.; Hadait, M.; Akhtar, A.; Muhammad, S.; Badshah, A.; Shah, S.A.A.; Zakaria, Z.A. i-Propylammonium Lead Chloride Based Perovskite Photocatalysts for Depolymerization of Lignin Under UV Light. Molecules 2020, 25, 3520. [Google Scholar] [CrossRef]
- Danish, M.; Tayyab, M.; Akhtar, A.; Altaf, A.A.; Kausar, S.; Ullah, S.; Iqbal, M. Effect of soft template variation on the synthesis, physical, and electrochemical properties of Mn3O4 nanomaterial. Inorg. Nano-Metal Chem. 2020, 1–7. [Google Scholar] [CrossRef]
- Altaf, A.A.; Ahmed, M.; Hamayun, M.; Kausar, S.; Waqar, M.; Badshah, A. Titania nano-fibers: A review on synthesis and utilities. Inorg. Chim. Acta 2020, 501, 119268. [Google Scholar] [CrossRef]
- Duan, J.; Zheng, Y.; Chen, S.; Tang, Y.; Jaroniec, M.; Qiao, S.Z. Mesoporous hybrid material composed of Mn3O4nanoparticles on nitrogen-doped graphene for highly efficient oxygen reduction reaction. Chem. Commun. 2013, 49, 7705–7707. [Google Scholar] [CrossRef] [PubMed]
- Sood, S.; Mehta, S.K.; Umar, A.; Kansal, S.K. The visible light-driven photocatalytic degradation of Alizarin red S using Bi-doped TiO2 nanoparticles. New J. Chem. 2014, 38, 3127–3136. [Google Scholar] [CrossRef]
- Sun, J.; Lu, H.; Du, L.; Lin, H.; Li, H. Anodic oxidation of anthraquinone dye Alizarin Red S at Ti/BDD electrodes. Appl. Surf. Sci. 2011, 257, 6667–6671. [Google Scholar] [CrossRef]
- Joshi, K.; Shrivastava, V. Degradation of alizarine red-S (A textiles dye) by photocatalysis using ZnO and TiO2 as photocatalyst. Int. J. Environ. Sci. 2011, 2, 8–21. [Google Scholar]
- Kansal, S.K.; Lamba, R.; Mehta, S.; Umar, A. Photocatalytic degradation of Alizarin Red S using simply synthesized ZnO nanoparticles. Mater. Lett. 2013, 106, 385–389. [Google Scholar] [CrossRef]
- Jagodzinski, H. The Role of Munich in X-Ray Crystallography and the Development of Powder Diffraction. Mater. Sci. Forum 1991, 79, 1–16. [Google Scholar] [CrossRef]
- Cullity, B.; Stock, S. Elements of X-ray Diffraction, 3rd ed.; Prentice Hall: New York, NY, USA, 2001; pp. 174–177. [Google Scholar]
- Aé, L.; Kieven, D.; Chen, J.; Klenk, R.; Rissom, T.; Tang, Y.; Lux-Steiner, M.C.; Rissom, T. ZnO nanorod arrays as an antireflective coating for Cu(In,Ga)Se2 thin film solar cells. Prog. Photovolt. Res. Appl. 2010, 18, 209–213. [Google Scholar] [CrossRef]
- Saleem, M. Effect of zinc acetate concentration on the structural and optical properties of ZnO thin films deposited by Sol-Gel method. Int. J. Phys. Sci. 2012, 7, 2971–2979. [Google Scholar] [CrossRef]
- Bindu, P.; Thomas, S. Estimation of lattice strain in ZnO nanoparticles: X-ray peak profile analysis. J. Theor. Appl. Phys. 2014, 8, 123–134. [Google Scholar] [CrossRef]
- Wang, B.; Iqbal, J.; Shan, X.; Huang, G.; Fu, H.; Yu, R.; Yu, D. Effects of Cr-doping on the photoluminescence and ferromagnetism at room temperature in ZnO nanomaterials prepared by soft chemistry route. Mater. Chem. Phys. 2009, 113, 103–106. [Google Scholar] [CrossRef]
- Kernazhitsky, L.; Shymanovska, V.; Gavrilko, T.; Naumov, V.; Fedorenko, L.; Kshnyakin, V.; Burtsev, A.; Baran, J. Effect of Cr-Doping on Luminescence of Nanocrystalline Anatase TiO2 Powders. Ukr. J. Phys. 2016, 61, 482–488. [Google Scholar] [CrossRef]
- Chu, J.; Sher, A. Device Physics of Narrow Gap Semiconductors; Springer Science and Business Media: New York, NY, USA, 2010. [Google Scholar]
- Xu, F.; Yuan, Z.-Y.; Du, G.-H.; Ren, T.-Z.; Volcke, C.; Thiry, P.; Su, B.-L. A low-temperature aqueous solution route to large-scale growth of ZnO nanowire arrays. J. Non-Cryst. Solids 2006, 352, 2569–2574. [Google Scholar] [CrossRef]
- Ho, Y.; McKay, G. Pseudo-second order model for sorption processes. Process Biochem. 1999, 34, 451–465. [Google Scholar] [CrossRef]
- Ho, Y.; McKay, G. Kinetic Models for the Sorption of Dye from Aqueous Solution by Wood. Process Saf. Environ. Prot. 1998, 76, 183–191. [Google Scholar] [CrossRef]
- Liu, Z.; Zhang, F.-S. Removal of lead from water using biochars prepared from hydrothermal liquefaction of biomass. J. Hazard. Mater. 2009, 167, 933–939. [Google Scholar] [CrossRef]
- Kansal, S.; Singh, M.; Sud, D. Studies on TiO2/ZnO photocatalysed degradation of lignin. J. Hazard. Mater. 2008, 153, 412–417. [Google Scholar] [CrossRef]
- Kausar, S.; Altaf, A.A.; Hamayun, M.; Danish, M.; Zubair, M.; Naz, S.; Muhammad, S.; Zaheer, M.; Ullah, S.; Badshah, A. Soft template-based bismuth doped zinc oxide nanocomposites for photocatalytic depolymerization of lignin. Inorg. Chim. Acta 2020, 502, 119390. [Google Scholar] [CrossRef]


| Samples | Found Unit Formula | Synthetic Conditions | PXRD Peaks (2θ) | Found Composition by EDX |
|---|---|---|---|---|
| MH1 | Mn0.99Cr0.1O2 | 0.948 g KMnO4, 0.24 g K2Cr2O7, 20mL HCl | 12.65, 17.89, 28.59, 37.33, 41.77, 49.59, 56.31, 59.87, 69.37 | Mn (54.69); Cr (6.18); O (39.09) |
| MH2 | Mn0.87Cr0.15O2 | 0.948 g KMnO4, 0.41 g K2Cr2O7, 20mL HCl | 12.61, 18.03, 28.71, 37.41, 41.79, 49.67, 59.93, 69.31 | Mn (48.05); Cr (8.26); O (43.68) |
| MH3 | Mn0.99Cr0.13O2 | 0.948 g KMnO4, 0.35 g K2Cr2O7, 20mL HCl | 12.67, 18.09, 28.77, 37.41, 41.85, 49.71, 56.29, 60.11, 69.33 | Mn (54.88); Cr (7.21); O (37.90) |
| MH4 | Mn0.96Cr0.09O2 | 0.948 g KMnO4, 0.18 g K2Cr2O7, 20mL HCl | 13.09, 18.39, 28.85, 37.73, 42.07,50.13, 56.67, 60.25, 70.03 | Mn (53.05); Cr (5.05); O (41.88) |
| MH5 | Mn0.92Cr0.12O2 | 0.948 g KMnO4, 0.30 g K2Cr2O7, 20mL HCl | 12.77, 18.05, 28.65, 37.45, 41.95, 49.79, 56.25, 60.13, 69.03 | Mn (50.69); Cr (6.41); O (42.88) |
| Samples | Found Composition | Average Crystallite Size D (nm) | Volume V = D3 | Dislocation Density × 10−3 (nm)−2 (δ) | Micro Strain (ε) |
|---|---|---|---|---|---|
| MH1 | Mn0.99Cr0.1O2 | 44.02 ± 8 | 82,780 | 5.95 × 10⁻⁴ | 0.035 |
| MH2 | Mn0.87Cr0.15O2 | 38.90 ± 6 | 62,205 | 6.98 × 10⁻⁴ | 0.038 |
| MH3 | Mn0.99Cr0.13O2 | 49.60 ± 5 | 126,625 | 4.19 × 10⁻⁴ | 0.027 |
| MH4 | Mn0.96Cr0.09O2 | 50.22 ± 7 | 135,584 | 4.20 × 10⁻⁴ | 0.02 |
| MH5 | Mn0.92Cr0.12O2 | 36.82 ± 3 | 49,576 | 7.60 × 10⁻⁴ | 0.035 |
| Samples | Material Nature | Dispersity | Structural Appearance |
|---|---|---|---|
| MH1 | Monocrystalline | Monodisperse | Elongated Rod-like Structures |
| MH2 | Monocrystalline | Monodisperse | Elongated Rod-like Structures |
| MH3 | Monocrystalline | Monodisperse | Elongated Rod-like Structures |
| MH4 | Monocrystalline | Monodisperse | Short Edged Rods |
| MH5 | Monocrystalline | Monodisperse | Elongated Rod-like Structures |
| BET Properties | Samples | ||||
|---|---|---|---|---|---|
| MH1 | MH2 | MH3 | MH4 | MH 5 | |
| Surface ARea (SBET) (m2/g) | 37.153 | 33.998 | 46.325 | 37.515 | 20.906 |
| Pore Volume (Vm) (cc/g) | 0.048 | 0.018 | 0.038 | 0.043 | 0.032 |
| Pore Width (nm) | 3.775 | 2.425 | 2.583 | 3.537 | 4.887 |
| Constant C | 6951.982 | 4.652 | 19.11 | 93.29 | 2090.61 |
| Time (min) | MH1 | MH2 | MH3 | MH4 | MH5 |
|---|---|---|---|---|---|
| 30 | 46.21 | 44.94 | 45.61 | 44.21 | 47.23 |
| 60 | 57.11 | 52.40 | 52.12 | 53.02 | 54.15 |
| 90 | 61.78 | 61.00 | 62.09 | 63.07 | 62.20 |
| 120 | 67.78 | 66.18 | 68.21 | 68.22 | 67.98 |
| 150 | 79.29 | 78.79 | 78.76 | 79.51 | 77.13 |
| 180 | 89.06 | 88.99 | 86.76 | 88.23 | 89.89 |
| Amounts (g) | MH1 | MH2 | MH3 | MH4 | MH5 |
|---|---|---|---|---|---|
| 0.020 | 38.99 | 39.23 | 38.32 | 40.22 | 41.77 |
| 0.025 | 57.11 | 52.40 | 52.12 | 53.02 | 54.15 |
| 0.030 | 67.32 | 68.23 | 66.21 | 67.88 | 68.54 |
| 0.035 | 70.86 | 69.54 | 69.86 | 70.55 | 71.87 |
| 0.040 | 81.76 | 82.87 | 81.36 | 83.78 | 84.34 |
| Dye Concentration (ppm) | MH1 | MH2 | MH3 | MH4 | MH5 |
|---|---|---|---|---|---|
| 50 | 82.12 | 83.09 | 83.87 | 83.43 | 83.54 |
| 100 | 77.47 | 77 | 79.22 | 78.87 | 78.12 |
| 150 | 70.47 | 71 | 71.12 | 70.45 | 72.22 |
| 200 | 63.21 | 65.03 | 65.83 | 64.22 | 64.08 |
| 250 | 57.11 | 52.40 | 52.12 | 53.02 | 54.95 |
| pH | MH 1 | MH 2 | MH 3 | MH 4 | MH 5 |
|---|---|---|---|---|---|
| 3 | 25.62 | 26.20 | 26.86 | 25.92 | 26.14 |
| 5 | 27.69 | 27.11 | 28.29 | 28.68 | 27.88 |
| 7 | 49.22 | 48.01 | 49.78 | 49.89 | 50.22 |
| 9 | 64.63 | 64.98 | 65.22 | 65.18 | 67.63 |
| 11 | 76.71 | 76.02 | 76.10 | 76.97 | 78.51 |
| Samples | Correlation between Factor Studied and AR Dye Concentration after 60 min of Photocatalytic Activity (R2 Values) | |||
|---|---|---|---|---|
| Time | Catalyst Dose | Dye Concentration | pH | |
| MH1 | 0.959 | 0.969 | 0.932 | 0.973 |
| MH2 | 0.94 | 0.968 | 0.928 | 0.972 |
| MH3 | 0.932 | 0.953 | 0.960 | 0.971 |
| MH4 | 0.946 | 0.943 | 0.954 | 0.865 |
| MH | 0.986 | 0.924 | 0.988 | 0.869 |
© 2020 by the authors. Licensee MDPI, Basel, Switzerland. This article is an open access article distributed under the terms and conditions of the Creative Commons Attribution (CC BY) license (http://creativecommons.org/licenses/by/4.0/).
Share and Cite
Hamza, M.; Altaf, A.A.; Kausar, S.; Murtaza, S.; Rasool, N.; Gul, R.; Badshah, A.; Zaheer, M.; Ali Shah, S.A.; Zakaria, Z.A. Catalytic Removal of Alizarin Red Using Chromium Manganese Oxide Nanorods: Degradation and Kinetic Studies. Catalysts 2020, 10, 1150. https://doi.org/10.3390/catal10101150
Hamza M, Altaf AA, Kausar S, Murtaza S, Rasool N, Gul R, Badshah A, Zaheer M, Ali Shah SA, Zakaria ZA. Catalytic Removal of Alizarin Red Using Chromium Manganese Oxide Nanorods: Degradation and Kinetic Studies. Catalysts. 2020; 10(10):1150. https://doi.org/10.3390/catal10101150
Chicago/Turabian StyleHamza, Muhammad, Ataf Ali Altaf, Samia Kausar, Shahzad Murtaza, Nasir Rasool, Rukhsana Gul, Amin Badshah, Muhammad Zaheer, Syed Adnan Ali Shah, and Zainul Amiruddin Zakaria. 2020. "Catalytic Removal of Alizarin Red Using Chromium Manganese Oxide Nanorods: Degradation and Kinetic Studies" Catalysts 10, no. 10: 1150. https://doi.org/10.3390/catal10101150
APA StyleHamza, M., Altaf, A. A., Kausar, S., Murtaza, S., Rasool, N., Gul, R., Badshah, A., Zaheer, M., Ali Shah, S. A., & Zakaria, Z. A. (2020). Catalytic Removal of Alizarin Red Using Chromium Manganese Oxide Nanorods: Degradation and Kinetic Studies. Catalysts, 10(10), 1150. https://doi.org/10.3390/catal10101150