Article

Ethanol Dehydrogenation: A Reaction Path Study by Means of Temporal Analysis of Products

1
Institute of Energy and Climate Research, IEK-14: Electrochemical Process Engineering, Forschungszentrum Jülich GmbH, 52425 Jülich, Germany
2
Central Facility for Electron Microscopy (GFE), RWTH Aachen University, 52074 Aachen, Germany
3
Ernst Ruska-Centre (ER-C) for Microscopy and Spectroscopy with Electrons, Forschungszentrum Jülich GmbH, 52425 Jülich, Germany
*
Author to whom correspondence should be addressed.
Catalysts 2020, 10(10), 1151; https://doi.org/10.3390/catal10101151
Submission received: 4 September 2020 / Revised: 1 October 2020 / Accepted: 4 October 2020 / Published: 6 October 2020
(This article belongs to the Section Environmental Catalysis)

Abstract

:
Conventional fossil fuels such as gasoline or diesel should be substituted in the future by environmentally-friendly alternatives in order to reduce emissions in the transport sector and thus mitigate global warming. In this regard, iso-butanol is very promising as its chemical and physical properties are very similar to those of gasoline. Therefore, ongoing research deals with the development of catalytically-supported synthesis routes to iso-butanol, starting from renewably-generated methanol. This research has already revealed that the dehydrogenation of ethanol plays an important role in the reaction sequence from methanol to iso-butanol. To improve the fundamental understanding of the ethanol dehydrogenation step, the Temporal Analysis of Products (TAP) methodology was applied to illuminate that the catalysts used, Pt/C, Ir/C and Cu/C, are very active in ethanol adsorption. H2 and acetaldehyde are formed on the catalyst surfaces, with the latter quickly decomposing into CO and CH4 under the given reaction conditions. Based on the TAP results, this paper proposes a reaction scheme for ethanol dehydrogenation and acetaldehyde decomposition on the respective catalysts. The samples are characterized by means of N2 sorption and Scanning Transmission Electron Microscopy (STEM).

Graphical Abstract

1. Introduction

Recently, basic research into new catalysts for the synthesis of higher alcohols on a renewable basis via aldolic condensation has been gaining increasing attention [1,2,3,4,5,6]. Amongst these alcohols, iso-butanol in particular has been identified as very promising from various perspectives. It has been found that its physical and chemical properties (i.e., density, viscosity, solubility in water, lower heating value, boiling point, flash point, self-ignition temperature, motor octane number, etc.) are similar to those of conventional gasoline and conform to relevant standards for that substance [7]. Additionally, experiments and simulations have demonstrated that the combustion properties of pure iso-butanol and iso-butanol/gasoline blends, respectively, widely resemble the combustion characteristics of conventional gasoline. It has been demonstrated that using pure iso-butanol or iso-butanol/gasoline blends might even enhance the performance of internal combustion engines by reducing the quantities of NOx, CO and hydrocarbon emissions [2,8]. Singh and Sung [9] found that butanol isomers are advantageous with respect to soot formation in comparison to the isomers of butane. Thus, iso-butanol clearly offers the potential to become a “green” future fuel for the transport sector if it is synthesized from renewable feedstocks.
Against this background, the Forschungszentrum Jülich has been a partner in the project “C3-Mobility”, funded by the German Federal Ministry for Economic Affairs and Energy, since 2018. The fundamental assumption of this project is that in future mobility concepts for the transport sector, renewable methanol will be an important raw material to be refined in different processes, yielding viable transport fuels. It is also assumed in these scenarios that renewable methanol will be produced locally from H2 and CO2 in different venues worldwide, where wind- or solar-driven water electrolysis facilities for H2 production can be economically operated and where CO2 being separated from the exhausts of, e.g., steelworks, cement facilities or even ambient air will be available in sufficient quantities. In “C3-Mobility”, Jülich’s specific refining path that starts from renewable methanol, deals with the development of suitable and experimentally-proven synthesis routes to produce iso-butanol. This includes the evaluation of proper reaction conditions (pressure, temperature, etc.) and active catalysts.
Figure 1 shows a reaction scheme that constitutes a possible solution for the synthesis of iso-butanol, starting with methanol and ethanol. It is an adaption of the “hydrogen-borrowing mechanism” proposed by Siddiki et al. [10] that uses a Pt/C catalyst for H2 uptake and subsequent release. The original scope of the work of Sidikki et al. was the catalytic methylation of C–H bonds in alcohols, ketones and indoles with methanol. For the synthesis of iso-butanol displayed in Figure 1, one mole of ethanol and methanol, respectively, react in the presence of NaOH, and exemplarily, a Pt/C catalyst at 120 °C to form acetaldehyde and formaldehyde, which in turn further reacts to form acrolein, and after hydrogenation, propanol. Another comparable C-methylation step on the Pt/C-catalyst then yields iso-butanol. However, the third C-methylation step in Figure 1 from iso-butanol to undesired 2,2-dimethyl-1-propanol has only been demonstrated in a homogeneous catalyst thus far [11] and is not assumed to take place on a Pt/C catalyst. The first step of this reaction sequence, i.e., the dehydrogenation of ethanol to acetaldehyde, is the focus of this paper. To better comprehend it from a mechanistic point of view (residence time distribution of products and residual educts, reaction intermediates, undesired side reactions, subsequent aldol condensation reactions), a Temporal Analysis of Products (TAP) investigation of precious metal (Pt, Ir, supported on active carbon) and base metal (Cu on active carbon) catalysts was performed. These three samples were chosen as it was demonstrated in a recent experimental investigation by Häusler et al. [12] that they are also suitable for the synthesis of desired iso-butanol according to the reaction scheme from Figure 1.
Only a few studies in the literature focus on the mechanistic aspects of ethanol dehydrogenation. Ashok et al. [13] used Co nanoparticles in a mechanistic study and found aldehyde and acetate components, together with H2, H2O, CO2 and CH4. Kim and Ryu [14] worked with V2O5/TiO2 catalysts and detected both ethanol dehydration to ethene and ethanol dehydrogenation to acetaldehyde. The latter was favored by higher V2O5 loadings. In the case of the work of Krutpijit et al. [15], the acetaldehyde route was preferred over the ethene path, when the AgLi catalyst was modified by Al2O3. The differentiation between dehydrogenation and dehydration will be an important point of the experiments in this paper, as the dehydration route does not lead to desired iso-butanol.
Many research groups have found Cu catalysts to be highly active for ethanol dehydrogenation, revealing selectivities towards acetaldehyde of almost 100% in some cases [16,17,18,19,20,21,22,23,24,25]. A positive effect is reported when the Cu content increased in the range of 1–5 wt % [26]. Hanukovich et al. [27] reported that the rate-determining step of ethanol dehydrogenation on Cu can be the fission of the O–H bond or that of the Cα–H bond. An important topic with respect to catalysts for ethanol dehydrogenation is the significant deactivation that occurs due to coke formation on the catalyst surface and the sintering of the active catalyst particles. This was found in the case of PdZn nanoparticles [28], monometallic Cu [29,30], bi- or tri-metallic Cu alloys [29,31,32,33], SiO2 supported Cu catalysts [34] and V/Mg Al catalysts [35,36]. There is a considerable number of papers that use computational methods such as density functional theory or a combination of experimental methods and modelling tools to investigate correlations between catalyst activity and selectivity on the one hand and material characteristics such as crystal faces, monolayer coverages, etc., on the other [37,38,39,40,41].
Autthanit et al. [42,43] investigated AgLi/TiO2 and VOx/SBA-15 catalysts under non-oxidative and oxidative reaction conditions and found significantly higher conversions and acetaldehyde yields in the case of oxidative dehydrogenation. Ag nanoparticles on SiO2 and SiO2/CeO2 were tested by Mamontov et al. [44], who observed increased catalytic activity when Ag/SiO2 was modified by CeO2 nanoparticles. Dutov et al. [45] tested Ag/OMS-2/SiO2 catalysts for the selective oxidation of ethanol to acetaldehyde and observed a positive effect of Ag doping on the oxidation rate but also undesired total oxidation, leading to CO2. Giannakis et al. [46] investigated Au and NiAu single atom alloys and found that the addition of Ni increased the catalytic activity and reduced the sintering processes. The best results were obtained at 280 °C. The same effect of increased activity and stability was observed by Shan et al. [47,48] when they doped their Cu nanoparticles with Ni to form a NiCu alloy. Li et al. [49] used a metal-free catalyst consisting of nitrogen-doped graphenes and found acetaldehyde to be the only product of ethanol dehydrogenation at reaction temperatures of between 200 °C and 350 °C. Ob-Eye et al. [50,51,52] used activated carbons as support and doped them with Co, Ce, Cu and Ni in the temperature range of 250 °C to 400 °C. The Cu-containing catalyst showed the highest activity and most promising selectivity regarding acetaldehyde (more than 96%). Wang et al. [53] tested Au supported on ZnZrOx at temperatures between 30 °C and 400 °C and observed that the addition of Au favors the dehydrogenation route over the dehydration path. Mitran et al. [54] investigated mixtures of ethanol and methanol with their H1−xTi2(PO4)3−x(SO4)x-catalyst and observed higher conversions of ethanol (> 95%) compared to those of methanol (55%).

2. Results and Discussion

2.1. Catalyst Characterization

2.1.1. N2 Sorption

Table 1 summarizes the specific surface areas of the different catalysts from this study. Cu/C shows the largest surface of 1271 m2 g−1, while that of the Pt/C sample was the smallest, with 805 m2 g−1. Figure 2 shows that the average pore diameter of all three catalysts was in the range of approximately 20 nm.

2.1.2. Scanning Transmission Electron Microscopy

Z-contrast, high-angle, annular dark field (HAADF) STEM combined with energy-dispersive X-ray (EDX) elemental mapping was applied to investigate the morphology and distribution of deposited catalytic nanoparticles on the carbon support (see Figure 3). Differences in chemical compositions were visualized, as the image contrast was proportional to the atomic number of scattering atoms. Hence, the metals on the C support appear as bright contrast features in the HAADF images; see Figure 3. The fact that these were the corresponding elements was confirmed by EDX mapping. The top-left image in row a) shows an overview of Pt nanoparticles in the fresh catalyst of ~2 nm in size on the carbon support. Some agglomeration was also observed. Ir nanoparticles in the fresh material had a similar distribution within the carbon support (see row b), and particles of ~2.5 nm in size. Based on various HAADF-STEM images acquired for the Ir containing material (not shown here), a trend of the Ir nanoparticles to form agglomerates was noticed. In the meantime, Pt nanoparticles had a lower tendency to agglomerate. Smaller agglomerates (compared to the case of Ir) were observed in the fresh material. High-Resolution (HR) HAADF-STEM images of Pt and Ir nanoparticles were also displayed on the right side of Figure 3 with corresponding Fast-Fourier-Transform (FFT) patterns in the insets. Pt and Ir nanoparticles most likely matched the metallic face-centered cubic crystal structure (fcc). The images were taken along the [011] and [001] zone axis [55]. The fresh Cu-containing nanoparticles of ~6 nm in size on the carbon support were investigated by a similar set-up and the results were placed in row c). In the images, the clear nanoparticulate nature of the investigated brighter features was visible. The EDX map shows a clear Cu and C enrichment in the expected regions used for mapping. The TEM grid gave a relatively uniform level of signal, as the carbon coating in the grid was a relatively homogeneous amorphous thin layer (e.g., see the upper left corner of the map—the carbon grid is visible in that position). These qualitative data are shown to evidence the presence of Cu rich particles on the carbon support.

2.2. Temporal Analysis of Products

2.2.1. Experiments with Pt/C

CH2OH → CH3CHO + H2 endothermic
CH3CHO → CO + CH4 exothermic
CH3CHO → CO + C + 2 H2 endothermic
Figure 4a shows the height-normalized transient responses to pulses of ethanol (34.6 vol %) in Ar at m/z-values of two for H2, 16 for CH4, 28 for CO, 29 for acetaldehyde and 40 for Ar at an exemplary reaction temperature of 200 °C. An H2 pre-reduced Pt/C catalyst was used. In addition to the above-mentioned m/z-values, that at 31, which is significant for ethanol, was also recorded during this experiment. However, under these reaction conditions, ethanol was completely consumed by the catalyst and the corresponding response pulse at an m/z-value of 31 did not show any measurable peak. This fact considerably simplifies the mass-spectrometric analysis, as the mass fractions of ethanol, especially at an m/z-value of 29, would unfavorably perturb the analysis of acetaldehyde. It can be concluded that the pre-reduced Pt/C catalyst was very active for the adsorption of ethanol and its further reactions.
In this respect, Figure 4a shows an interesting number of detected reaction products, and additionally, in which order (residence time distribution) and in which way (desorption behavior) they exit the micro-reactor. The figure illustrates that acetaldehyde and H2 are produced and then desorb from the catalyst surface, indicating that ethanol dehydrogenation, according to reaction Equation (1), takes place under the reaction conditions of the TAP experiments. In addition to acetaldehyde and H2, CO and CH4 also desorb from the catalyst surface. The formation of CO and CH4 can be explained by the decomposition of acetaldehyde according to Equation (2). Ouyang et al. [56] also reported on the formation of CO and CH4 on Pd clusters being deposited on ZnO. In order to reveal if there was also a reaction to Equation (3), which additionally reflects C-formation on the catalyst surface as relevant over the course of ethanol dehydrogenation, 10,000 pulses of ethanol (34.6 vol % in Ar) were pulsed over the H2 pre-reduced Pt/C catalyst at 200 °C. Before and after this very long series of ethanol pulses, mixtures of 50% O2 in Ar were injected into the TAP micro-reactor at a temperature of 200 °C, while recording the transient responses of CO2 and CO, respectively. The results of this experiment are shown in Figure 5a,b. While CO2 and CO desorption show quite low intensities prior to the 10,000 ethanol pulses as a result of the reaction between the carbon support and injected O2 molecules, their levels significantly increase after the 10,000 ethanol pulses, clearly indicating that C deposits are formed when ethanol is pulsed over the catalyst surface. Fortunately, these deposits can be fully removed by injecting a large number of O2 pulses. Thus, reaction Equation (3) must be taken into consideration when proposing a reaction scheme.
Looking more closely at the transient responses of CO and acetaldehyde in Figure 4a, it becomes obvious that they coincide in their rising sections with lower residence times up to approximately 0.3–0.4 s. This means that both molecules desorb on a comparable time scale from the catalyst surface in this time-span and permits the conclusion that CO formation from acetaldehyde, which requires many steps on the catalyst surface, like C–C and C–H bond cleavages, is a very rapid process. It is also fast in relation to the desorption of acetaldehyde itself and in comparison to other, slower steps on the catalyst surface that control the profound tailings of the response pulses of CH4 and H2 in Figure 4a,b in particular.
The very broad shapes of the strongly delayed transient responses of CH4 and H2 in Figure 4b raise the question as to whether they are caused by reversible adsorption and spillover processes on the Pt/C catalyst surface or if they are due to the slow surface steps of further acetaldehyde decomposition, as per reaction Equations (2) and (3). To elucidate this question, pulses of 38.6 vol % acetaldehyde in Ar and of single mixtures of 50 vol % CH4 and H2, respectively, in Ar were pulsed over the H2 pre-reduced Pt/C catalyst at temperatures between 100 °C and 250 °C. Additionally, a carbon black sample was applied. As a result, Figure 6a presents the height-normalized transient responses at an m/z-value of 16 for CH4 for three different cases: (i) pulsing of acetaldehyde (38.6 vol %) in Ar over Pt/C; (ii) pulsing of a mixture of 50 vol % CH4 in Ar over the Pt/C catalyst; and (iii) pulsing of the same mixture over carbon black. As a means of comparison, the averaged response pulse for Ar is also depicted. The exemplary reaction temperature is again 200 °C. It can be seen from Figure 6a that CH4 from single pulsing over the Pt/C catalyst and over carbon black shows relatively narrow and almost congruent transient responses with a residence time that is only slightly longer than that of Ar, representing the diffusion-only case. This finding proves that reversible CH4 adsorption on Pt and CH4 spillover from Pt to the C support can be excluded as an explanation for the observed broad response pulses of CH4, as observed in case (i).
A slightly different picture emerges for H2 in Figure 6b, which shows the height-normalized transient responses at an m/z-value of 2 for H2 for the same three cases given above. Of course, H2 is used instead of CH4 in the Ar mixture, with the resulting transient responses again being compared to that of the averaged Ar curves. The transient H2 response from acetaldehyde pulsing over Pt/C is by far the broadest curve in this figure, as is the case for CH4, but that from pulsing the mixture of H2/Ar over the Pt/C catalyst, is much broader than the Ar response pulse. Moreover, it is considerably broader than the signal for H2 evolution from carbon black. In the case of H2 and unlike CH4, reversible adsorption on Pt and spillover processes from the Pt to the C support play a significant role. In the literature, spillover on Pt has been investigated and positively highlighted for catalysts for H2 storage and hydrogenation reactions, respectively [57,58,59,60]. Both reaction types are essential for the proper utilization of the Siddiki reaction scheme from Figure 1. However, Figure 6b also makes it very clear that reversible adsorption and spillover alone are not sufficient to explain the very broad and delayed response pulse for H2 when acetaldehyde is pulsed over the Pt/C catalyst.
It can be concluded from the data in Figure 4, Figure 5 and Figure 6 that the following steps for the decomposition of acetaldehyde as a product of preceding ethanol dehydrogenation, including hydrogen spillover, can be proposed, whereby the ethoxy intermediate in reaction step (4) has already been proposed in the literature [13,17,34,38,48]. Step (4) must be considered irreversible for the Pt/C catalyst, as no ethanol molecules are observed in the outlet of the TAP micro-reactor in the entire temperature range between 100 °C and 250 °C. In reaction step (5), the ethoxy intermediate further decomposes into acetaldehyde, partly desorbing from the catalyst surface and adsorbed H species (H*) and, of course, adsorbed acetaldehyde species (CH3CHO*). During reaction step (6), acetaldehyde quickly decomposes into CO, carbonaceous deposits C*, adsorbed methyl species (CH3*) and H*.
CH3CH2OH → CH3CH2O* + H*
CH3CH2O* ↔ CH3CHO + H* + CH3CHO*
CH3CHO * ↔ CO + C* + CH3* + H*
CH3* + H* → spillover → CH4
H* + H* → spillover → H2
In this scheme, the CH3* and H* adsorbates have considerably long residence times on the catalyst surface including some spillover processes on the catalyst surface before they recombine as CH4 or H2. The recombination step e) is practically irreversible under these reaction conditions. This scheme is consistent with:
  • The total consumption of ethanol by the catalyst surface;
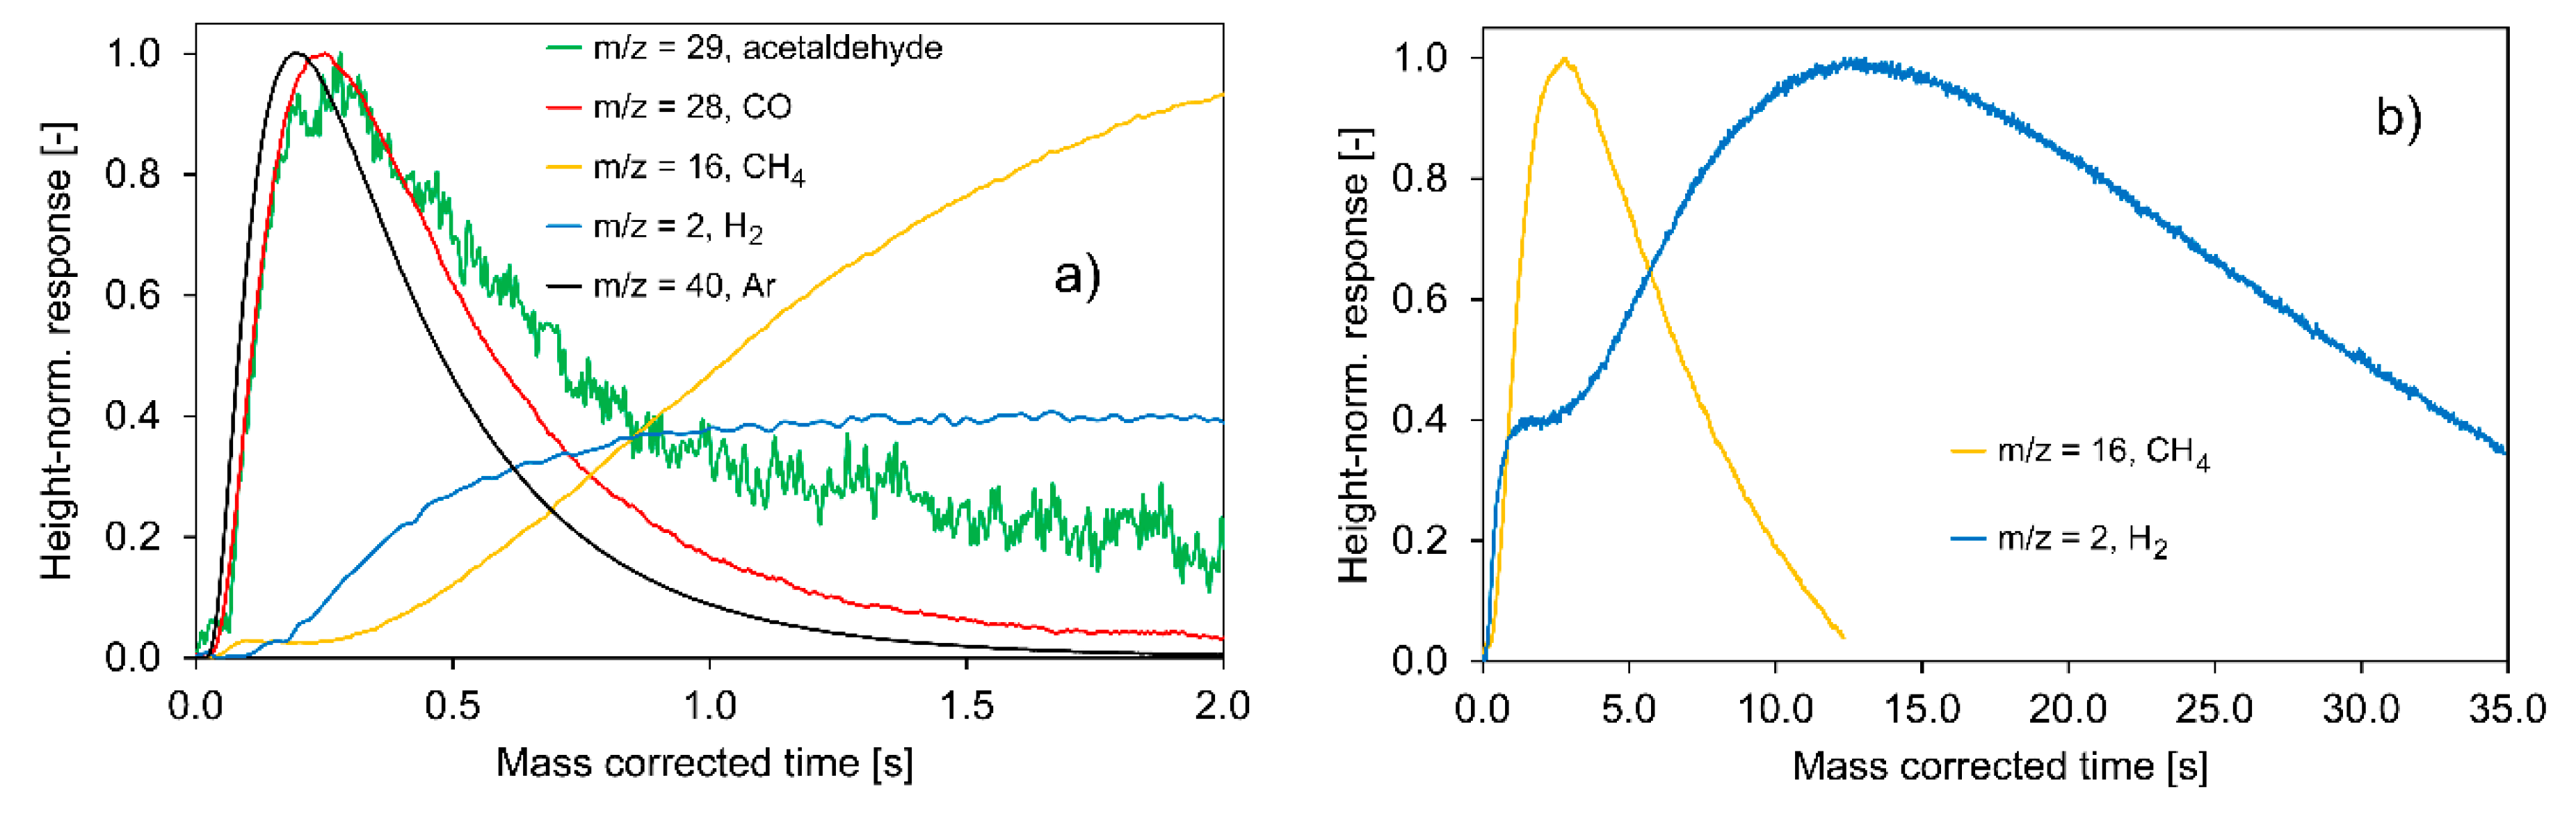
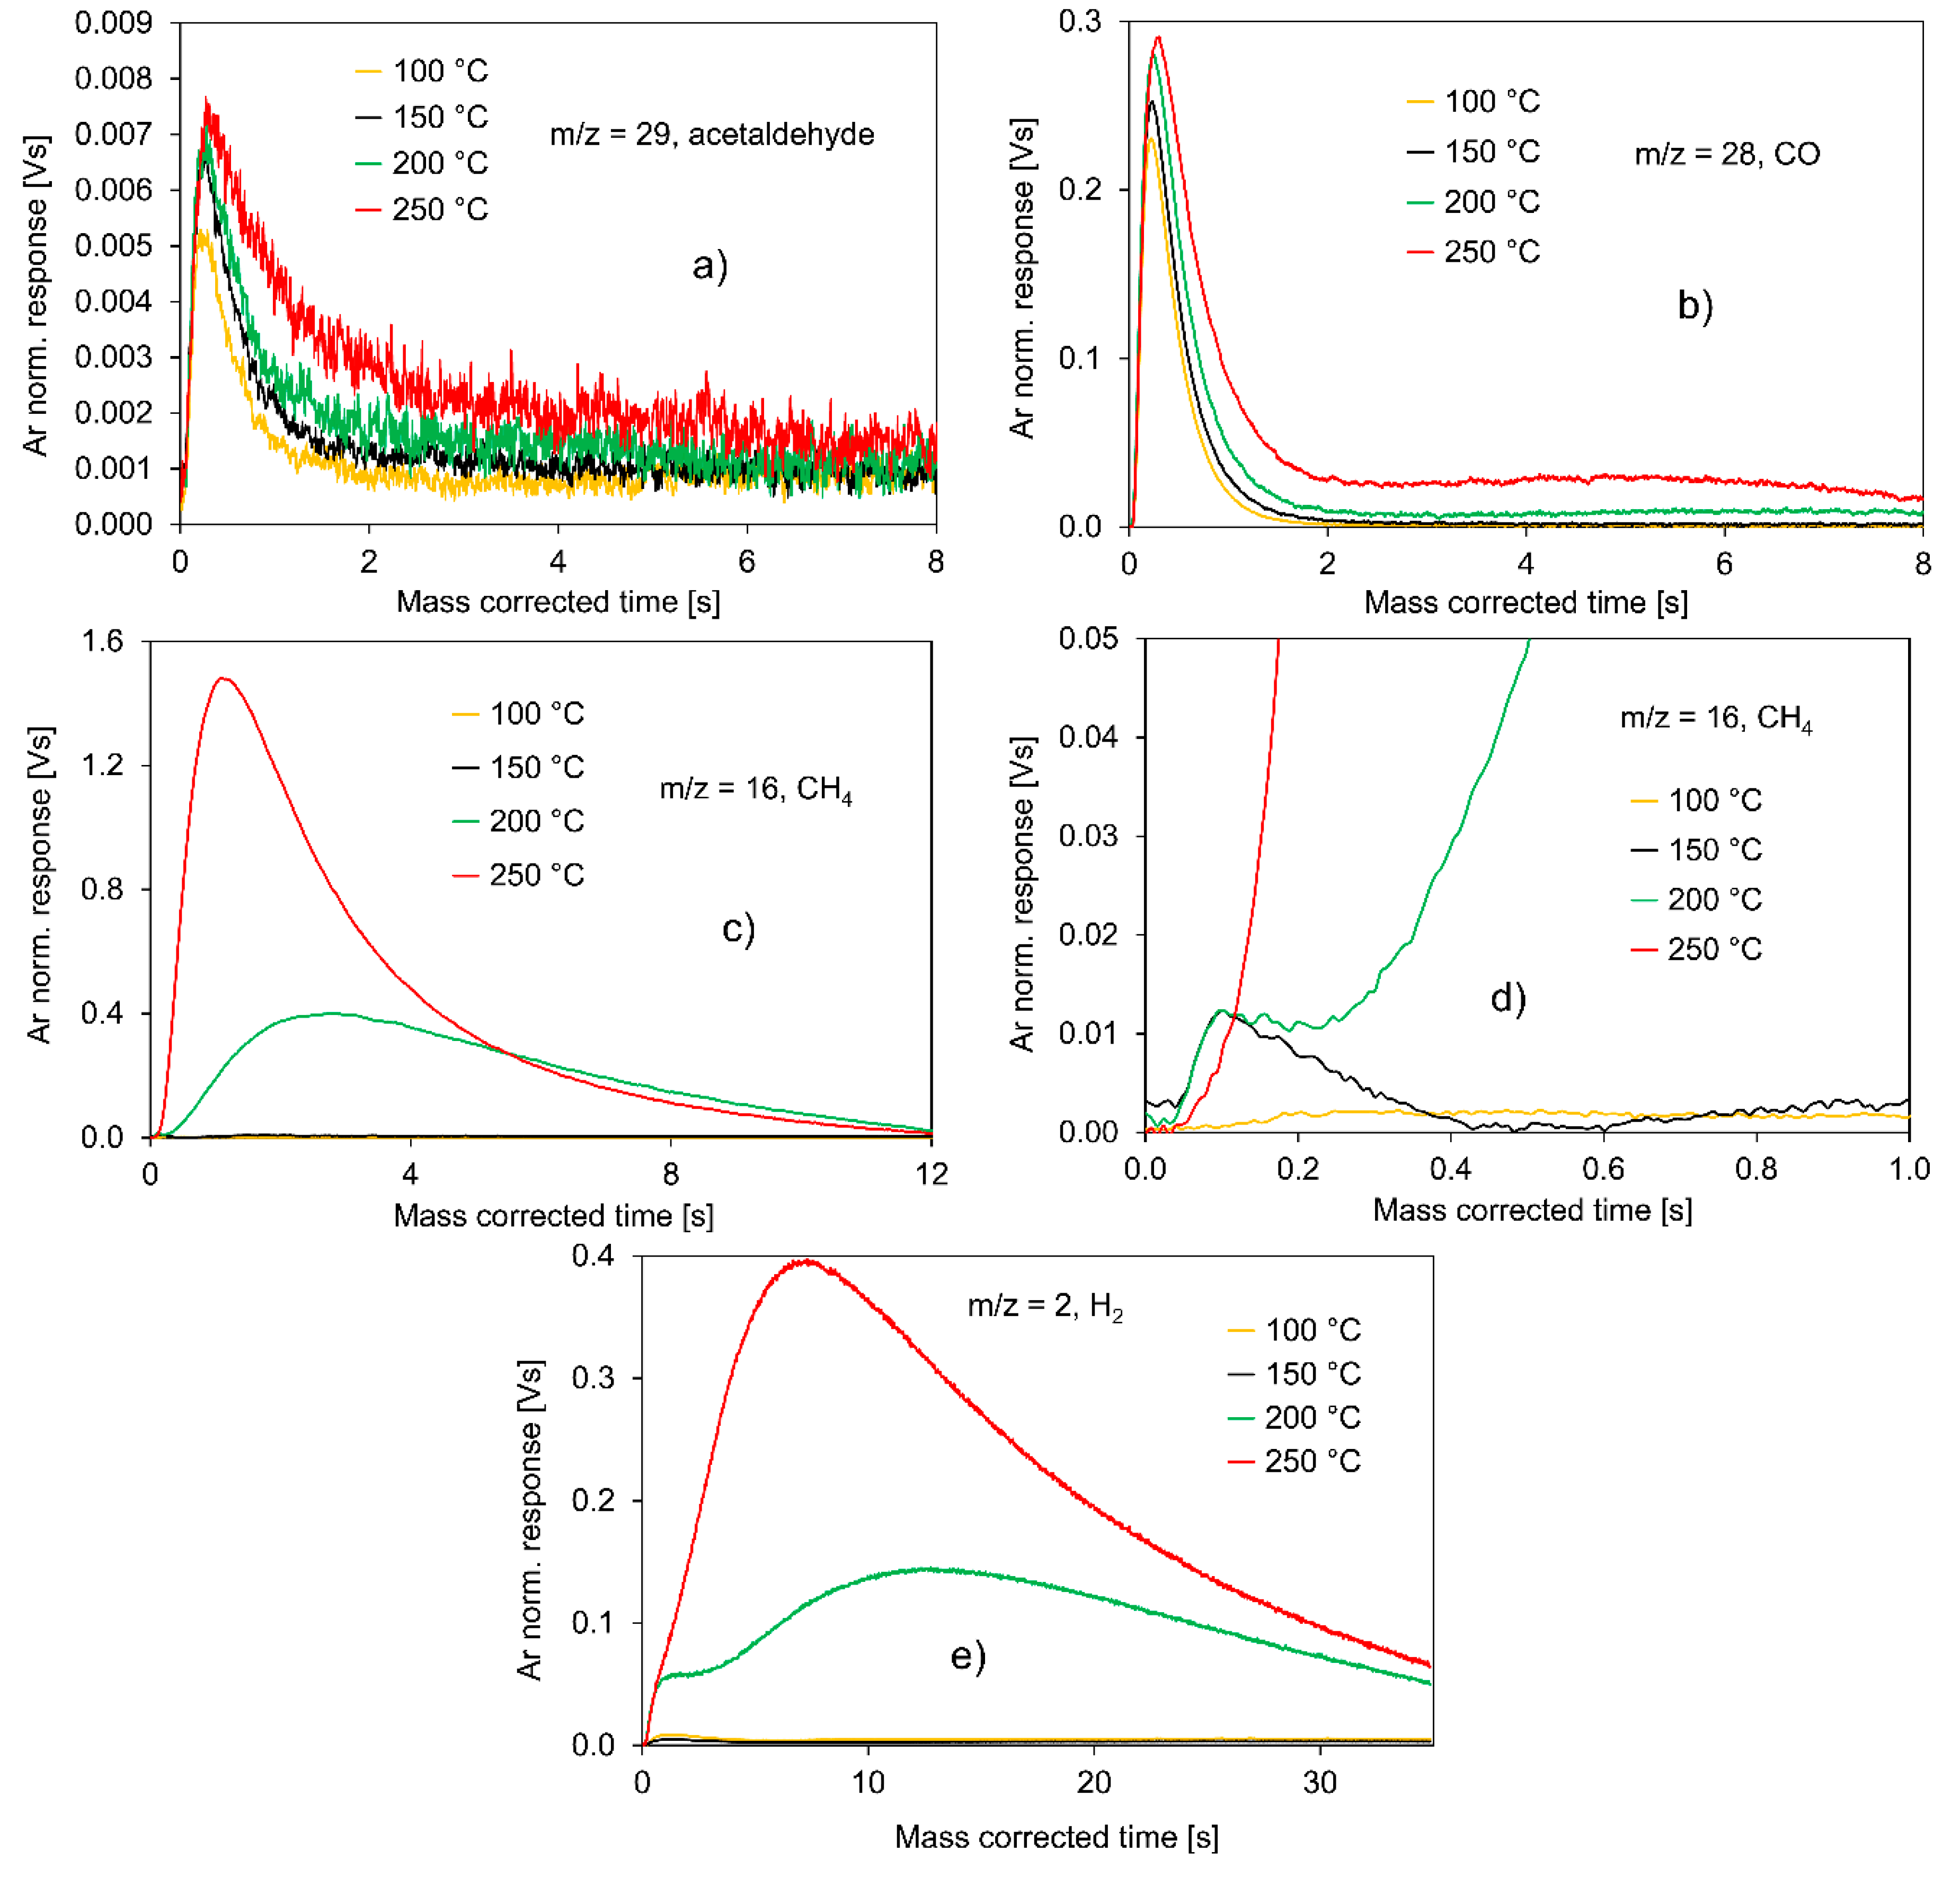
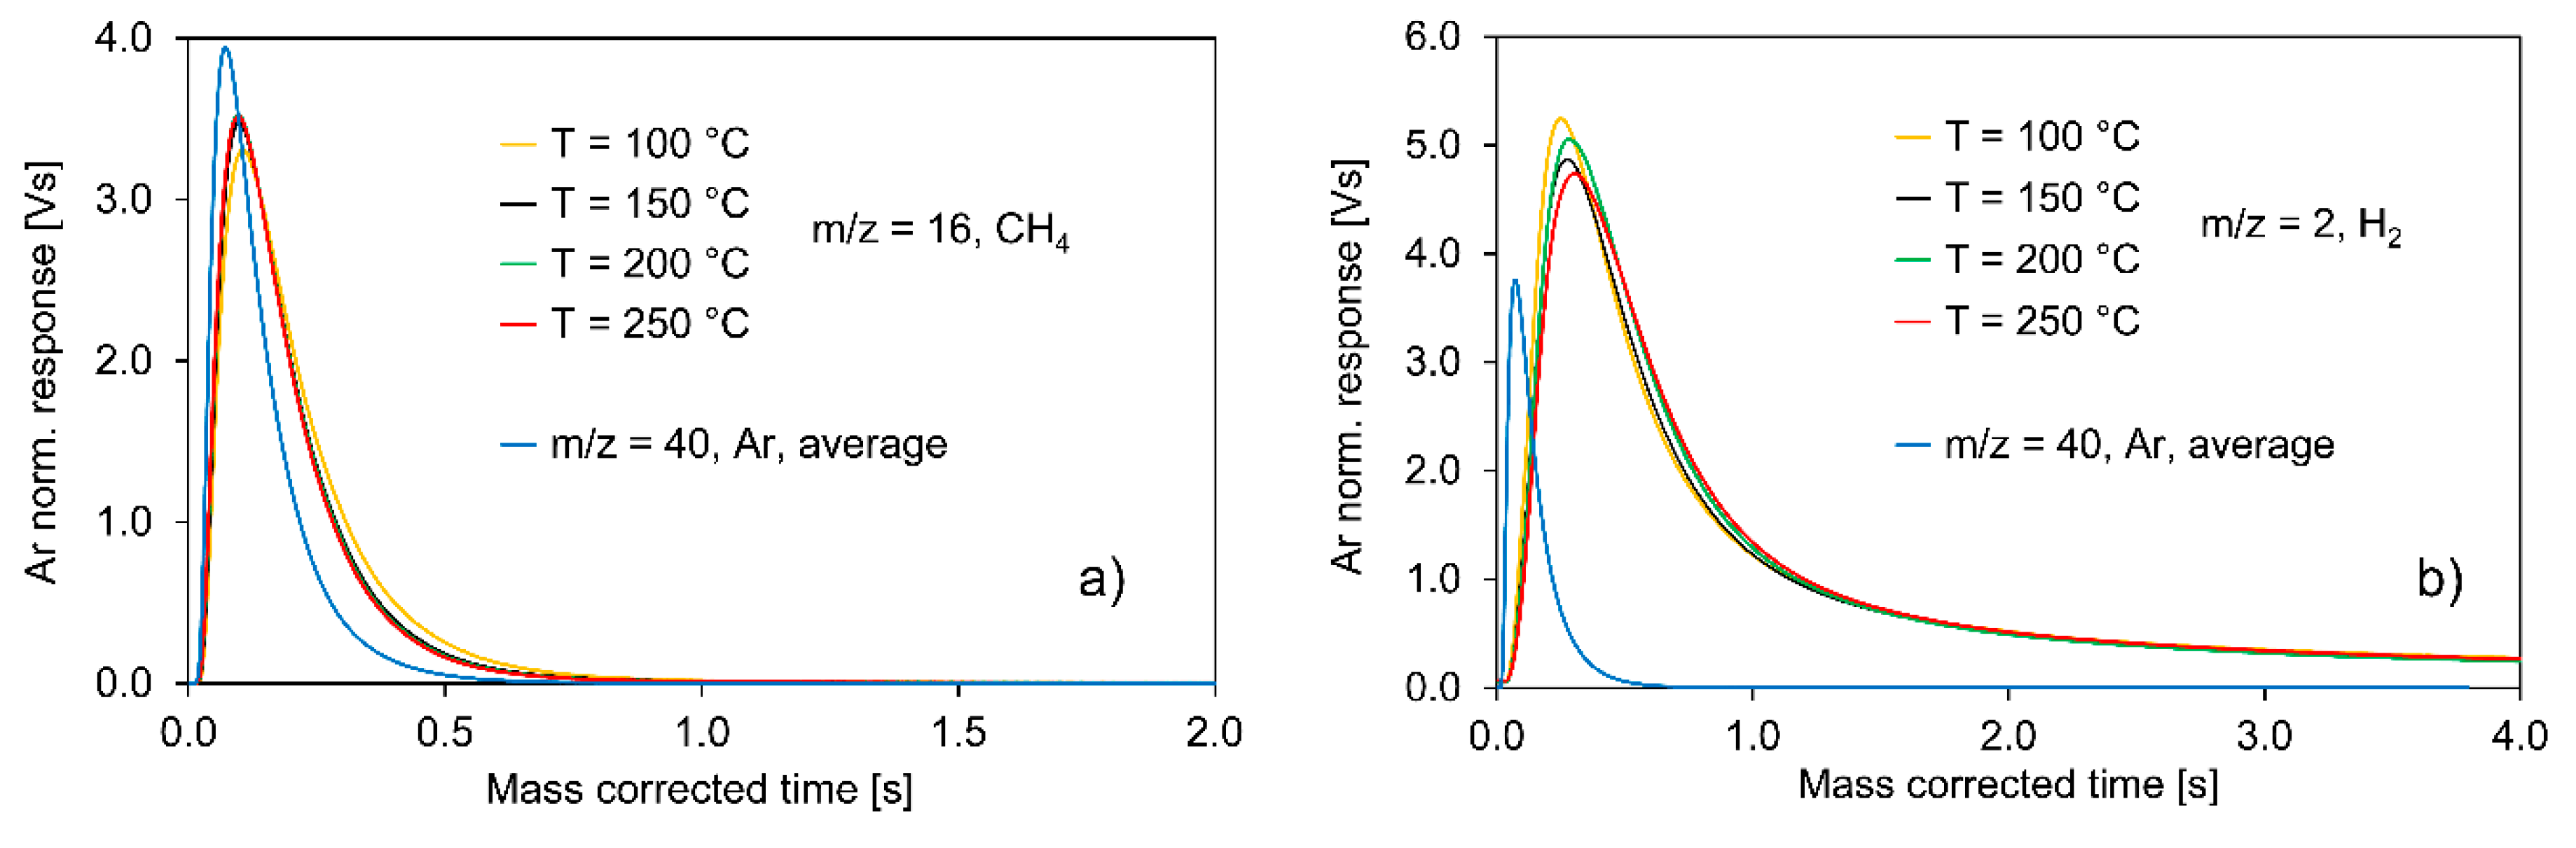
  • The slow CH4 and H2 evolution curves;
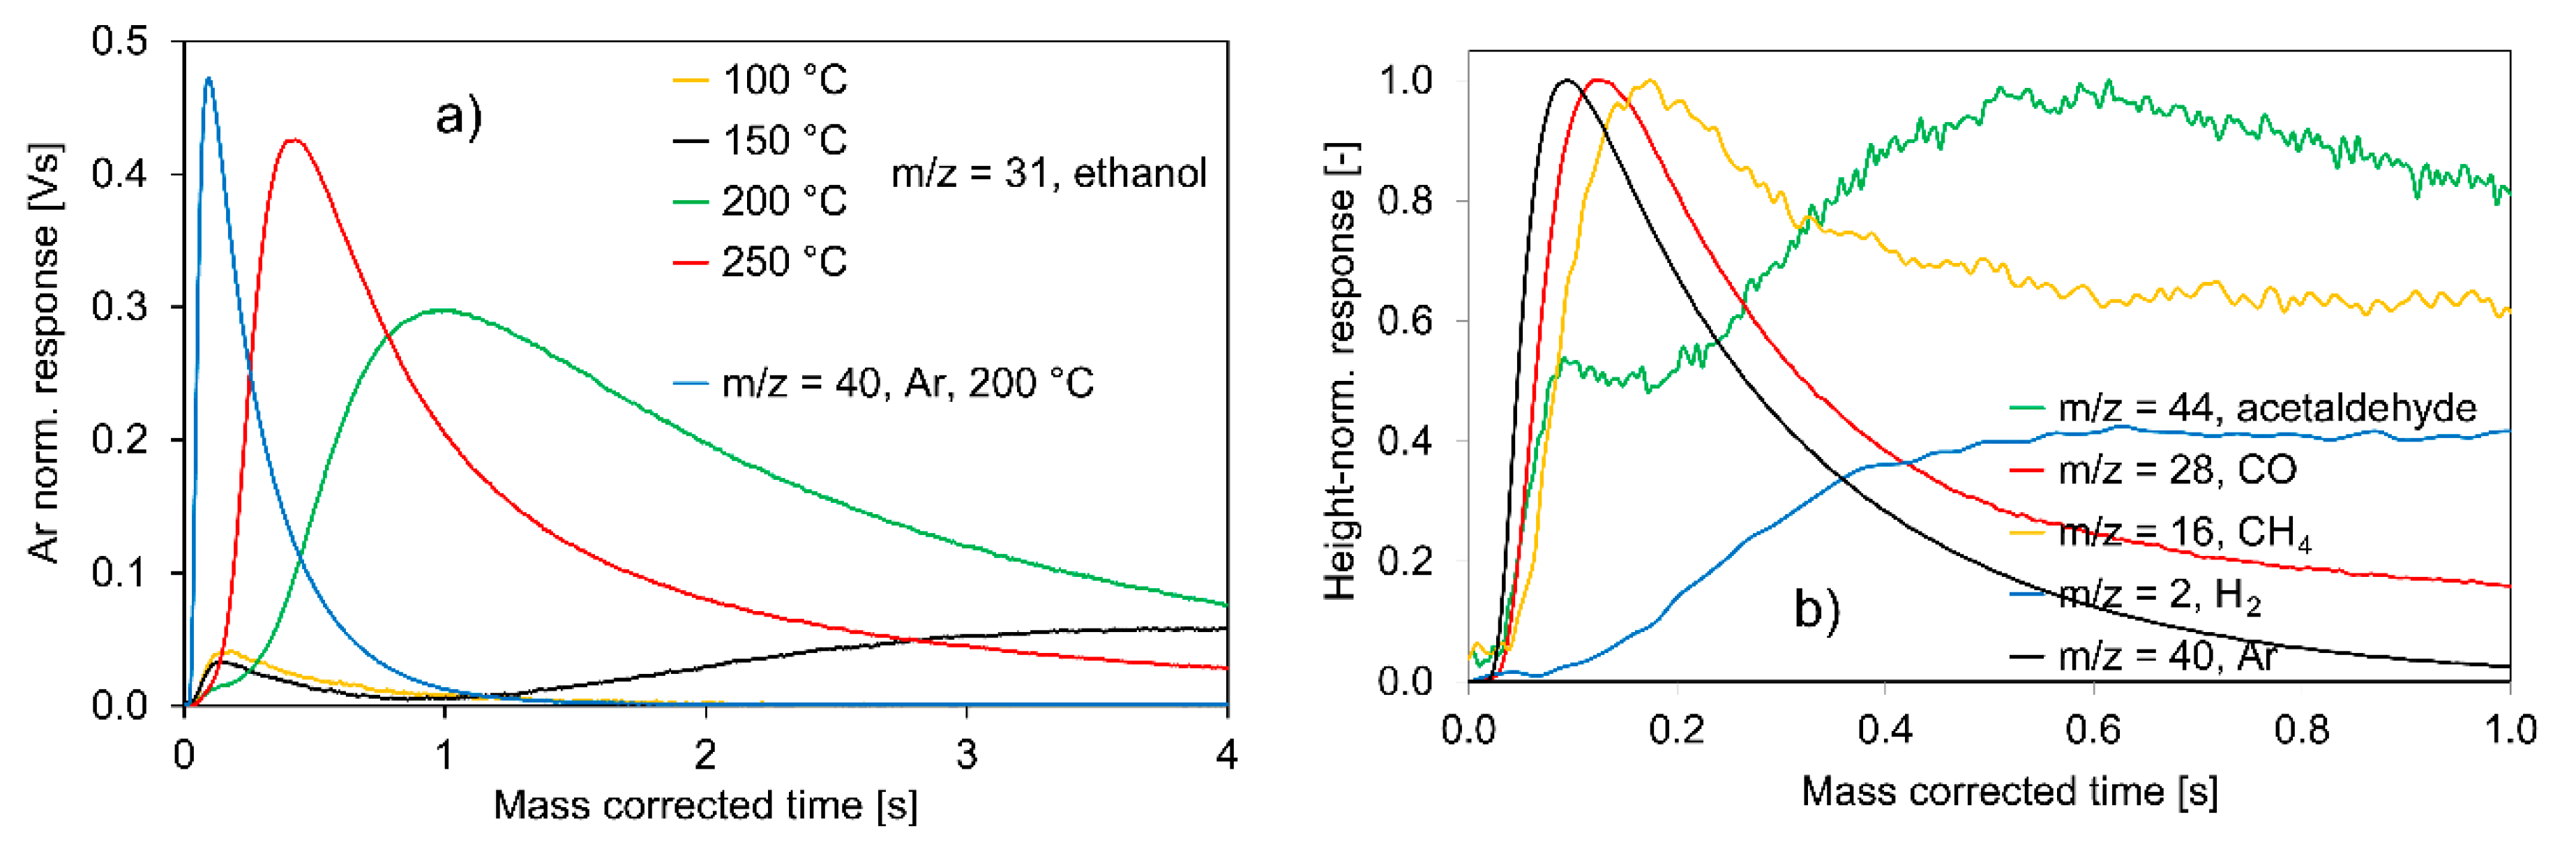
  • The relatively fast evolution of CO and acetaldehyde on a comparable time scale;
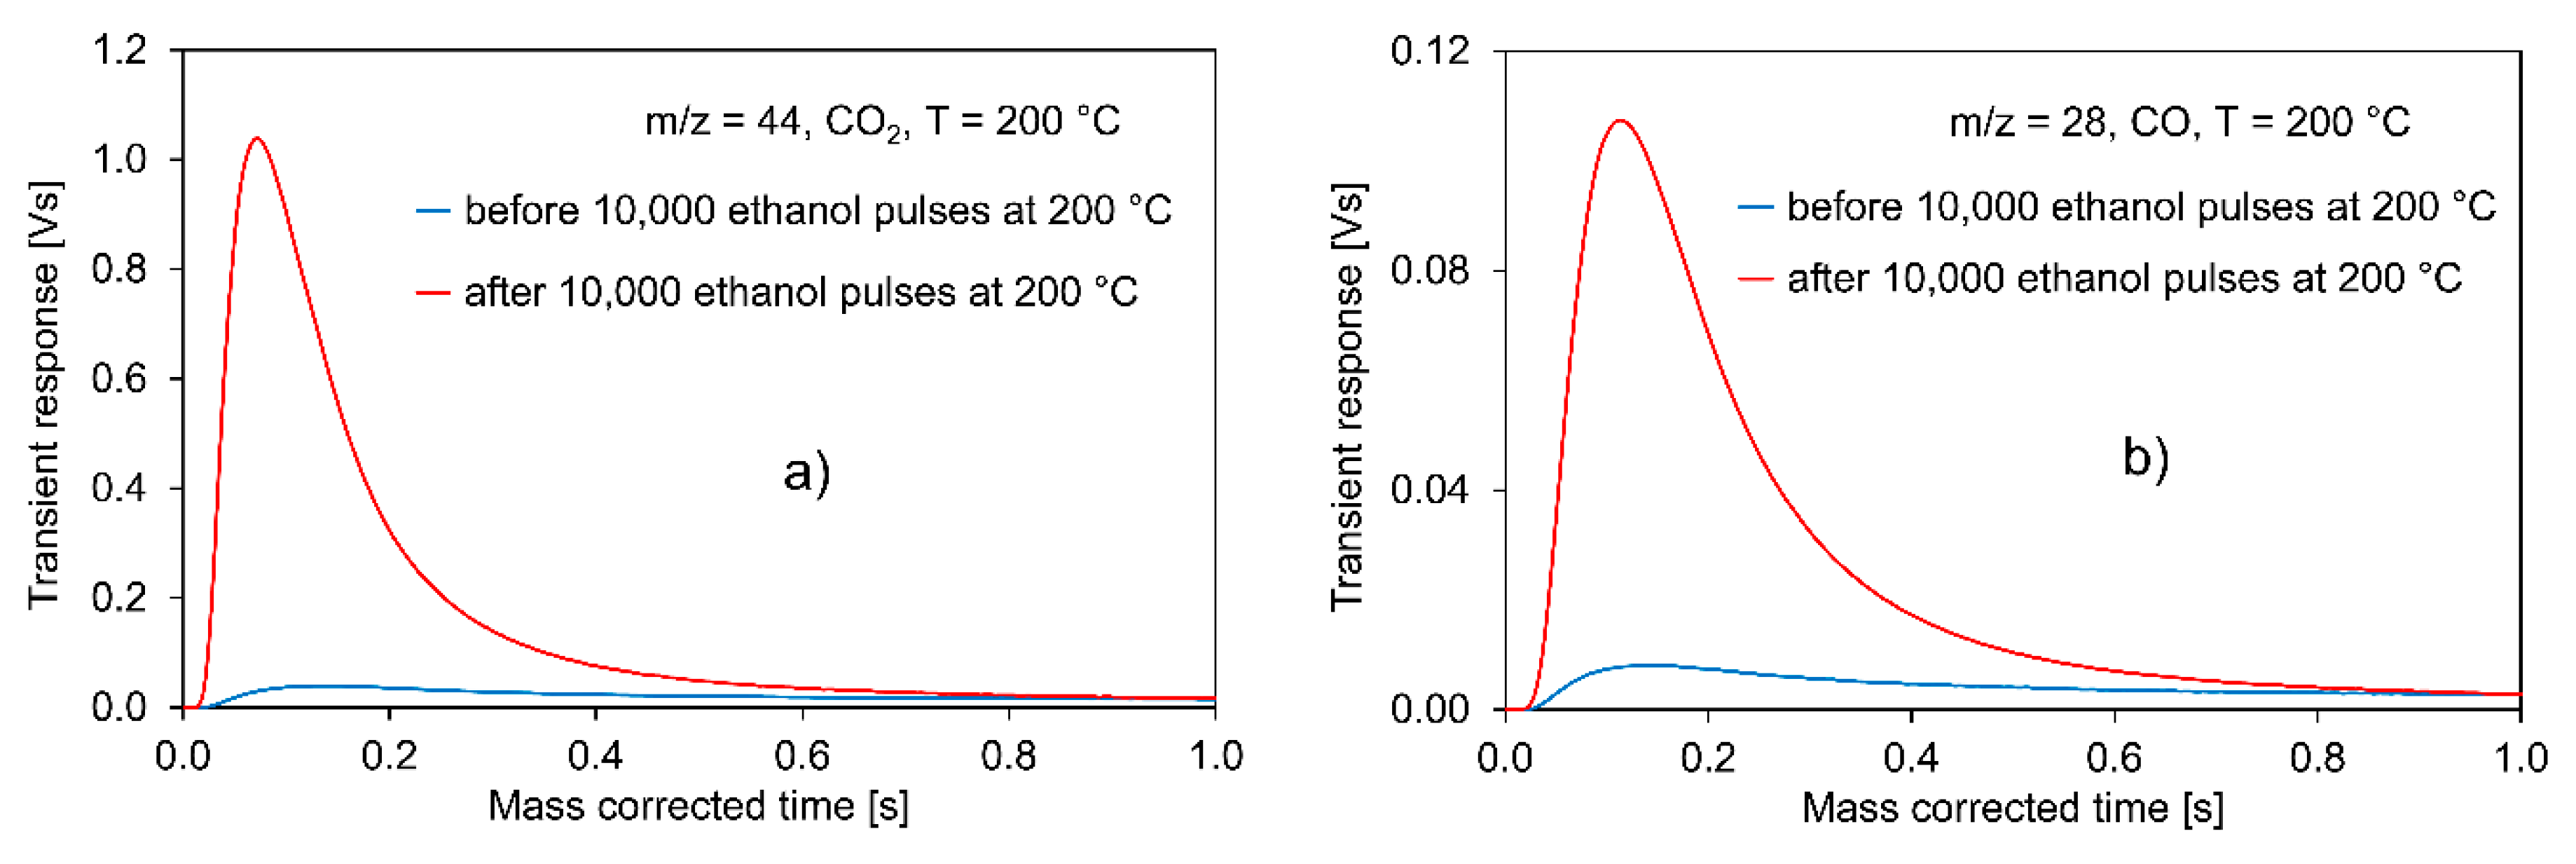
  • The strongly increased formation of CO2 and CO due to carbon burn-off on the catalyst surface after the 10,000 pulses of ethanol;
  • The transient responses from single CH4/H2 pulsing over the Pt/C sample.
Other reaction products, such as acetic acid (m/z = 60), butanol isomers (m/z = 56), diethyl ether (m/z = 59) and ethyl acetate (m/z = 70) or CO2 (m/z = 44) are not detected in the outlet flow of the micro-reactor under the TAP reaction conditions. The formation of acetic acid on a CuCr catalyst, starting from ethanol dehydrogenation, is mechanistically described by Xiang et al. [61], though under oxidative reaction conditions in the presence of O2. It was concluded from Figure 4a that acetaldehyde decomposition, yielding CO, C*, CH3* and H* adsorbates as per Equation (6), is very fast so that a condensation reaction of two acetaldehyde molecules possibly yielding acetic acid, butanol isomers or ethyl acetate is not likely to proceed under these reaction conditions. It is known from the literature [62] that strongly acidic catalysts like H-ZSM-5 must be applied for the dehydration of ethanol to form ethene and diethyl ether. The above-described trends and phenomena at 200 °C for the transient responses of the different components of the ethanol dehydrogenation/acetaldehyde decomposition reaction network are qualitatively highly comparable to those at the other investigated reaction temperatures of 100 °C, 150 °C and 250 °C, and so these will not be presented here.
In the following, the Ar-normalized transient responses to pulses of ethanol in Ar will be depicted and discussed in relation to the four reaction products of acetaldehyde, CO, CH4 and H2 at different reaction temperatures (100 °C–250 °C) so as to gain a more quantitative picture and verify the reaction scheme from Equations (4) to (8). The Ar-normalization mathematically reflects that the chosen experimental parameters such as the pulse width or the actual pressure of the reaction mixture in the blend tank might influence the height and shape of the respective transient responses.
Figure 7a shows that acetaldehyde desorbs from the catalyst surface at very low intensities, which slightly increase with rising reaction temperature (increasing the transient response height and zeroth moments of the pulses). The rising sections of all four response pulses coincide at short residence times but their tailing becomes significantly broader with increasing temperature. This indicates an increased interaction of the acetaldehyde molecules with the catalyst at higher reaction temperatures. In general, it can be concluded from the very low intensities at all temperatures that acetaldehyde is a short-lived intermediate of the reaction network, and only very few molecules traverse through the catalyst bed without reaction. In Figure 7b, a comparable dependency of the transient response height (and the zeroth moments of the pulses) on the reaction temperature can be observed for CO. It is the lowest at 100 °C and continuously increases when the temperature rises to 250 °C. Again, the four transient responses coincide in their rising sections and the tailings become broader at higher temperatures, especially at 250 °C. Higher temperatures favor the desorption of CO from the catalyst surface, which runs a more complex course at 250 °C than at 100 °C. However, the intensities of the CO response pulses are much higher than those of acetaldehyde. CO is not short-lived and intermediate but a final product of acetaldehyde decomposition (cf. Equation (6)).
Significantly, different pictures with respect to the shapes of the transient responses and their temperature dependencies emerge for CH4 in Figure 7c and H2 in Figure 7e. In the case of CH4, at 100 °C the intensity is approximately zero, as can be seen in the magnification in Figure 7d; only very few CH4 molecules desorb from the catalyst surface. The magnification also illustrates that at 150 °C, a slightly increased intensity of the CH4 transient response is detected which is, however, much lower than that of the CO response pulse at 150 °C. In this respect, Figure 8a,b indicate that CH4 and H2 desorb at large quantities from the surface of Pt/C, when only CH4 (50 vol %) in Ar and H2 (50 vol %) in Ar, respectively, are pulsed. In both cases, the fraction of moles desorbing from Pt/C is independent of the temperature and amounts to approximately 65% to 68% for H2 and 100% for CH4. On carbon black, the corresponding set of experiments with mixtures of CH4 and H2, respectively, in Ar (not shown in the figures) indicates that the fraction for H2 slightly increases with rising temperatures, from approximately 80% at 100 °C to 95% at 250 °C, while in the case of CH4, it is 100%.
Thus, the low intensities of the CH4 evolution curves at 100 °C and 150 °C in Figure 7d cannot be explained by the very strong adsorption of CH4 on the catalyst surface. Instead, they are due to the fact that Equation (7), i.e., the recombination of CH3* and H* being formed in the acetaldehyde decomposition, is kinetically hindered at lower reaction temperatures between 100 °C and 150 °C.
There is a very small peak at the beginning of the CH4 response in Figure 7d, which is consistent with the fast production of CH4. A small fraction of CH4 rapidly leaves the micro-reactor, which might have been formed in reaction steps other than those proposed in Equations (4)–(8). The same very small signal is also observed in the rising part of the CH4 transient response at 200 °C. However, CH4 desorption from the catalyst surface in Figure 7c is much more pronounced, with a very broad tailing at 200 °C, and becomes even stronger and broader at 250 °C. It can be concluded that at higher reaction temperatures, the activation barrier for the irreversible step of CH3* and H* recombination can be much more readily surmounted. In addition, CH3* and H* adsorbates, having also been previously formed on the catalyst surface at 100 °C and 150 °C, can now recombine and desorb, leading to these large amounts of CH4, especially at 250 °C. The transient responses for H2 in the temperature range from 100 °C to 250 °C in Figure 7e show very similar trends compared to those of CH4. At 100 °C and 150 °C, the amounts of H2 molecules desorbing from the catalyst surface are very low. As in the case of CH4, H2 desorption strongly increases with rising temperatures at 200 °C, and especially, at 250 °C. Analogous to the case of CH4, here the recombination of H* species (Equation (8)) is strongly favored by higher reaction temperatures and is therefore responsible for the immense desorption of H2 from the catalyst surface at 200 °C and 250 °C.

2.2.2. Experiments with Ir/C

This subsection describes and discusses the results that were obtained when a mixture of 34.6 vol % ethanol in Ar was pulsed over an H2 pre-reduced Ir/C catalyst in the temperature range between 100–250 °C. Ir/C was chosen for the experimental evaluation, as it was also very active for the synthesis of iso-butanol according to the reaction scheme from Figure 1 in recent investigations by Häusler et al. [12]. Liang et al. [63] used Ir for their AuPtIr core-shell catalyst and state that Ir enhances ethanol dehydrogenation. Li et al. [64] modeled a catalyst ensemble for ethanol dehydrogenation. This ensemble is based on a triatomic inert substrate consisting of, e.g., Au, Ag and Cu, onto which a strong-binding metal such as Ir is doped to activate the C–H and O–H bonds in ethanol. The function of the triatomic substrate is to enable the fast desorption of H2 and to suppress coke formation. Sheng et al. [65] investigated Pt doped with Ir, Ru, Rh, Pd and Os as the catalyst for ethanol electro-oxidation and found a promoting effect of Ir with respect to the β-dehydrogenation of ethanol.
In this respect, Figure 9a shows that, in contrast to the experiments with the Pt/C catalyst, ethanol is not completely consumed in the investigated temperature range between 100–250 °C, but measurable amounts desorb from the Ir/C catalyst surface. These amounts increase with increasing reaction temperatures and are the highest by far at 250 °C. A quantitative analysis reveals that ethanol conversion is close to 100% at 100–150 °C and decreases to the range of approximately 90% at 250 °C. Thus, the Ir/C catalyst is also highly active for the ethanol dehydrogenation reaction. Boualouche et al. [66] report based on DFT calculations that for their CuIr alloy, scission of the O–H bond is the activation step during ethanol dehydrogenation. It is common to all four ethanol transient responses in Figure 9a that, at the beginning, there is a peak with low intensity being almost as narrow as the Ar response pulse, which indicates that a few ethanol molecules are able to move very quickly through the Ir/C catalyst zone without adsorption or reaction. However, at 100 °C and 150 °C, for the majority of the ethanol molecules, the consumption process is irreversible, as in the case of the Pt/C catalyst. At 200 °C and 250 °C, in contrast, very slow desorption of ethanol molecules from the catalyst surface also occurs, yielding very broad response pulses for ethanol. Considering these findings for the reaction scheme derived above for the Pt/C catalyst, it can be concluded that in the case of the Ir/C catalyst, step (4), i.e., the adsorption and dissociation of ethanol, is not fully irreversible. To further illuminate the residence time distribution of the products of ethanol dehydrogenation on Ir/C, Figure 9b shows the height-normalized transient responses from the same set of experiments with the Ir/C sample at m/z-values of 2 for H2, 16 for CH4, 28 for CO, 44 for acetaldehyde and 40 for Ar at a reaction temperature of 200 °C. This time, an m/z-value of 44 was chosen for acetaldehyde, as it was only slightly affected by the respective ethanol fragment (in contrast to 29), and so qualitative conclusions can be drawn from the shape and residence time of the response pulse. For the sake of clarity, the transient response of ethanol was not included in this figure. On the one hand, there are many parallels to the findings obtained with the Pt/C catalyst from Figure 4a):
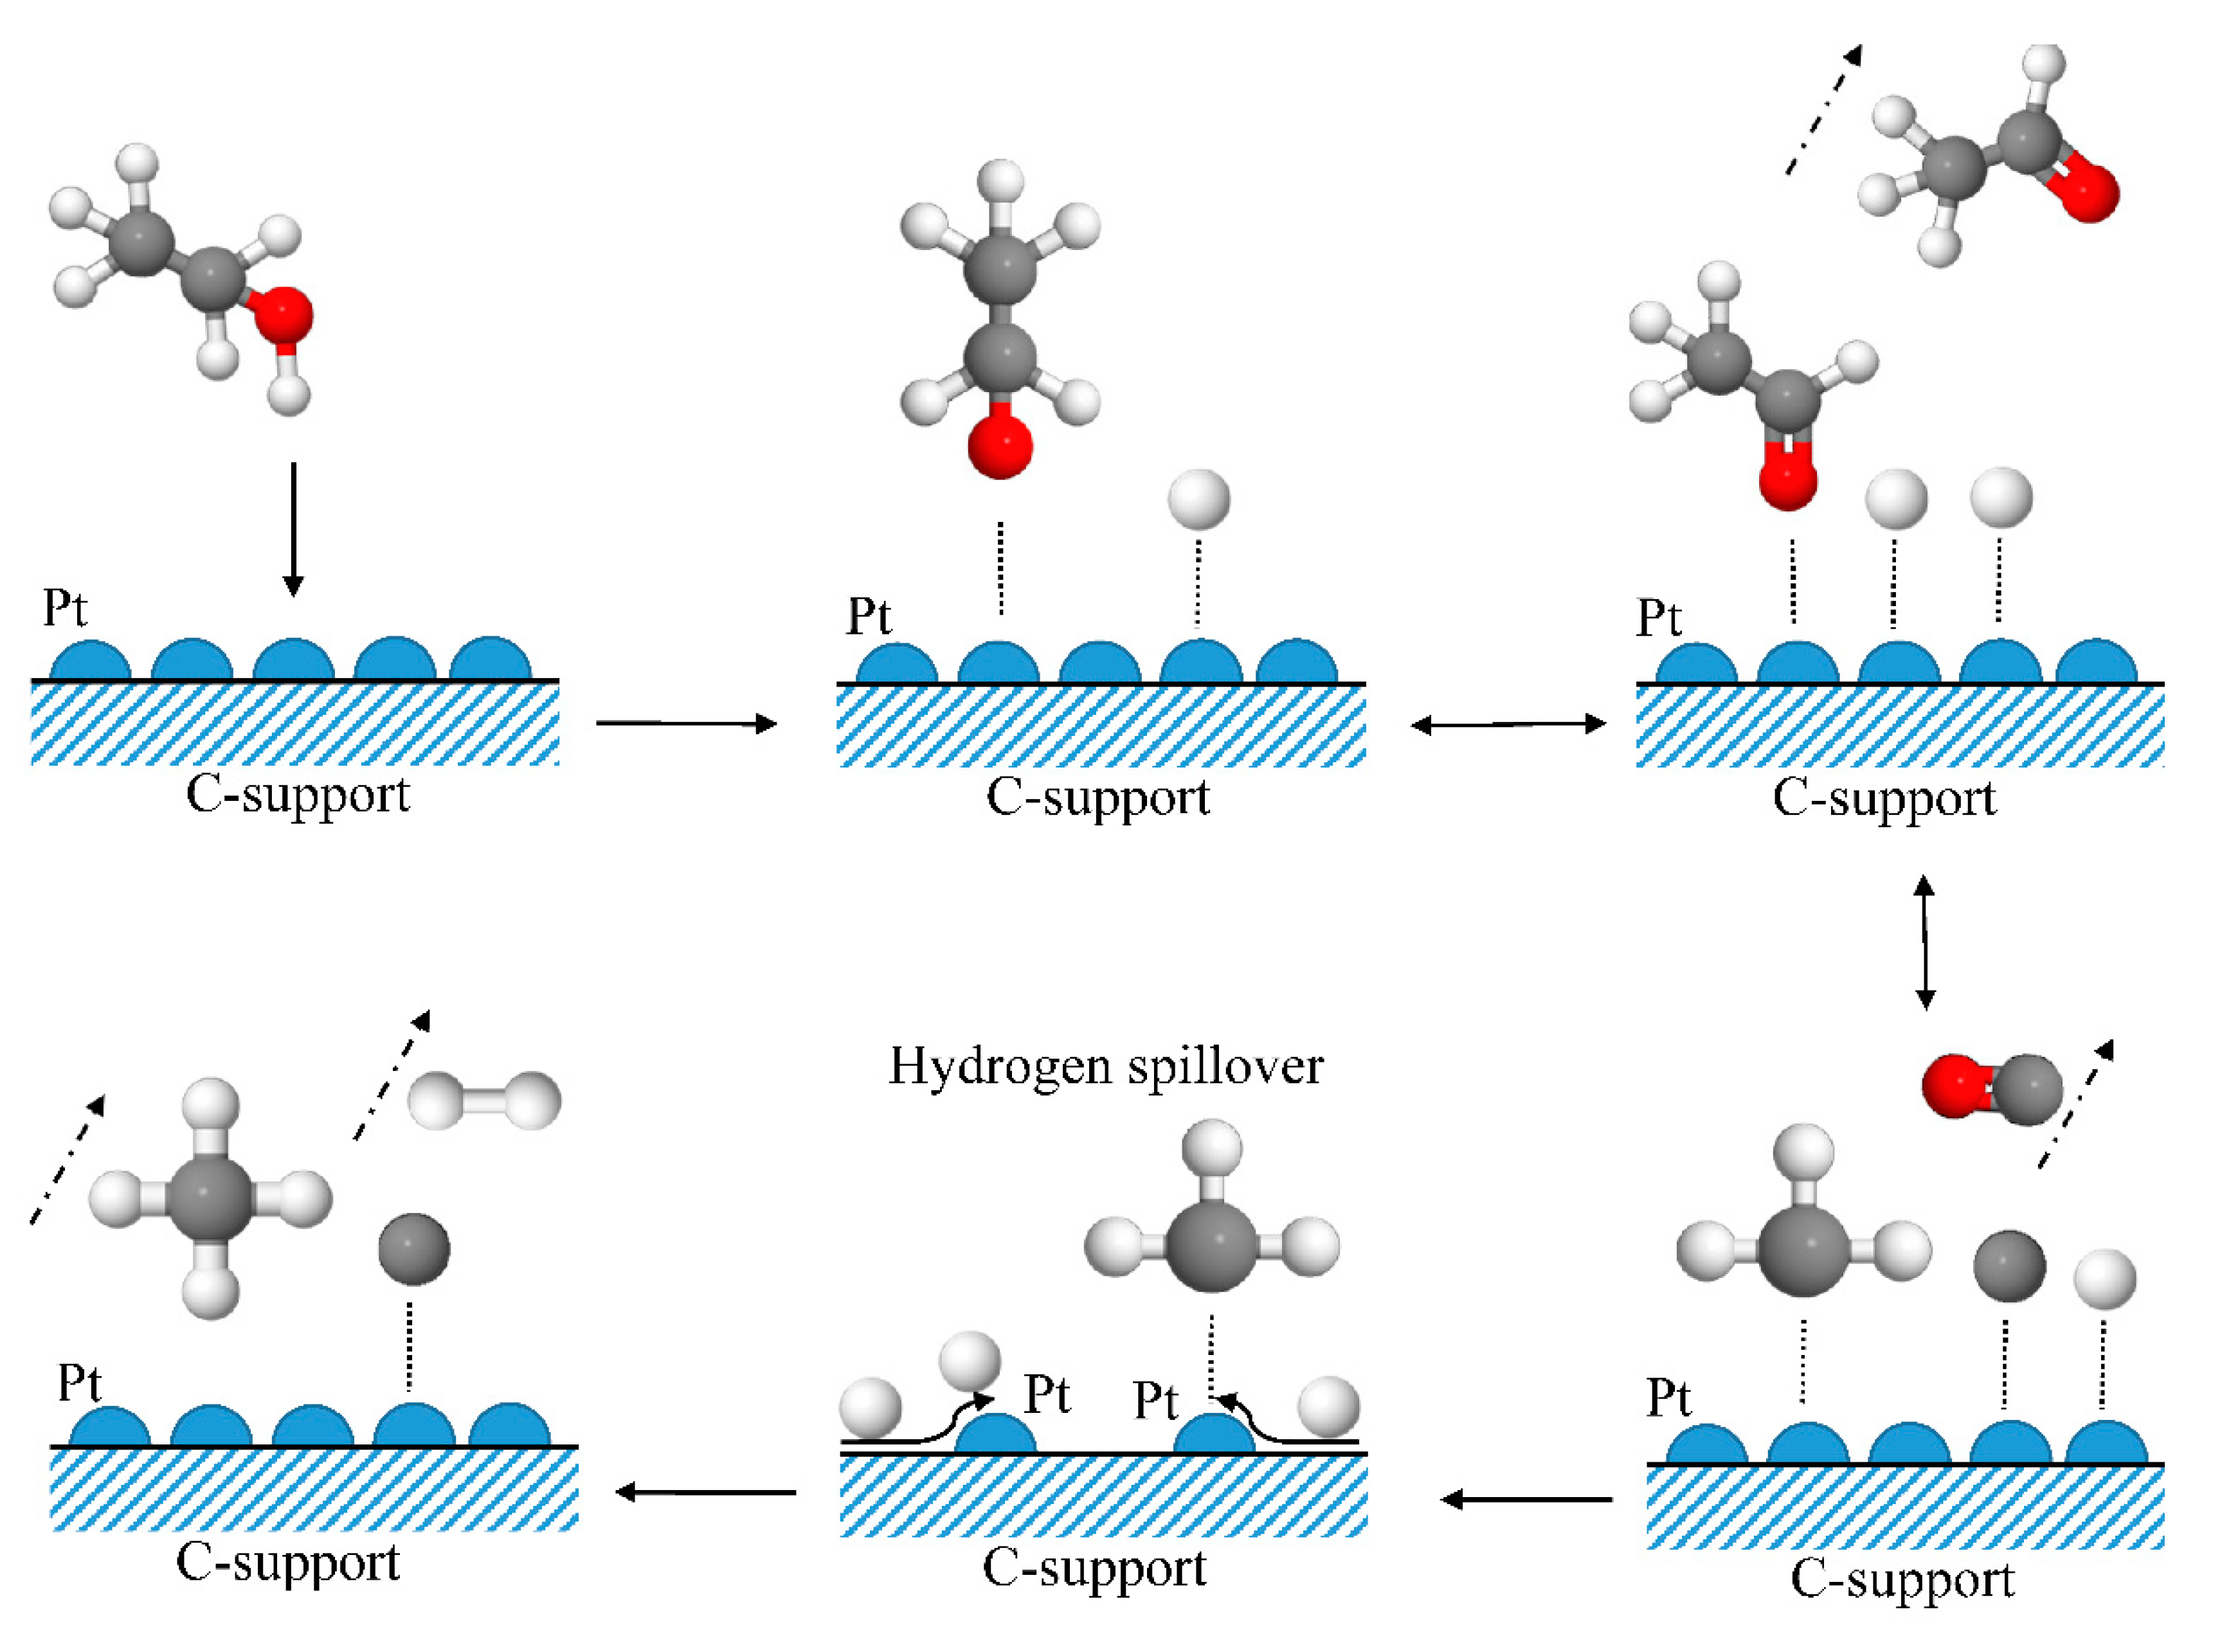
  • H2 and acetaldehyde as products of ethanol dehydrogenation are formed, together with CO and CH4 from acetaldehyde decomposition. Zhang et al. [67] and Cai et al. [68] investigated steam reforming of ethanol using an Ir/CeO2 catalyst. They first observed ethanol dehydrogenation to acetaldehyde followed by decomposition of acetaldehyde to CH4 and CO. These findings are in good agreement with those presented here.
  • Other reaction products, such as acetic acid (m/z = 60), butanol isomers (m/z = 56), diethyl ether (m/z = 59) or ethyl acetate (m/z = 70), are not detected. Boualouche et al. [66], however, found CuIr alloys being active for the formation of ethyl acetate.
  • The evolution curve of CO and that of acetaldehyde at lower residence times are very narrow and only slightly broader than that of Ar, representing the diffusion-only case.
  • The transient responses of CO and acetaldehyde coincide in their rising sections at lower residence times. This again means that they desorb on a comparable time scale from the catalyst surface within this time-span and confirms reaction step (6) for the Ir/C catalyst, i.e., the fast CO formation from acetaldehyde.
  • The response pulses of H2 and those of CH4 at higher residence times are very broad, again raising the question of whether the recombination steps of long-lived CH3* and H* adsorbates, as per Equations (7) and (8), are responsible or reversible adsorption and spillover processes.
However, on the other hand, there are also some differences in the results from the experiment with the Pt/C catalyst in Figure 4a):
  • The acetaldehyde response pulse is much broader at longer residence times, indicating that reaction step (5), i.e., the decomposition of the ethoxy adsorbate into rapidly desorbing acetaldehyde and H* species, should be extended by the formation of a long-lived CH3CHO* adsorbate.
  • The evolution curve for CH4 reveals a fairly narrow section at shorter residence times. On Ir/C, the decomposition of acetaldehyde, according to reaction step (6), directly yields a small fraction of rapidly desorbing CH4 molecules.

2.2.3. Experiments with Cu/C

The last set of TAP experiments concerning ethanol dehydrogenation presented in this paper deals with the catalytic behavior of a Cu/C catalyst. Based on literature findings that Cu catalysts are distinguished by high selectivities towards acetaldehyde [16,18,20,22,24,26], it was assumed that using Cu might lead to a divergent reaction scheme. In this respect, Figure 10a presents the Ar-normalized transient responses to pulses of ethanol in Ar at temperatures between 100 °C and 250 °C on the Cu/C catalyst at an m/z-value of 31, representing ethanol. As in the case of the Ir/C sample and in contrast to the Pt/C catalyst, ethanol is not fully consumed within the entire temperature range. The quantities of ethanol molecules desorbing from the catalyst surface are very low, at 100 °C and 150 °C, which means that, at these temperatures, the majority of the ethanol molecules are consumed by the catalyst surface and only a few can very quickly traverse the catalyst bed. At 200 °C and 250 °C, however, very slow desorption of much larger quantities of ethanol occurs, which results in very broad response pulses. A quantitative calculation shows that ethanol conversion is close to 100% at 100–150 °C and decreases to the range of approximately 85–90% at 200 °C and 250 °C, respectively. Thus, the Cu/C catalyst is still highly active for ethanol adsorption and possible further reactions, but slightly less suitable than Ir/C, and especially, Pt/C. Therefore, it can be concluded that also on the Cu/C catalyst, step (4) of the reaction scheme, i.e., the adsorption and dissociation of ethanol, is again not fully irreversible. To gain a better understanding of the way in which ethanol dehydrogenation proceeds on the Cu/C sample, Figure 10b depicts the height-normalized transient responses at m/z-values of 2 for H2, 16 for CH4, 28 for CO, 44 for acetaldehyde and 40 for Ar at a reaction temperature of 200 °C. The figure shows a very similar residence time distribution, as in the case of the Ir/C sample. The only apparent difference is that the transient response for acetaldehyde has a much shorter narrow section, where it again coincides with the evolution curve of CO and a longer broad tailing. This indicates that the formation of a long-lived CH3CHO* adsorbate plays a more important role on the Cu/C catalyst than it does on the other two samples, Pt/C and Ir/C. Reaction products, such as acetic acid (m/z = 60), butanol isomers (m/z = 56), diethyl ether (m/z = 59) or ethyl acetate (m/z = 70), are not detected with the Cu/C catalyst. The decomposition of acetaldehyde to form CO, H2 and CH4 shown in Figure 10b, is in contrast to the experimental results of many papers in the literature working with Cu catalysts, which report on high selectivities towards acetaldehyde of in parts 100% [17,19,21,23,25]. This discrepancy might be due to the ultra-high vacuum reaction conditions of the TAP experiments in this work.
In Table 2, the data from Table 1 is expanded to include the above-mentioned calculated ethanol conversions of the different C-supported catalysts at 200 °C. It becomes obvious that there is no correlation between the specific surface areas and the ethanol conversions. The same holds true for the pore size distributions from Figure 2.
Figure 11 graphically summarizes the experimental results from the TAP experiments described in this section. Please note that, for the sake of simplicity, the representation of the molecules is only a simple approximation of the chemical reality. The same holds true for the way the adsorption of the species on Pt is depicted. The TAP experiments cannot shed light on this point.

3. Materials and Methods

3.1. Catalysts

The 5 wt % Pt/C, 1 wt % Ir/C and 3 wt % Cu/C catalysts were purchased from Alfa Aesar (Karlsruhe, Germany), while Cabot Corporation (Boston, USA) supplied the carbon black sample (Vulcan XC 72).

3.2. N2 Sorption

The specific surface areas of the different catalysts from Table 1 were determined by the adsorption of N2 at a temperature of −196 °C (liquid N2). Approximately 0.1–0.4 g of the respective catalysts were filled into a BET cannula and dried under vacuum conditions at 50 °C in the Autosorb iQ (version 5.20.17081) apparatus of the company Quantachrome (Odelzhausen, Germany). The samples were degassed at 150 °C until their masses remained constant. The values for the surface area were then investigated by applying the Brunauer-Emmet-Teller (BET) methodology [69]. The pore size distributions, as depicted in Figure 2, were calculated from the adsorption isotherms in the range of p/ p0 = 0.01–0.95 by means of the Cranston-Inclay method [70].

3.3. Scanning Electron Microscopy

The size and distribution of the catalyst within the support was analyzed by means of Scanning Transmission Electron Microscopy (STEM). The samples were deposited on a Cu C-film grid. High Angle Annular Dark Field (HAADF) imaging, in combination with Energy-Dispersive X-ray (EDX) elemental mapping, were acquired using an aberration corrected FEI Titan G2 80-200 STEM field emission electron microscope at 200 eV and a Super-X EDX system [71].

3.4. Temporal Analysis of Products

The commercial TAP-KPC reactor system (Mithra Technologies, Inc., Foley, USA), which was used for the transient experiments in this paper and also the way the “thin-zone reactor” concept was established, is described in detail in Pasel et al. [72]. For the TAP experiments, the micro-reactor contained 20 mg of the catalysts and the carbon black sample, respectively, with particle sizes between 200 µm and 400 µm. The number of moles of ethanol, acetaldehyde, CO, CH4 and H2 in the respective inlet pulses during the different kinds of experiments was in the range of 1–5 *10−8. All catalysts were reduced at 400 °C prior to the experimental runs by a flow of H2 (2.5 vol % in Ar) at 400 °C for approximately 2 h. For these reductive experiments, the so-called “flow-mode” of the TAP system was used, which operates at atmospheric pressure, in contrast to the transient pulse experiments running at ultra-high vacuum conditions. The carbon black sample was reduced in a flow of pure H2 at 400 °C.
Whenever ethanol was pulsed over the surfaces of the different catalysts, its inlet concentration was approximately 34.6 vol % in Ar. This value was set by injecting liquid ethanol at room temperature into the evacuated blend tank and then pressurizing it to 23 PSI with Ar. Afterwards, the blend tank with the ethanol/Ar mixture was heated from 20 °C to a temperature of 80 °C. According to the Antoine equation and the corresponding constants for ethanol in the suitable temperature range [73], the resulting additional partial pressure of ethanol in the blend tank at 80 °C can be calculated to 15.7 PSI. Reflecting the pressure increase in the blend tank due to its heating from 20 °C to 80 °C, an ethanol concentration of 34.6 vol % arises as a result. The lines from the blend tank to the manifold of the TAP system containing the pulse valves and manifold itself were heated to 110 °C to prevent the ethanol molecules from condensing on the metal parts of the experimental set-up prior to being pulsed into the micro-reactor. For the experiments with ethanol pulsing, the reaction temperature was varied between 100 °C and 250 °C.
In a similar way, the concentration of acetaldehyde in the inlet pulses during the experiments with respect to acetaldehyde adsorption and decomposition on the Pt/C catalyst was set to 38.6 vol %, whereby the temperature of the tank with the acetaldehyde/Ar mixture amounted to 20 °C and that of the lines from the blend tank to the manifold was 80 °C. Additionally, for the acetaldehyde decomposition experiments, the reaction temperature was modified between 100 °C and 250 °C. The experiments for the single adsorption and desorption behavior of the reaction products CO, CH4 and H2 on the different catalysts and on carbon black were run with mixtures of 50 vol % of the respective gases in Ar in the temperature range between 100 °C and 250 °C.
The transient responses displayed in the figures of this paper were recorded using a mass spectrometer (Stanford Research Systems RGA 200) at m/z-values of 2 for H2, 16 for CH4, 28 for CO, 29 and 44 for acetaldehyde, 31 for ethanol and 40 for Ar. These were either height-normalized or Ar-normalized. The way in which these normalizations and mass correction of the recorded time values used at the X-axis in all figures was performed is described in detail in a former publication by Pasel et al. [72]. In addition, possible condensation products of acetaldehyde such as acetic acid (m/z = 60), butanol isomers (m/z = 56), diethyl ether (m/z = 59) or ethyl acetate (m/z = 70) were analyzed. By also investigating the m/z-values of 12 and 25 when necessary, it was ensured that the observed transient responses at an m/z-value of 28 could be definitely ascribed to CO rather than the ethene.

4. Conclusions

The results of the transient TAP experiments with the Pt/C, Ir/C and Cu/C catalysts enable the development of a reaction scheme for ethanol dehydrogenation on these samples. They prove that in each case, ethanol fully adsorbs (Pt/C) or at least to a large extent (Ir/C and Cu/C) on the catalysts. This slight difference in calculated ethanol conversions (cf. Table 2) correlates with the findings from the STEM investigations that Pt shows the weakest tendency towards particle agglomeration. Thus, all three catalysts are very well-suited to activating the O–H bond in ethanol. Literature data gained on different catalysts allow the assumption that first ethoxy species bound to the catalyst surface might be formed. The TAP experiments presented here offer experimental evidence that these further decompose into acetaldehyde, being a short-lived reaction intermediate that quickly decomposes into CO and some very long-lived CH3* and H* adsorbates on the catalyst surface. These may in turn undergo spillover and then recombine, yielding CH4 and H2. CH4 and H2 formation are strongly favored by higher reaction temperatures of 200–250 °C when the needed activation barrier for the recombination process is surmounted. The experimental finding that carbonaceous deposits are formed on the Pt/C catalyst constitutes a substantial risk of catalyst deactivation by blocking the accessible active catalyst sites. By burning-off these C deposits, catalyst regeneration has been proved to be successful.
From the more general perspective of iso-butanol synthesis, the observed H2 spillover on the Pt/C catalyst can be considered advantageous, as it might improve the catalyst’s capability for H2 uptake and release in the course of the hydrogen-borrowing mechanism. In fact, in parallel experiments at Jülich aimed at iso-butanol synthesis in an autoclave reactor at elevated pressures, Pt/C is found to be more promising than Ir/C and Cu/C, respectively. It is apparent from the scheme in Figure 1 that the formation of acetaldehyde and its condensation with formaldehyde is essential for the synthesis of iso-butanol. The TAP experiments reported in this paper, however, enable the conclusion to be drawn that the observed fast decomposition of acetaldehyde on Pt/C, Ir/C and Cu/C will hinder the condensation of acetaldehyde and formaldehyde and thus disrupt the reaction pathway leading to iso-butanol. Nevertheless, at elevated pressures in an autoclave reactor, a substantially different reaction mechanism might prevail on the Pt/C, Ir/C and Cu/C catalysts.

Author Contributions

Conceptualization, J.P. and J.H.; Funding acquisition, J.M. and R.P.; Investigation, J.P., D.S., M.M. and H.V.; Methodology, J.P.; Supervision, J.M. and R.P.; Writing – original draft, J.P., M.M. and H.V.; Writing – review & editing, J.P., J.H., M.M. and H.V. All authors have read and agreed to the published version of the manuscript.

Funding

Parts of this work have been funded by the German Federal Ministry for Economic Affairs and Energy (BMWi), funding number: 19I18006P. Furthermore, H.V. wants to thank the German Federal Ministry of Education and Research, project MEET-HiEnD III – Materials and Components to Meet High Energy Density Batteries with the funding number 03XP0258C. M.M. wants to acknowledge the Verbundvorhaben iNEW: Inkubator Nachhaltige Elektrochemische Wertschöpfungsketten with the funding number 03SF0589A (German Federal Ministry for Economic Affairs and Energy BMWi).

Conflicts of Interest

The authors have no conflicts of interest to declare.

References

  1. Wang, D.; Liu, Z.; Liu, Q. Efficient conversion of ethanol to 1-butanol and C5-C9 alcohols over calcium carbide. RSC Adv. 2019, 9, 18941–18948. [Google Scholar] [CrossRef] [Green Version]
  2. Hui, X.; Niemeyer, K.E.; Brady, K.B.; Sung, C.J. Reduced chemistry for butanol isomers at engine-relevant conditions. Energy Fuels 2017, 31, 867–881. [Google Scholar] [CrossRef] [Green Version]
  3. Quesada, J.; Faba, L.; Díaz, E.; Ordóñez, S. Copper-Basic Sites Synergic Effect on the Ethanol Dehydrogenation and Condensation Reactions. ChemCatChem 2018, 10, 3583–3592. [Google Scholar] [CrossRef]
  4. Tayrabekova, S.; Mäki-Arvela, P.; Peurla, M.; Paturi, P.; Eränen, K.; Ergazieva, G.E.; Aho, A.; Murzin, D.Y.; Dossumov, K. Catalytic dehydrogenation of ethanol into acetaldehyde and isobutanol using mono- and multicomponent copper catalysts. Comptes Rendus Chim. 2018, 21, 194–209. [Google Scholar] [CrossRef]
  5. Ochoa, J.V.; Farci, E.; Cavani, F.; Sinisi, F.; Artiglia, L.; Agnoli, S.; Granozzi, G.; Paganini, M.C.; Malfatti, L. CeOx/TiO2 (Rutile) Nanocomposites for the Low-Temperature Dehydrogenation of Ethanol to Acetaldehyde: A Diffuse Reflectance Infrared Fourier Transform Spectroscopy-Mass Spectrometry Study. ACS Appl. Nano Mater. 2019, 2, 3434–3443. [Google Scholar] [CrossRef]
  6. Zhang, J.; Shi, K.; An, Z.; Zhu, Y.; Shu, X.; Song, H.; Xiang, X.; He, J. Acid-Base Promoted Dehydrogenation Coupling of Ethanol on Supported Ag Particles. Ind. Eng. Chem. Res. 2020, 59, 3342–3350. [Google Scholar] [CrossRef]
  7. Schemme, S.; Breuer, J.L.; Samsun, R.C.; Peters, R.; Stolten, D. Promising catalytic synthesis pathways towards higher alcohols as suitable transport fuels based on H2 and CO2. J. CO2 Util. 2018, 27, 223–237. [Google Scholar] [CrossRef]
  8. Wouters, C.; Lehrheuer, B.; Heuser, B.; Pischinger, S. Ottomischkraftstoffe mit Methanol, Ethanol und Butanol. MTZ—Mot. Z. 2020, 81, 16–23. [Google Scholar] [CrossRef]
  9. Singh, P.; Hui, X.; Sung, C.J. Soot formation in non-premixed counterflow flames of butane and butanol isomers. Combust. Flame 2016, 164, 167–182. [Google Scholar] [CrossRef] [Green Version]
  10. Siddiki, S.M.A.H.; Touchy, A.S.; Jamil, M.A.R.; Toyao, T.; Shimizu, K.-i. C-Methylation of Alcohols, Ketones, and Indoles with Methanol Using Heterogeneous Platinum Catalysts. ACS Catal. 2018, 8, 3091–3103. [Google Scholar] [CrossRef]
  11. Pellow, K.J.; Wingad, R.L.; Wass, D.F. Towards the upgrading of fermentation broths to advanced biofuels: A water tolerant catalyst for the conversion of ethanol to isobutanol. Catal. Sci. Technol. 2017, 7, 5128–5134. [Google Scholar] [CrossRef] [Green Version]
  12. Häusler, J.; Pasel, J.; Woltmann, F.; Peters, R.; Stolten, D. How the D-Band Center Determines the Catalytic Activity in the Synthesis of Carbon Neutral Fuels; EFCATS Summer School: Portoroze, Slovenia, 2020. [Google Scholar]
  13. Ashok, A.; Kumar, A.; Bhosale, R.; Saad, M.A.S.; AlMomani, F.; Tarlochan, F. Study of ethanol dehydrogenation reaction mechanism for hydrogen production on combustion synthesized cobalt catalyst. Int. J. Hydrog. Energy 2017, 42, 23464–23473. [Google Scholar] [CrossRef]
  14. Kim, Y.K.; Ryu, S. Evidences for Different Reaction Sites for Dehydrogenation and Dehydration of Ethanol over Vanadia Supported on Titania. Bull. Korean Chem. Soc. 2019, 40, 489–495. [Google Scholar] [CrossRef]
  15. Krutpijit, C.; Tian, W.; Jongsomjit, B.; Pjontek, D.; Herrera, J.E. Lithium promotion in ethanol oxidative dehydrogenation over Al- modified Ag/Montmorillonite clays. Mol. Catal. 2020, 483, 110717. [Google Scholar] [CrossRef]
  16. Campisano, I.S.P.; Rodella, C.B.; Sousa, Z.S.B.; Henriques, C.A.; da Silva, V.T. Influence of thermal treatment conditions on the characteristics of Cu-based metal oxides derived from hydrotalcite-like compounds and their performance in bio-ethanol dehydrogenation to acetaldehyde. Catal. Today 2018, 306, 111–120. [Google Scholar] [CrossRef]
  17. Garbarino, G.; Riani, P.; García, M.V.; Finocchio, E.; Escribano, V.S.; Busca, G. A study of ethanol dehydrogenation to acetaldehyde over copper/zinc aluminate catalysts. Catal. Today 2019. [Google Scholar] [CrossRef]
  18. Kumar, A.; Ashok, A.; Bhosale, R.R.; al Momani, F. Ethanol dehydrogenation mechanism on cuni catalysts for hydrogen production. Adv. Mater.–TechConnect Briefs 2016, 2016, 4–7. [Google Scholar]
  19. Li, M.Y.; Lu, W.D.; He, L.; Schüth, F.; Lu, A.H. Tailoring the Surface Structure of Silicon Carbide Support for Copper Catalyzed Ethanol Dehydrogenation. ChemCatChem 2019, 11, 481–487. [Google Scholar] [CrossRef]
  20. Ponomareva, E.A.; Krasnikova, I.V.; Egorova, E.V.; Mishakov, I.V.; Vedyagin, A.A. Ethanol dehydrogenation over copper supported on carbon macrofibers. Mendeleev Commun. 2017, 27, 210–212. [Google Scholar] [CrossRef]
  21. Ponomareva, E.A.; Krasnikova, I.V.; Egorova, E.V.; Mishakov, I.V.; Vedyagin, A.A. Dehydrogenation of ethanol over carbon-supported Cu–Co catalysts modified by catalytic chemical vapor deposition. React. Kinet. Mech. Catal. 2017, 122, 399–408. [Google Scholar] [CrossRef]
  22. Ponomareva, E.A.; Shkinev, V.M.; Zaglyadova, S.V.; Krasnikova, I.V.; Egorova, E.V. Copper Catalysts based on carbon–carbon fiburous materials for ethanol dehydrogenation. Russ. J. Appl. Chem. 2016, 89, 598–602. [Google Scholar] [CrossRef]
  23. Ponomareva, Е.A.; Oladapo, T.O.; Egorova, Е.V. Bicomponent Catalysts for Ethanol Dehydrogenation. Russ. J. Gen. Chem. 2017, 87, 3093–3096. [Google Scholar] [CrossRef]
  24. Wang, Q.N.; Shi, L.; Li, W.; Li, W.C.; Si, R.; Schüth, F.; Lu, A.H. Cu supported on thin carbon layer-coated porous SiO2 for efficient ethanol dehydrogenation. Catal. Sci. Technol. 2018, 8, 472–479. [Google Scholar] [CrossRef]
  25. Zhang, P.; Wang, Q.N.; Yang, X.; Wang, D.; Li, W.C.; Zheng, Y.; Chen, M.; Lu, A.H. A Highly Porous Carbon Support Rich in Graphitic-N Stabilizes Copper Nanocatalysts for Efficient Ethanol Dehydrogenation. ChemCatChem 2017, 9, 505–510. [Google Scholar] [CrossRef]
  26. Chuklina, S.G.; Pylinina, A.I.; Podzorova, L.I.; Mikhailina, N.A.; Mikhalenko, I.I. Ethanol dehydrogenation on copper catalysts with ytterbium stabilized tetragonal ZrO2 support. Russ. J. Phys. Chem. A 2016, 90, 2370–2376. [Google Scholar] [CrossRef]
  27. Hanukovich, S.; Dang, A.; Christopher, P. Influence of Metal Oxide Support Acid Sites on Cu-Catalyzed Nonoxidative Dehydrogenation of Ethanol to Acetaldehyde. ACS Catal. 2019, 9, 3537–3550. [Google Scholar] [CrossRef]
  28. De Waele, J.; Galvita, V.V.; Poelman, H.; Detavernier, C.; Thybaut, J.W. Formation and stability of an active PdZn nanoparticle catalyst on a hydrotalcite-based support for ethanol dehydrogenation. Catal. Sci. Technol. 2017, 7, 3715–3727. [Google Scholar] [CrossRef] [Green Version]
  29. Conesa, J.M.; Morales, M.V.; López-Olmos, C.; Rodríguez-Ramos, I.; Guerrero-Ruiz, A. Comparative study of Cu, Ag and Ag-Cu catalysts over graphite in the ethanol dehydrogenation reaction: Catalytic activity, deactivation and regeneration. Appl. Catal. A Gen. 2019, 576, 54–64. [Google Scholar] [CrossRef]
  30. Yu, D.; Dai, W.; Wu, G.; Guan, N.; Li, L. Stabilizing copper species using zeolite for ethanol catalytic dehydrogenation to acetaldehyde. Chin. J. Catal. 2019, 40, 1375–1384. [Google Scholar] [CrossRef]
  31. De Waele, J.; Galvita, V.V.; Poelman, H.; Gabrovska, M.; Nikolova, D.; Damyanova, S.; Thybaut, J.W. Ethanol dehydrogenation over Cu catalysts promoted with Ni: Stability control. Appl. Catal. A Gen. 2020, 591, 117401. [Google Scholar] [CrossRef]
  32. Rosset, M.; Perez-Lopez, O.W. Catalytic properties of Cu–Mg–Al hydrotalcites, their oxides and reduced phases for ethanol dehydrogenation, Reaction Kinetics. Mech. Catal. 2018, 123, 689–705. [Google Scholar]
  33. Rosset, M.; Perez-Lopez, O.W. Cu–Ca–Al catalysts derived from hydrocalumite and their application to ethanol dehydrogenation, Reaction Kinetics. Mech. Catal. 2019, 126, 497–511. [Google Scholar]
  34. Ohira, M.; Liu, H.; He, D.; Hirata, Y.; Sano, M.; Suzuki, T.; Miyake, T. Catalytic performance and reaction pathways of Cu/SiO2 and ZnO/SiO2 for dehydrogenation of ethanol to acetaldehyde. J. Japan Pet. Inst. 2018, 61, 205–212. [Google Scholar] [CrossRef] [Green Version]
  35. Pinthong, P.; Praserthdam, P.; Jongsomjit, B. Oxidative dehydrogenation of ethanol over vanadium-and molybdenum-modified mg-al mixed oxide derived from hydrotalcite. J. Oleo Sci. 2019, 68, 679–687. [Google Scholar] [CrossRef] [PubMed]
  36. Pinthong, P.; Praserthdam, P.; Jongsomjit, B. Effect of calcination temperature on mg-al layered double hydroxides (LDH) as promising catalysts in oxidative dehydrogenation of ethanol to acetaldehyde. J. Oleo Sci. 2019, 68, 95–102. [Google Scholar] [CrossRef] [PubMed] [Green Version]
  37. Evans, E.J.; Li, H.; Yu, W.Y.; Mullen, G.M.; Henkelman, G.; Mullins, C.B. Mechanistic insights on ethanol dehydrogenation on Pd-Au model catalysts: A combined experimental and DFT study. Phys. Chem. Chem. Phys. 2017, 19, 30578–30589. [Google Scholar] [CrossRef] [PubMed]
  38. Fu, W.; Li, Y.; Liang, C. Dehydrogenation Mechanism of Ethanol on Co(111) Surface: A First-principles Study. Acta Chim. Sin. 2019, 77, 559–568. [Google Scholar] [CrossRef]
  39. Jalid, F.; Khan, T.S.; Haider, M.A. In-silico screening of Pt-based bimetallic alloy catalysts using ab initio microkinetic modeling for non-oxidative dehydrogenation of ethanol to produce acetaldehyde. MRS Commun. 2019, 9, 107–113. [Google Scholar] [CrossRef]
  40. Khan, T.S.; Jalid, F.; Haider, M.A. First-Principle Microkinetic Modeling of Ethanol Dehydrogenation on Metal Catalyst Surfaces in Non-oxidative Environment: Design of Bimetallic Alloys. Top. Catal. 2018, 61, 1820–1831. [Google Scholar] [CrossRef]
  41. Wang, Z.T.; Hoyt, R.A.; El-Soda, M.; Madix, R.J.; Kaxiras, E.; Sykes, E.C.H. Dry Dehydrogenation of Ethanol on Pt–Cu Single Atom Alloys. Top. Catal. 2018, 61, 328–335. [Google Scholar] [CrossRef]
  42. Autthanit, C.; Chatkaew, W.; Praserthdam, P.; Jongsomjit, B. Effect of different phase composition in titania on catalytic behaviors of AgLi/TiO2 catalysts via ethanol dehydrogenation. J. Environ. Chem. Eng. 2019, 8, 103547. [Google Scholar] [CrossRef]
  43. Autthanit, C.; Praserthdam, P.; Jongsomjit, B. Oxidative and non-oxidative dehydrogenation of ethanol to acetaldehyde over different VOx/SBA-15 catalysts. J. Environ. Chem. Eng. 2018, 6, 6516–6529. [Google Scholar] [CrossRef]
  44. Mamontov, G.V.; Grabchenko, M.V.; Sobolev, V.I.; Zaikovskii, V.I.; Vodyankina, O.V. Ethanol dehydrogenation over Ag-CeO2/SiO2 catalyst: Role of Ag-CeO2 interface. Appl. Catal. A Gen. 2016, 528, 161–167. [Google Scholar] [CrossRef]
  45. Dutov, V.V.; Mamontov, G.V.; Sobolev, V.I.; Vodyankina, O.V. Silica-supported silver-containing OMS-2 catalysts for ethanol oxidative dehydrogenation. Catal. Today 2016, 278, 164–173. [Google Scholar] [CrossRef]
  46. Giannakakis, G.; Trimpalis, A.; Shan, J.; Qi, Z.; Cao, S.; Liu, J.; Ye, J.; Biener, J.; Flytzani-Stephanopoulos, M. NiAu Single Atom Alloys for the Non-oxidative Dehydrogenation of Ethanol to Acetaldehyde and Hydrogen. Top. Catal. 2018, 61, 475–486. [Google Scholar] [CrossRef]
  47. Shan, J.; Janvelyan, N.; Li, H.; Liu, J.; Egle, T.M.; Ye, J.; Biener, M.M.; Biener, J.; Friend, C.M.; Flytzani-Stephanopoulos, M. Selective non-oxidative dehydrogenation of ethanol to acetaldehyde and hydrogen on highly dilute NiCu alloys. Appl. Catal. B Environ. 2017, 205, 541–550. [Google Scholar] [CrossRef] [Green Version]
  48. Shan, J.; Liu, J.; Li, M.; Lustig, S.; Lee, S.; Flytzani-Stephanopoulos, M. NiCu single atom alloys catalyze the C–H bond activation in the selective non-oxidative ethanol dehydrogenation reaction. Appl. Catal. B Environ. 2018, 226, 534–543. [Google Scholar] [CrossRef]
  49. Li, S.; Wang, W.; Liu, X.; Zeng, X.; Li, W.; Tsubaki, N.; Yu, S. Nitrogen-doped graphene nanosheets as metal-free catalysts for dehydrogenation reaction of ethanol. RSC Adv. 2016, 6, 13450–13455. [Google Scholar] [CrossRef]
  50. Ob-Eye, J.; Jongsomjit, B. Dehydrogenation of ethanol to acetaldehyde over Co/C catalysts. Eng. J. 2019, 23, 1–13. [Google Scholar] [CrossRef]
  51. Ob-Eye, J.; Praserthdam, P.; Jongsomjit, B. Ethanol dehydrogenation to acetaldehyde over activated carbons-derived from coffee residue. Bull. Chem. React. Eng. Catal. 2019, 14, 268–282. [Google Scholar] [CrossRef] [Green Version]
  52. Ob-Eye, J.; Praserthdam, P.; Jongsomjit, B. Dehydrogenation of ethanol to acetaldehyde over different metals supported on carbon catalysts. Catalysts 2019, 9, 66. [Google Scholar] [CrossRef] [Green Version]
  53. Wang, C.; Garbarino, G.; Allard, L.F.; Wilson, F.; Busca, G.; Flytzani-Stephanopoulos, M. Low-Temperature Dehydrogenation of Ethanol on Atomically Dispersed Gold Supported on ZnZrOx. ACS Catal. 2016, 6, 210–218. [Google Scholar] [CrossRef]
  54. Mitran, G.; Mieritz, D.G.; Seo, D.-K. Highly Selective Solid Acid Catalyst H1−xTi2(PO4)3−x(SO4)x for Non-Oxidative Dehydrogenation of Methanol and Ethanol. Catalysts 2017, 7, 95. [Google Scholar] [CrossRef] [Green Version]
  55. Edington, J.W. Electron Diffraction in the Electron Microscope, Electron Diffraction in the Electron Microscope; Macmillan Education: London, UK, 1975; pp. 1–77. [Google Scholar]
  56. Ouyang, M.; Cao, S.; Yang, S.; Li, M.; Flytzani-Stephanopoulos, M. Atomically dispersed pd supported on zinc oxide for selective nonoxidative ethanol dehydrogenation. Ind. Eng. Chem. Res. 2020, 59, 2648–2656. [Google Scholar] [CrossRef]
  57. Shin, H.; Choi, M.; Kim, H. A mechanistic model for hydrogen activation, spillover, and its chemical reaction in a zeolite-encapsulated Pt catalyst. Phys. Chem. Chem. Phys. 2016, 18, 7035–7041. [Google Scholar] [CrossRef]
  58. Yodsin, N.; Rungnim, C.; Promarak, V.; Namuangruk, S.; Kungwan, N.; Rattanawan, R.; Jungsuttiwong, S. Influence of hydrogen spillover on Pt-decorated carbon nanocones for enhancing hydrogen storage capacity: A DFT mechanistic study. Phys. Chem. Chem. Phys. 2018, 20, 21194–21203. [Google Scholar] [CrossRef]
  59. Zhang, H.; Meng, Y.; Song, G.; Li, F. Effect of Hydrogen Spillover to the Hydrogenation of Benzene over Pt/NaA Catalysts, Synthesis and Reactivity in Inorganic. Metal-Org. Nano-Metal Chem. 2016, 46, 940–944. [Google Scholar] [CrossRef]
  60. Zhou, H.; Zhang, J.; Ji, D.; Yuan, A.; Shen, X. Effect of catalyst loading on hydrogen storage capacity of ZIF-8/graphene oxide doped with Pt or Pd via spillover. Microporous Mesoporous Mater. 2016, 229, 68–75. [Google Scholar] [CrossRef]
  61. Xiang, N.; Xu, P.; Ran, N.; Ye, T. Production of acetic acid from ethanol over CuCr catalysts: Via dehydrogenation-(aldehyde-water shift) reaction. RSC Adv. 2017, 7, 38586–38593. [Google Scholar] [CrossRef] [Green Version]
  62. Batchu, R.; Galvita, V.V.; Alexopoulos, K.; Glazneva, T.S.; Poelman, H.; Reyniers, M.-F.; Marin, G.B. Ethanol dehydration pathways in H-ZSM-5: Insights from temporal analysis of products. Catal. Today 2019. [Google Scholar] [CrossRef]
  63. Liang, Z.; Song, L.; Deng, S.; Zhu, Y.; Stavitski, E.; Adzic, R.R.; Chen, J.; Wang, J.X. Direct 12-Electron Oxidation of Ethanol on a Ternary Au(core)-PtIr(Shell) Electrocatalyst. J. Am. Chem. Soc. 2019, 141, 9629–9636. [Google Scholar] [CrossRef] [PubMed]
  64. Li, H.; Chai, W.; Henkelman, G. Selectivity for ethanol partial oxidation: The unique chemistry of single-atom alloy catalysts on Au, Ag, and Cu(111). J. Mater. Chem. A 2019. [Google Scholar] [CrossRef]
  65. Sheng, T.; Lin, W.F.; Hardacre, C.; Hu, P. Significance of β-dehydrogenation in ethanol electro-oxidation on platinum doped with Ru, Rh, Pd, Os and Ir. Phys. Chem. Chem. Phys. 2014, 16, 13248–13254. [Google Scholar] [CrossRef] [PubMed]
  66. Boualouache, A.; Boucenna, A.; Otmanine, G. Interaction of intermediates with transition metal surfaces in the dehydrogenation of ethanol to ethyl acetate: A theoretical investigation. Progress React. Kinet. Mech. 2019. [Google Scholar] [CrossRef]
  67. Zhang, B.; Cai, W.; Li, Y.; Xu, Y.; Shen, W. Hydrogen production by steam reforming of ethanol over an Ir/CeO2 catalyst: Reaction mechanism and stability of the catalyst. Int. J. Hydrog. Energy 2008, 33, 4377–4386. [Google Scholar] [CrossRef]
  68. Cai, W.; Zhang, B.; Li, Y.; Xu, Y.; Shen, W. Hydrogen production by oxidative steam reforming of ethanol over an Ir/CeO2 catalyst. Catalysis Commun. 2007, 8, 1588–1594. [Google Scholar] [CrossRef]
  69. Brunauer, S.; Emmett, P.H.; Teller, E. Adsorption of Gases in Multimolecular Layers. J. Am. Chem. Soc. 1938, 60, 309–319. [Google Scholar] [CrossRef]
  70. Cranston, R.W.; Inkley, F.A. 17 The Determination of Pore Structures from Nitrogen Adsorption Isotherms. In Advances in Catalysis; Farkas, A., Ed.; Academic Press: London, UK, 1957; pp. 143–154. [Google Scholar]
  71. Kovacs, A.; Schierholz, R.; Tillmann, K. FEI Titan G2 80-200 CREWLEY. J. Large-Scale Res. Facilities JLSFR 2016, 2, 43. [Google Scholar] [CrossRef] [Green Version]
  72. Pasel, J.; Schmitt, D.; Hartmann, H.; Besmehn, A.; Dornseiffer, J.; Werner, J.; Mayer, J.; Peters, R. Combined near-ambient pressure photoelectron spectroscopy and temporal analysis of products study of CH4 oxidation on Pd/γ-Al2O3 catalysts. Catal. Today 2019. [Google Scholar] [CrossRef]
  73. Yaws, C.L.; Satyro, M.A. Chapter 1—Vapor Pressure—Organic Compounds. In The Yaws Handbook of Vapor Pressure, 2nd ed.; Yaws, C.L., Ed.; Gulf Professional Publishing: Houston, TX, USA, 2015; pp. 1–314. [Google Scholar]
Figure 1. Reaction pathway for the synthesis of iso-butanol from ethanol and methanol.
Catalysts 10 01151 g001
Figure 2. Pore size distributions of the different C-supported catalysts.
Catalysts 10 01151 g002
Figure 3. HAADF-STEM overviews alongside survey images of the corresponding EDX element maps of: (a) fresh Pt/C catalyst (top part); (b) fresh Ir/C catalyst (middle part); and (c) fresh Cu/C catalyst (bottom part). The metals are represented in green, with the C-support in orange within the EDX maps. HR HAADF-STEM images for Pt/C and Ir/C show a close up of nanoparticles with Fast-Fourier-Transform (FFT) patterns in the insets.
Catalysts 10 01151 g003
Figure 4. Height-normalized transient responses to pulses of 34.6 vol % ethanol in Ar on the H2 pre-reduced Pt/C catalyst (20 mg), T = 200 °C, at m/z-values of: (a) 2 for H2, 16 for CH4, 28 for CO, 29 for acetaldehyde and 40 for Ar up to 2.0 s; (b) 2 for H2 and 16 for CH4 over the entire time-span.
Catalysts 10 01151 g004
Figure 5. Transient responses of: (a) CO2 and (b) CO to pulses of 50% O2 in Ar at 200 °C before and after 10,000 pulses of ethanol (34.6 vol % in Ar) were pulsed over the H2 pre-reduced Pt/C catalyst (20 mg) at 200 °C.
Catalysts 10 01151 g005
Figure 6. Height-normalized transient responses of CH4 and H2, respectively, at 200 °C to: (a) pulses of 38.6 vol % acetaldehyde in Ar and 50 vol % CH4 in Ar over H2 pre-reduced Pt/C and over carbon black; (b) pulses of 38.6 vo l% acetaldehyde in Ar and 50 vol % H2 in Ar over H2 pre-reduced Pt/C and over carbon black.
Catalysts 10 01151 g006
Figure 7. Ar-normalized transient responses to pulses of 34.6 vol % ethanol in Ar at temperatures between 100 °C and 250 °C on the H2 pre-reduced Pt/C catalyst (20 mg), (a) the m/z-value of 29 for acetaldehyde; (b) the m/z-value of 28 for CO; (c) the m/z-value of 16 for CH4; (d) the magnification of (c); (e) the m/z-value of 2 for H2.
Catalysts 10 01151 g007
Figure 8. Ar-normalized transient responses of CH4 and H2, respectively, at temperatures between 100 and 250 °C and averaged response pulses of Ar on the Pt/C catalyst to: (a) pulses of 50 vol % CH4 in Ar; (b) pulses of 50 vol % H2 in Ar.
Catalysts 10 01151 g008
Figure 9. (a) Ar-normalized transient responses to pulses of 34.6 vol % ethanol in Ar at temperatures between 100 °C and 250 °C on the H2 pre-reduced Ir/C catalyst (20 mg) at an m/z-value of 31 for ethanol; response pulse of Ar (m/z-value of 40) at 200 °C for comparison. (b) Height-normalized transient responses to pulses of 34.6 vol % ethanol in Ar at m/z-values of 2 for H2, 16 for CH4, 28 for CO, 44 for acetaldehyde and 40 for Ar on the H2 pre-reduced Ir/C catalyst (20 mg), T = 200 °C.
Catalysts 10 01151 g009
Figure 10. (a) Ar-normalized transient responses to pulses of 34.6 vol % ethanol in Ar at temperatures between 100 °C and 250 °C on the H2 pre-reduced Cu/C catalyst (20 mg) at an m/z-value of 31 for ethanol; response pulse of Ar (m/z-value of 40) at 200 °C for comparison. (b) Height-normalized transient responses to pulses of 34.6 vol % ethanol in Ar at m/z-values of 2 for H2, 16 for CH4, 28 for CO, 44 for acetaldehyde and 40 for Ar on the H2 pre-reduced Cu/C catalyst (20 mg), T = 200 °C.
Catalysts 10 01151 g010
Figure 11. Reaction scheme for ethanol dehydrogenation on a Pt/C catalyst.
Catalysts 10 01151 g011
Table 1. Specific surface areas of the different C-supported catalysts.
CatalystSpecific Surface Area m2 g−1
5 wt % Pt/C805
1 wt % Ir/C1013
3 wt % Cu/C1271
Table 2. Specific surface areas and ethanol conversions of the different C-supported catalysts.
CatalystSpecific Surface Area m2 g−1Calculated Ethanol Conversions at 200 °C %
5 wt % Pt/C805~100
1 wt % Ir/C1013~95
3 wt % Cu/C1271~85

