Article

Photocatalytic H2 Evolution, CO2 Reduction, and NOx Oxidation by Highly Exfoliated g-C3N4

1
Institute of Nanoscience and Nanotechnology, National Centre for Scientific Research “Demokritos”, 15341 Athens, Greece
2
Institute of Environmental Technology, VŠB-Technical University of Ostrava, 17. listopadu 15, 708 00 Ostrava-Poruba, Czech Republic
*
Authors to whom correspondence should be addressed.
Catalysts 2020, 10(10), 1147; https://doi.org/10.3390/catal10101147
Submission received: 17 August 2020 / Revised: 30 September 2020 / Accepted: 1 October 2020 / Published: 3 October 2020
(This article belongs to the Special Issue Photocatalytic Reduction of CO2)

Abstract

:
g-C3N4, with specific surface area up to 513 m2/g, was prepared via three successive thermal treatments at 550 °C in air with gradual precursor mass decrease. The obtained bulk and exfoliated (1ex, 2ex and 3ex) g-C3N4 were characterized and tested as photocatalysts for H2 production, CO2 reduction and NOx oxidation. The exfoliated samples demonstrated graphene-like morphology with detached (2ex) and sponge-like framework (3ex) of layers. The surface area increased drastically from 20 m2/g (bulk) to 513 m2/g (3ex). The band gap (Eg) increased gradually from 2.70 to 3.04 eV. Superoxide radicals (·O2) were mainly formed under UV and visible light. In comparison to the bulk, the exfoliated g-C3N4 demonstrated significant increase in H2 evolution (~6 times), CO2 reduction (~3 times) and NOx oxidation (~4 times) under UV light. Despite the Eg widening, the photocatalytic performance of the exfoliated g-C3N4 under visible light was improved too. The results were related to the large surface area and low e-h+ recombination. The highly exfoliated g-C3N4 demonstrated selectivity towards H2 evolution reactions.

Graphical Abstract

1. Introduction

The increasing energy demand and the environmental pollution are two major problems that need to be resolved by the modern society. The photocatalytic technology is regarded as a potential solution because both hydrogen (H2) production and air depollution (CO2 reduction and oxidation of NOx, VOCs, SOx, etc.) can be achieved using abundant solar light [1].
For the photocatalytic H2 production, water and various organic compounds have been used as sources. H2 and O2 have been produced by water splitting, while H2, CO2, and H2O have been obtained by reforming of organic compounds under UV or visible light irradiation [2]. Modified TiO2 and CdS are widely used as photocatalysts. Multicomponent systems including graphene, MoS2, WO3, etc. have also been constructed to create appropriate band gap configurations for light absorption and charge carriers (e and h+) transportation [3]. Co-catalysts like Pt, Au, Ru/Rh, etc. are usually employed to enhance the efficiency of the main photocatalyst. Currently, g-C3N4 is intensively investigated as photocatalyst for H2 evolution due to its visible light activation (band gap ~2.7 eV), suitable band gap potentials, stability, and low cost [4,5].
Regarding the photocatalytic CO2 reduction, TiO2 is the most commonly used photocatalyst but the application is still limited by its well-known drawbacks: the large band gap (~3.2 eV) and the fast recombination of the photo-generated charge carriers [6,7]. Other metal oxides (ZnO andCuO), sulfides (ZnS, CdS), carbides (SiC, MXenes), as well as their combinations have also been tested [8,9]. The g-C3N4 has been poorly investigated as a photocatalyst for CO2 reduction and currently, it is receiving large research interest [10,11].For the photocatalytic NOx oxidation and removal from the atmosphere, the TiO2 and g-C3N4 are considered as most effective for operation under UV and visible light, respectively [12,13,14]. Due to their compatibility, the two photocatalysts have been coupled in different ratios achieving increased NOx oxidation efficiency under visible light irradiation [15,16].
It is known that the performance of a semiconductor photocatalyst is dictated by energetic and morphological characteristics such as: (i) activation ability of the photocatalyst depending on the band gap energy (Eg), (ii) spontaneous involvement of the photogenerated e and h+ in desired redox reactions governed by the valence and conduction bands potentials (VVB and VCB), and (iii) the mass transport and number of active sites depending on the porosity and the specific surface area (SSA). Although the use of g-C3N4 photocatalyst in the three cases of H2 production, CO2 reduction and NOx oxidation is promising, it is inhibited by two main disadvantages, namely, the very low SSA (~10 m2/g) and the high recombination rate of the photogenerated e and h+ [17]. As a mitigation technique, exfoliation of the bulk g-C3N4 is carried out achieving ~10-fold increase of the SSA. Thermal and chemical routes have been employed with the latter to be more effective due to surface modification, enhanced superoxide radicals (·O2) formation, favorable band gap potentials, and porosity [18,19]. Nevertheless, the thermal route is often preferred due to the easy scale-up, low cost, and environmental friendliness. Thus, the two stages of g-C3N4 preparation, namely, synthesis of bulk g-C3N4 and its exfoliation via thermal treatment have been thoroughly investigated aiming at high yield and photocatalytic efficiency.
For the synthesis of g-C3N4, different precursor substances have been employed, such as triazines, dicyandiamide, thiourea, urea, melamine, etc., with the melamine to provide a relatively high yield of bulk g-C3N4 [20]. In addition, different experimental parameters have been tested such as: processing temperatures (450–650 °C), duration (1–3 h), exposure of the precursor (covered or non-covered), atmospheres (inert gas or air), presence of templates (e.g., SiO2) and other substances (e.g., glyoxal), high pressure, etc. [21,22,23]. In the case of melamine precursor, treatment at 450 °C for 3 h in Ar atmosphere have been reported as optimum conditions with respect to photocatalytic performance of the g-C3N4 in NOx oxidation [24]. The precursor quantity is another parameter that was found to greatly influence the properties of the synthesized g-C3N4. By decreasing the mass of the thiourea from 20 to 2 g, the SSA of the obtained g-C3N4 increased from 12 to 66 m2/g and the NO removal rate increased from 12.7% to 48.3%. Mass-controlled synthesis, specifically “less is better” was proposed as a simple and facile strategy toward high-performance g-C3N4 photocatalyst [25].
Regarding the exfoliation, the bulk g-C3N4 is usually treated at similar thermal conditions resulting in approximately 6 to 10-fold increase of SSA. Intercalation of acidic substances prior treatment has been reported to cause an explosive exfoliation for only 3 min at 500 °C and to increase the SSA of the bulk g-C3N4from 9.6 to 58.9 m2/g [26]. Following a different approach, repeated post-synthesis calcination of g-C3N4 was recently reported to increase the SSA and the photocatalytic NO removal and H2 evolution. After seven successive calcinations, g-C3N4 nanosheets were prepared with improved crystallinity, SSA of 60 m2/g, and rates of NO removal and H2 evolution under visible light increased by factors of 1.74 and 24.4, respectively [27]. In addition, white g-C3N4 with SSA of ~265 m2/g was prepared by applying thermal exfoliation twice at 550 °C [28]. It should be noted that in an earlier report [29], graphene-like g-C4N4 nanosheets with improved ·OH radical generation and H2 evolution were obtained by a single thermal treatment of 400 mg bulk g-C3N4 at 500 °C for 2 h in static air. The measured SSA 306 m2/g is among the highest reported but it was not connected to the mass of the treated bulk g-C3N4.
In this work, two variables, namely, the mass of the precursor and the number of exfoliations were combined applying three successive exfoliations with a gradual mass decrease. Highly exfoliated g-C3N4 with significant increase of the SSA up to 513 g/m2 was achieved for the first time to the best of our knowledge. The prepared g-C3N4 materials were characterized and their photocatalytic activity in different photocatalytic processes, namely, H2 evolution, CO2 reduction and NOx oxidation, was investigated. Selectivity towards specific photocatalytic reactions was identified.

2. Results and Discussion

2.1. Physicochemical Properties of Highly Exfoliated g-C3N4

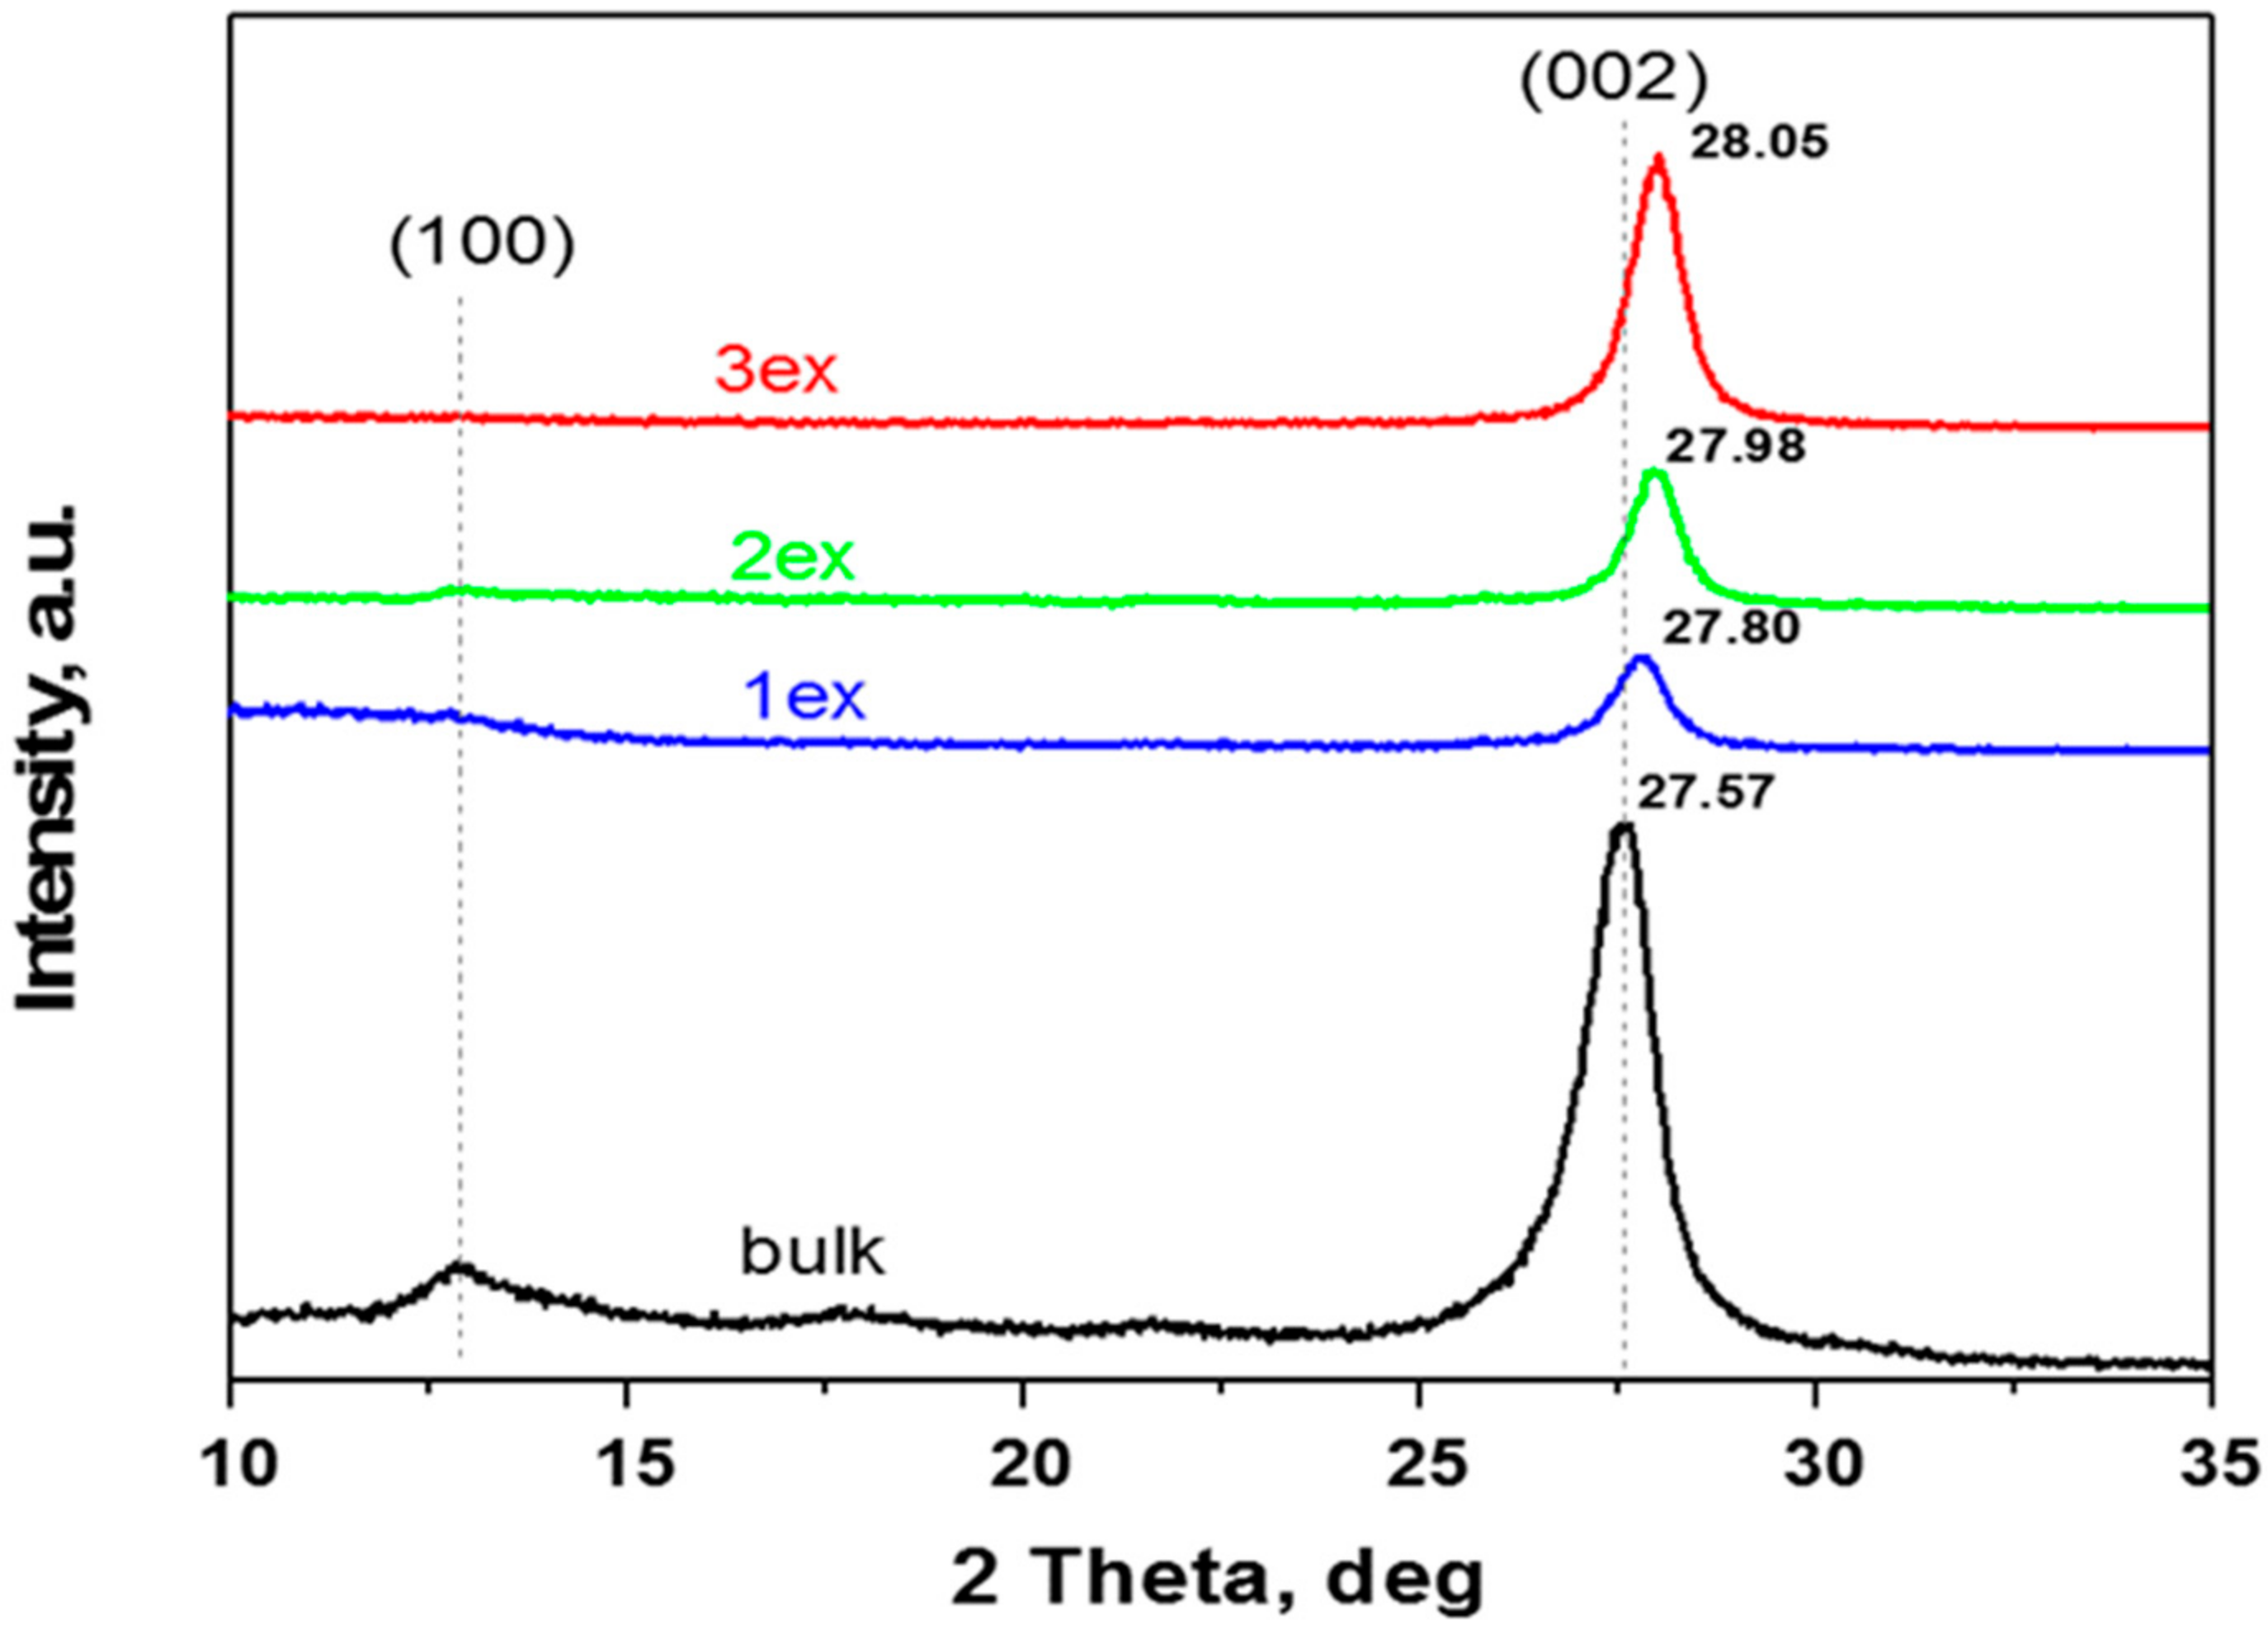
2.1.1. Crystalline Structure
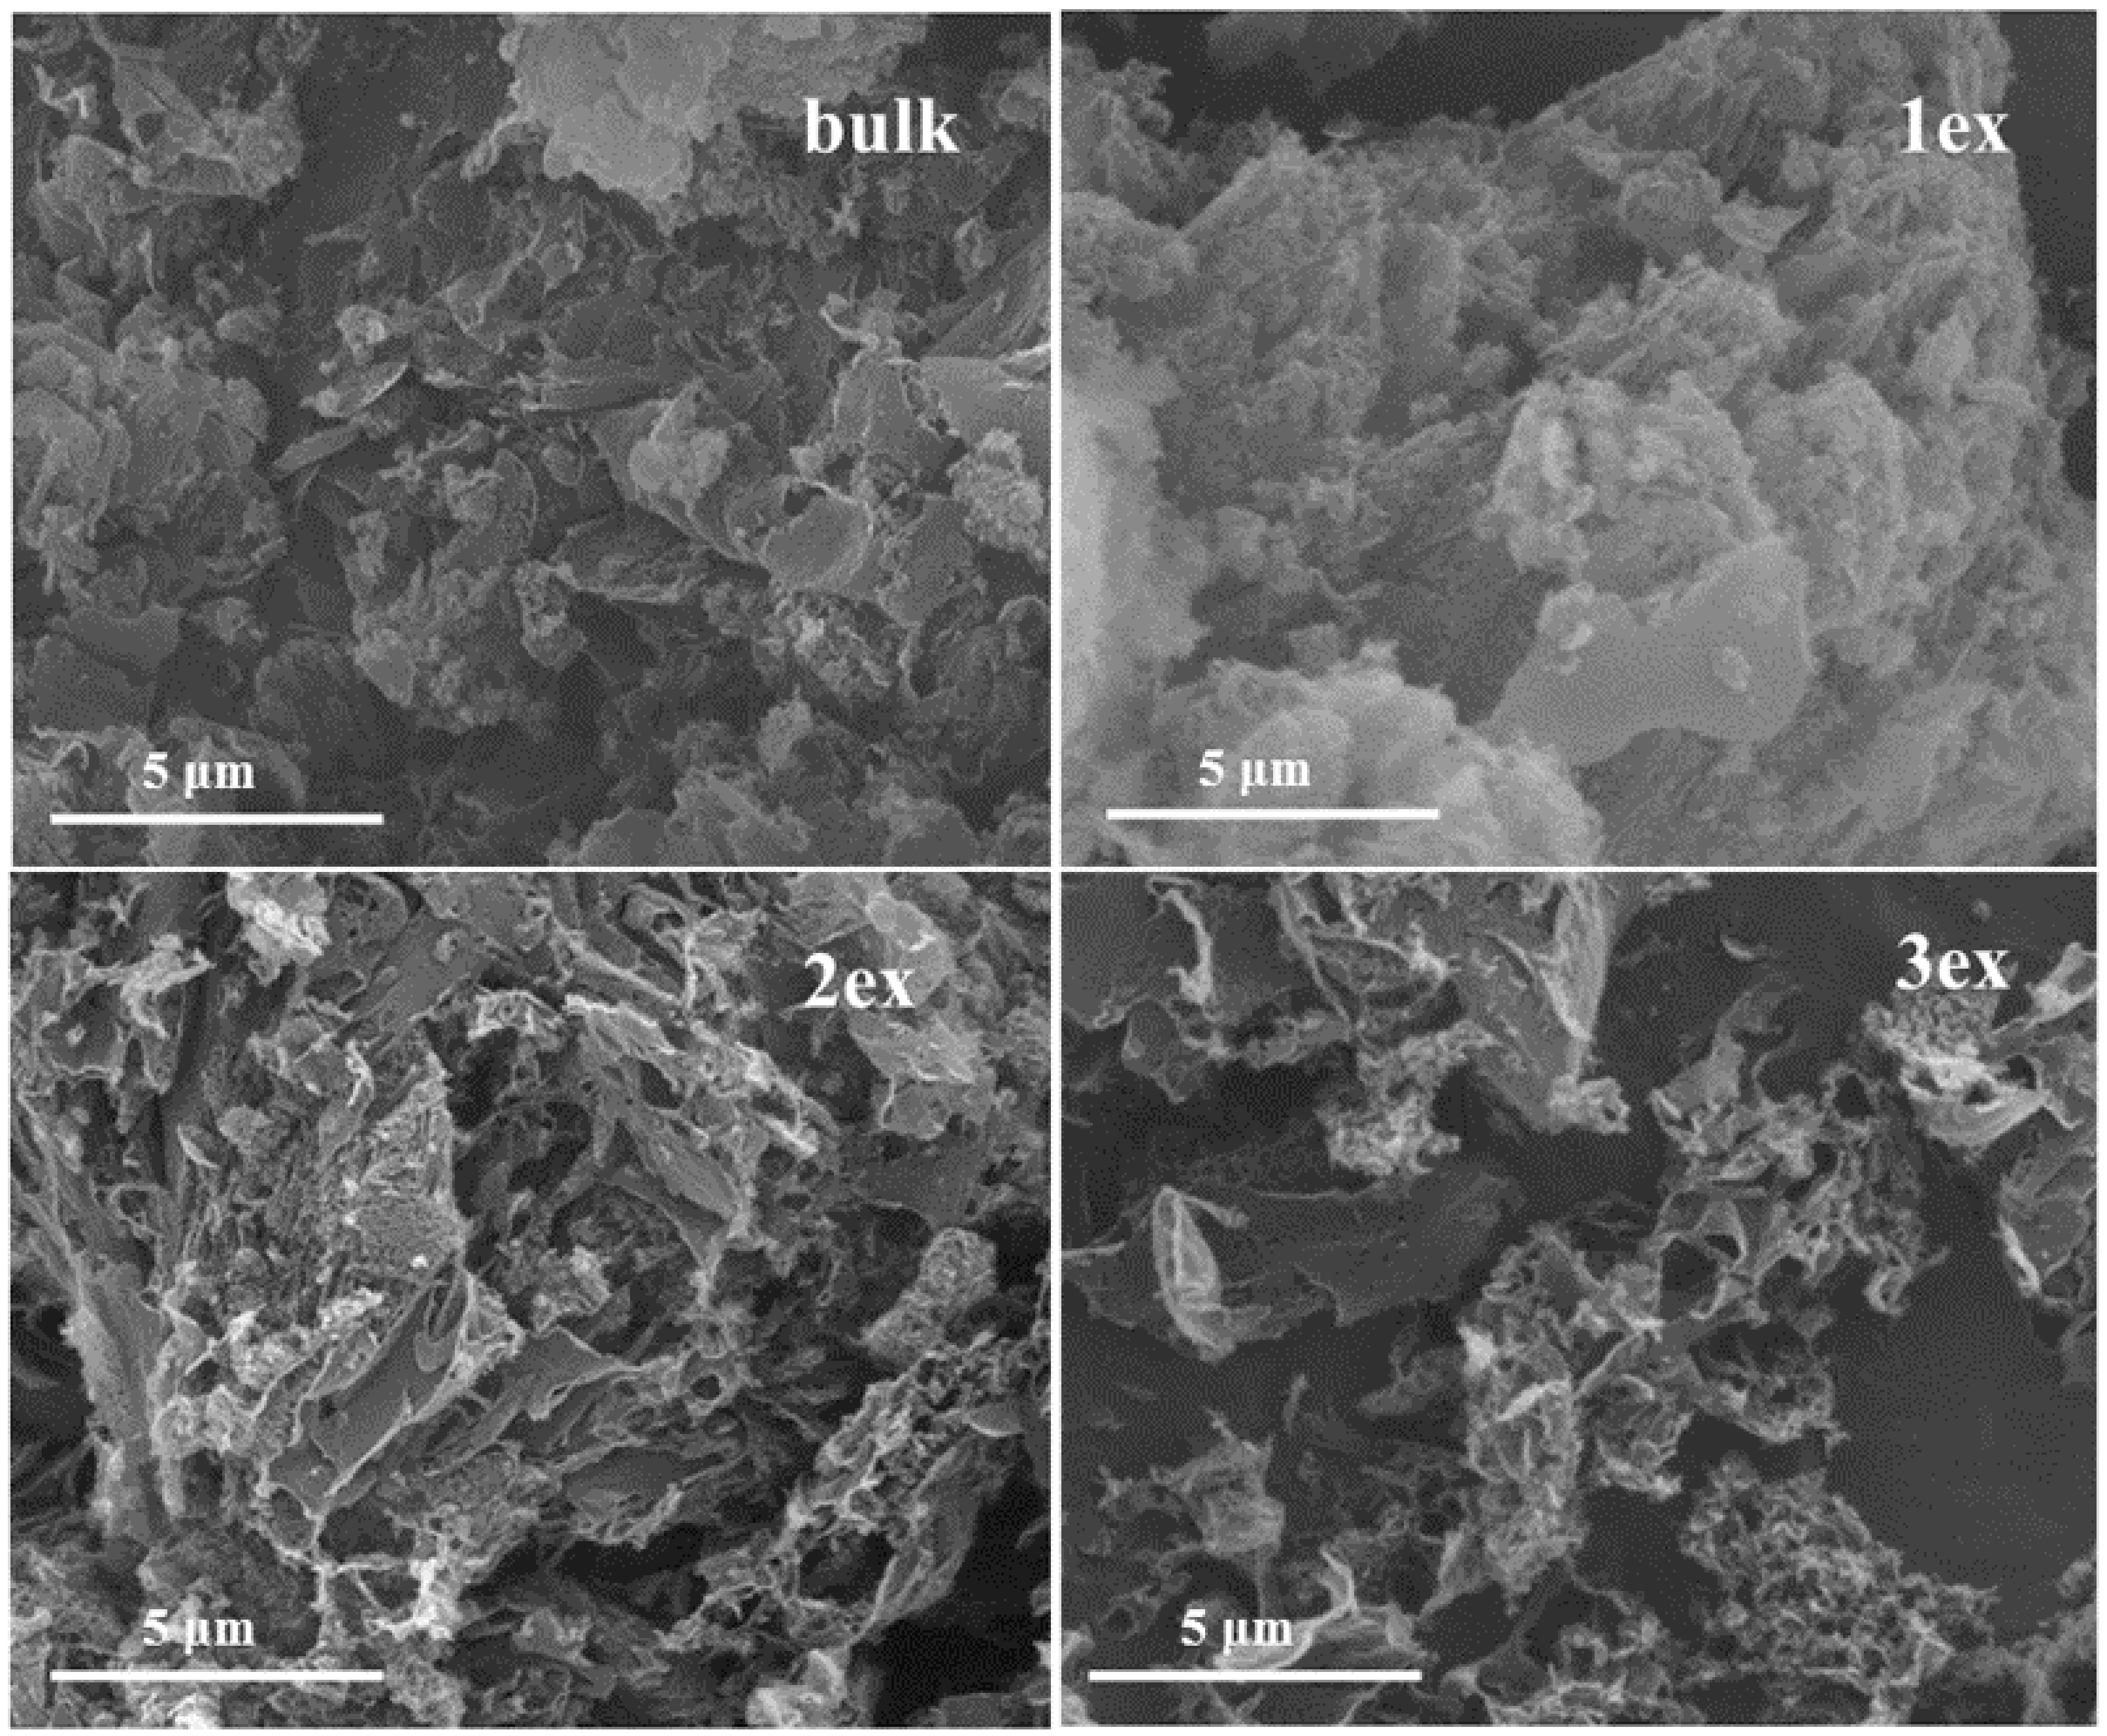
The XRD patterns of the synthesized (bulk) and exfoliated (1ex, 2ex and 3ex) samples presented in Figure 1 are typical for g-C3N4. The characteristic (002) and (100) diffraction peaks are well defined for the bulk sample at 2θ of 27.6° and 13.0°, respectively. The (002) diffraction peak reflects the graphite-like stacking of g-C3N4 layers that consist of conjugated aromatic units. The interlayer distance was calculated applying the Bragg’s law. For the bulk g-C3N4, the distance was found to be 0.323 nm (Table 1), whereas for the exfoliated samples, a gradual decrease to 0.320, 0.319 and 0.318 nm was recorded with the increase of the exfoliation number. This is in agreement with the literature [29] where the shift of 2θ to larger values is attributed to the denser nanosheets stacking caused by the thermal treatment. Additionally, the intensity of the (002) peak decreases for the samples 1ex and 2ex in comparison to the bulk indicating an increased disorder. For the sample 3ex, although shifted to larger 2θ, the diffraction peak (002) appears enhanced implying increased number of aligned layers and hence increased crystallinity. Similar result has been observed in the literature [27] where the increased crystallinity along with the reduced interlayer distance was reported to facilitate the transfer of the photo-generated electrons to the crystal surface and the formation of reactive oxygen species. After the photocatalytic activity test, the trends in the interlayer distance (d) and crystallinity were preserved as evidenced in the Supplementary Material Figure S1. A slight shift of the (002) peak to larger 2θ was observed for all samples. The d value for the bulk was not altered, whereas a very small decrease was found for the exfoliated 1ex, 2ex, and 3ex g-C3N4.
Regarding the (100) diffraction peak, it can be observed that with the increase of the exfoliation number, the intensity of the peak decreases and for the sample 3ex, it is missing. Since this peak is related to the in-plane tri-s-triazine units [30], it can be deduced that the planar size of the g-C3N4 layers decreased significantly after the exfoliations.

2.1.2. Morphology

The morphology of the bulk and exfoliated g-C3N4 can be observed in the SEM images at Figure 2. The bulk sample showed typical for the g-C3N4 aggregates of flakes. The sample 1ex was less aggregated but similar to the bulk, while for the highly exfoliated samples detached layers (2ex) and even a sponge-like framework of interconnected pores (3ex) can be observed.
The TEM analysis of the exfoliated samples (Figure 3) evidenced a typical for 2D materials layered morphology. With the increase of the exfoliation cycles, the thickness of the stacked layers decreased (less dark color) indicating higher delamination. It can be expected that the thinner packs of g-C3N4 would facilitate the migration of the photogenerated e and h+ to the surface where they will be engaged in redox reactions with species from the environment.

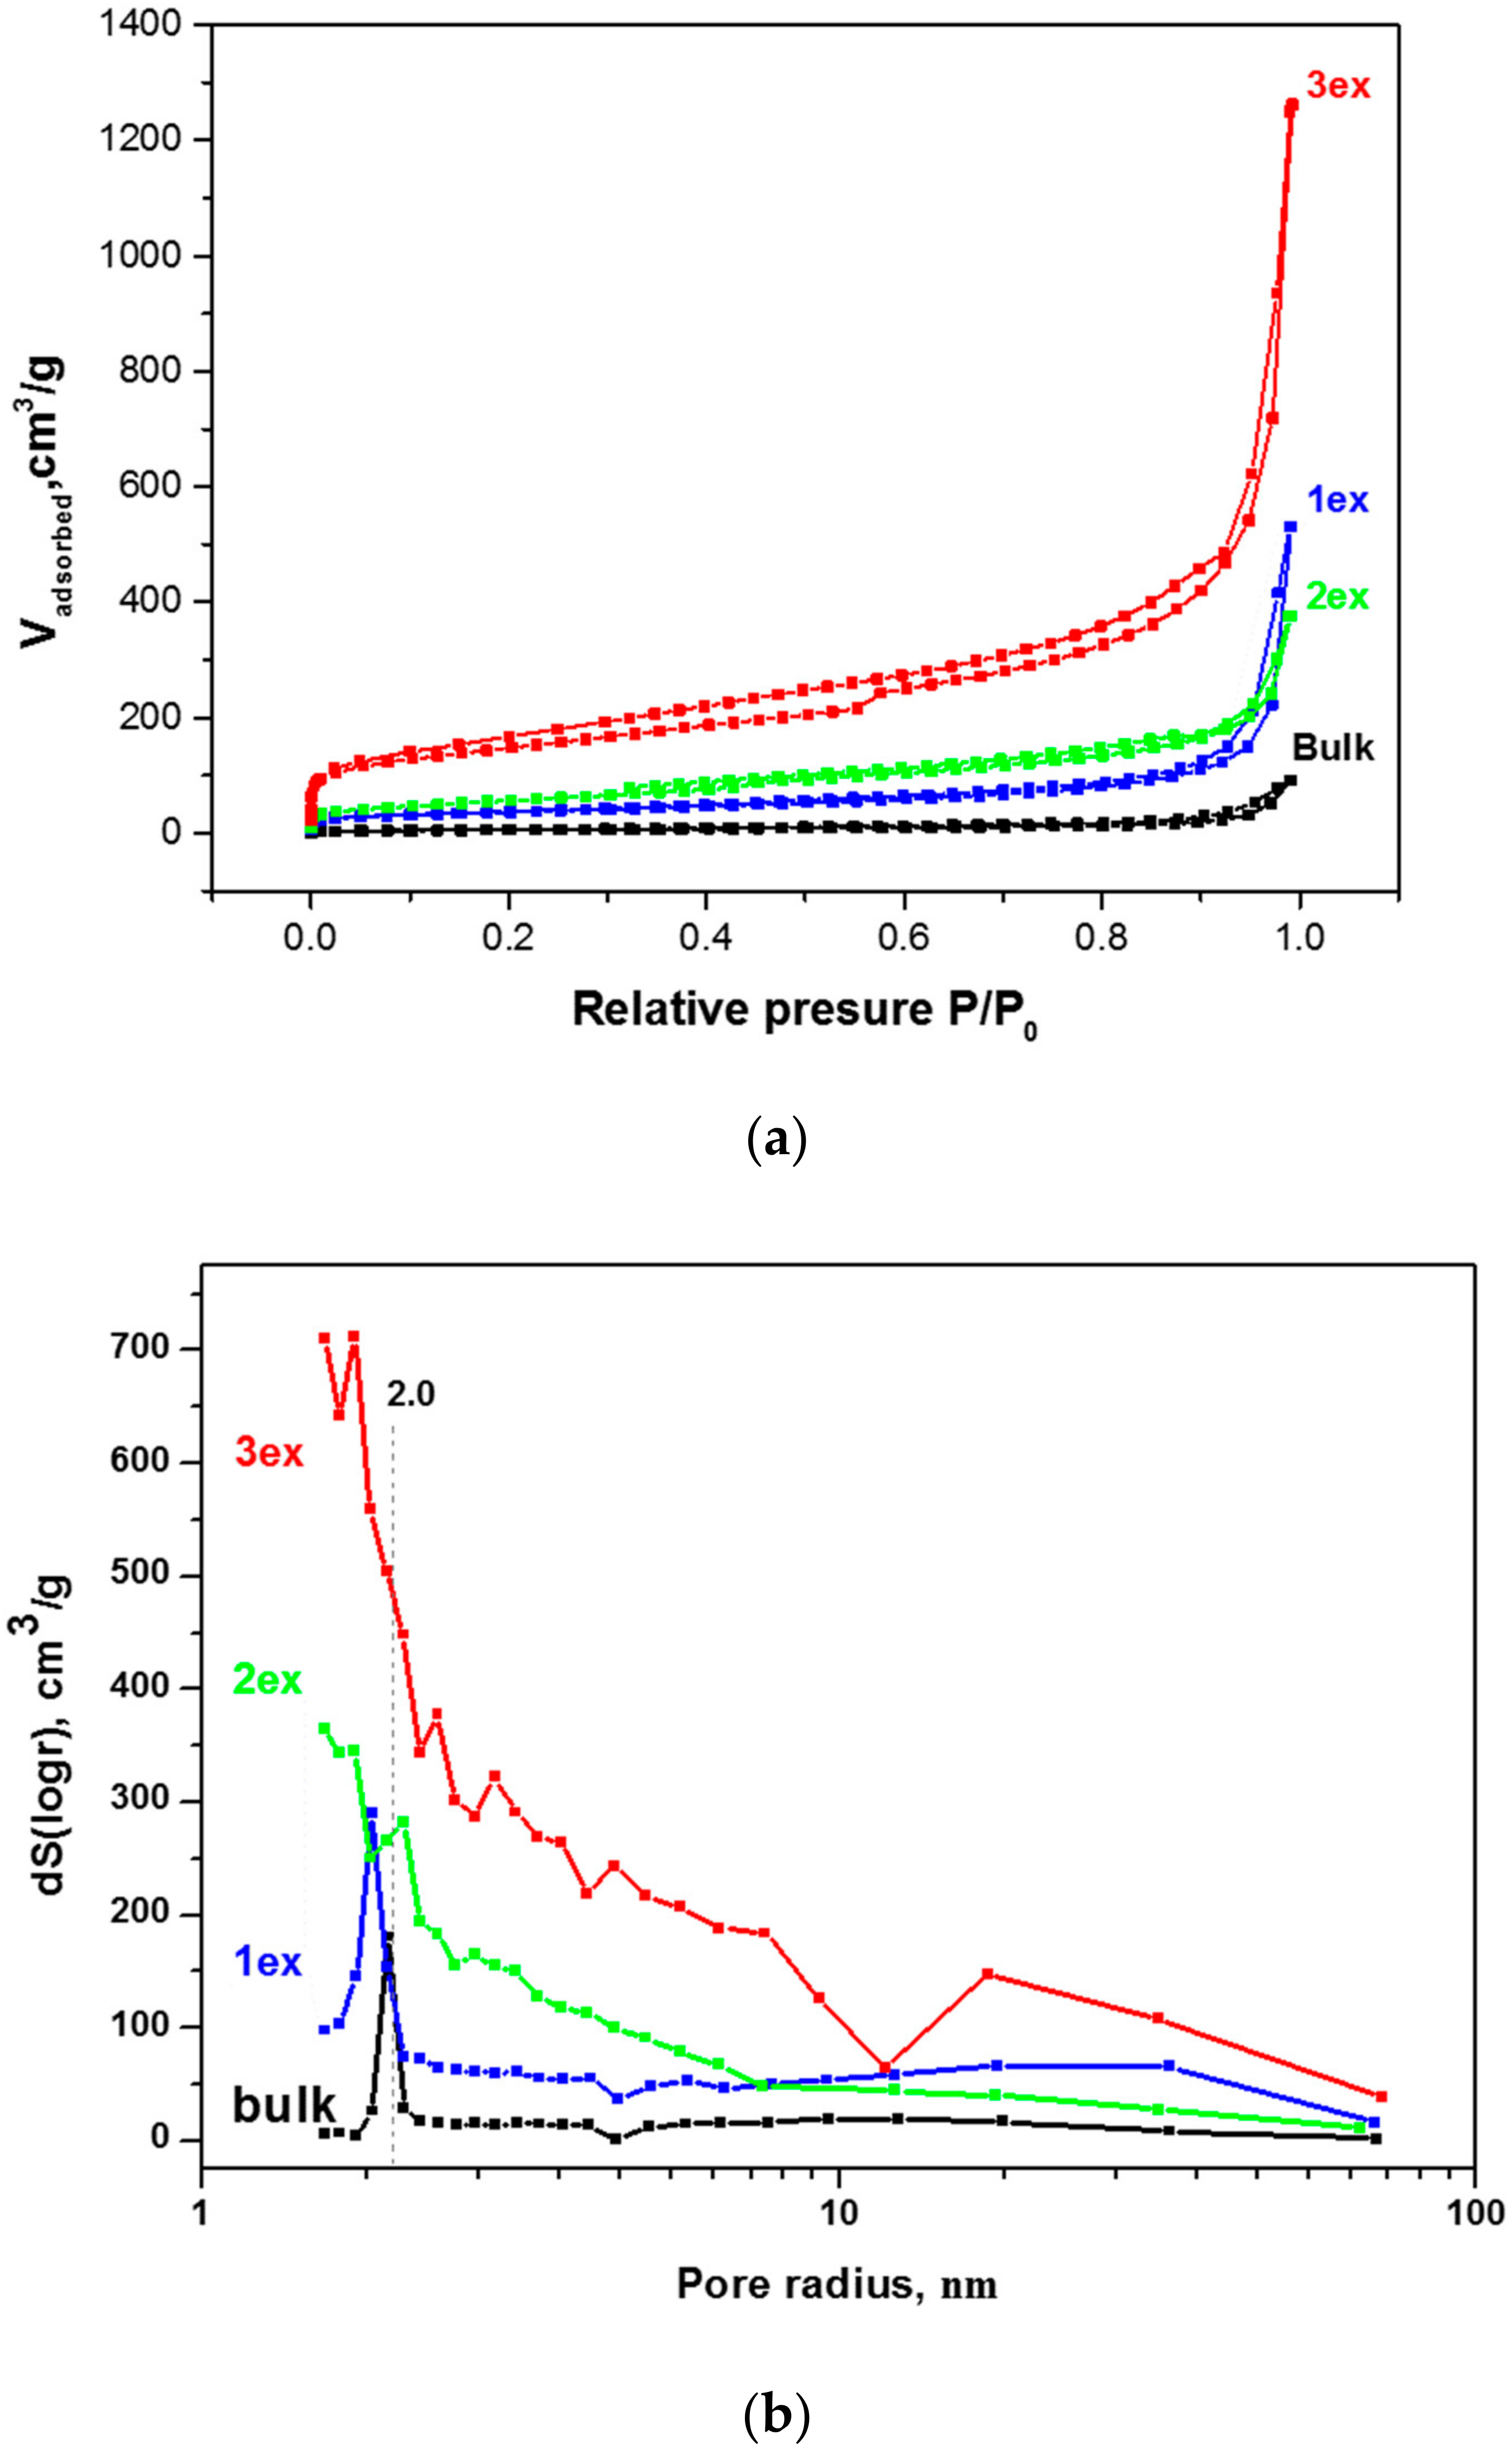
2.1.3. Porosity and Specific Surface Area

The liquid N2 adsorption–desorption isotherms and the pore size distribution of the bulk and exfoliated g-C3N4 powders are given in Figure 4. According to Brunauer–Deming–Demin–Teller (BDDT) classification, the isotherms (Figure 4a) can be characterized as type IV suggesting multilayer adsorption and capillary condensation/evaporation. The shape of the hysteresis loops is consistent with type H3 of the Union of Pure and Applied Chemistry (IUPAC) classification indicating the presence of slit-shaped pores. It can be seen that the N2 adsorption capacity of the exfoliated samples increased gradually in the entire range of the P/P0. The total pore volume increased from 0.1413 cm3/g for the bulk to 1.9520 cm3/g for the 3ex sample (Table 1). In addition, the SSA determined by Brunauer–Emmet–Teller (BET) method increased drastically from 20 m2/g for the bulk sample to 513 m2/g for the 3ex sample. To our knowledge, this is the first time when g-C3N4 with so high SSA is reported in the literature.
The pore size distribution (Figure 4b) was determined from the desorption branch of the isotherm via Barrett–Joyner–Halenda (BJH) method. For the bulk g-C3N4, a narrow pore distribution was recorded with a well-defined peak at pore radius 2 nm and very small concentration of larger pores covering the wide range up to 100 nm. The sharp peak is assigned to the porosity within the g-C3N4 sheets, whereasthe large mesopores are ascribed to the voids between the packed layers [19,31]. After the first exfoliation (sample 1ex), the type of porosity was similar to the bulk with a slight shift of the main peak to smaller pore radius and increase of the concentration of the large mesopores. The second and the third exfoliation resulted in wider pore size distribution demonstrating a gradual increase of the pore sizes in both regions. This outcome is in good accordance with the results on the morphology of the bulk and exfoliated g-C3N4.

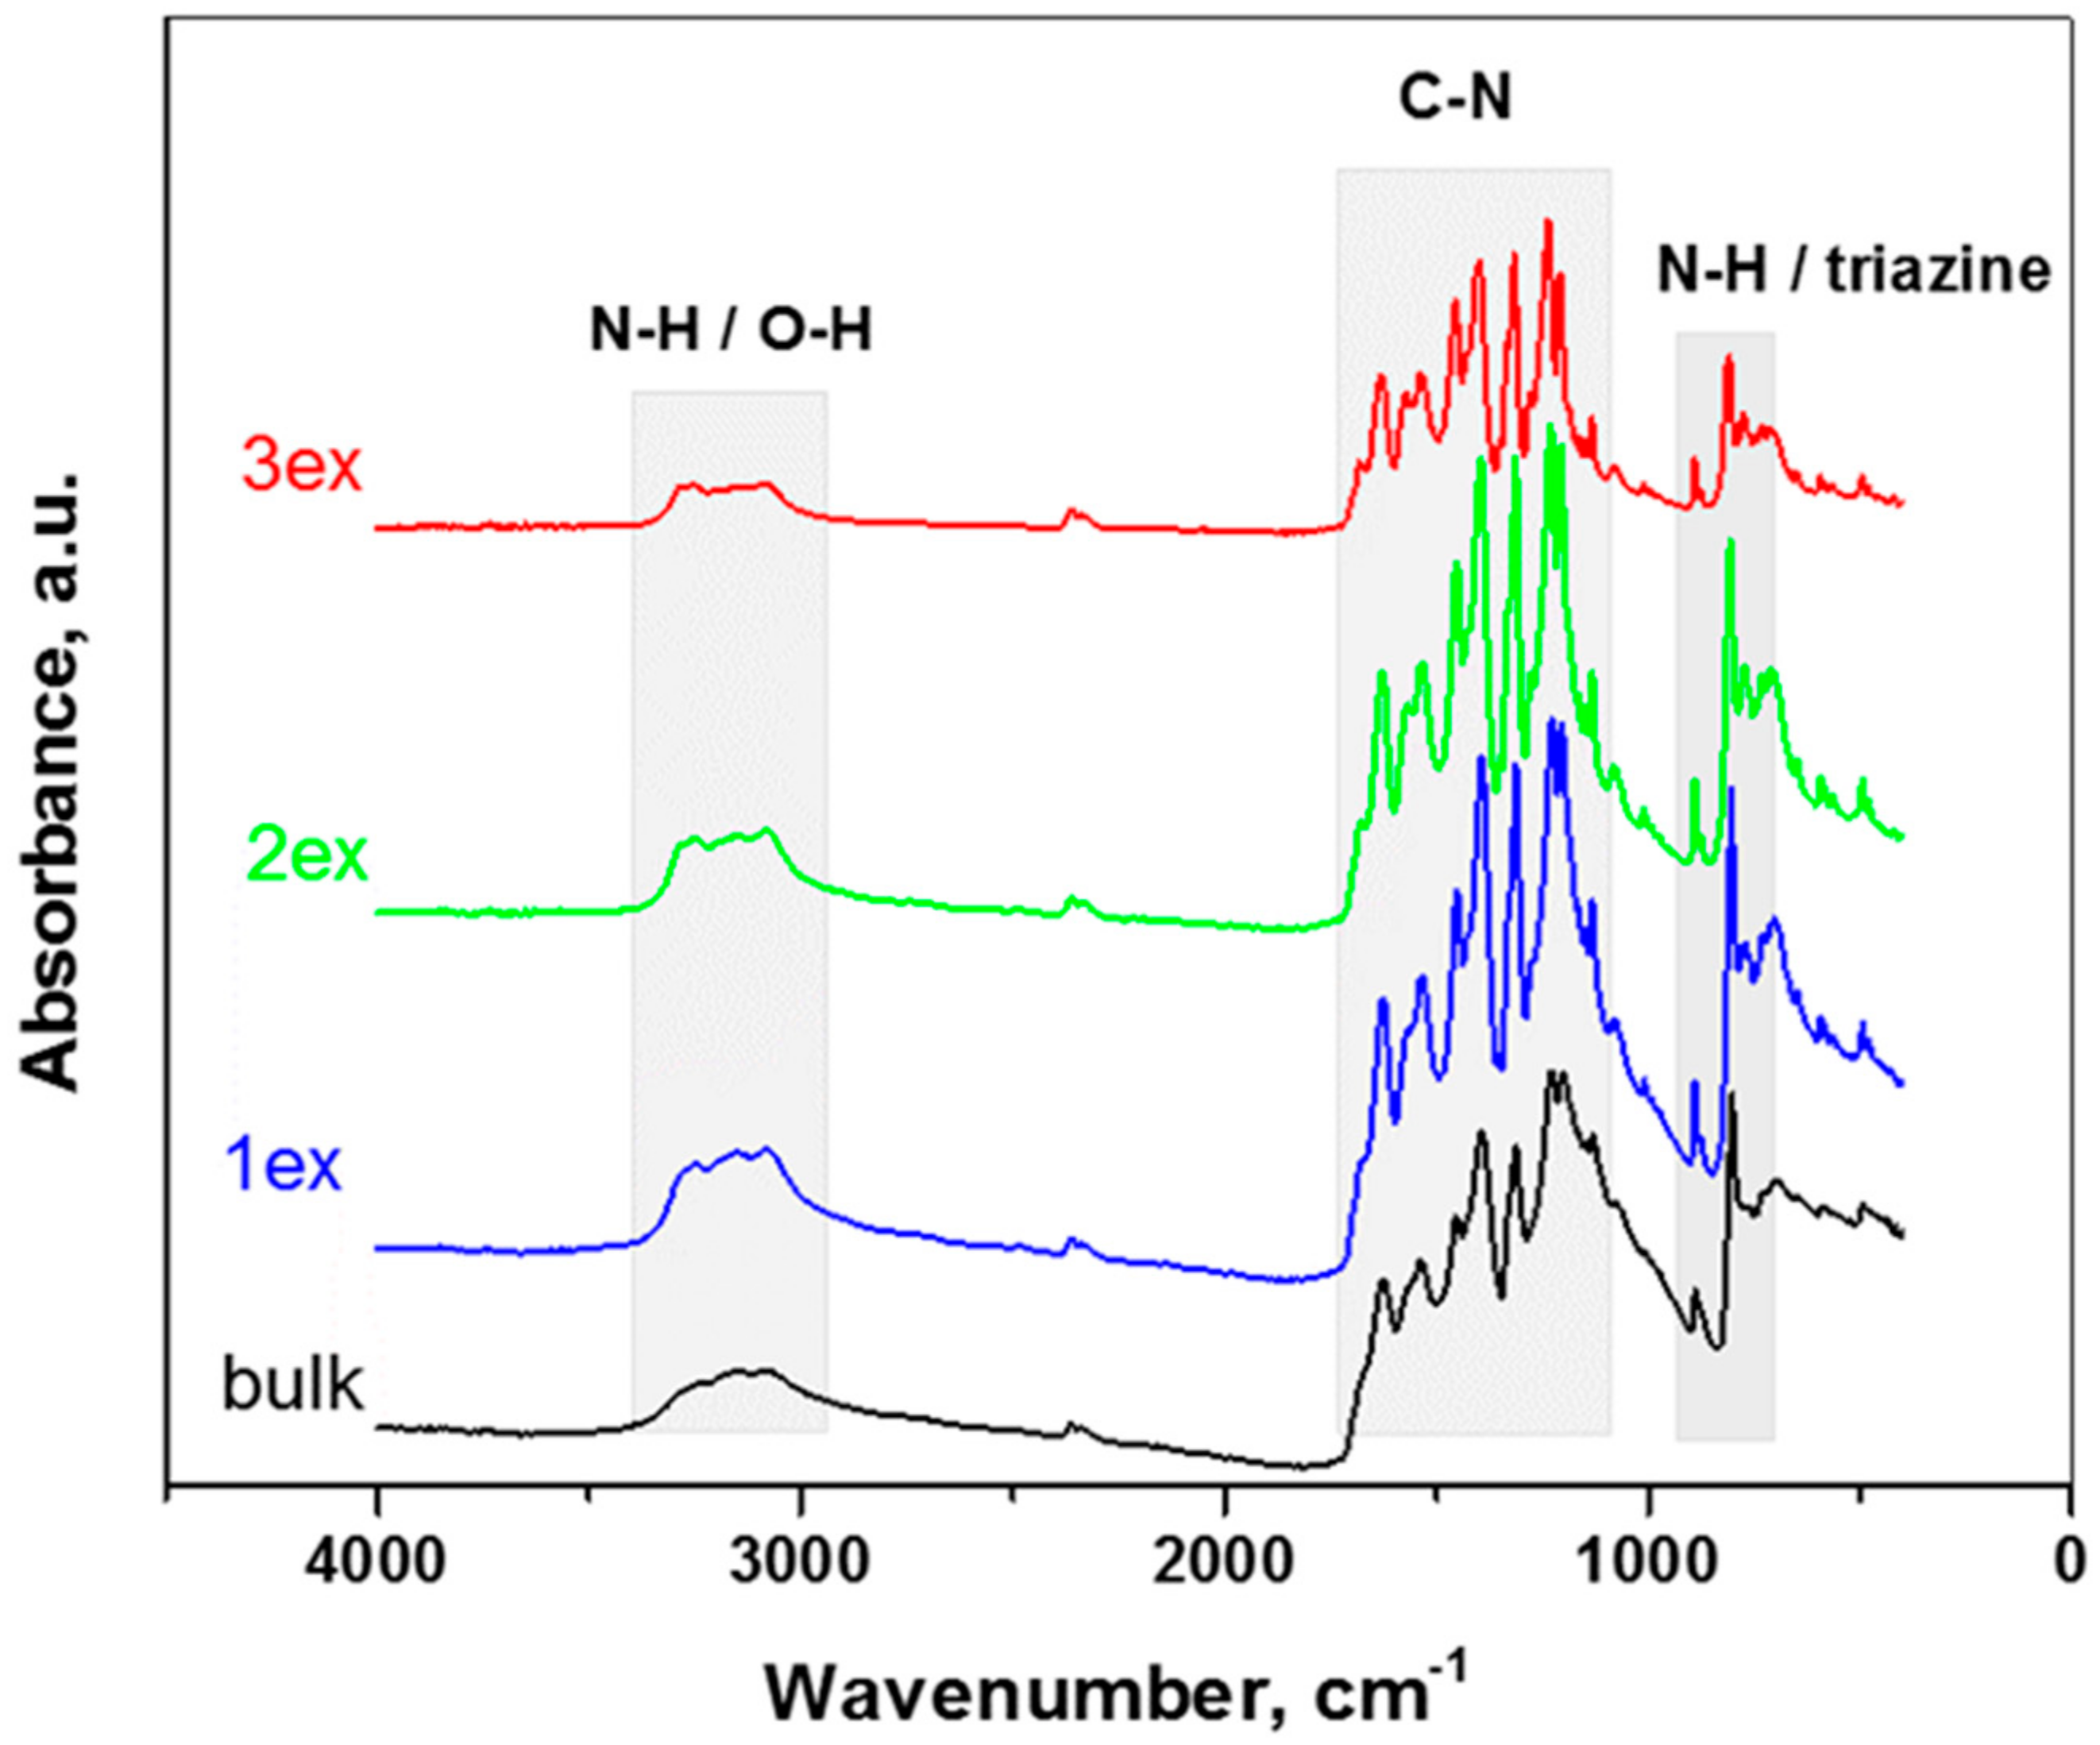
2.1.4. Chemical Composition

The FT-IR spectra of the bulk and exfoliated g-C3N4 presented in Figure 5 are rather similar. The absorption bands ascribed to g-C3N4 were preserved for all samples and became more prominent after the exfoliation treatments. The characteristic vibrations of N-H/O-N, C-N and s-triazine are well defined in the respective wavenumber regions as follows.
3000–3400 cm−1: the broad bands near 3165 cm−1 are attributed to stretching vibrations of the N–H or O–H bonds of the residual amino groups or adsorbed H2O molecules [25,32].
1100–1700 cm−1: the bands at 1230 cm−1 and 1313 cm−1 are associated with stretching vibrations of the C–N bonds between the heptazine rings and NH groups (or C–NH–C bridges), the bands at 1393, 1450, 1530 and 1626 cm−1 are connected to stretching vibrations of the C–N bonds in the rings [33,34].
700–900 cm−1: the strong absorption at 805 cm−1 are ascribed to out-of-plane bending vibrations of the triazine/heptazine rings, the peak at 885 cm−1 is ascribed to deformation vibrations of the N–H bonds [35,36].
The comparison of the FT-IR spectra before and after their use in photocatalytic NOx oxidation (Figure S2) demonstrated chemical stability of the prepared photocatalysts.
The surface and the total chemical composition determined by XPS and elemental analysis, respectively, are given in Table 2. It can be noted that the composition of all the samples is similar and their C/N atomic ratio ~0.63 is lower than the theoretical 0.75 for g-C3N4 attributed to remaining amino groups due to incomplete polycondensation [24].

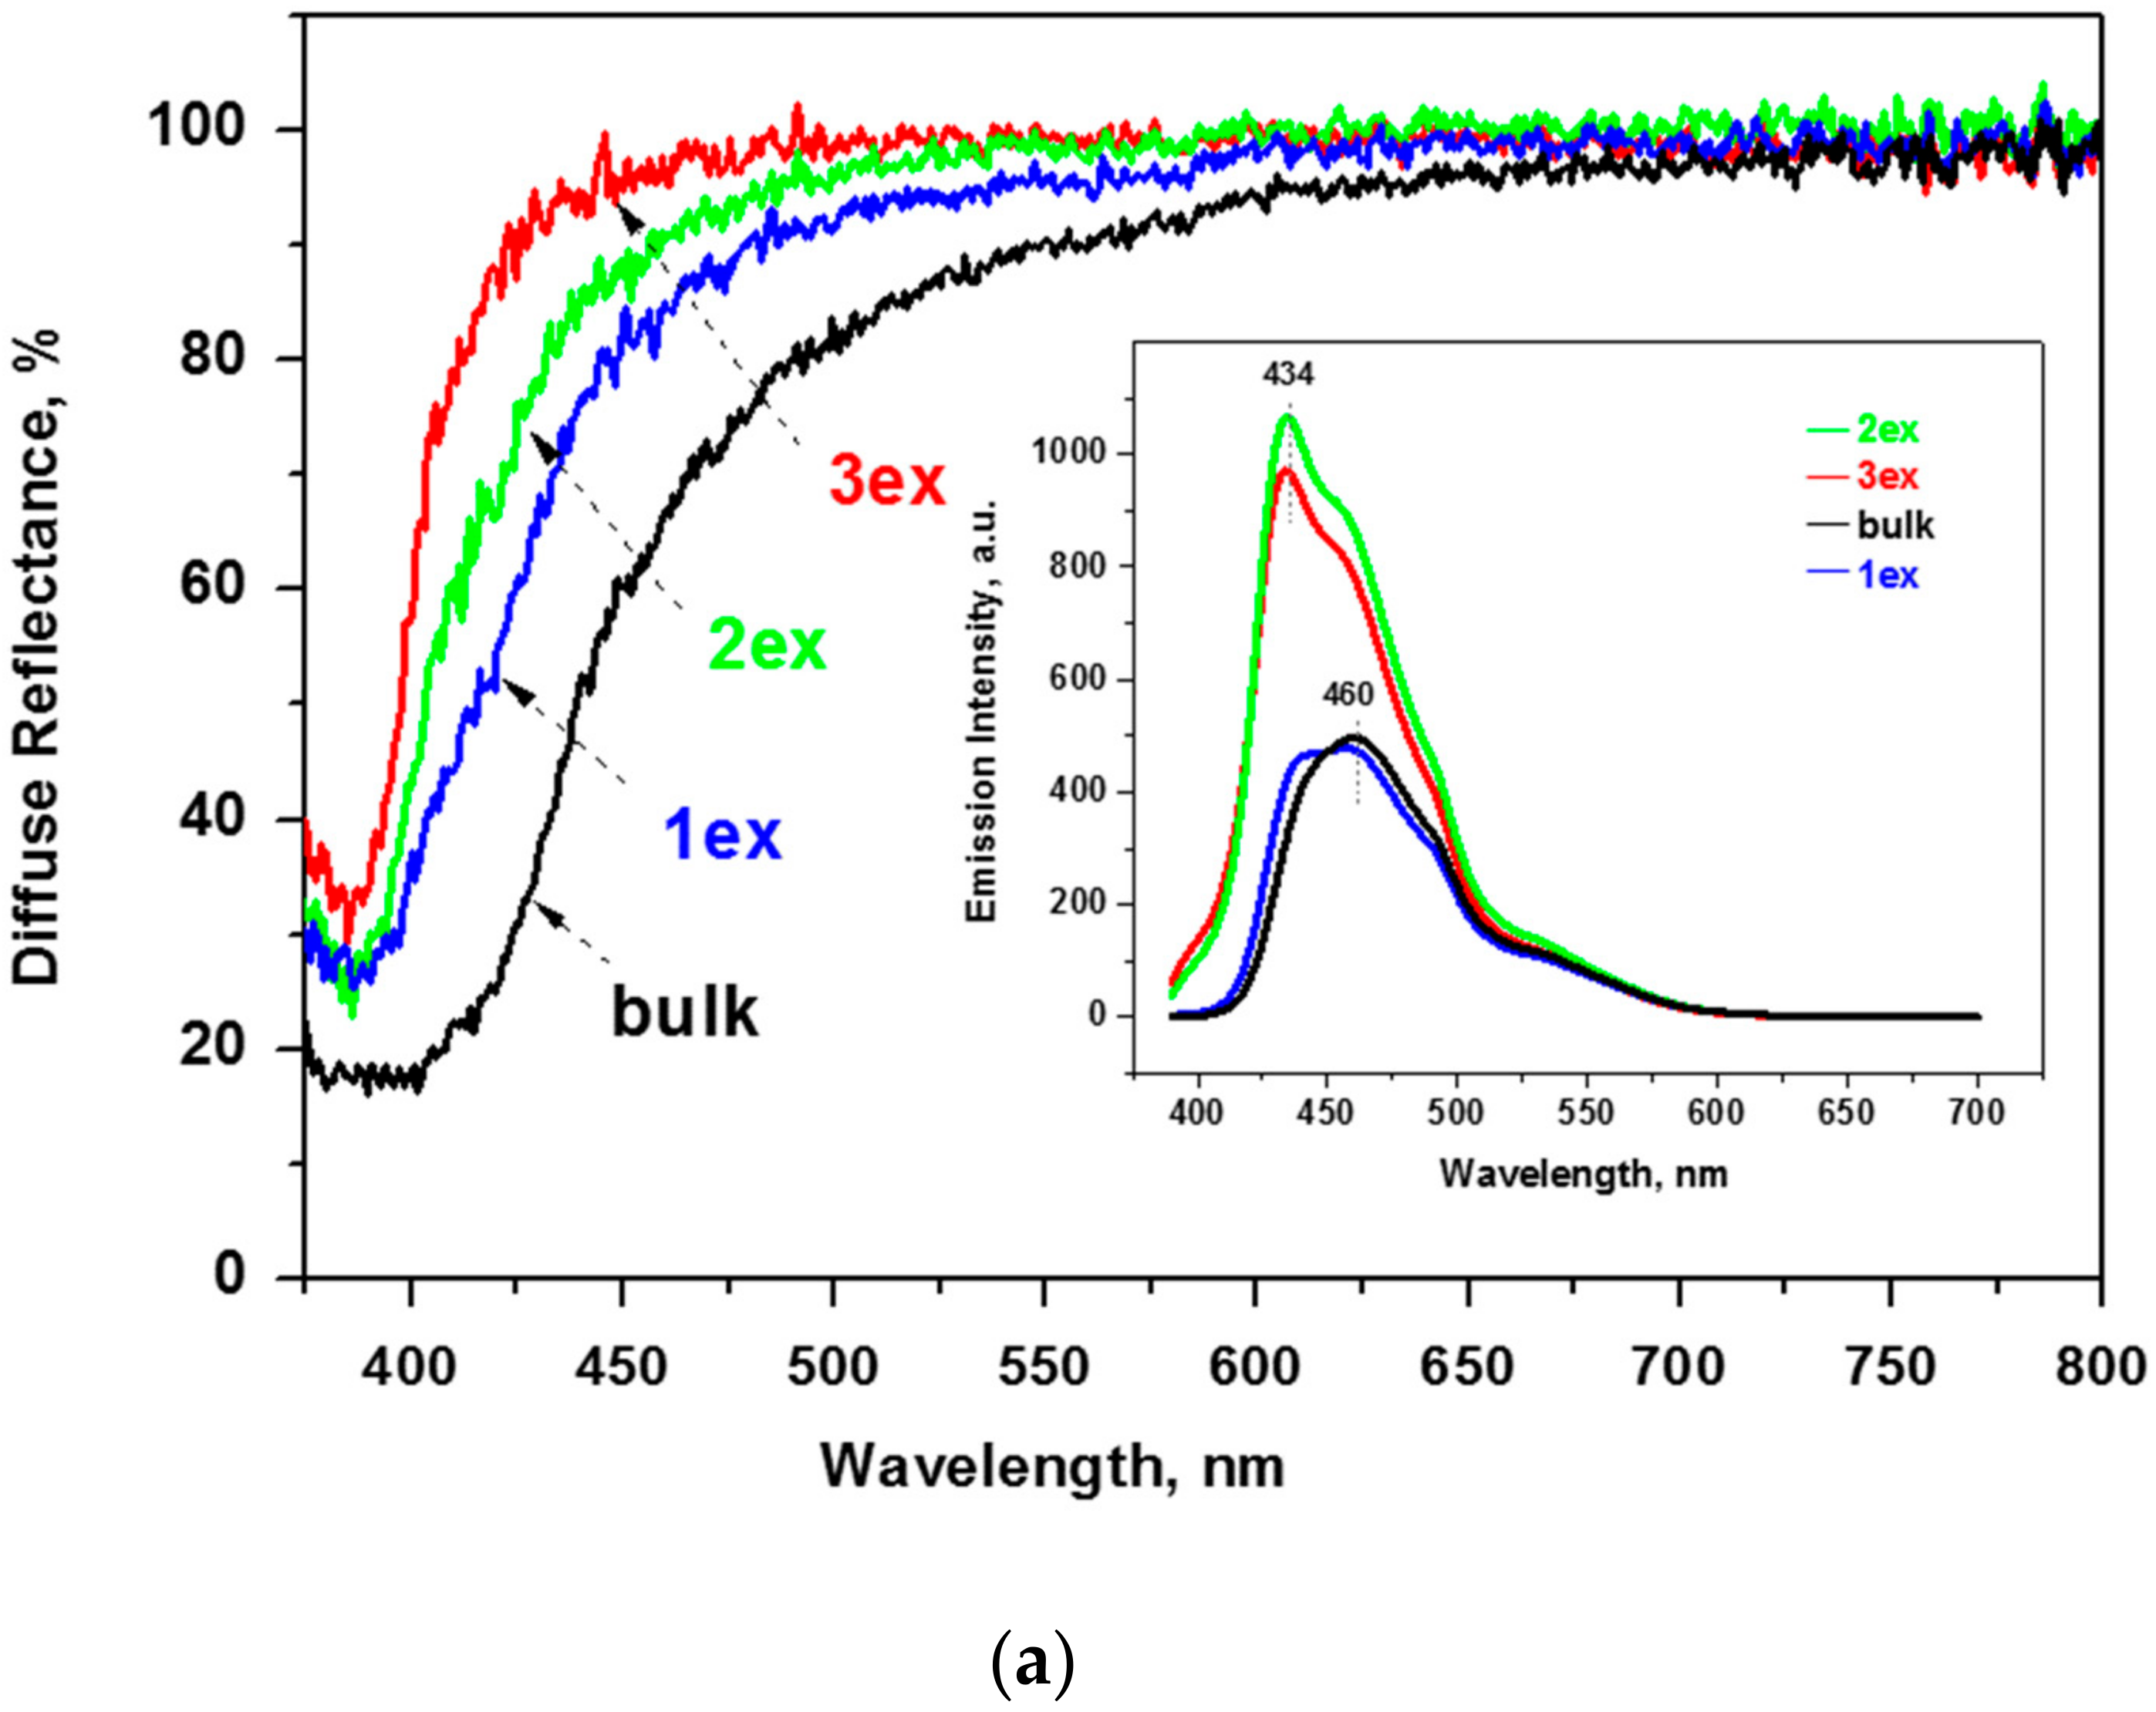
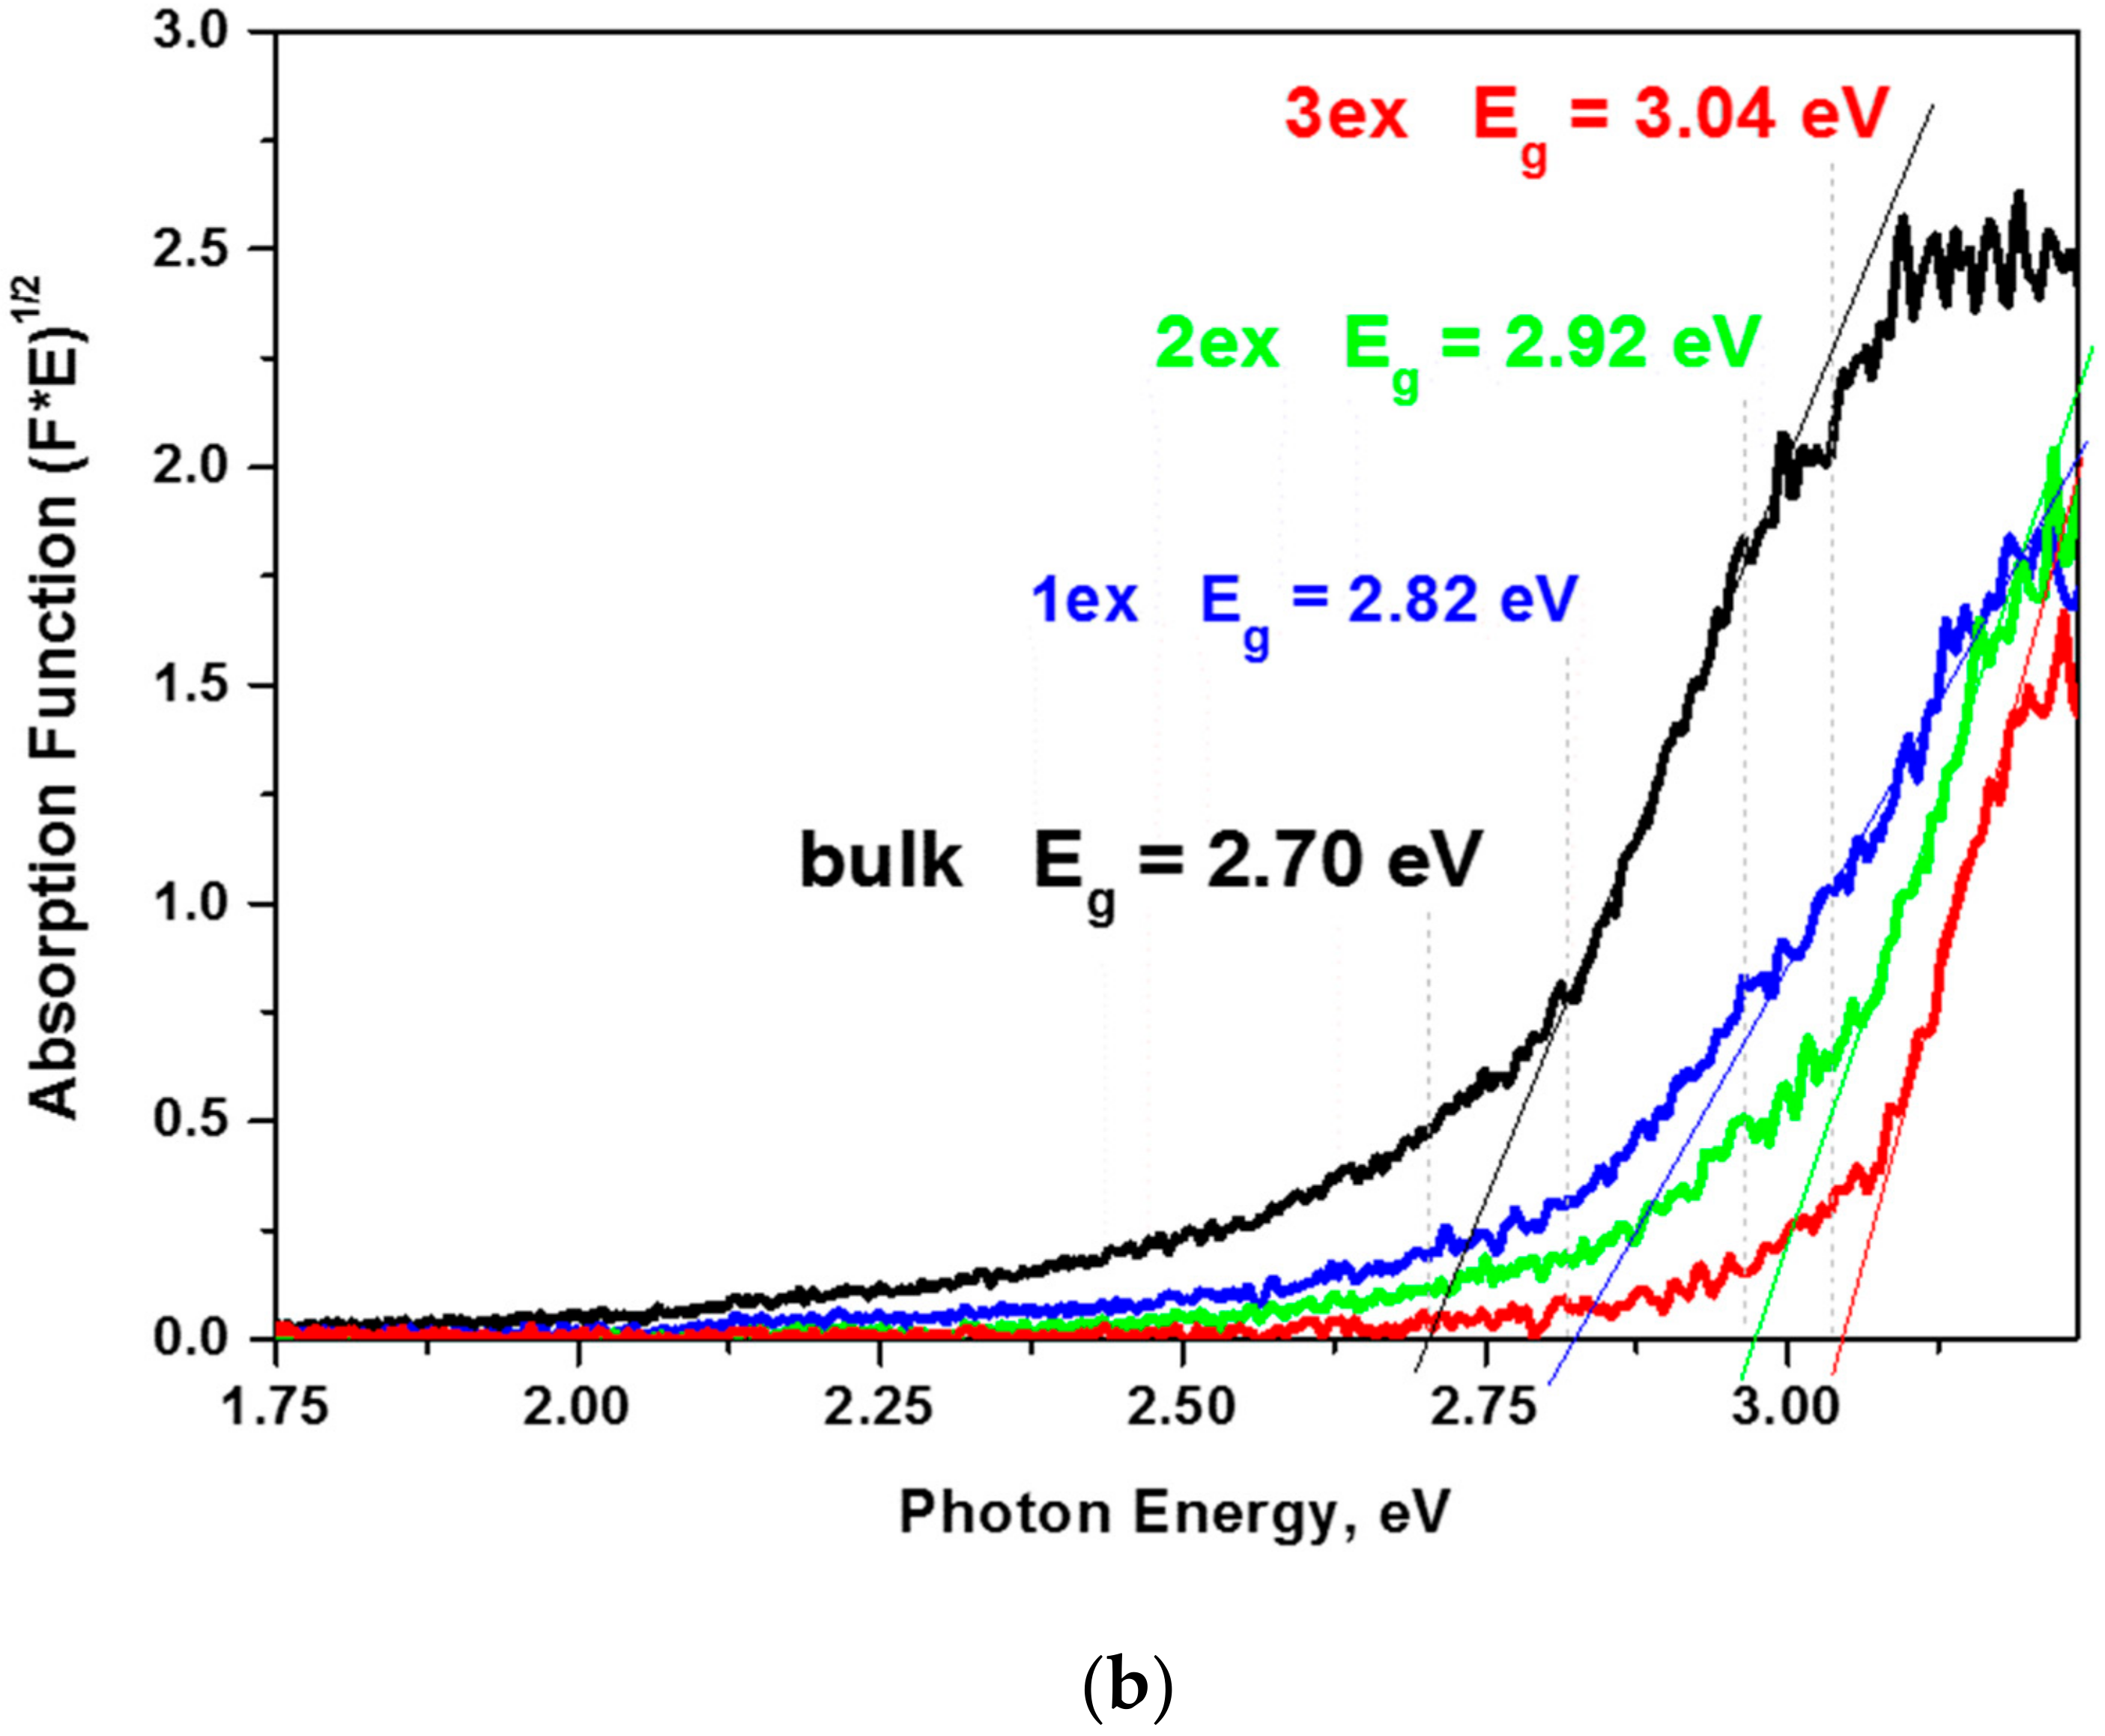
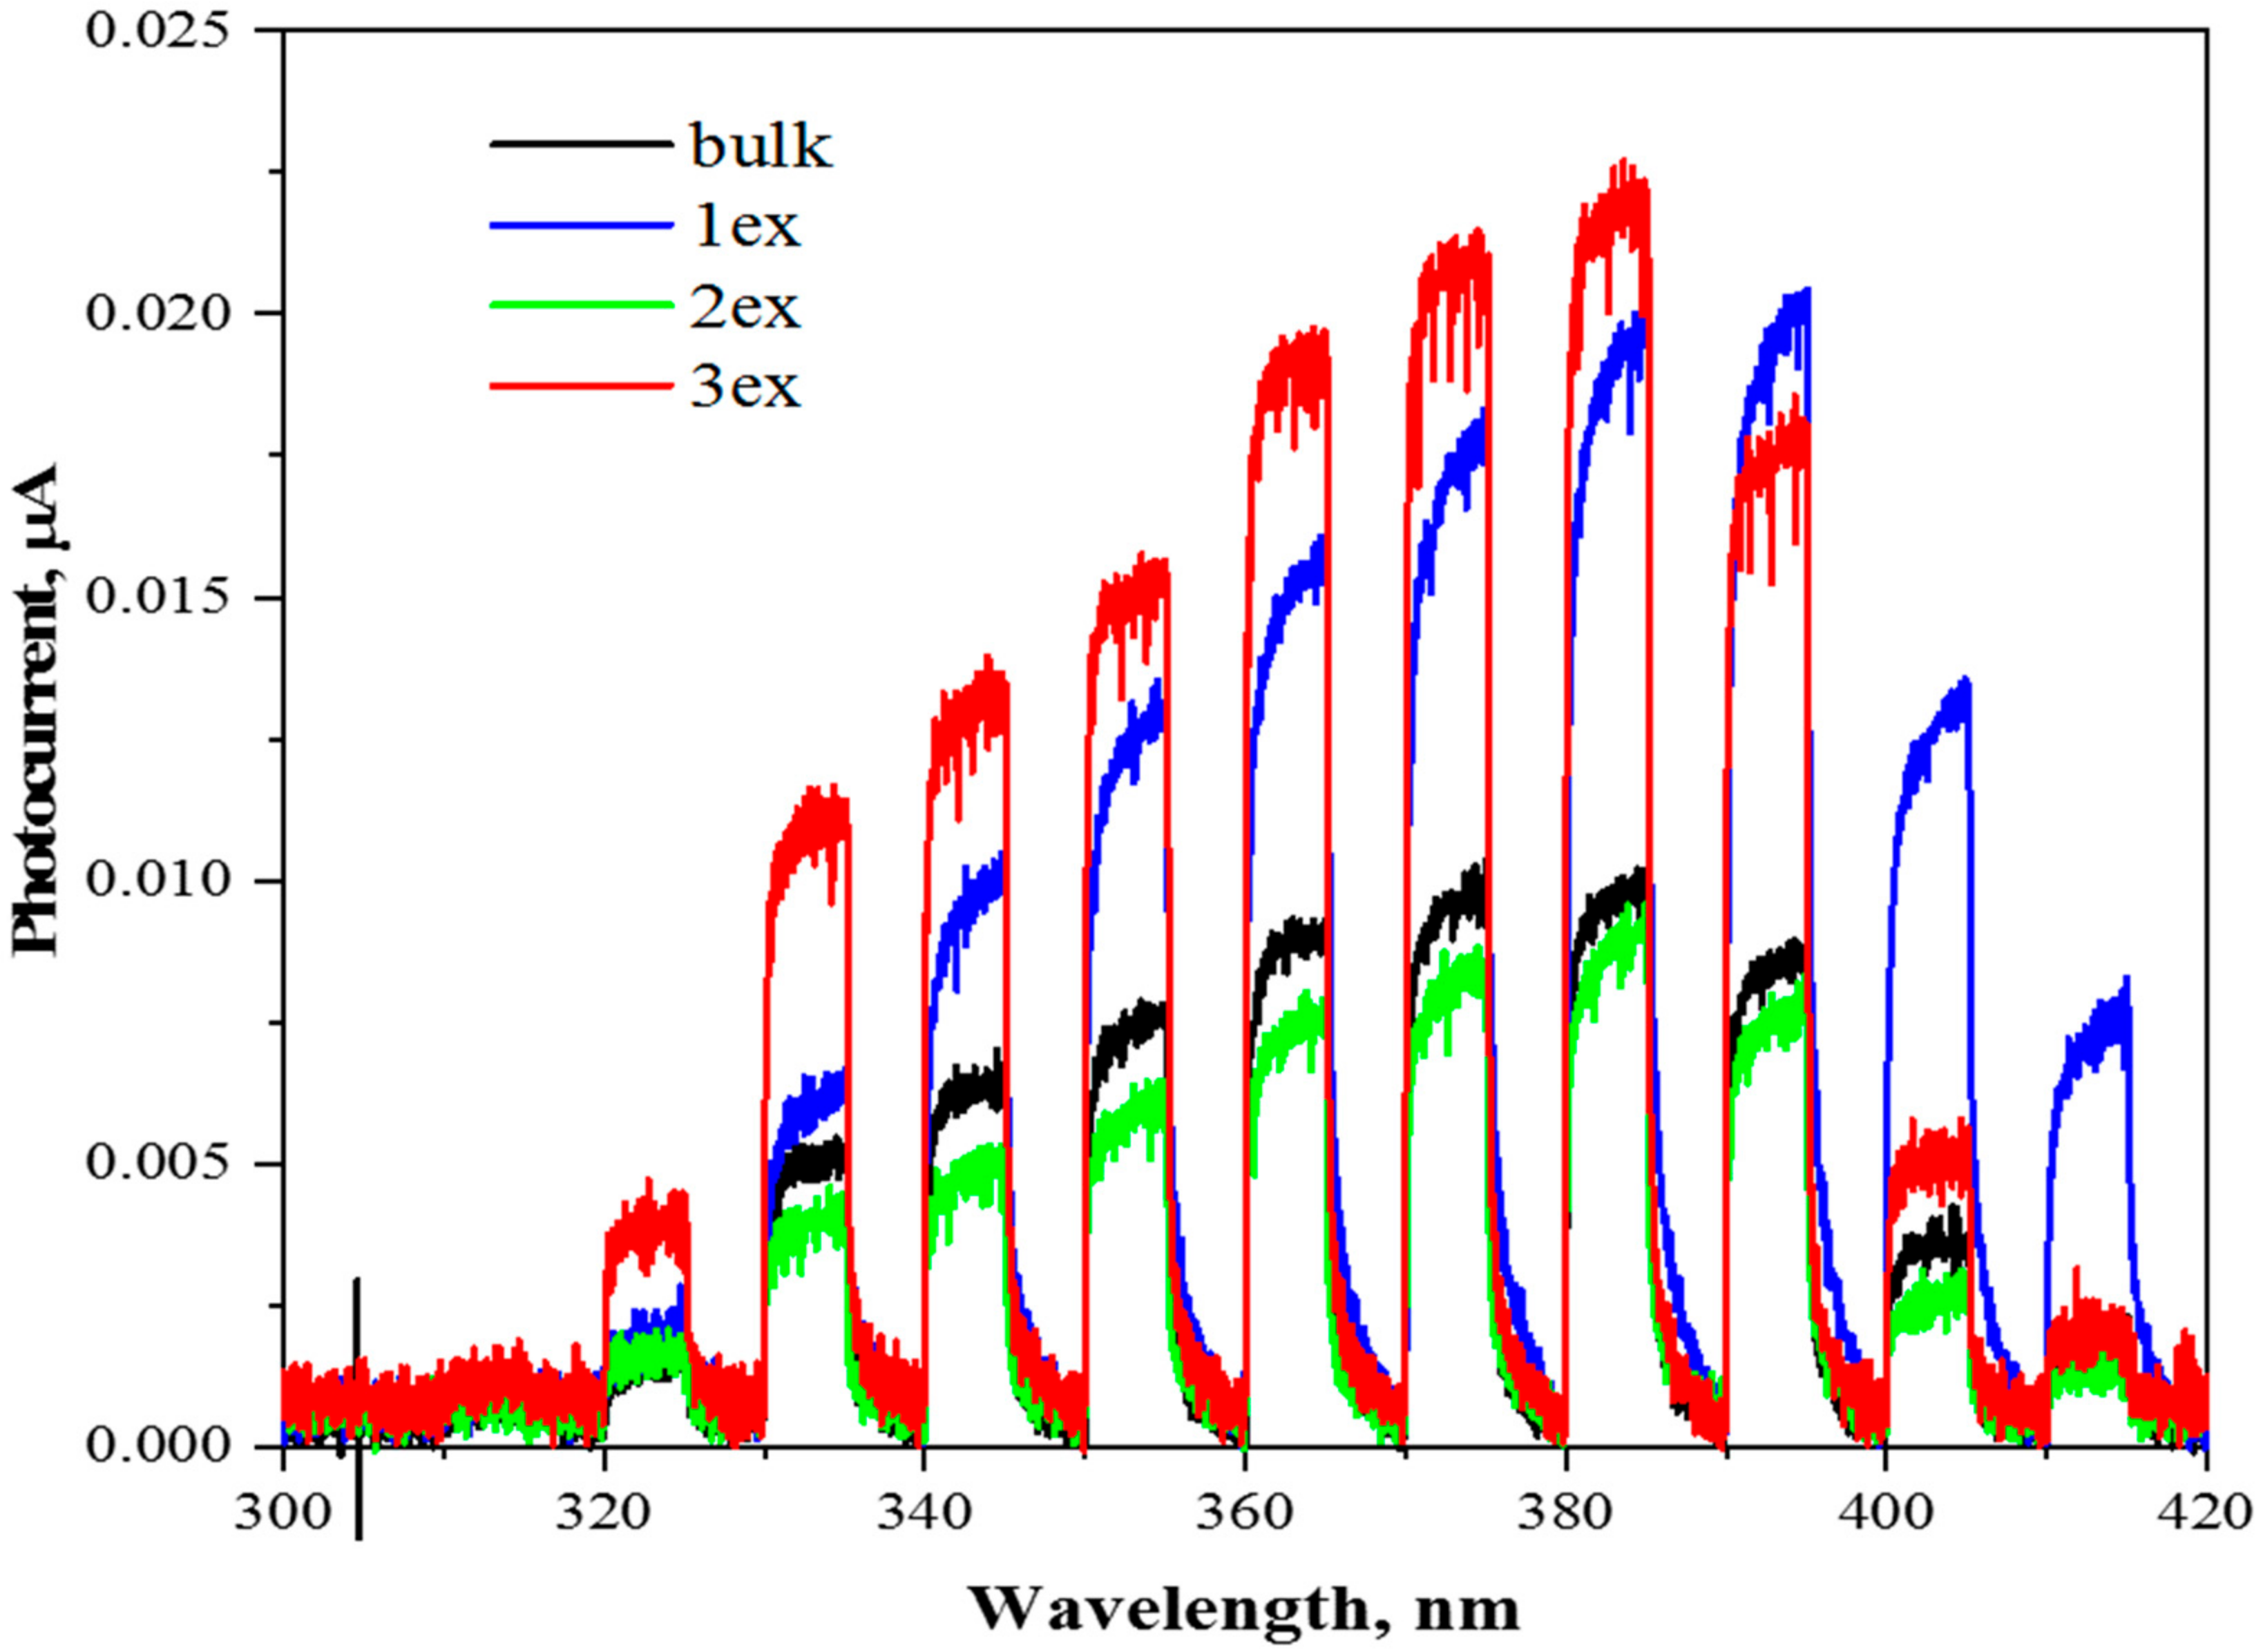
2.1.5. Light Absorbance and Band Gap Characteristics

The diffuse reflectance spectra of the bulk and exfoliated g-C3N4 are depicted in Figure 6a. It can be seen that the reflectance increased with subsequent exfoliations that is consistent with the change of the color from yellow (bulk and 1ex) to white (2ex and 3ex) g-C3N4. In addition, the absorption edge and the main absorbance were shifted to lower wavelength. This phenomenon is known as blue shift and indicates an increase of the band gap energy (Eg) of the semiconductor.
Fluorescence spectroscopy measurements were carried out to evaluate the amount of photoexcited electrons and the radiative recombination degree of the photogenerated electron–hole pair. The observed shifts on the emission maxima (λem) of the samples (see inset of Figure 6a) are in good agreement with the blue shift of the absorption edge of the diffuse reflectance spectra. Specifically, the emission maxima shift from 460 nm for the bulk and the 1ex samples to 434 nm for the 2ex and 3ex. The 460 nm peak can be still seen as a shoulder in the highly exfoliated samples, implying a complex emission mechanism with two different dominant relaxations. The two different peaks are more prominent at the 1ex sample and became less pronounced as the exfoliation proceeded. In accordance to the lower reflectance of the exfoliated samples, their emission is also increased. In order to evaluate the photon emission of each sample, the fluorescence spectra were integrated for the emission range of 390–607 nm. The ratio of the area (denoted as A) between the samples and the bulk, which was used as reference, is: Abulk:A1ex = 0.98, Abulk:A2ex = 0.50,and Abulk:A3ex = 0.55. It should be noted that the amount of the 2ex and 3ex samples necessary to fill the quartz holder was significantly lower compared to the 1ex and bulk samples. Nevertheless, the amount of emitted photons was significantly higher. This was assigned to the increased specific surface area and number of active centers.
The constructed plots from the diffuse reflectance absorption function (E×F)1/2 = f(E) and the linear extrapolation (Figure 6b) demonstrated a significant increase of the Eg from 2.70 eV for the bulk to 3.04 eV for the 3ex g-C3N4. The outcome was related to the quantum confinement effect [19,37] due to the reduced thickness of the stacked layers in the highly exfoliated samples as revealed by the XRD and electron microscopy analyses. The activation of the exfoliated g-C3N4 with higher energy is expected to have a negative effect on the visible light response of the photocatalysts and competes the effect of the increased SSA and porosity.
The position of the band gap edges, namely, the conduction band (CB) and valence band (VB) potentials were determined through electrochemical measurements. In Figure 7a, the Mott–Schottky plots for one frequency (100 Hz) are displayed as measured versus Ag/AgCl electrode at pH 5.8. The conduction band potentials (VCB) were recalculated against normal hydrogen electrode (NHE) at pH 0 using the equation:
VCB ~ VFB (NHE; pH 0) = VFB (Ag/AgCl, pH 5.8) + ΔV + 0.059 × 5.8,
where ΔV = 0.21 V is the Ag/AgCl (3 M) potential against NHE. The valence band potentials (VVB) were found using the equation:
VVB = VCV + Eg/e,
where e is the elementary charge. The values received are listed in Table 3 and schematically presented in Figure 7b.
It is evident that the conduction band potentials were slightly shifted to less negative values from −0.88 V for bulk to −0.77 V for 3ex g-C3N4. Consequently, the distance between the VCB and the O2/·O2 redox potential (−0.33V) was decreased meaning that the reductive power of the photogenerated electrons was decreased and may affect the formation of superoxide (·O2) species. Nevertheless, the formation of ·O2 species remains a spontaneous process since the required potential of −0.33 V was below the VCB. The calculated valence band potentials increased from 1.82 V for bulk to 2.27 V for 3ex g-C3N4. The VVB of the bulk and 1ex samples did not reach the redox potential of OH/·OH (1.99 V) indicating that the photogenerated holes cannot participate in the formation of ·OH. On the contrary, the VVB of 2ex and 3ex are positioned below the 1.99 V meaning that the photogenerated holes can be engaged in ·OH formation and the photocatalytic activity of these samples can be enhanced.

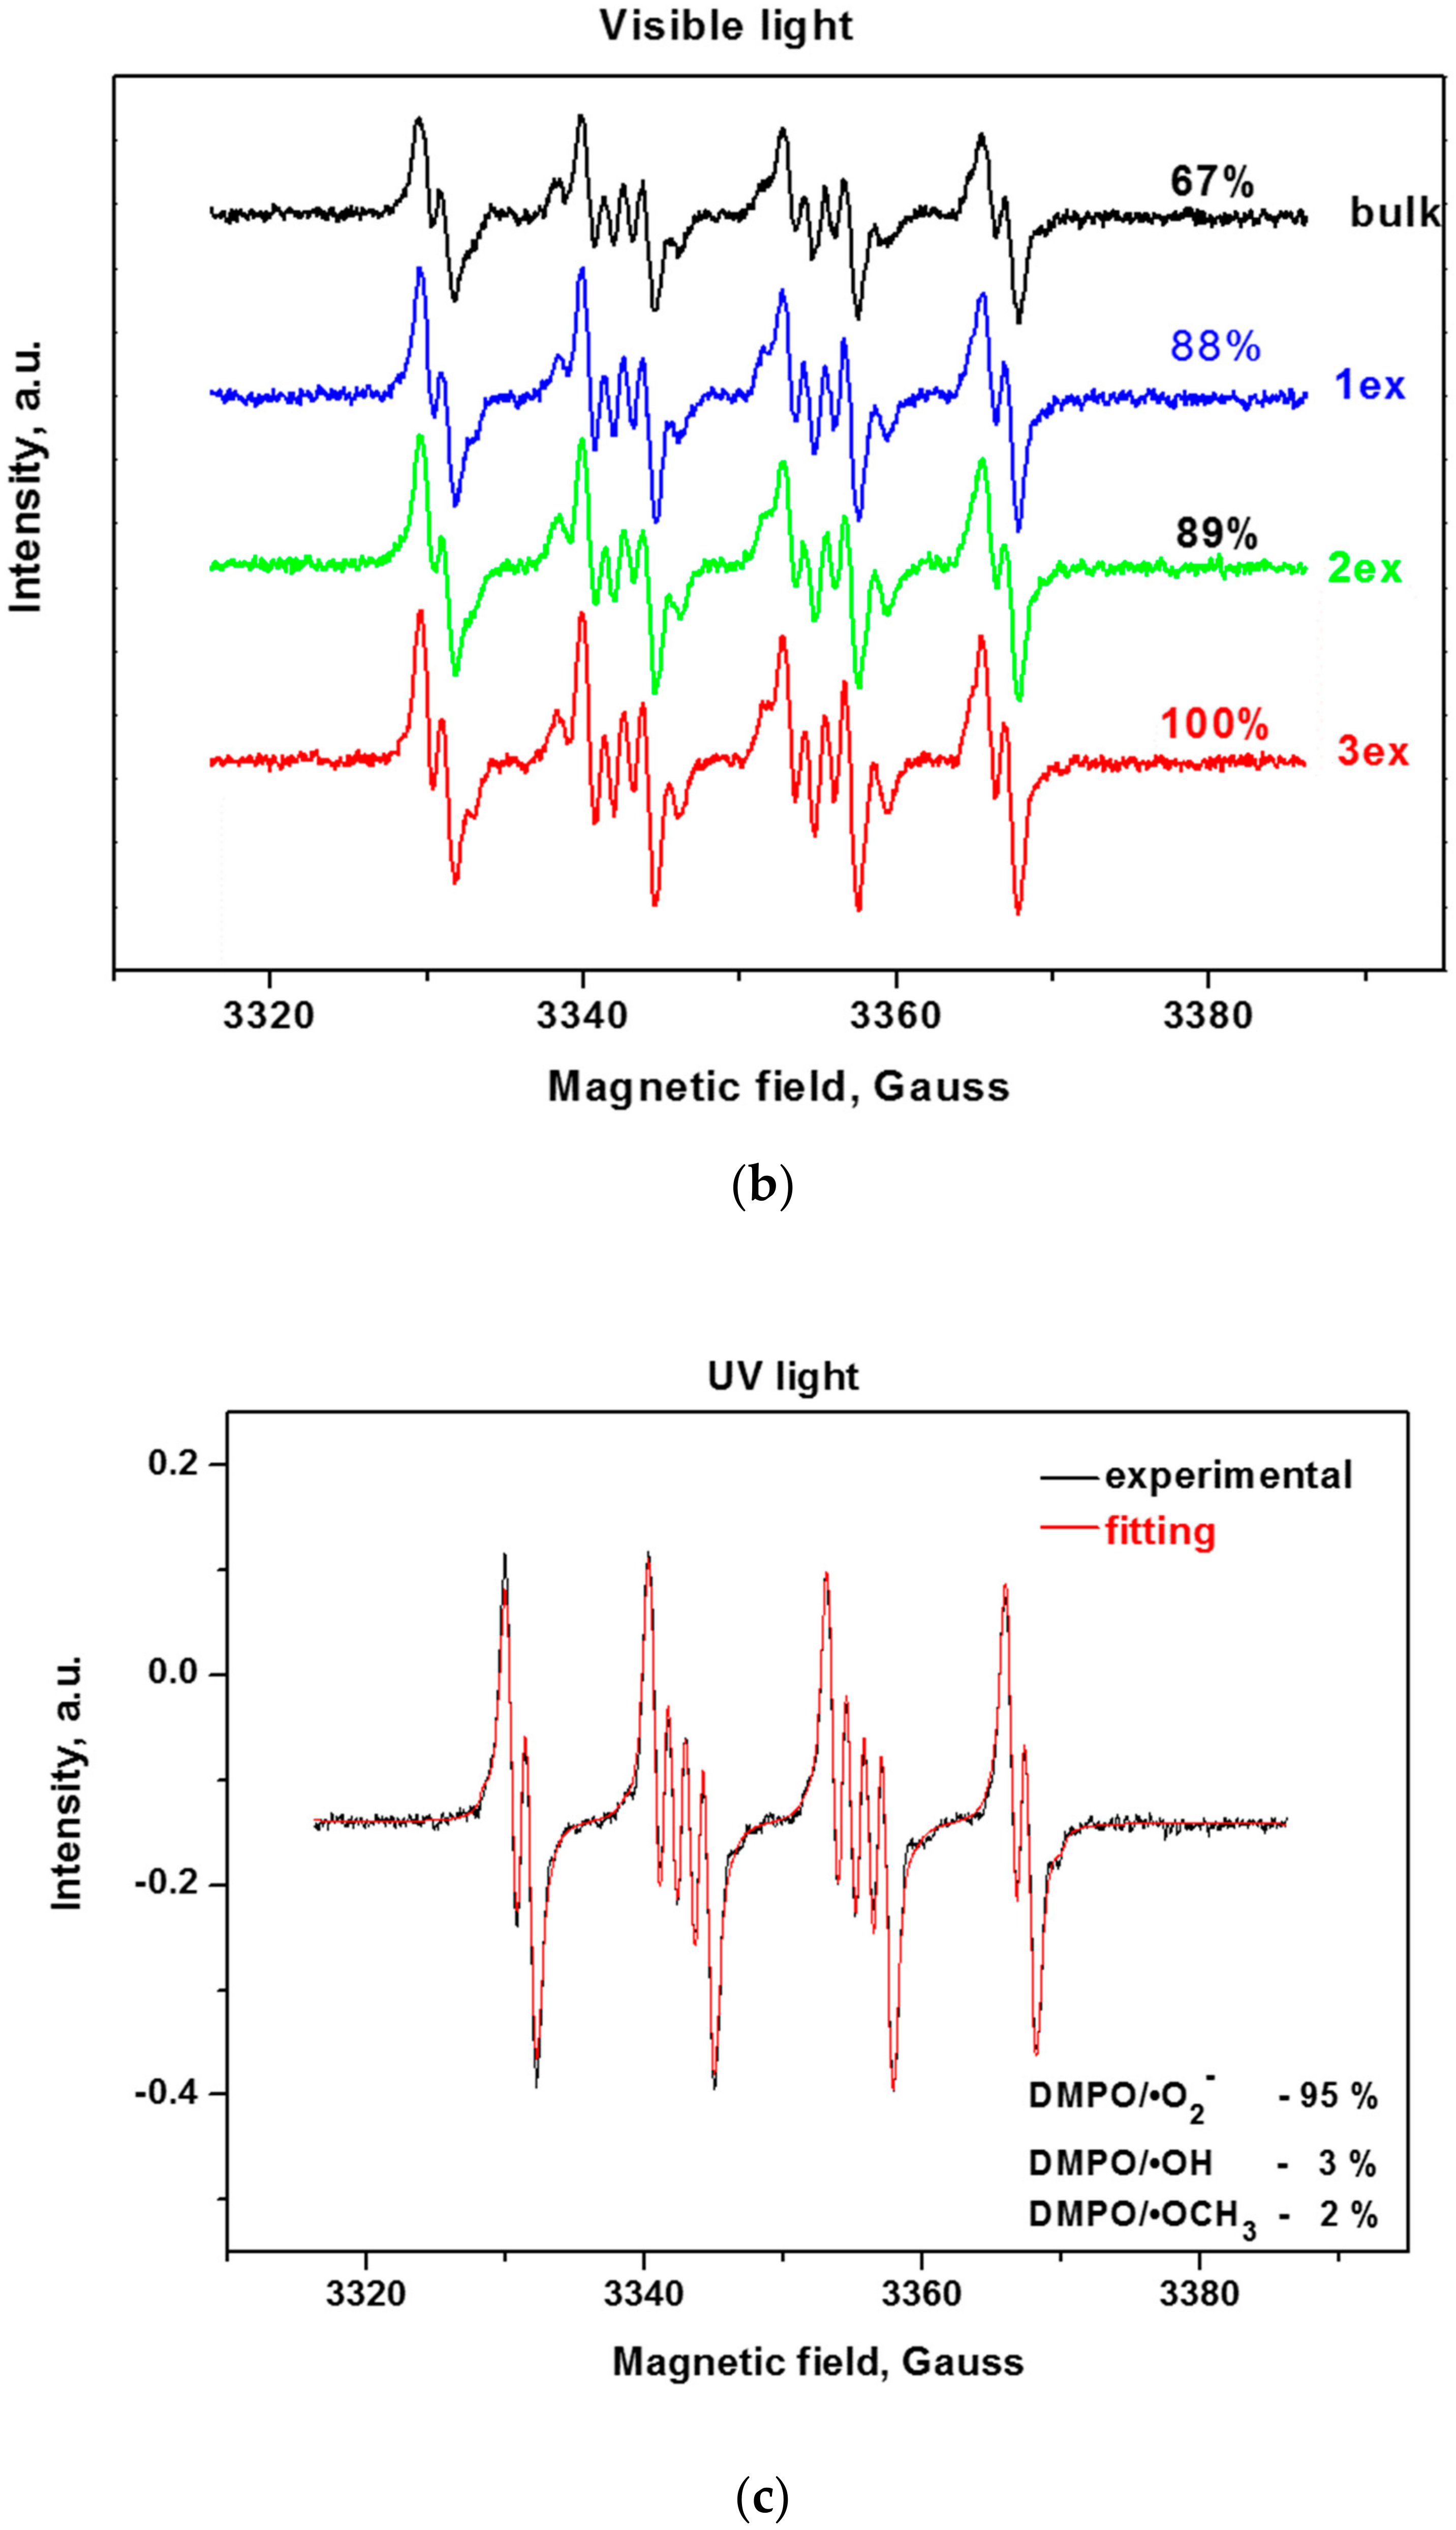
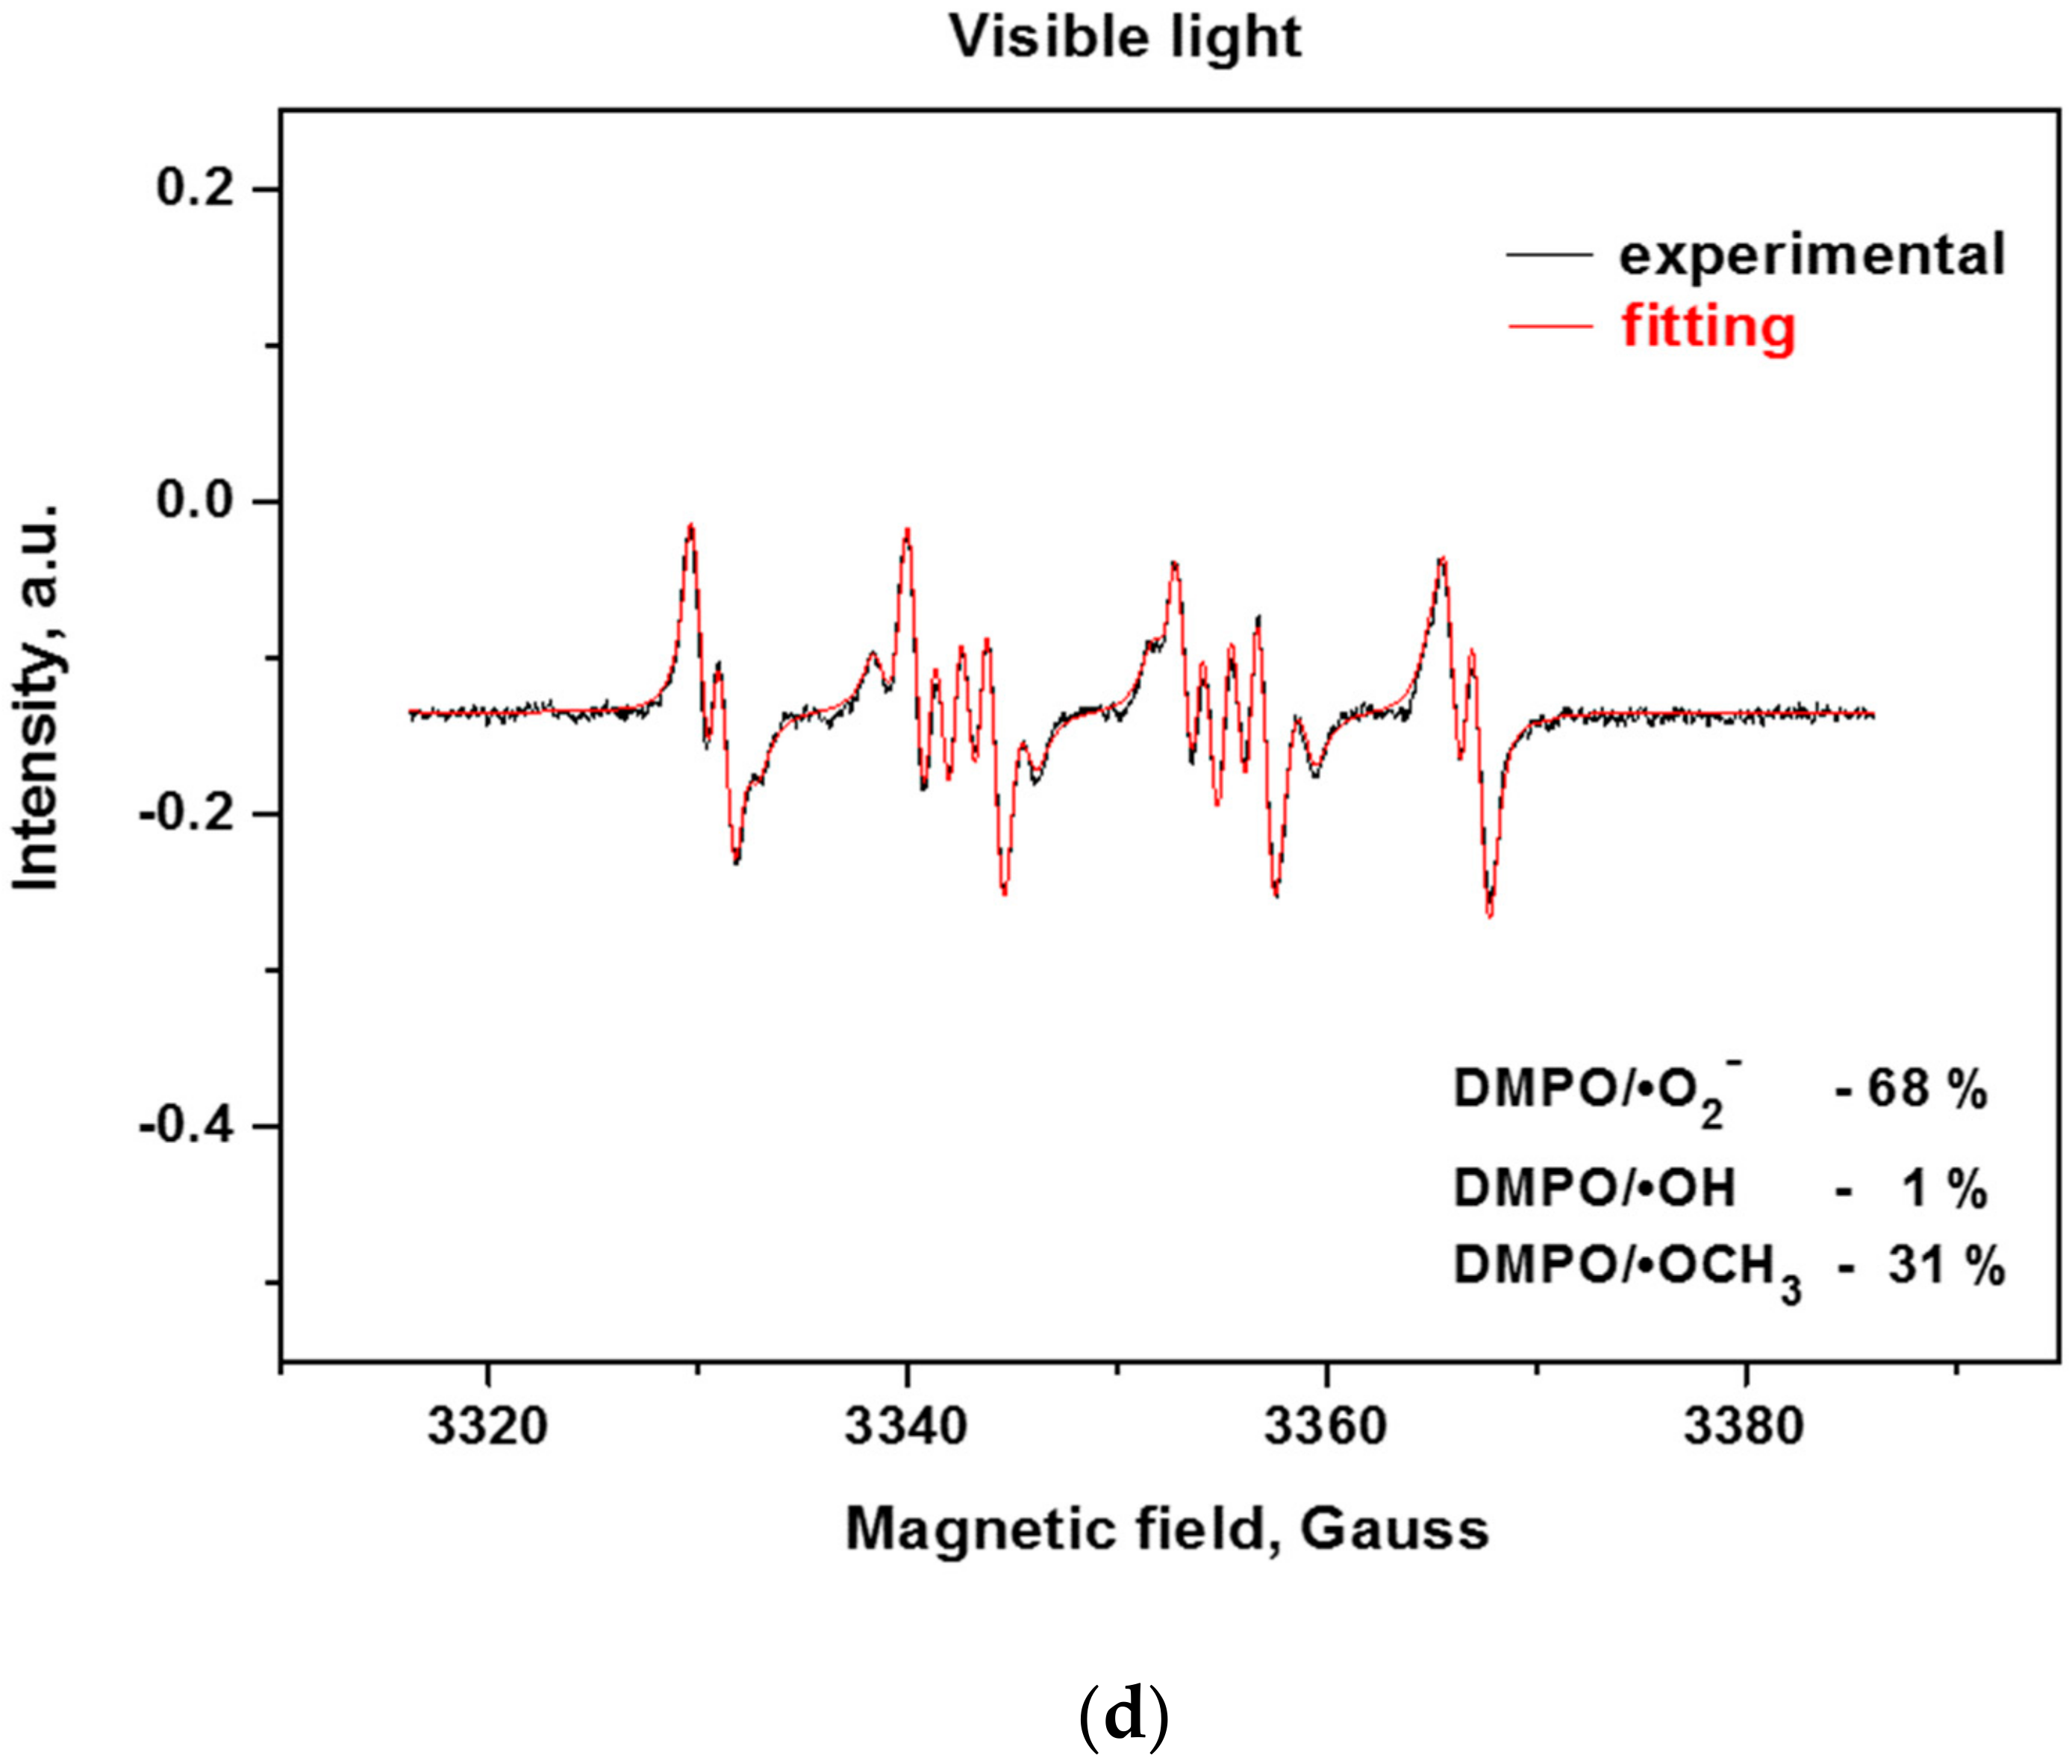
2.2. Active Species Formation

Since the reactive oxygen species (ROS) such as hydroxyl and superoxide radicals are unstable species, their formation upon illumination is measured indirectly by trapping them with the nitrone DMPO (5,5-dimethylpyrroline-N-oxide) to stable, long-lived adducts, which are measurable by EPR (Electron Paramagnetic Resonance) [38,39]. From the EPR spectra of the bulk and exfoliated g-C3N4 (Figure 8a,b), it can be deduced that the successive exfoliation led to a gradual increase of the DMPO adducts under UV and visible light illumination. The identification of the formed ROS for the most active 3ex sample was performed by fitting of the experimental curves with simulated ones (Figure 8c,d). It was found that under UV light illumination, the majority of the formed ROS are superoxide radicals (95%), while the amounts of the hydroxyl (3%) and methoxy (2%) radicals were low. Under visible light, the amount of the superoxide radicals was also the dominant (68%), against the hydroxyl radicals (1%). The recorded amount of methoxy radicals ·OCH3 was ascribed to the reaction of the created superoxide radicals with the acetonitrile from the systemas documented in the literature for various photocatalysts [40,41]. The observed dominance of the superoxide radicals against the hydroxyl radicals is in agreement with the results from the electrochemical analysis.
Photocurrent measurements were conducted in order to estimate the amount of generated charge carriers in the photocatalysts (Figure 9). Although the amount of generated photocurrent does not reflect the photocatalytic activity of the measured photocatalyst, the results can provide a certain insight into the process itself. Since the photocurrent generation was measured in the presence of external potential applied to the working electrode, the generated electrons were “forced” to migrate to the ITO foil and the recombination of charge carriers was significantly suppressed. Therefore, the photocurrent generation can be used for the comparison of the amount of generated charge carriers (recombination is suppressed and electrons are measured in the form of current). For example, samples 1ex and 3ex provide similar photocurrent around 380 nm, however, their photocatalytic activity in photocatalytic hydrogen production and photocatalytic reduction of CO2 is very different.
The results are pointing toward significantly improved charge separation in case of 3ex sample. Both samples, 1ex and 3ex, had approximately the same amount of charge carriers after irradiation, but much more electrons and holes were used for the reaction itself in case of 3ex sample.

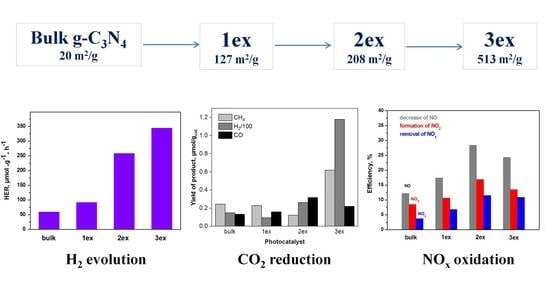
2.3. Photocatalytic Activity

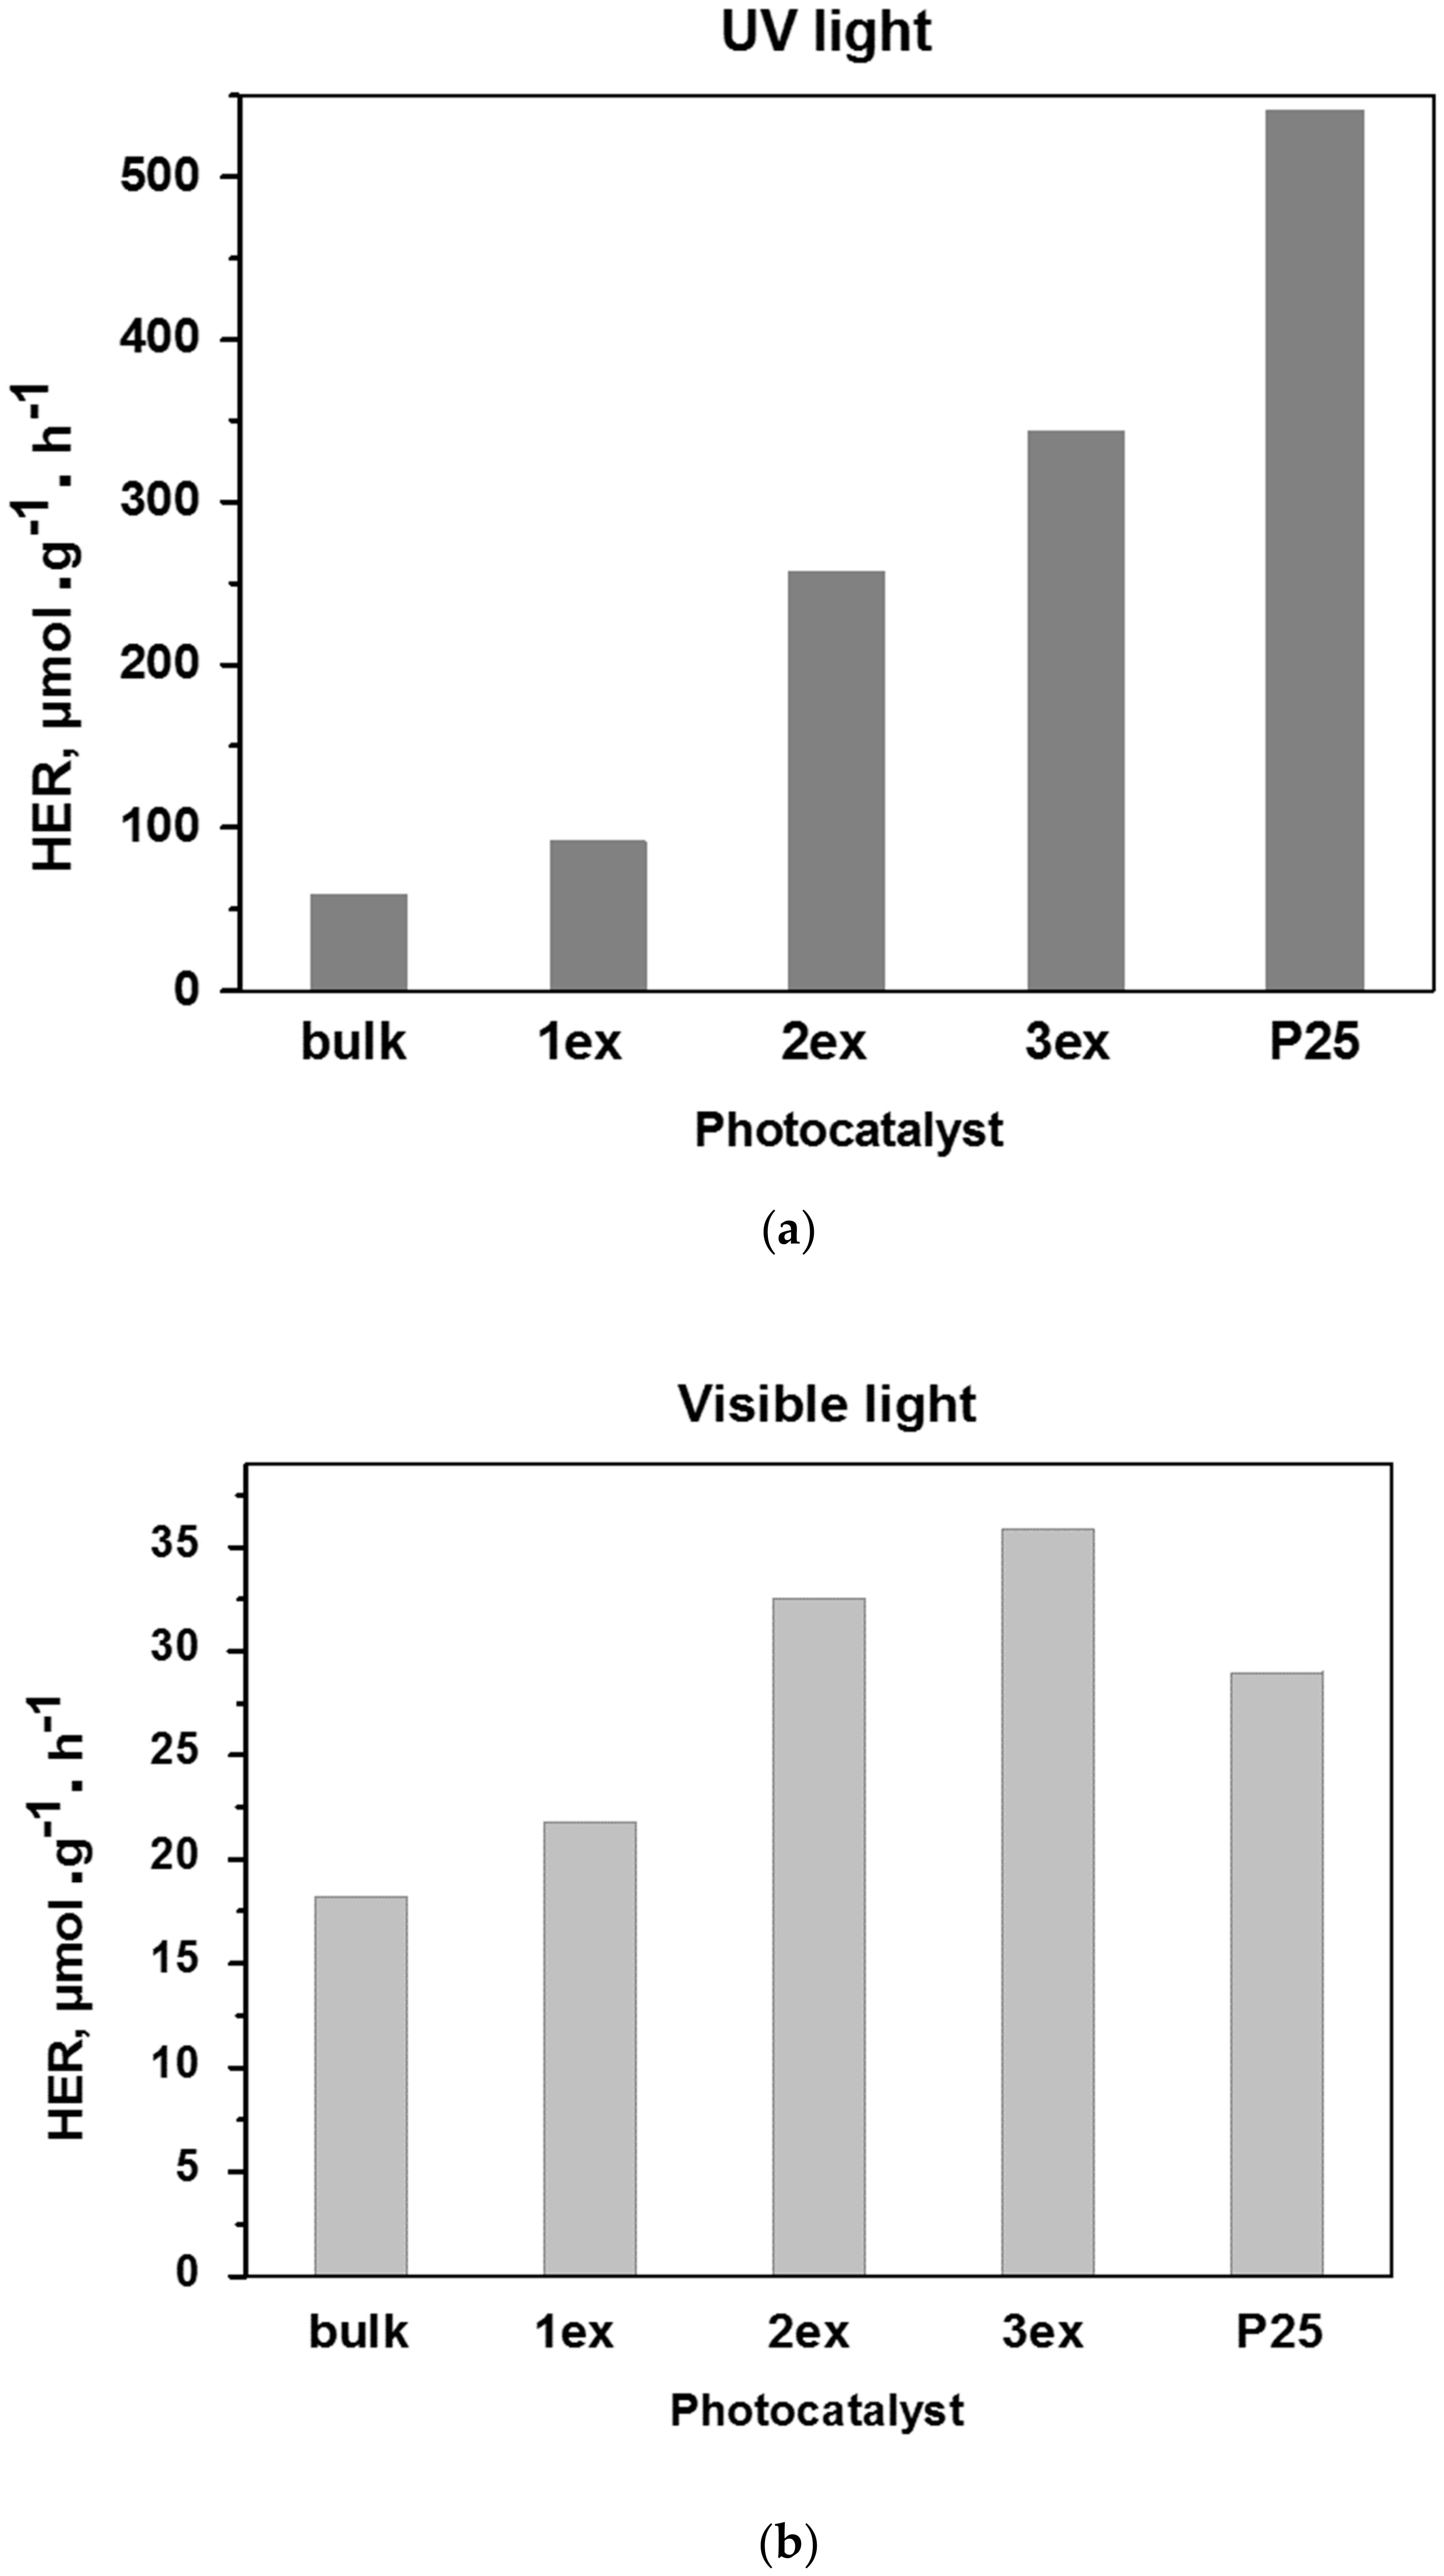
2.3.1. Photocatalytic H2 Production

The experimental H2 concentration curves recorded under UV and visible light are given in the Supplementary Material (Figure S3), whereas the calculated H2 evolution rates of the samples in μmol·g−1·h−1 are presented in Figure 10. It can be noticed that the activity increased gradually with the increase of the exfoliation number. Under both UV and visible light, the exfoliated (1ex, 2ex and 3ex) g-C3N4 exhibited significant increase in H2 evolution in comparison to the bulk. The increase was very prominent under UV light where the activity of the 3ex (343.81 μmol·g−1·h−1) was ~6 times higher than bulk (58.54 μmol·g−1·h−1) and ~3.7 times higher than the activity of 1ex (91.52 μmol·g−1·h−1). The significant increase of the H2 evolution was attributed to the increased porosity and surface area that are important for the mass (reagents and products) transport and provided active sites for the redox reactions. The increased formation of the superoxide radicals correlates well with the recorded activity as well. According to the mechanism given in the literature [42,43], the sacrificial agent TEOA reacts with the photogenerated holes (h+), while the photogenerated electrons (e) are transferred to the Pt sites where the H+ are reduced to H2. Under visible light, the H2 evolution of 3ex reached the value 35.86 μmol·g−1·h−1 that is ~2 times higher than bulk (18.23 μmol·g−1·h−1). The lower impact of the exfoliation on the visible light activity is attributed to the limited light absorption due to widening of the band gap from 2.70 eV (bulk) to 3.04 eV (3ex). The activity of the exfoliated g-C3N4 under UV light did not reach the activity of the typical UV photocatalysts P25 (541.05 μmol·g−1·h−1), but overcome its activity (28.98 μmol·g−1·h−1) under visible light. It should be mentioned that despite the large band gap of P25, visible light activity has been reported [15,44,45] that can be related to its specific phase and element composition.

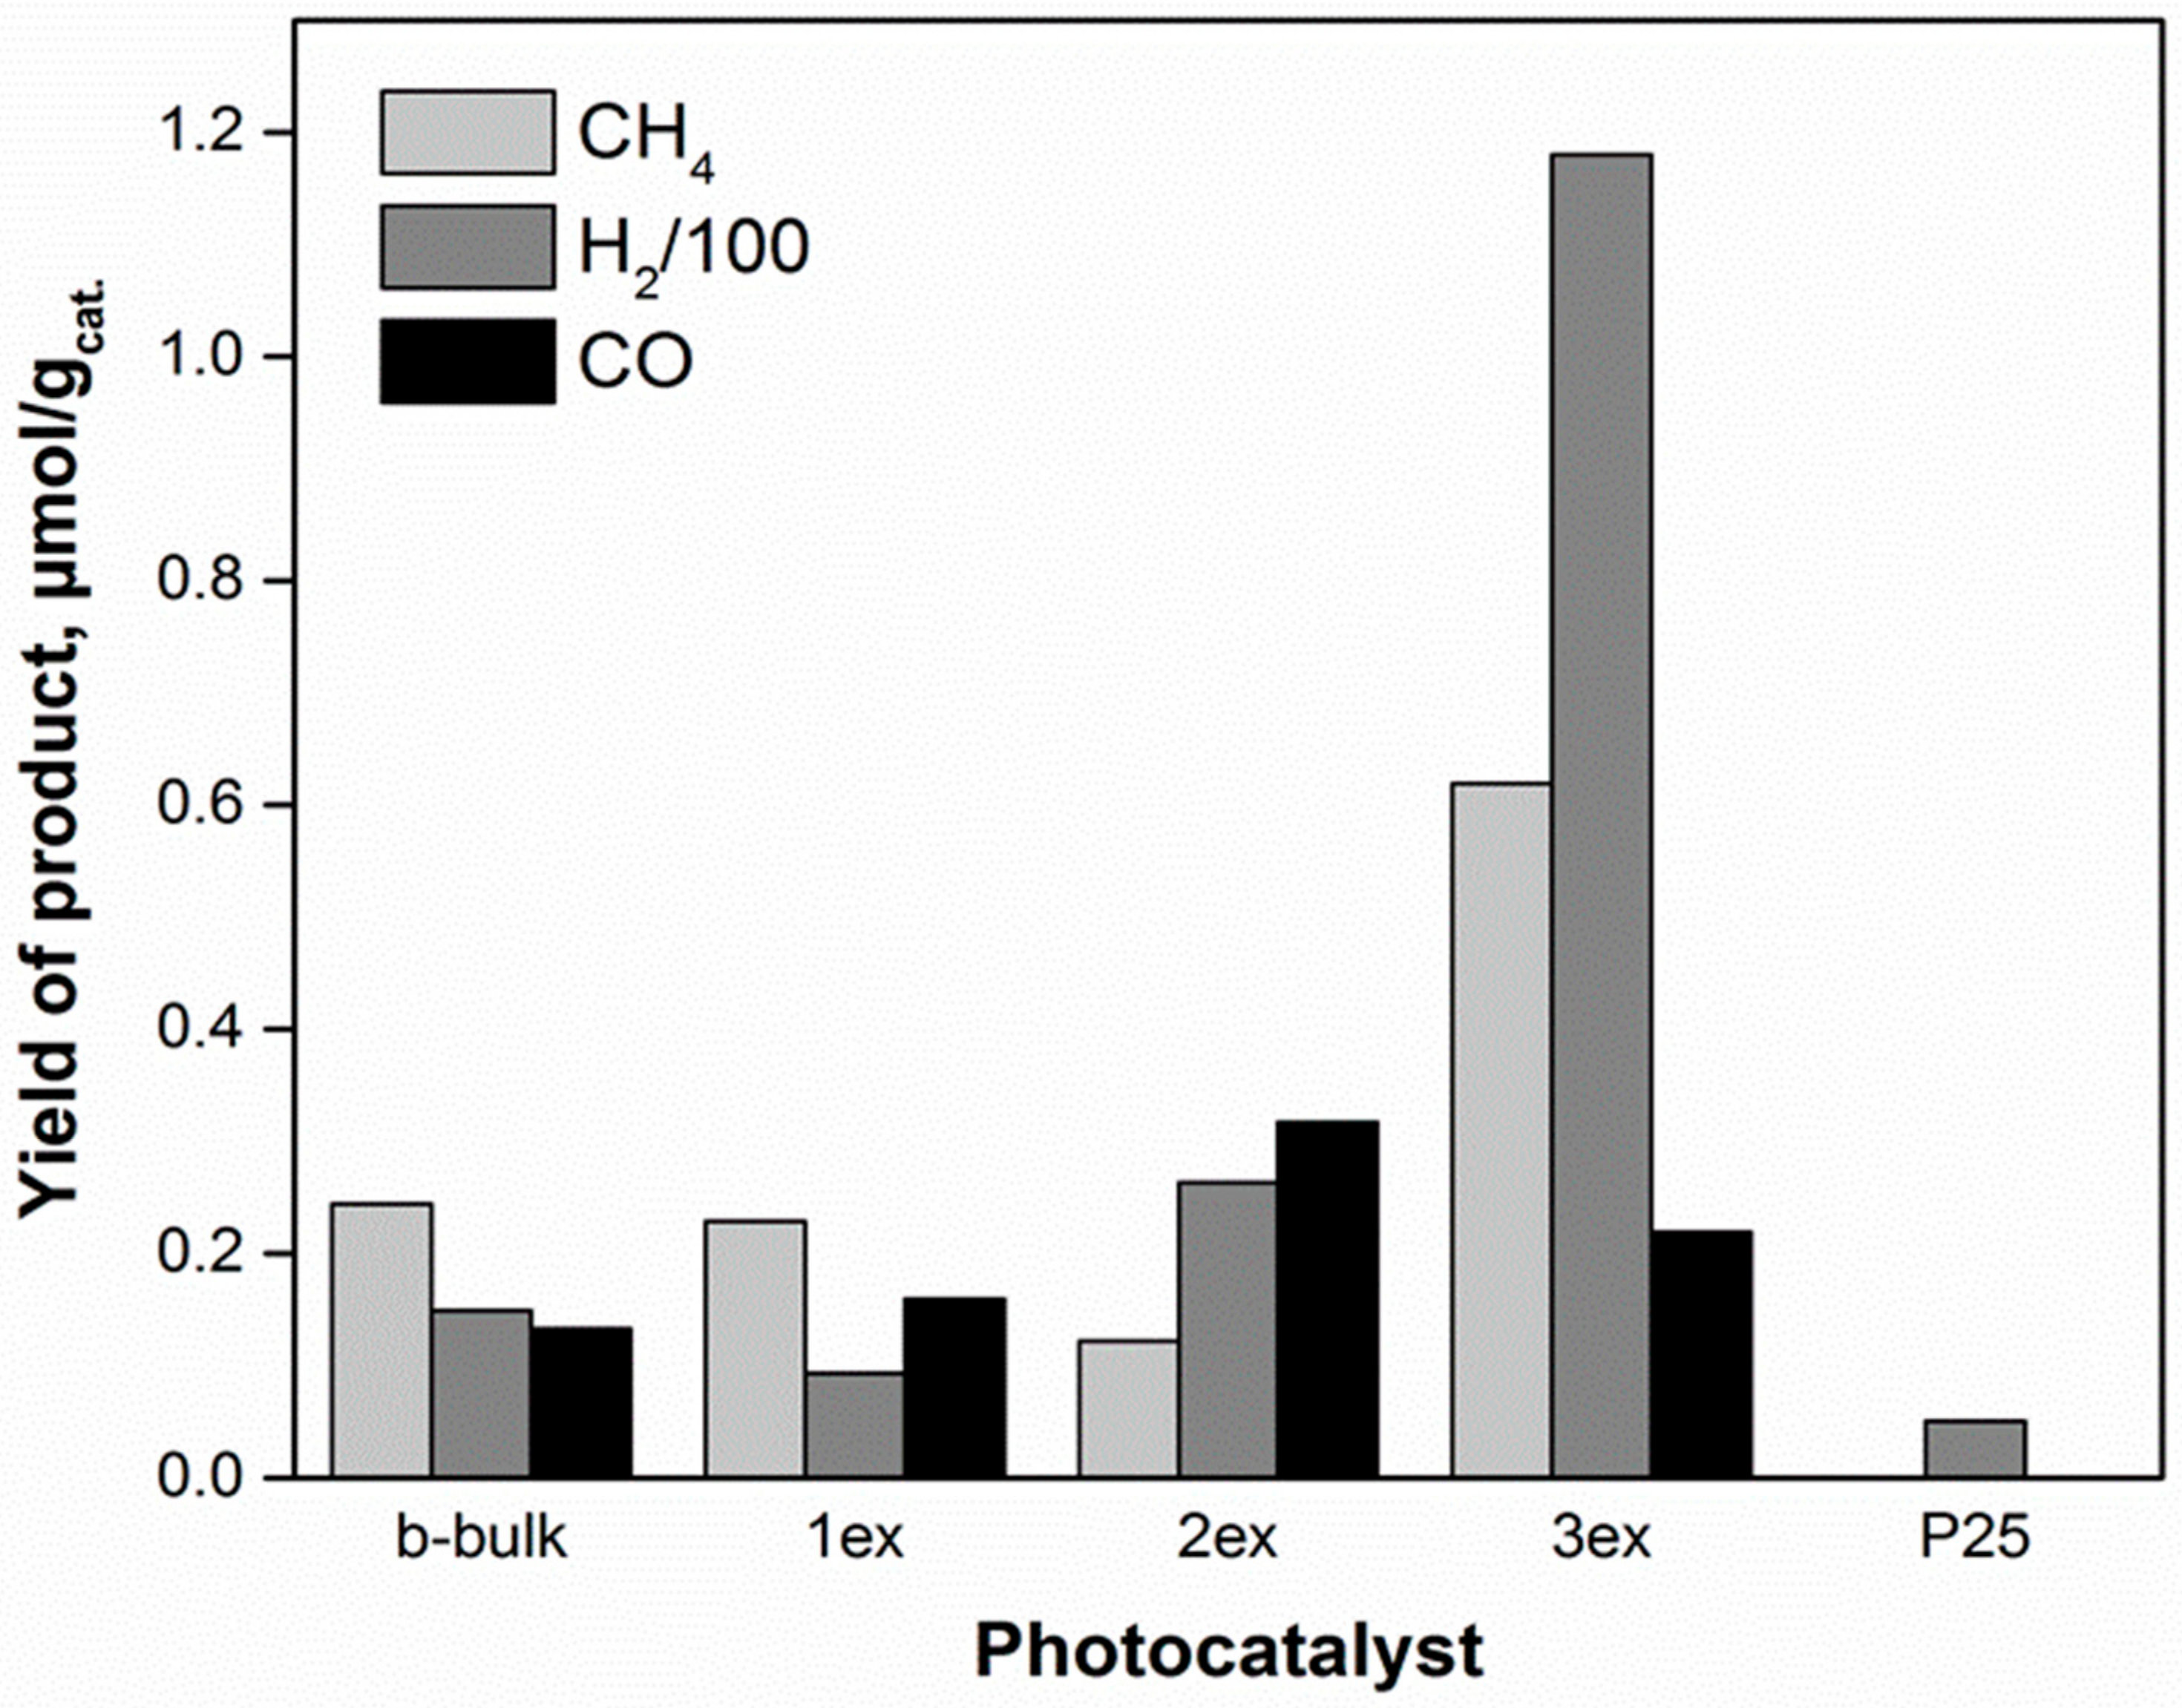
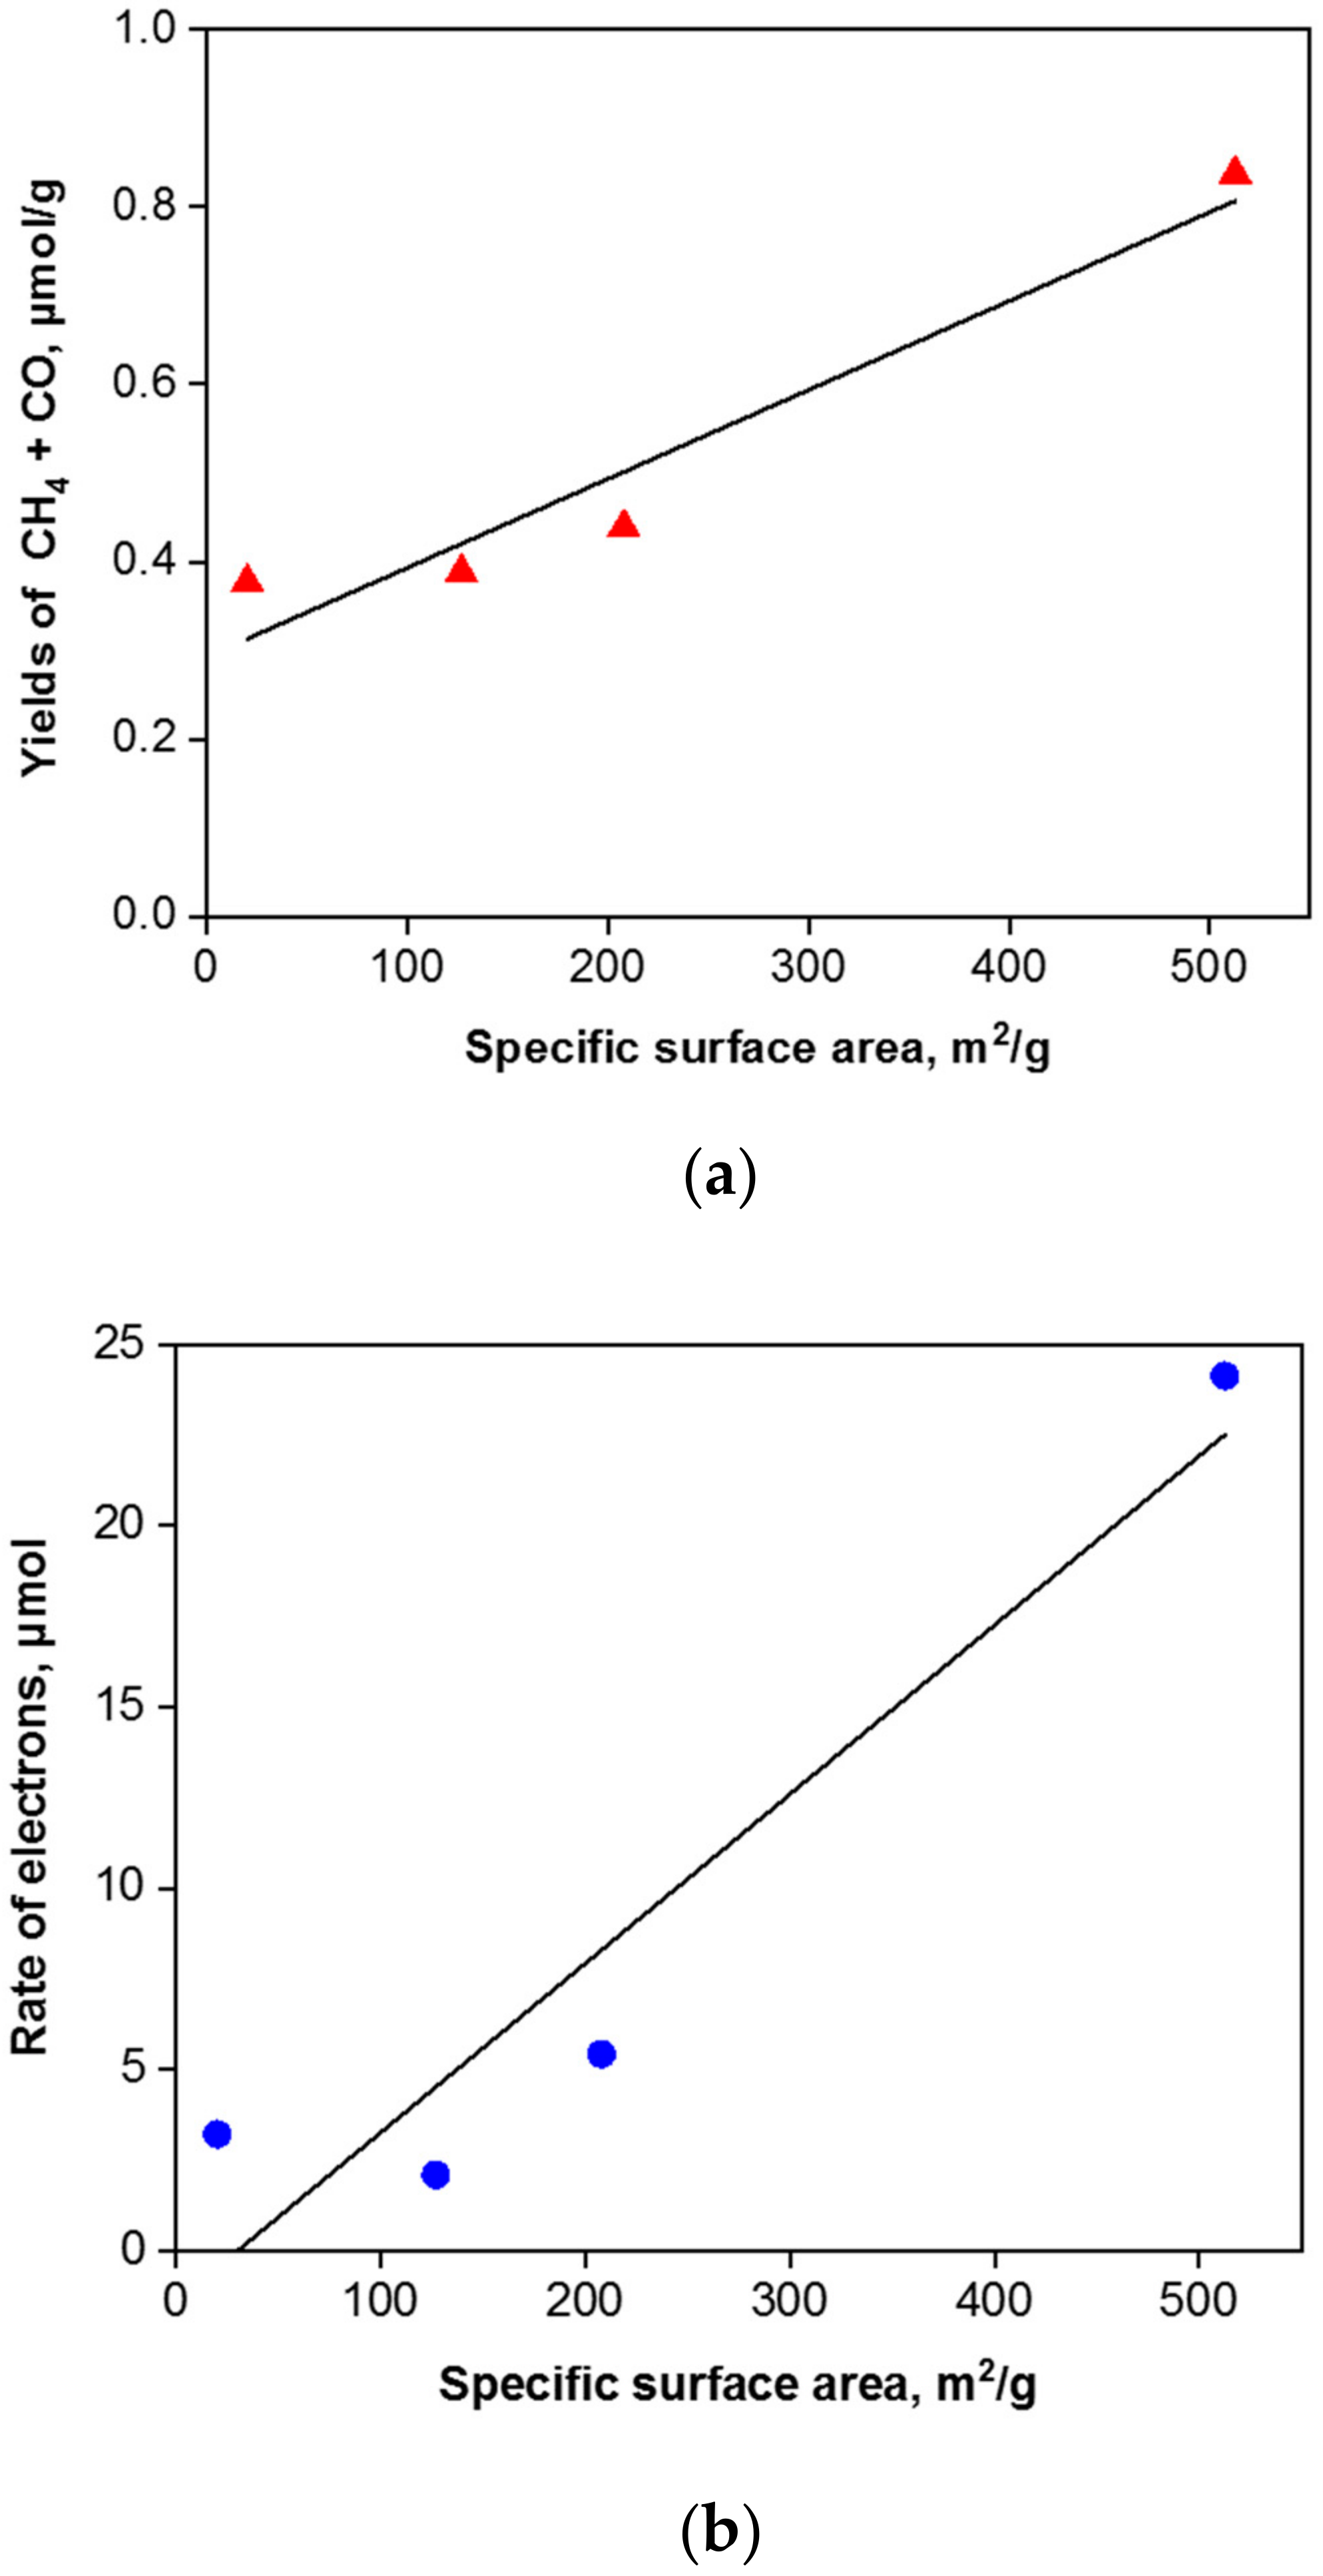
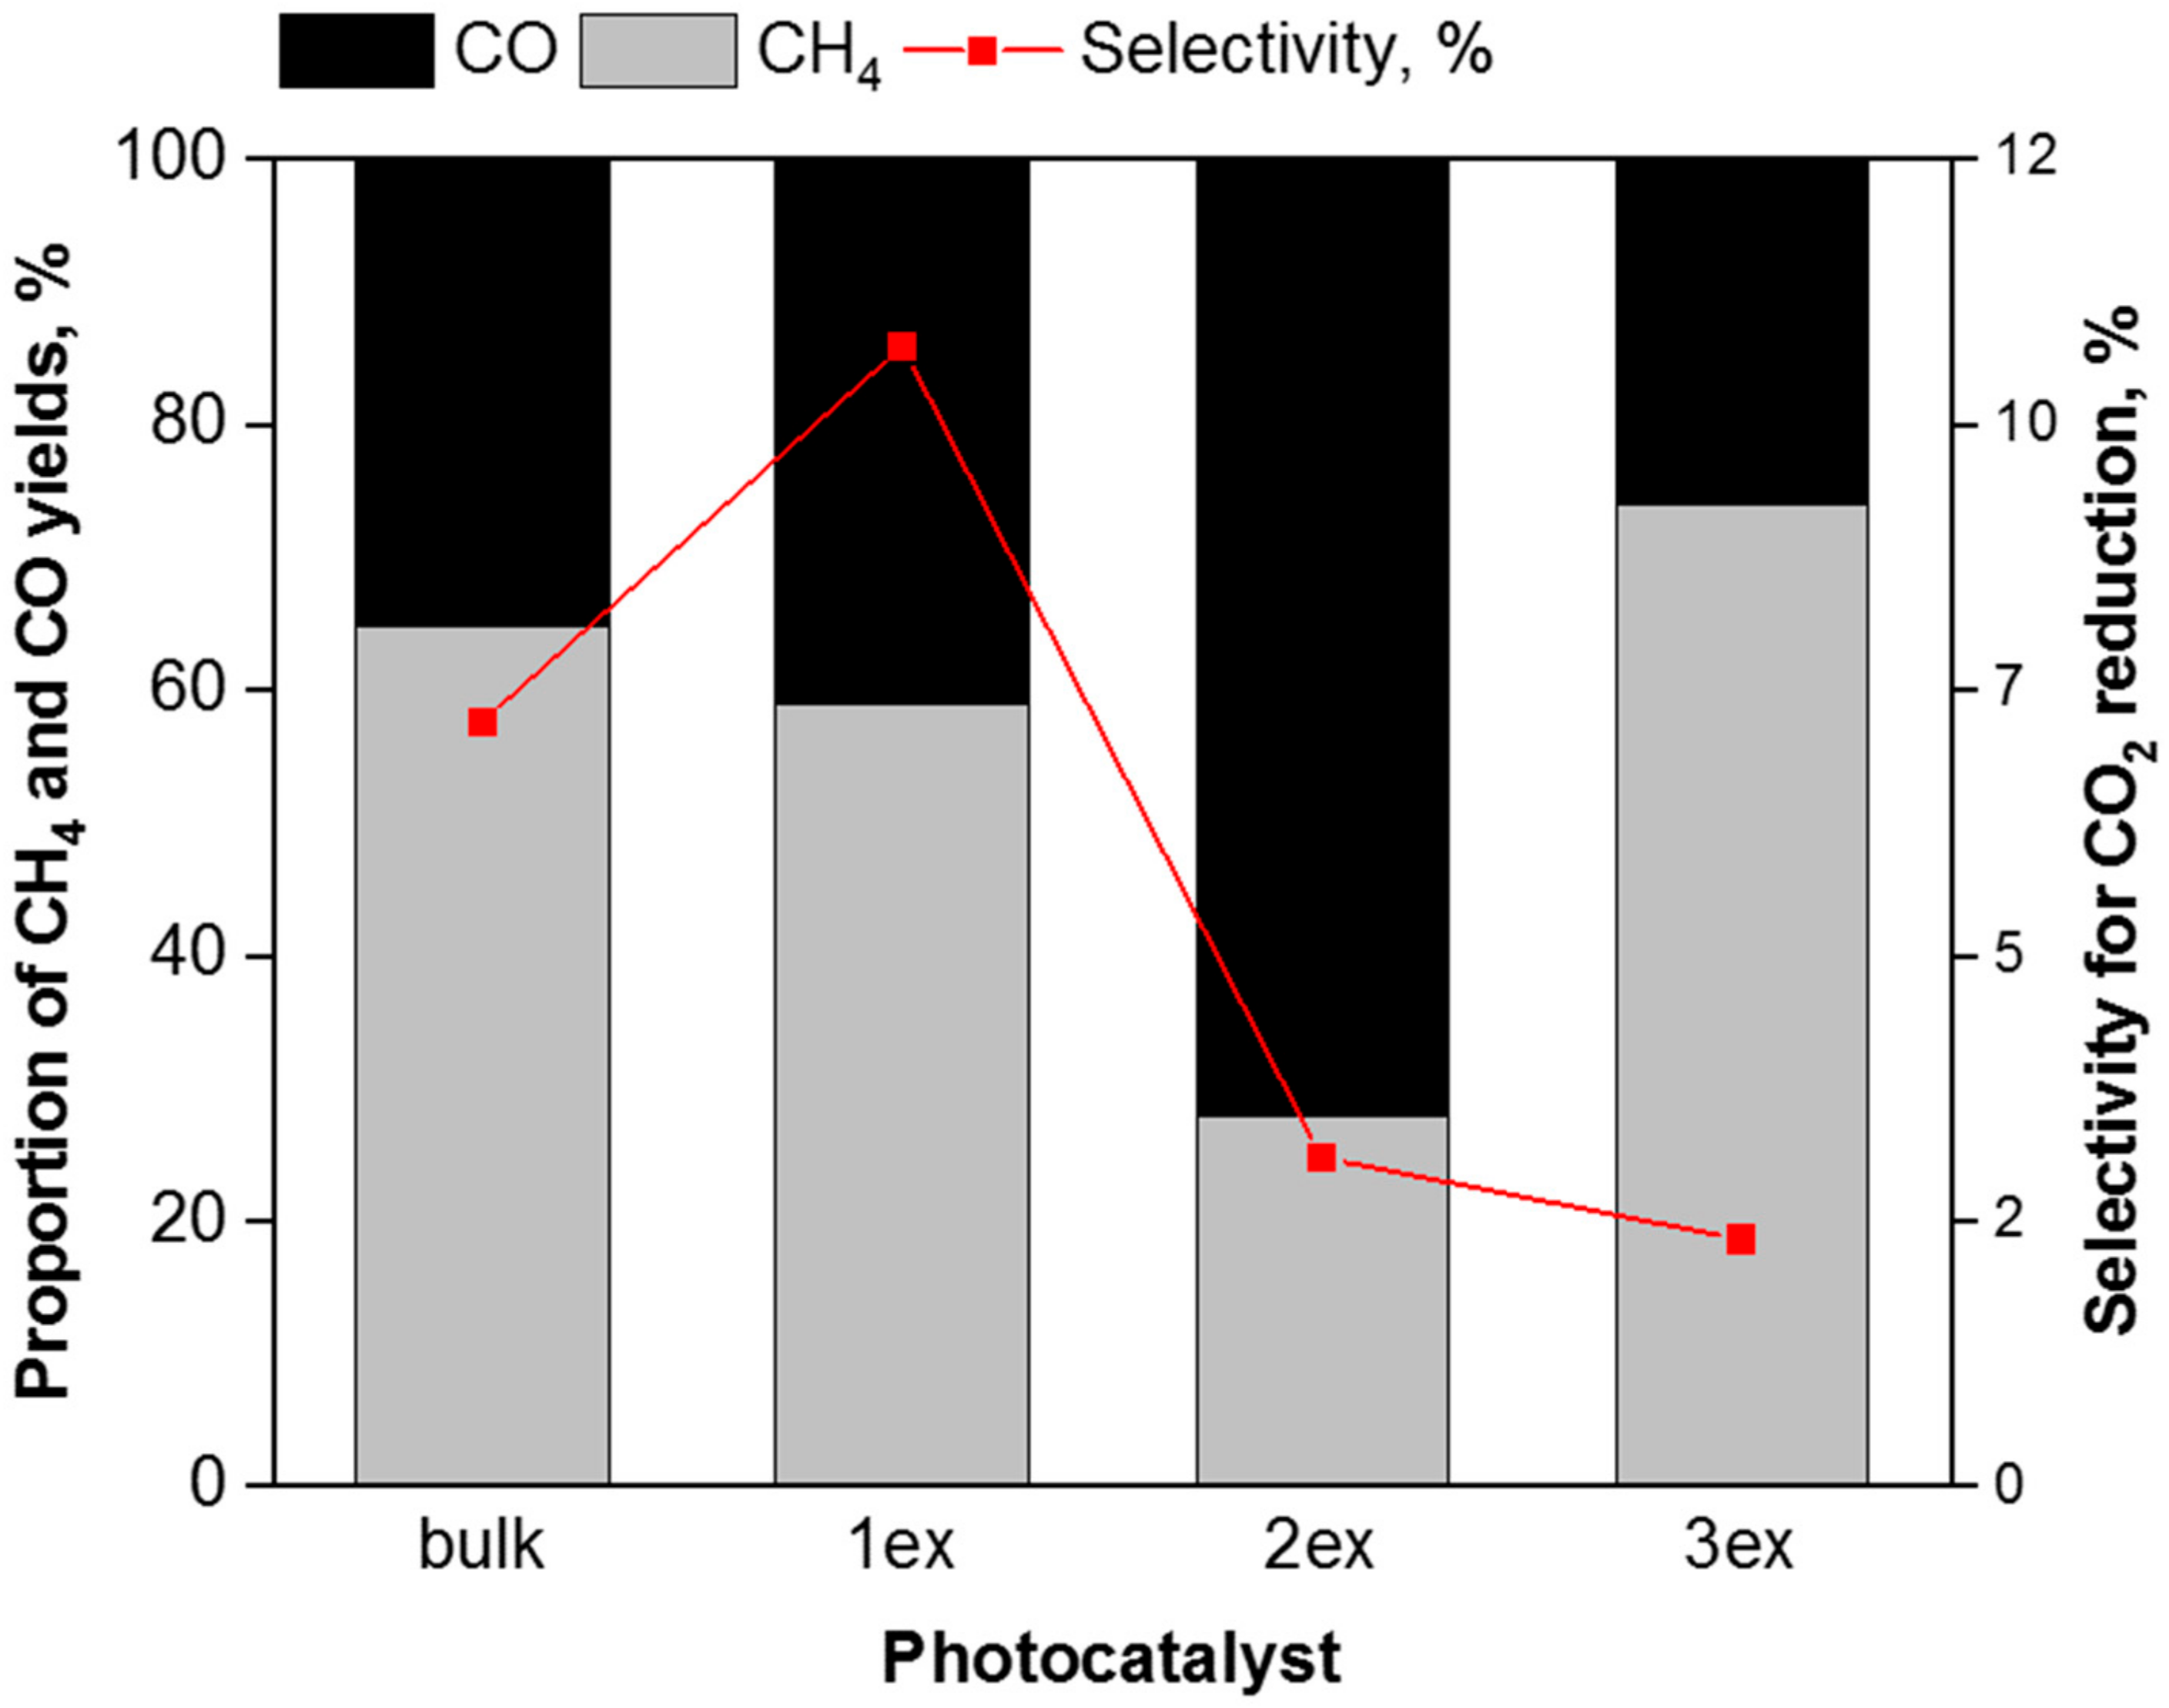
2.3.2. Photocatalytic Reduction of CO2

The main products of CO2 photocatalytic reduction were methane and carbon monoxide, while the hydrogen formed from water splitting was also recorded [46,47]. The time dependence of product yields in presence of the investigated photocatalysts is shown in the Supplementary Material (Figure S4). The sum of all products (methane, carbon monoxide and hydrogen) yields over the photocatalysts after 8 h of irradiation is depicted in Figure 11. The photocatalytic activities of the photocatalysts followed the order 3ex g-C3N4>> 2ex g-C3N4> 1ex g-C3N4 ~ bulk g-C3N4. The yields of CH4, CO and H2 in presence of 3ex g-C3N4 photocatalyst were almost 3, 2 and 8 times higher, respectively, then in case of bulk g-C3N4 photocatalyst, whereas the lowest yield of H2 and no yields of CH4 and CO were observed in presence of the P25 photocatalyst. The significantly increased products’ yields were ascribed to the exfoliation of the g-C3N4.
The correlation between the specific surface area and methane and carbon monoxide yields is depicted in Figure 12a.
The rate of electron consumption for the formation of reaction products was calculated according to the equation:
R(electron) = 8r(CH4) + 2r(CO) + 2r(H2)
where r(CH4), r(CO) and r(H2) are the rates of CH4, CO and H2, respectively [8]. The correlation of the photogenerated electrons’ efficiency with the specific surface area is shown in Figure 12b. Due to the fact that the CO2 photocatalytic reduction to carbon monoxide and methane is competitive with the photocatalytic water splitting to hydrogen, the selectivity for CO2 photocatalytic reduction was computed according to the equation [8]:
Selectivity   for   CO 2   reduction   % = 2 r CO + 8 r CH 4 2 r CO + 8 r CH 4 + 2 r H 2 · 100 %
The correlation between the proportion of methane and carbon monoxide yield and selectivity for CO2 photocatalytic reduction in presence of g-C3N4 photocatalysts is shown in Figure 13. It is evident that the exfoliation leads to higher selectivity for photocatalytic water splitting that is in agreement with the recorded high hydrogen evolution in Figure 10. The exfoliation of g-C3N4 accelerated the rate of electron consumption for reductive reactions, i.e., R(electron). In addition, the valence band potentials of the highly exfoliated samples (2ex and 3ex) facilitate the holes trapping and charge separation. Consequently, more electrons are present on the surface of the photocatalyst, which can react with CO2 and H2O to form CH4, CO and H2. The exfoliated g-C3N4 acted as efficient photocatalyst, which influences the efficiency of the reaction (higher yields of all products) as well as the selectivity towards the product formation.

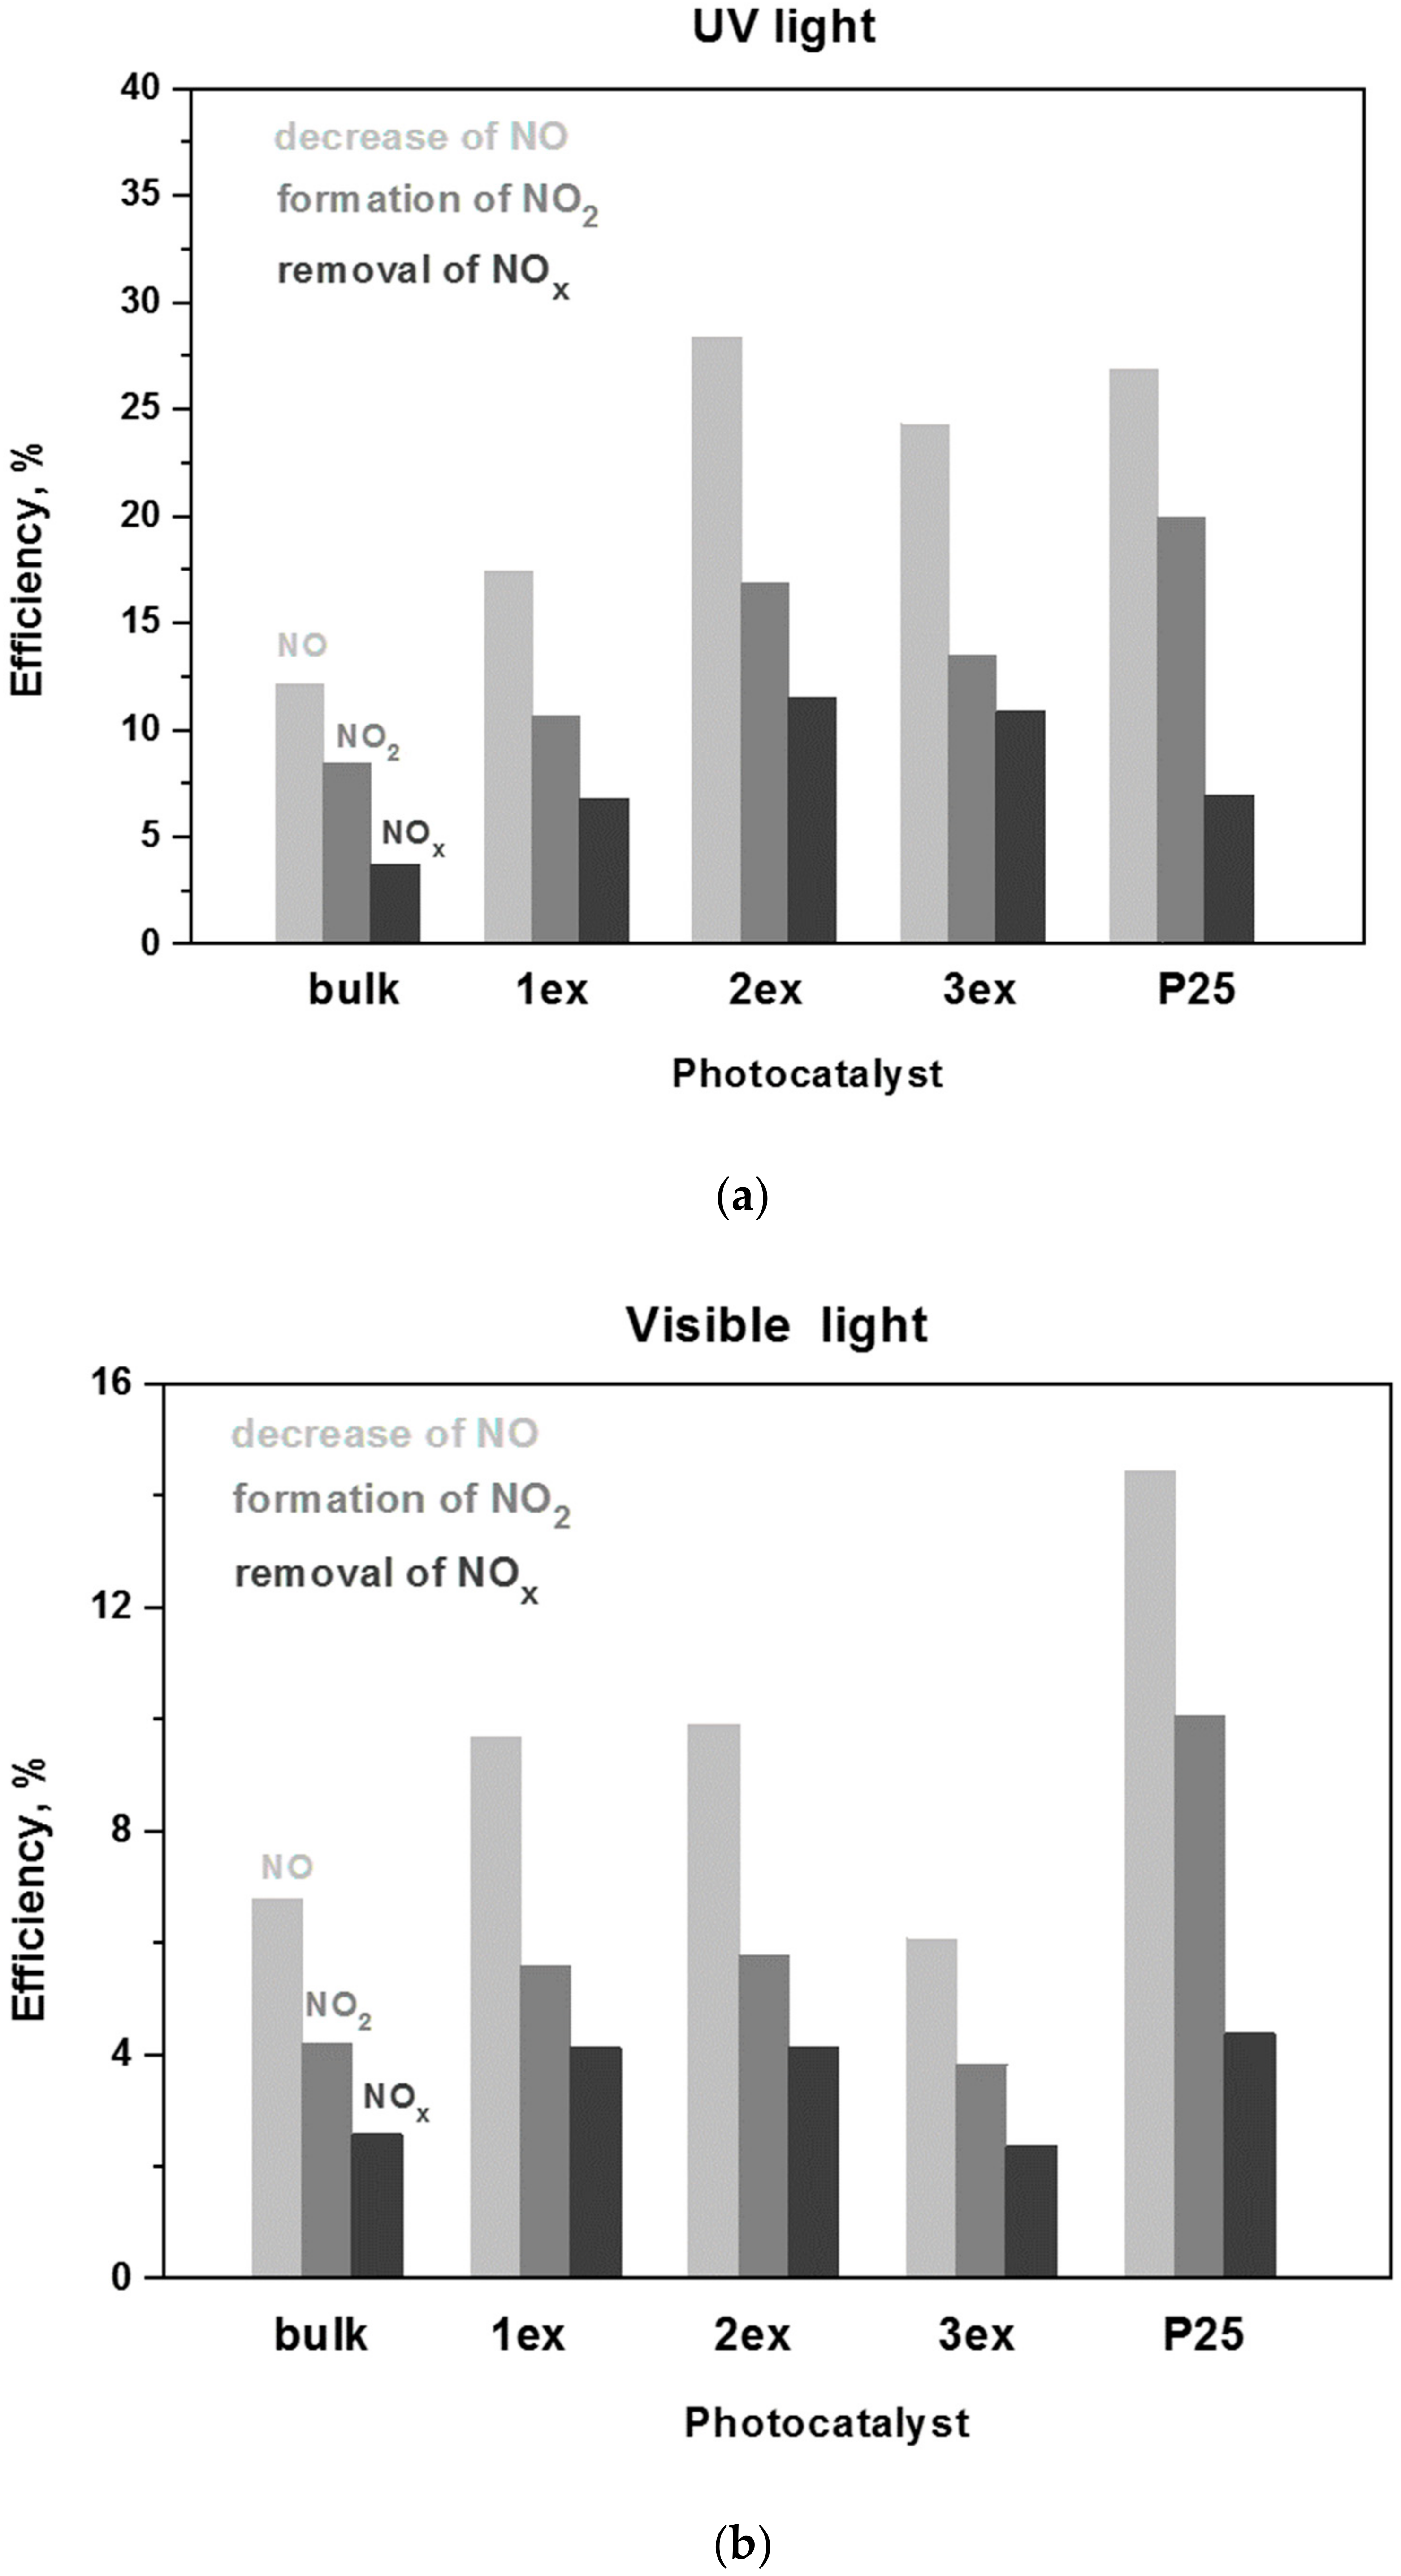
2.3.3. Photocatalytic Oxidation of NOx

The photocatalytic activity in oxidation of NOx is estimated by: (i) the decrease of an initial NO concentration of 1 ppm,(ii) the increase of the formed NO2 and (iii) the decrease of the total NOx (NO + NO2) concentration in the gas flow above the photocatalyst. The experimental concentration curves of NO, NO2 and NOx gases under UV and visible light irradiation of the bulk and exfoliated g-C3N4 are given in the Supplementary Material (Figure S5), whereas the calculated according to [48] efficiencies are presented in Figure 14. The respective data for the reference P25 photocatalysts is also presented. A gradual increase in NO oxidation (decrease of NO concentration), NO2 formation and the total NOx removal was demonstrated for the bulk, 1ex and 2ex samples, where the activity of 2ex was higher than that of 3ex.
The increase was more prominent under UV light where the total NOx removal by 2ex and 3ex were ~4 and ~3 times higher than bulk, respectively. Under visible light, the efficiency of 1ex and 2ex in NOx removal was almost 2 times higher than bulk, but the activity of 3ex was comparable to the bulk. When compared to P25, the 2ex g-C3N4 exhibited better activity in total NOx removal under UV light and similar activity under visible light. The long-term (8 h) photocatalytic behavior of 2ex appeared very stable without indication for saturation or deactivation of the photocatalyst (Figure S6). Overall, the increase in NOx oxidation after the exfoliations was not analogous to the increase of the SSA. The outcome was related to the competition between the band gap parameters (Eg, VVB and VCB) and the specific surface area of the photocatalysts, as well as to the mechanism of the NOx oxidation process. Despite the widening of the band gap from 2.70 eV (bulk) to 3.04 eV (3ex), the activity under both UV and visible light did not decrease, which can be ascribed to the drastic increase of the SSA of the exfoliated samples. Yet, despite the high SSA of 3ex (513 m2/g), this sample displayed lower activity than 2ex (208 m2/g) under both UV and visible light, suggesting that the SSA was no longer the dominant factor for the NOx oxidation process. The fact that the produced reactive species were mostly superoxide radicals also explained the relatively low increase of the photocatalytic activity since the hydroxyl radicals played very important role in the mechanism of photocatalytic NOx oxidation [49,50].

3. Materials and Methods

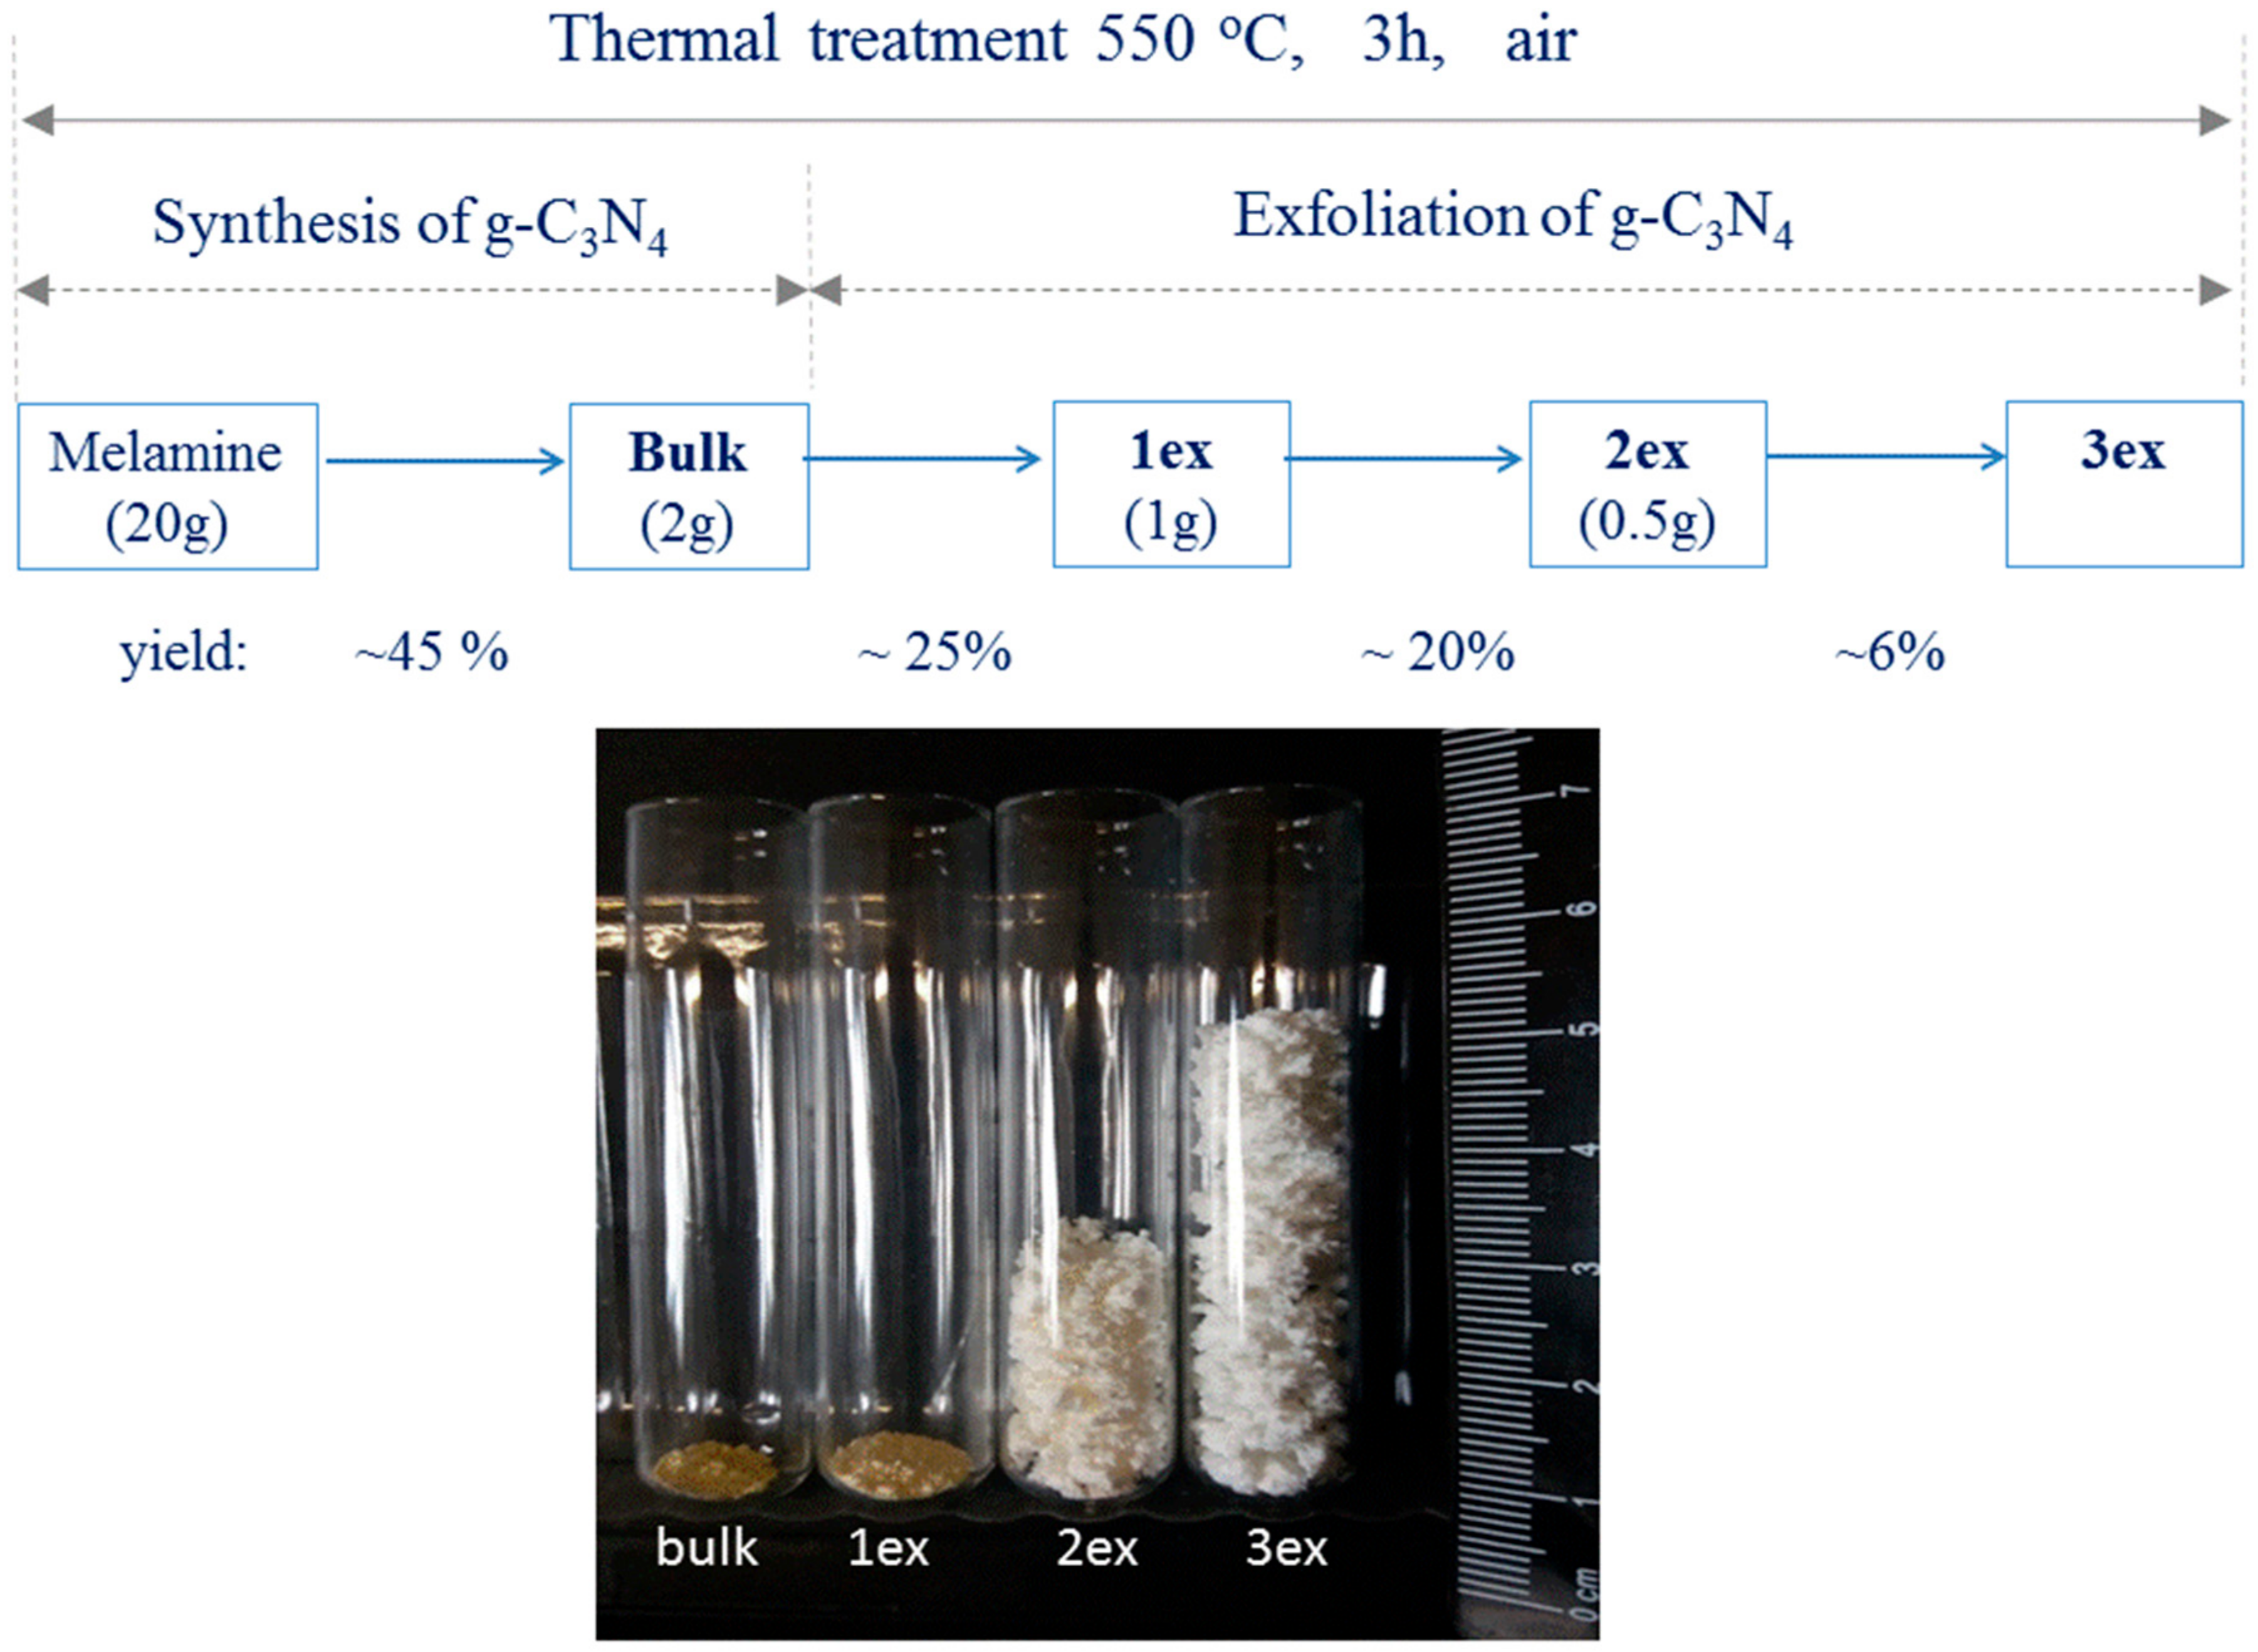
3.1. Sample Preparation

g-C3N4 powder was synthesized by thermal polycondensation of melamine C3N6H6 in air atmosphere. Specifically, 20 g of melamine (Alfa Aesar) were placed in a beaker-shaped alumina crucible and heated up to 550 °C in a muffle furnace Carbolite CWF 1100 with heating rate 10 °C/min. The precursor material was treated non-covered for 3 h and cooled to room temperature naturally. Notably, 9 g of powder with characteristic yellow color was obtained (yield 45%) and nominated as sample bulk.
The exfoliation of the bulk powder was carried out at the same treatment conditions (non-covered, 550 °C, 3 h, in air). Multiple exfoliations were performed employing different quantities of the precursor material. Specifically, 2 g of the bulk material was used for the first exfoliation giving light yellow powder that was named 1ex. Then, 1g of 1ex powder was subjected to thermal treatment giving almost white fine powder that was denoted as 2ex. Finally, 0.5 g of 2ex material was treated giving white, free standing foam-like material 3ex. The preparation procedure with the corresponding yields and a comparative photograph of the obtained materials with equal quantity 0.030 g of each sample are shown in Figure 15. It should be mentioned that fourth treatment was performed using 0.25 g and 0.5 g of 3ex, but it resulted in total decomposition of the 3ex material.

3.2. Characterization

The physicochemical properties of the prepared materials such as crystalline structure, morphology, porosity and specific surface area, surface chemical composition, and light absorption were investigated employing the respective analytical methods and techniques. Specifically, the XRD measurements were performed using a Siemens D500 X-ray diffractometer with a Cu Ka radiation source. SEM and TEM analysis were performed using a FEI Quanta Inspect and a FEI CM20 Microscope, respectively. The liquid N2 adsorption–desorption isotherms were obtained with a Quantachrome Autosorb-iQ instrument. Prior to the measurement, the samples were degassed at 150 °C for 6 h. The FT-IR transmittance spectra of the materials were measured on a Nicolet iS50 FT-IR instrument. Elemental analysis was performed with a Perkin Elmer 2400 CHN analyzer. X-ray photoelectron spectroscopy was conducted with an ultrahigh vacuum VG EXCALAB 210 electron spectrometer using Mg Kα as radiation source. The UV–VIS diffuse reflectance spectra were recorded on a Shimadzu UV–2100 spectrophotometer using BaSO4 as reference. The photoluminescence (PL) spectra were measured on a Jasco FP−8300 spectrofluorometer. Prior to the measurements, the excitation-dependent photoluminescence mapping was conducted in order to determine the adequate excitation wavelength. Subsequently, the spectra were recorded under λexc = 370 nm. The diameter of the holder window was 18 mm. The mass of the bulk and 1ex samples was 86 mg, while the mass of the 2ex and 3ex was 16 mg due to the large volume of the latter.
The conduction band edge potential of the investigated materials was determined via Electrochemical Impedance Spectroscopy applying the Mott–Schottky (MS) approximation. The electrochemical measurements were performed employing a MetrohmAutolab PGSTAT302 potentiometer equipped with a beaker-type three-electrode cell. The exact methodology and the experimental parameters are thoroughly described in our previous work [51].
The formation of reactive oxygen species (ROS) by the g-C3N4 materials under UV and visible light irradiation was investigated employing a method for scavenging the short-lived ROS using the nitrone DMPO as a spin trap. The EPR measurements were performed using an extensively upgraded Bruker ER−200D spectrometer equipped with an Oxford ESR 900 cryostat, an Anritsu MF76A frequency counter and a Bruker 035M NMR gauss meter. The exact methodology and experimental parameters are described in our previous work [19].
Photocurrent measurements were conducted in classical three electrode system where saturated Ag/AgCl and Pt wire were used as reference and counter electrodes, respectively. The working electrode was prepared by depositing photocatalyst powder onto the conductive side of ITO (indium-tin oxide) foil. For that purpose, 0.1 M KNO3 solution was used as electrolyte. Photocurrent action spectra were recorded using photoelectric spectrometer (Instytut Fotonowy, Poland) coupled with 150 W xenon lamp, monochromator, and potentiostat. The range of applied external potential was from −0.2 to 1.0 V (step 0.1 V) and the wavelength range was from 240 to 440 nm (step 10 nm).

3.3. Photocatalytic Activity Evaluation

The photocatalytic activity of the materials towards H2 production, CO2 reduction and NOx oxidation under UV and visible light irradiation was investigated using the respective reactors and setups.

3.3.1. Photocatalytic H2 Evolution

A homemade flow-type glass reactor with a quartz window was employed that was connected to a GC–2010 Shimadzu gas chromatograph equipped with a BID−2010 detector. Triethanolamine (TEOA) was used as sacrificial agent. Pt co-catalyst (3 wt%) was photodeposited using H2PtCl6 precursor. Briefly, 0.030 g of each sample were dispersed in 50 mL 10 vol% aqueous solution of TEOA where the required amount of H2PtCl6 was added. The mixture was transferred to the reactor, sealed with the quartz window and purged with Ar (10 mL/min) to remove the dissolved oxygen and the residual air. The Pt co-catalyst was deposited by irradiation of the dispersion for 30 min under stirring. Then, the concentration of the H2 gas (ppm) was measured with a GC−2010 Shimadzu gas chromatograph equipped with a BID−2010 detector in intervals of 10 min until stabilization and the final H2 evolution rate (μmol·g−1·h−1) was calculated. Philips CLEO15W Compact lamps and Osram 400 W R7S lamp (spectrum at Figure S7) were used to produce UV-A and visible light irradiation with intensity of 6.3 W/m2 and 35000 lx, respectively.

3.3.2. Photocatalytic CO2 Reduction

For the CO2 reduction measurements, a homemade batch-type stainless-steel reactor with a quartz window was employed. Ultra-Violet Products Inc. Hg lamp 8 W with peak intensity at 365 nm was used as a light source that was located above the quartz window. Precisely, 0.090 g of each sample was dispersed in 100 mL 0.2 M aqueous solution of NaOH that was transferred to the reactor, sealed and purged with He or CO2. Pressure sensor Greisinger, GMSD 3,5 BAE was placed at the top of the reactor to control the experiment. The suspension was kept under stirring all the time to prevent the settling of photocatalyst. The gaseous samples were analyzed within the time interval 0–8 h, where 0 means before the switching on the UV lamp. The samples were randomly taken with a gastight syringe (Hamilton Co., Reno, NV, USA) to the gas chromatograph (Shimadzu Tracera GC−2010Plus) equipped with BID (barrier discharge detector). Each photocatalyst was measured in inert atmosphere (He) and after that, in presence of CO2. The measurements were reproducibly repeated for each sample.

3.3.3. Photocatalytic NOx Oxidation

For the NOx oxidation measurements, a homemade flow-type setup was employed. The method is based on ISO/DIS 22197–1 standard and the procedure for evaluation of the photocatalytic NO oxidation is described in details in our previous work [48]. In brief, the powder samples were pressed in flat holders and placed in the photoreactor, where a gas with 1 ppm NO, humidity of 50%, was supplied with a constant flow rate of 3 L/min. Initially, a dark period of ~5 min was allowed. Then, the light was turned on and the concentrations of the NO, the formed NO2 and the total NOx (NO + NO2) were monitored by a Horiba APNA−370 chemiluminescence-based NOx analyzer. After the light was turned off, the concentration of the NO in the gas flow returned to the initial concentration of 1 ppm. The photocatalytic activity of the materials was measured under UV-A irradiation (Philips Cleo Compact 15 W lamps) with intensity of 10 W/m2 as well as under visible light irradiation (Nordex T5–8W–4000 K lamps, spectrum at Figure S7) with intensity of 7000 lx for 30 min.
It should be noted that for comparison reasons the activity of reference commercial TiO2 photocatalyst Evonik-Degussa P25 was also measured in H2 evolution, CO2 reduction and NOx oxidation at the same experimental conditions.

4. Conclusions

Bulk and exfoliated g-C3N4 were synthesized applying simple thermal treatment of non-covered precursor at 550 °C in air. The successive treatment at the same thermal conditions accompanied with a gradual decrease of the precursor mass resulted in g-C3N4 with graphene-like morphology and very high specific surface area of 513 m2/g. The XRD patterns of the bulk and the exfoliated (1ex, 2ex and 3ex) g-C3N4 revealed gradual decrease of the interlayer distance from 0.323 nm (bulk) to 0.318 nm (3ex), whereas the increased delamination was confirmed by the TEM analysis. The light absorption was shifted to the UV region and the calculated band gap increased gradually from 2.7 to 3.04 eV. This blue shift was ascribed to quantum confinement effect caused by the high-level exfoliation. The electrochemical measurements showed that the conduction band potential was shifted to less negative values, while the valence band potentials were above (bulk and 1ex) and below (2ex and 3ex) the standard redox potential of ·OH formation. The EPR measurements demonstrated that the superoxide radicals ·O2 were the main reactive species formed under UV and visible light irradiation. Their gradual increase was ascribed to the large exposed surface and low e-h+ recombination. The photocurrent measurements suggested improved charge separation for sample 3ex.
The highly exfoliated g-C3N4 exhibited significant photocatalytic activity in H2 evolution, CO2 reduction and NOx oxidation. In the H2 evolution, the sample 3ex exhibited activity ~6 times higher than bulk under UV light and ~2 times higher under visible light. In the CO2 reduction, the yields of CO, CH4 and H2 in presence of 3ex were almost 2, 3 and 8 times, respectively, higher than in case of bulk g-C3N4. In addition, the 2ex exhibited high selectivity towards CO2 reduction reactions (CH4 and CO formation), whereas the 3ex exhibited high selectivity for H2 evolution. In the NOx oxidation, the total NOx removal by 2ex and 3ex under UV irradiation was ~4 and ~3 times, respectively, higher than bulk. Although less prominent, increase of the visible light activity was recorded despite the widening of the band gap. The results were related to the synergetic effect of the achieved large SSA and decreased e-h+ recombination. The graphene-like g-C3N4 proved very promising in photocatalytic CO2 reduction and H2 evolution.

Supplementary Materials

The following are available online at https://www.mdpi.com/2073-4344/10/10/1147/s1, S1. Experimental H2 concentration curves recorded for the g-C3N4 (b, 1ex, 2ex, 3ex) and reference (P25) catalysts under UV and visible light; S2. Time dependence of yields of H2, CO and CH4; S3. Concentration of NO, NO2 and NOx gases for the g-C3N4 (b, 1ex, 2ex, 3ex) and reference (P25) catalysts under UV and visible light irradiation. S4. XRD patterns of the g-C3N4 materials before and after photocatalytic activity tests in NOx oxidation; S5. FT-IR spectra of the g-C3N4 materials before and after photocatalytic activity tests in NOx oxidation; S6. Long-term (8 h) measurements for 3ex in H2 evolution and 2ex in NOx oxidation.

Author Contributions

Conceptualization, N.T., K.K., and C.T.; investigation, N.T., I.P., T.G., N.I., N.B., P.D., M.E., and M.R.; resources, N.T., K.K., P.D., and C.T.; supervision, K.K. and C.T.; writing original draft, N.T. and K.K.; revision, N.T., I.P., T.G., K.K., and C.T. All authors have read and agreed to the published version of the manuscript.

Acknowledgments

The authors appreciate the financial support from the “2D NanoSmart” project funded by the Stavros Niarhos Foundation and the IKY “2D2D PhotoNOx” project. The IKY research was funded by the "Strengthening Post-Doctoral Researchers" program from the resources of the EP "Human Resources Development, Education and Lifelong Learning" with Priority Axes 6, 8, 9 and cofunded by the European Social Fund—ESF and the Greek State." This research has been co-financed by the European Union and Greek national funds through the Operational Program Competitiveness, Entrepreneurship and Innovation, under the call RESEARCH-CREATE-INNOVATE (project code: T1EDK-05545). Also, the authors acknowledge the General Secretary Research and Technology and the Hellenic Foundation for Research and Innovation for the grant number 1468 “PLASCAT.” In addition, the work was supported from the ERDF "Institute of Environmental Technology—Excellent Research" (No. CZ.02.1.01/0.0/0.0/16_019/0000853) and by using Large Research Infrastructure ENREGAT supported by the Ministry of Education, Youth, and Sports of the Czech Republic under project No. LM2018098.

Conflicts of Interest

The authors declare no conflict of interest.

References

  1. Li, X.; Xiong, J.; Gao, X.; Huang, J.; Feng, Z.; Chen, Z.; Zhu, Y. Recent advances in 3D g-C3N4 composite photocatalysts for photocatalytic water splitting, degradation of pollutants and CO2 reduction. J. Alloys Comp. 2019, 802, 196–209. [Google Scholar] [CrossRef]
  2. Christoforidis, K.C.; Fornasiero, P. Photocatalytic Hydrogen production: A rift into the future energy supply. Chem. Cat. Chem. 2017, 9, 1523–1544. [Google Scholar] [CrossRef] [Green Version]
  3. Fu, J.; Xu, Q.; Low, J.; Jiang, C.; Yu, J. Ultrathin 2D/2D WO3/g-C3N4 step-scheme H2-production photocatalyst. Appl. Catal. B Environ. 2019, 243, 556–565. [Google Scholar] [CrossRef]
  4. Cao, S.; Yu, J. g-C3N4-Based Photocatalysts for Hydrogen Generation. J. Phys. Chem. Lett. 2014, 5, 2101–2107. [Google Scholar] [CrossRef]
  5. Cheng, J.; Hu, Z.; Li, Q.; Li, X.; Fang, S.; Wu, X.; Li, M.; Ding, Y.; Liu, B.; Yang, C.; et al. Fabrication of high photoreactive carbon nitride nanosheets by polymerization of amidinourea for hydrogen production. Appl. Catal. B Environ. 2019, 245, 197–206. [Google Scholar] [CrossRef]
  6. Shehzad, N.; Tahir, M.; Johari, K.; Murugesan, T.; Hussain, M. A critical review on TiO2based photocatalytic CO2reductionsystem: Strategiestoimprove efficiency. J. CO2 Util. 2018, 26, 98–122. [Google Scholar] [CrossRef]
  7. Abdullah, H.; Khan, M.M.R.; Ong, H.R.; Yaakob, Z. Modified TiO2photocatalyst for CO2 photocatalytic reduction: An overview. J. CO2 Util. 2017, 22, 15–32. [Google Scholar] [CrossRef]
  8. Lingampalli, S.R.; Ayyub, M.M.; Rao, C.N.R. Recent Progress in the Photocatalytic Reduction of Carbon Dioxide. ACS Omega 2017, 2, 2740–2748. [Google Scholar] [CrossRef] [Green Version]
  9. Yang, C.; Tan, Q.; Li, Q.; Zhou, J.; Fan, J.; Li, B.; Sun, J.; Lv, K. 2D/2D Ti3C2MXene/g-C3N4nanosheetsheterojunction for high efficient CO2 reduction photocatalyst: Dual effects of urea. Appl. Catal. B Environ. 2020, 268, 118738. [Google Scholar] [CrossRef]
  10. Cao, S.; Low, J.; Yu, J.; Jaroniec, M. Polymeric Photocatalysts Based on Graphitic Carbon Nitride. Adv. Mater. 2015, 27, 2150–2176. [Google Scholar] [CrossRef]
  11. Prasad, C.; Tang, H.; Bahadur, I. Graphitic carbon nitride based ternary nanocomposites: From synthesis to their applications in photocatalysis: A recent review. J. Mol. Liq. 2019, 281, 634–654. [Google Scholar] [CrossRef]
  12. Shayegan, Z.; Lee, C.-S.; Haghighat, F. TiO2photocatalyst for removal of volatile organic compounds in gas phase—A review. Chem. Eng. J. 2018, 334, 2408–2439. [Google Scholar] [CrossRef]
  13. Fu, J.; Yu, J.; Jiang, C.; Cheng, B. g-C3N4-Based Hetero structured Photocatalysts. Adv. Energy Mater. 2017, 1701503, 1–31. [Google Scholar]
  14. Kumar, S.; Karthikeyan, S.; Lee, A. g-C3N4-Based Nanomaterials for Visible Light-Driven Photocatalysis. Catalysts 2018, 8, 74. [Google Scholar] [CrossRef] [Green Version]
  15. Ma, J.; Wang, C.; He, H. Enhanced photocatalytic oxidation of NO over g-C3N4-TiO2 under UV and visible light. Appl. Catal. B Environ. 2016, 184, 28–34. [Google Scholar] [CrossRef] [Green Version]
  16. Papailias, I.; Todorova, N.; Giannakopoulou, T.; Yu, J.; Dimotikali, D.; Trapalis, C. Photocatalytic activity of modified g-C3N4/TiO2 nanocomposites for NOx removal. Catalysis Today 2017, 280, 37–44. [Google Scholar] [CrossRef]
  17. Wen, J.; Xie, J.; Chen, X.; Li, X. A review on g-C3N4-based photocatalysts. Appl. Surf. Sci. 2017, 391 Pt B, 72–123. [Google Scholar] [CrossRef]
  18. Ma, Y.; Liu, E.; Hu, X.; Tang, C.; Wan, J.; Li, J.; Fan, J. A simple process to prepare few-layer g-C3N4nanosheets with enhanced photocatalytic activities. Appl. Surf. Sci. 2015, 358, 246–251. [Google Scholar] [CrossRef]
  19. Papailias, I.; Todorova, N.; Giannakopoulou, T.; Ioannidis, N.; Boukos, N.; Athanasekou, C.P.; Dimotikali, D.; Trapalis, C. Chemical vs thermal exfoliation of g-C3N4 for NOx removal under visible light irradiation. Appl. Catal. B Environ. 2018, 239, 16–26. [Google Scholar] [CrossRef]
  20. Dong, F.; Sun, Y.J.; Wu, L.W.; Fu, M.; Wu, Z. Facile transformation of low cost thiourea into nitrogen-rich graphitic carbon nitride nanocatalyst with high visible light photocatalytic performance. Catal. Sci. Technol. 2012, 2, 1332–1335. [Google Scholar] [CrossRef]
  21. Li, Y.; Wang, M.-Q.; Bao, S.-J.; Lu, S.; Xu, M.; Long, D.; Pu, S. Tuning and thermal exfoliation graphene-like carbon nitride nanosheets for superior photocatalytic activity. Ceramics Int. 2016, 42, 18521–18528. [Google Scholar] [CrossRef]
  22. Cheng, J.; Hu, Z.; Lv, K.; Wu, X.; Li, Q.; Li, Y.; Li, X.; Sun, J. Drastic promoting the visible photoreactivity of layered carbon nitride by polymerization of dicyandiamide at high pressure. Appl. Catal. B Environ. 2018, 232, 330–339. [Google Scholar] [CrossRef]
  23. Han, D.; Liu, J.; Cai, H.; Zhou, X.; Kong, L.; Wang, J.; Shi, H.; Guo, Q.; Fan, X. High-yield and low-cost method to synthesize large-area porous g-C3N4nanosheets with improved photocatalytic activity for gaseous nitric oxide and 2-propanol photodegradation. Appl. Surf. Sci. 2019, 464, 577–585. [Google Scholar] [CrossRef]
  24. Papailias, I.; Giannakopoulou, T.; Todorova, N.; Dimotikali, D.; Vaimakis, T.; Trapalis, C. Effect of processing temperature on structure and photocatalytic properties of g-C3N4. Appl. Surf. Sci. 2015, 358, 278–286. [Google Scholar] [CrossRef]
  25. Zhao, Z.; Sun, Y.; Luo, Q.; Dong, F.; Li, H.; Ho, W.-K. Mass-Controlled Direct Synthesis of Graphene-like Carbon Nitride Nanosheets with Exceptional High Visible Light Activity. Less is Better. Sci. Rep. 2015, 5, 14643. [Google Scholar] [CrossRef]
  26. Zhu, K.; Lv, Y.; Liu, J.; Wang, W.; Wang, C.; Wang, P.; Meng, A.; Li, Z.; Li, Q. Explosive thermal exfoliation of intercalated graphitic carbon nitride for enhanced photocatalytic degradation properties. Ceram. Int. 2019, 45, 3643–3647. [Google Scholar] [CrossRef]
  27. Wu, X.; Cheng, J.; Li, X.; Li, Y.; Lv, K. Enhanced visible photocatalytic oxidation of NO by repeated calcination of g-C3N4. Appl. Surf. Sci. 2019, 465, 1037–1046. [Google Scholar] [CrossRef]
  28. She, X.; Wu, J.; Zhong, J.; Xu, H.; Yang, Y.; Vajtai, R.; Lou, J.; Liu, Y.; Du, D.; Li, H.; et al. Oxygenated monolayer carbon nitride for excellent photocatalytic Hydrogen evolution and external quantum efficiency. Nano Energy 2016, 27, 138–146. [Google Scholar] [CrossRef]
  29. Niu, P.; Zhang, L.; Liu, G.; Cheng, H.-M. Graphene-Like Carbon Nitride Nanosheets for Improved Photocatalytic Activities. Adv. Funct. Mater. 2012, 22, 4763–4770. [Google Scholar] [CrossRef]
  30. Zhao, H.; Yu, H.; Quan, X.; Chen, S.; Zhang, Y.; Zhao, H.; Wang, H. Fabrication of atomic single layer graphitic-C3N4 and its high performance of photocatalytic disinfection under visible light irradiation. Appl. Catal. B Environ. 2014, 152–153, 46–50. [Google Scholar] [CrossRef]
  31. Song, X.; Yang, Q.; Jiang, X.; Yin, M.; Zhou, L. Porous graphitic carbon nitride nanosheets prepared under self-producing atmosphere for highly improved photocatalytic activity. Appl. Catal. B Environ. 2017, 217, 322–330. [Google Scholar] [CrossRef]
  32. Zhu, B.; Xia, P.; Ho, W.K.; Yu, J.G. Isoelectric point and adsorption activity of porous g-C3N4. Appl. Surf. Sci. 2015, 344, 188–195. [Google Scholar] [CrossRef]
  33. Cao, Y.; Lia, Q.; Wang, W. Construction of a crossed-layer-structure MoS2/g-C3N4heterojunction with enhanced photocatalytic performance. RSC Adv. 2017, 7, 6131–6139. [Google Scholar] [CrossRef] [Green Version]
  34. Jürgens, B.; Irran, E.; Senker, J.; Kroll, P.; Müller, H.; Schnick, W. Melem (2,5,8-triamino-tri-s-triazine), an important intermediate during condensation of melamine rings to graphitic carbon nitride: Synthesis, structure determination by X-ray powder diffraction, solid-state NMR, and theoretical studies. J. Am. Chem. Soc. 2003, 125, 10288–10300. [Google Scholar] [CrossRef] [PubMed] [Green Version]
  35. Thomas, A.; Fischer, A.; Goettmann, F.; Antonietti, M.; Mueller, J.O.; Schloegl, R.; Carlsson, J.M. Graphitic carbon nitride materials: Variation of structure and morphology and their use as metal-free catalysts. J. Mater. Chem. 2008, 18, 4893–4908. [Google Scholar] [CrossRef] [Green Version]
  36. Dong, F.; Wu, L.W.; Sun, Y.J.; Fu, M.; Wu, Z.B.; Lee, S.C. Efficient synthesis of polymeric g-C3N4 layered materials as novel efficient visible light driven photocatalysts. J. Mater. Chem. 2011, 21, 15171–15174. [Google Scholar] [CrossRef]
  37. Yuan, X.; Zhou, C.; Jin, Y.; Jing, Q.; Yang, Y.; Shen, X.; Tang, Q.; Mu, Y.; Du, A.-K. Facile synthesis of 3D porous thermally exfoliated g-C3N4nanosheet with enhanced photocatalytic degradation of organic dye. J. Colloid Interface Sci. 2016, 468, 211–219. [Google Scholar] [CrossRef] [Green Version]
  38. Nosaka, Y.; Nosaka, A.Y. Identification and roles of the active species generated on various photocatalysts. In Photocatalysis and Water Purification: From Fundamentals to Recent Applications; Pichat, P., Ed.; Wiley-VCH: Weinheim, Germany, 2013; pp. 3–24. [Google Scholar]
  39. Brezova, V.; Gabcova, S.; Dvoranova, D.; Stasko, A. Reactive oxygen species produced upon photoexcitation of sunscreens containing titanium dioxide (An EPR study). J. Photochem. Photobiol. B Biol. 2005, 79, 121–134. [Google Scholar] [CrossRef]
  40. Toumazatou, A.; Antoniadou, M.; Sakellis, E.; Tsoutsou, D.; Gardelis, S.; Romanos, G.E.; Ioannidis, N.; Boukos, N.; Dimoulas, A.; Falaras, P.; et al. Boosting visible light harvesting and charge separation in surface modified TiO2 photonic crystal catalysts with CoOx nanoclusters. Mater. Adv. 2020. [Google Scholar] [CrossRef]
  41. Dvoranová, D.; Mazúr, M.; Papailias, I.; Giannakopoulou, T.; Trapalis, C.; Brezová, V. EPR Investigations of G-C3N4/TiO2Nanocomposites. Catalysts 2018, 8, 47. [Google Scholar] [CrossRef] [Green Version]
  42. Schneider, J.; Bahnemann, D.W. Undesired Role of Sacrificial Reagents in Photocatalysis. J. Phys. Chem. Lett. 2013, 4, 3479–3483. [Google Scholar] [CrossRef]
  43. Papailias, I.; Todorova, N.; Giannakopoulou, T.; Ioannidis, N.; Dallas, P.; Dimotikali, D.; Trapalis, C. Novel torus shaped g-C3N4photocatalysts. Appl. Catal. B Environ. 2020, 268, 118733. [Google Scholar] [CrossRef]
  44. Chang, F.; Zhang, J.; Xie, Y.; Chen, J.; Li, C.; Wang, J.; Luo, J.; Deng, B.; Hu, X. Fabrication, characterization, and photocatalytic performance of exfoliated g-C3N4–TiO2 hybrids. Appl. Surf. Sci. 2014, 311, 574–581. [Google Scholar] [CrossRef]
  45. Zang, M.; Shi, L.; Liang, L.; Li, D.; Sun, J. Heterostructured g-C3N4/Ag–TiO2 composites with efficient photocatalytic performance under visible-light irradiation. J. RSC Adv. 2015, 5, 56136–56144. [Google Scholar] [CrossRef]
  46. Koci, K.; Reli, M.; Kozak, O.; Lacny, Z.; Placha, D.; Praus, P.; Obalova, L. Influence of reactor geometry on the yield of CO2 photocatalytic reduction. Catal. Today 2011, 176, 212–214. [Google Scholar] [CrossRef]
  47. Tasbihi, M.; Koci, K.; Edelmannova, M.; Troppova, I.; Reli, M.; Schomacker, R. Pt/TiO2photocatalysts deposited on commercial support for photocatalytic reduction of CO2. J. Photochem. Photobiol. A Chem. 2018, 366, 72–80. [Google Scholar] [CrossRef]
  48. Todorova, N.; Giannakopoulou, T.; Karapati, S.; Petridis, D.; Vaimakis, T.; Trapalis, C. Composite TiO2/clays materials for photocatalytic NOx oxidation. Appl. Surf. Sci. 2014, 319, 113–120. [Google Scholar] [CrossRef]
  49. Ou, M.; Wan, S.; Zhong, Q.; Zhang, S.; Song, Y.; Guo, L.; Cai, W.; Xu, Y. Hierarchical Z-scheme photocatalyst of g-C3N4@Ag/BiVO4 (040) with enhanced visible-light-induced photocatalytic oxidation performance. Appl. Catal. B Environ. 2018, 221, 97–107. [Google Scholar] [CrossRef]
  50. Dong, F.; Li, Q.; Sun, Y.; Ho, W.K. Noble metal-like behavior of plasmonic Bi particles as a cocatalyst deposited on (BiO)2CO3 microspheres for efficient visible light photocatalysis. ACS Catal. 2014, 4, 4341–4350. [Google Scholar] [CrossRef]
  51. Giannakopoulou, T.; Papailias, I.; Todorova, N.; Boukos, N.; Liu, Y.; Yu, J.; Trapalis, C. Tailoring the energy band gap and edges’ potentials of g-C3N4/TiO2 composite photocatalysts for NOx removal. Chem. Eng. J. 2017, 310, 571–580. [Google Scholar] [CrossRef]
Figure 1. Patterns of the synthesized (bulk) and exfoliated (1ex, 2ex and 3ex) g-C3N4.
Catalysts 10 01147 g001
Figure 2. Images of the synthesized (bulk) and exfoliated (1ex, 2ex, and 3ex) g-C3N4.
Catalysts 10 01147 g002
Figure 3. TEM images of the exfoliated (1ex, 2ex and 3ex) g-C3N4.
Catalysts 10 01147 g003
Figure 4. Liquid N2 (nitrogen) adsorption–desorption isotherms (a) and pore size distribution (b) of the bulk and exfoliated g-C3N4.
Catalysts 10 01147 g004
Figure 5. FT-IR spectra of the bulk and exfoliated (1ex, 2ex and 3ex) g-C3N4.
Catalysts 10 01147 g005
Figure 6. Reflectance spectra and photoluminescence (PL) emission spectra (inset) of the bulk and exfoliated g-C3N4 (a) and the respective absorption function plots (b).
Catalysts 10 01147 g006aCatalysts 10 01147 g006b
Figure 7. Mott–Schottky plots for frequency 100 Hz (a) and schematic presentation of the band gap potentials (b) of the bulk and exfoliated g-C3N4.
Catalysts 10 01147 g007
Figure 8. EPR spectra of radical adducts of DMPO under UV (a) and visible light (b) and simulation of radical adducts for sample 3ex under UV (c) and visible light (d).
Catalysts 10 01147 g008aCatalysts 10 01147 g008bCatalysts 10 01147 g008c
Figure 9. Photocurrent responses of the bulk and exfoliated (1ex, 2ex and 3ex) g-C3N4 under external potential of 1 V.
Catalysts 10 01147 g009
Figure 10. Photocatalytic activity of the g-C3N4 (bulk, 1ex, 2ex and 3ex) and P25 in H2 evolution under UV (a) and visible (b) light.
Catalysts 10 01147 g010
Figure 11. All product yields of CO2 photocatalytic reduction (after 8 irradiation hours) over the g-C3N4 (bulk and 1ex, 2ex and 3ex) and P25 photocatalysts.
Catalysts 10 01147 g011
Figure 12. Correlation between the specific surface area and the yields of CH4 and CO (a) and the rate of electron (b) in presence of g-C3N4 photocatalysts.
Catalysts 10 01147 g012
Figure 13. Correlation between the proportion of CO, CH4 and H2 yields and selectivity for the CO2 photocatalytic reduction (after 8 irradiation hours) over the g-C3N4 photocatalysts.
Catalysts 10 01147 g013
Figure 14. Efficiency of the g-C3N4 (bulk, 1ex, 2ex and 3ex) and P25 in NO oxidation and NOx removal under UV (a) and visible light (b) irradiation.
Catalysts 10 01147 g014
Figure 15. Schematic presentation of samples’ preparation where the precursor mass in gram and the yield of each treatment in percent are given; photograph of equal quantity 0.030 g of the bulk and exfoliated (1ex, 2ex and 3ex) g-C3N4.
Catalysts 10 01147 g015
Table 1. Distance (d), specific surface area (SSABET), total pore volume (Vp), main pore size (Sp), and pore size distribution.
Sampled
(nm)
SSABET
(m2/g)
Vp
(cm3/g)
Sp
(nm)
Pore Size Distribution
Bulk0.323200.1412Narrow
1ex0.321270.8211.8Narrow
2ex0.3192080.5821.6Wide
3ex0.3185131.9521.7Wide
Table 2. Composition determined by XPS and elemental analysis.
SampleXPSElemental Analysis
C
(at.%)
N
(at.%)
O
(at.%)
C
(%)
N
(%)
H
(%)
Atomic Ratio
C/N
Bulk43.3752.114.5233.8162.360.750.6325
1ex44.1452.233.6234.263.250.770.6305
2ex45.0551.243.7134.3263.710.930.6286
3ex44.3151.224.4634.6362.410.80.648
Table 3. Gap energy and potentials of the conduction and the valence bands.
SampleBand Gap Eg
(eV)
Conduction Band Potential
(V)
Valence Band Potential
(V)
vs. Ag/AgCl, pH 5.8vs. NHE, pH 0vs. NHE, pH 0
Bulk2.70−1.43−0.881.82
1ex2.82−1.38−0.831.99
2ex2.92−1.35−0.802.12
3ex3.04−1.32−0.772.27

