When Two Become One: How Group Mergers Affect Solidarity
Abstract
1. Introduction
2. Experimental Design, Procedure and Hypotheses
2.1. The Helping Game
2.2. Discussion of the Helping Game
2.3. Treatments
2.4. Procedure and Data Collection
2.5. Hypotheses
3. Experimental Results
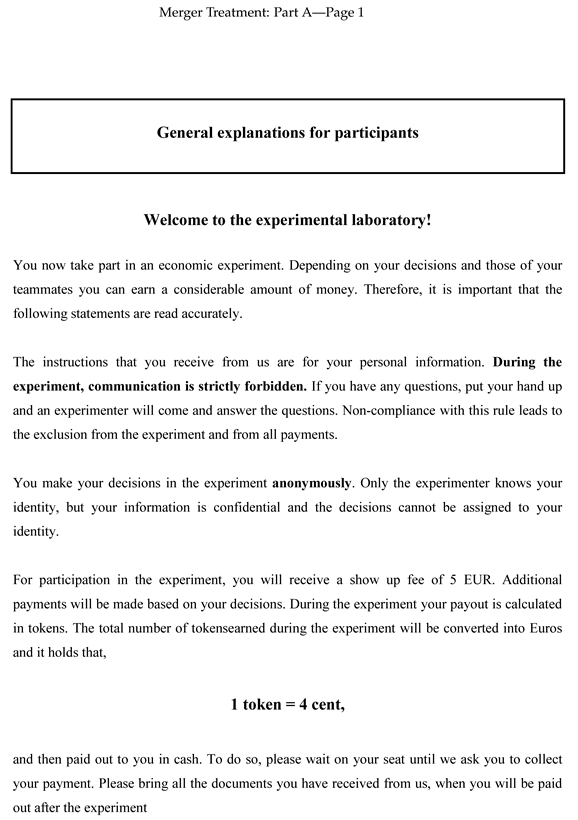
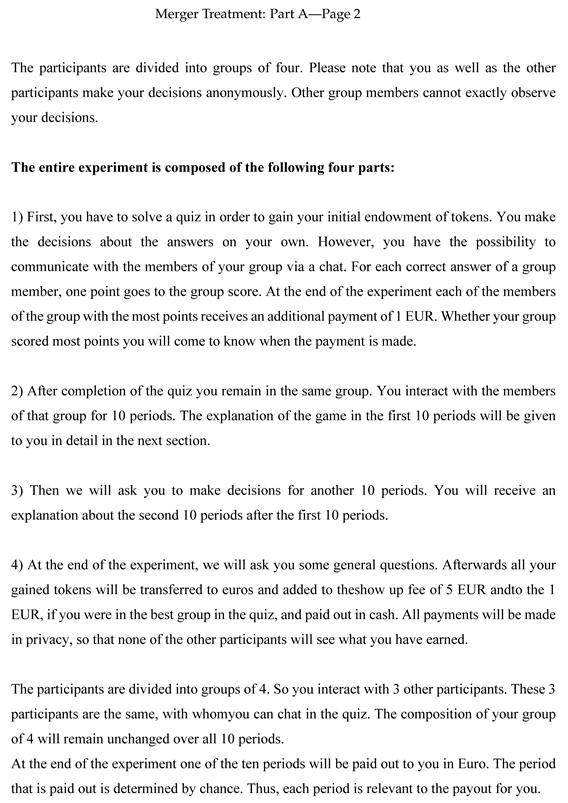
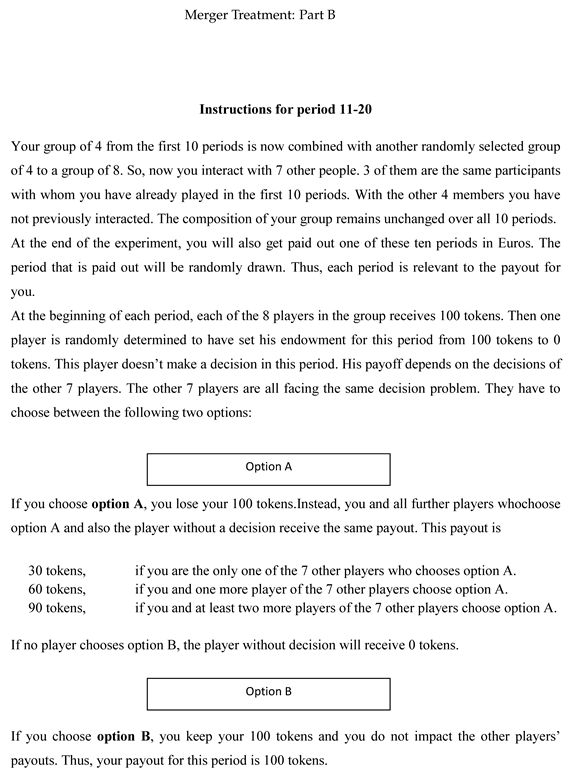
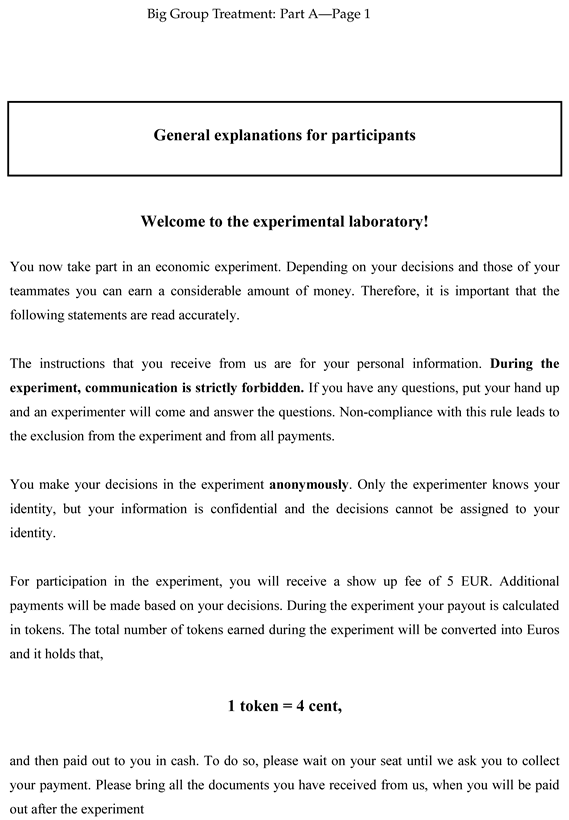
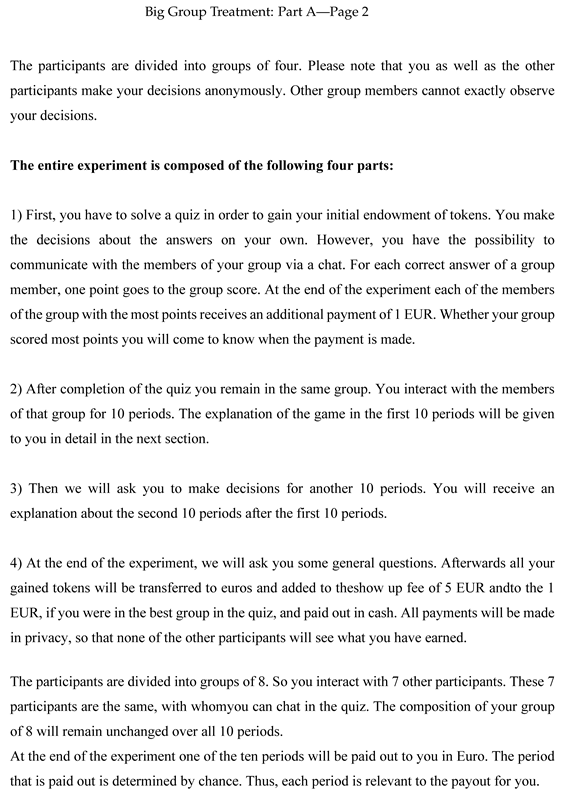
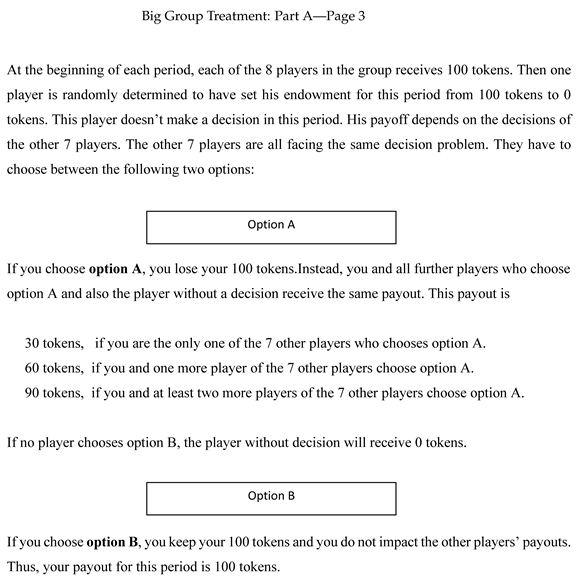
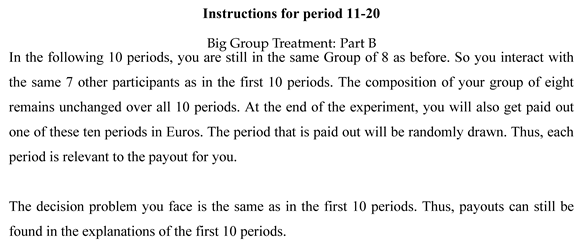
4. Discussion of the Results and Limitations of the Study
Supplementary Materials
Funding
Acknowledgments
Conflicts of Interest
Appendix A
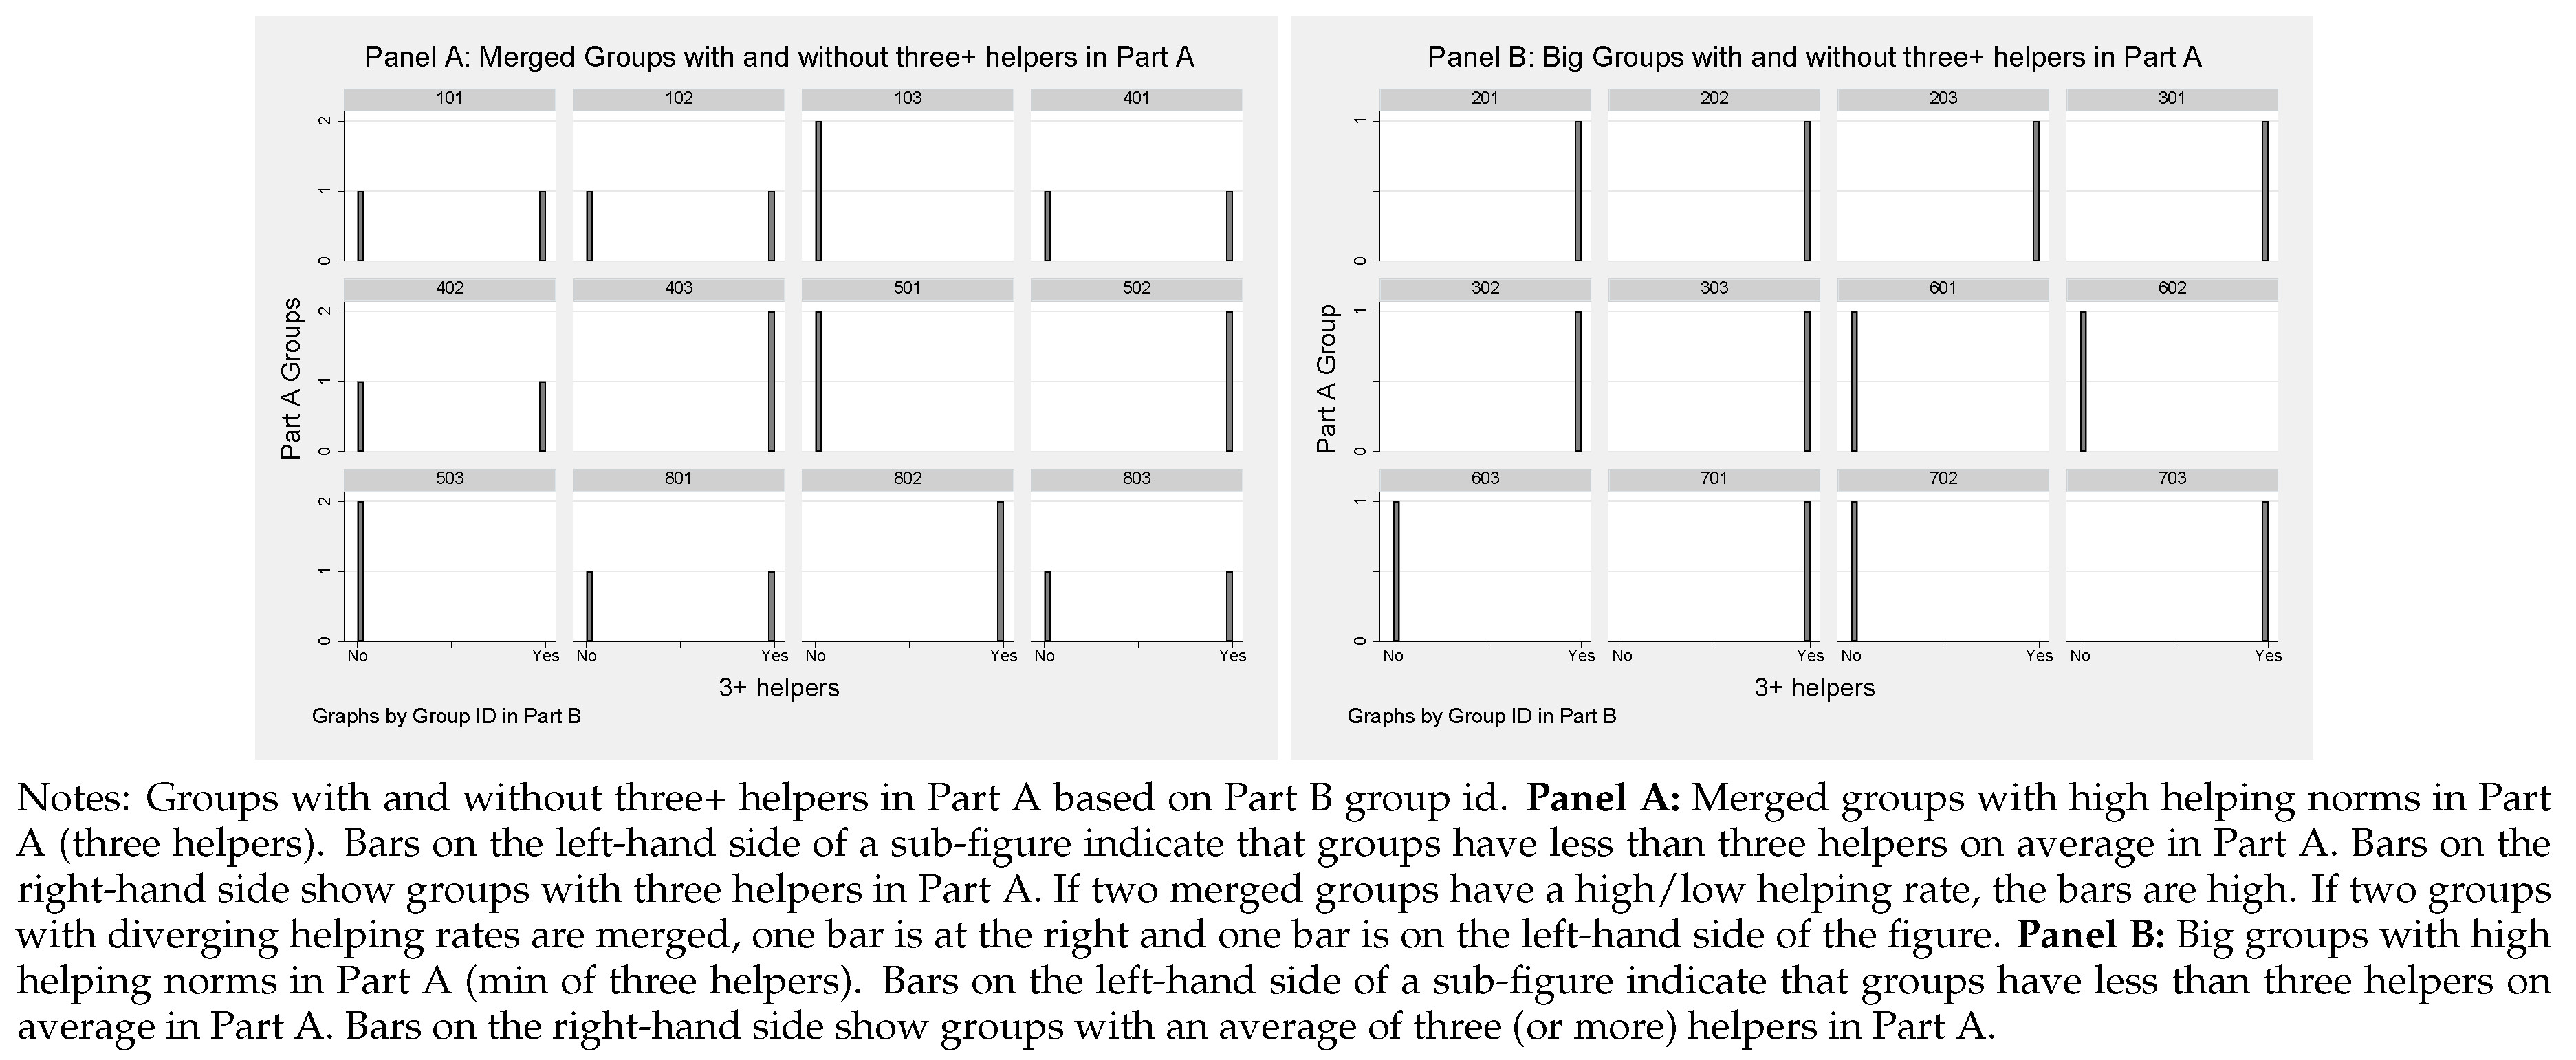
Appendix A.1. Helping Rates in Part B, DID Regressions, Group Composition and Part B Behavior—Full Helping, Median and Mean Split
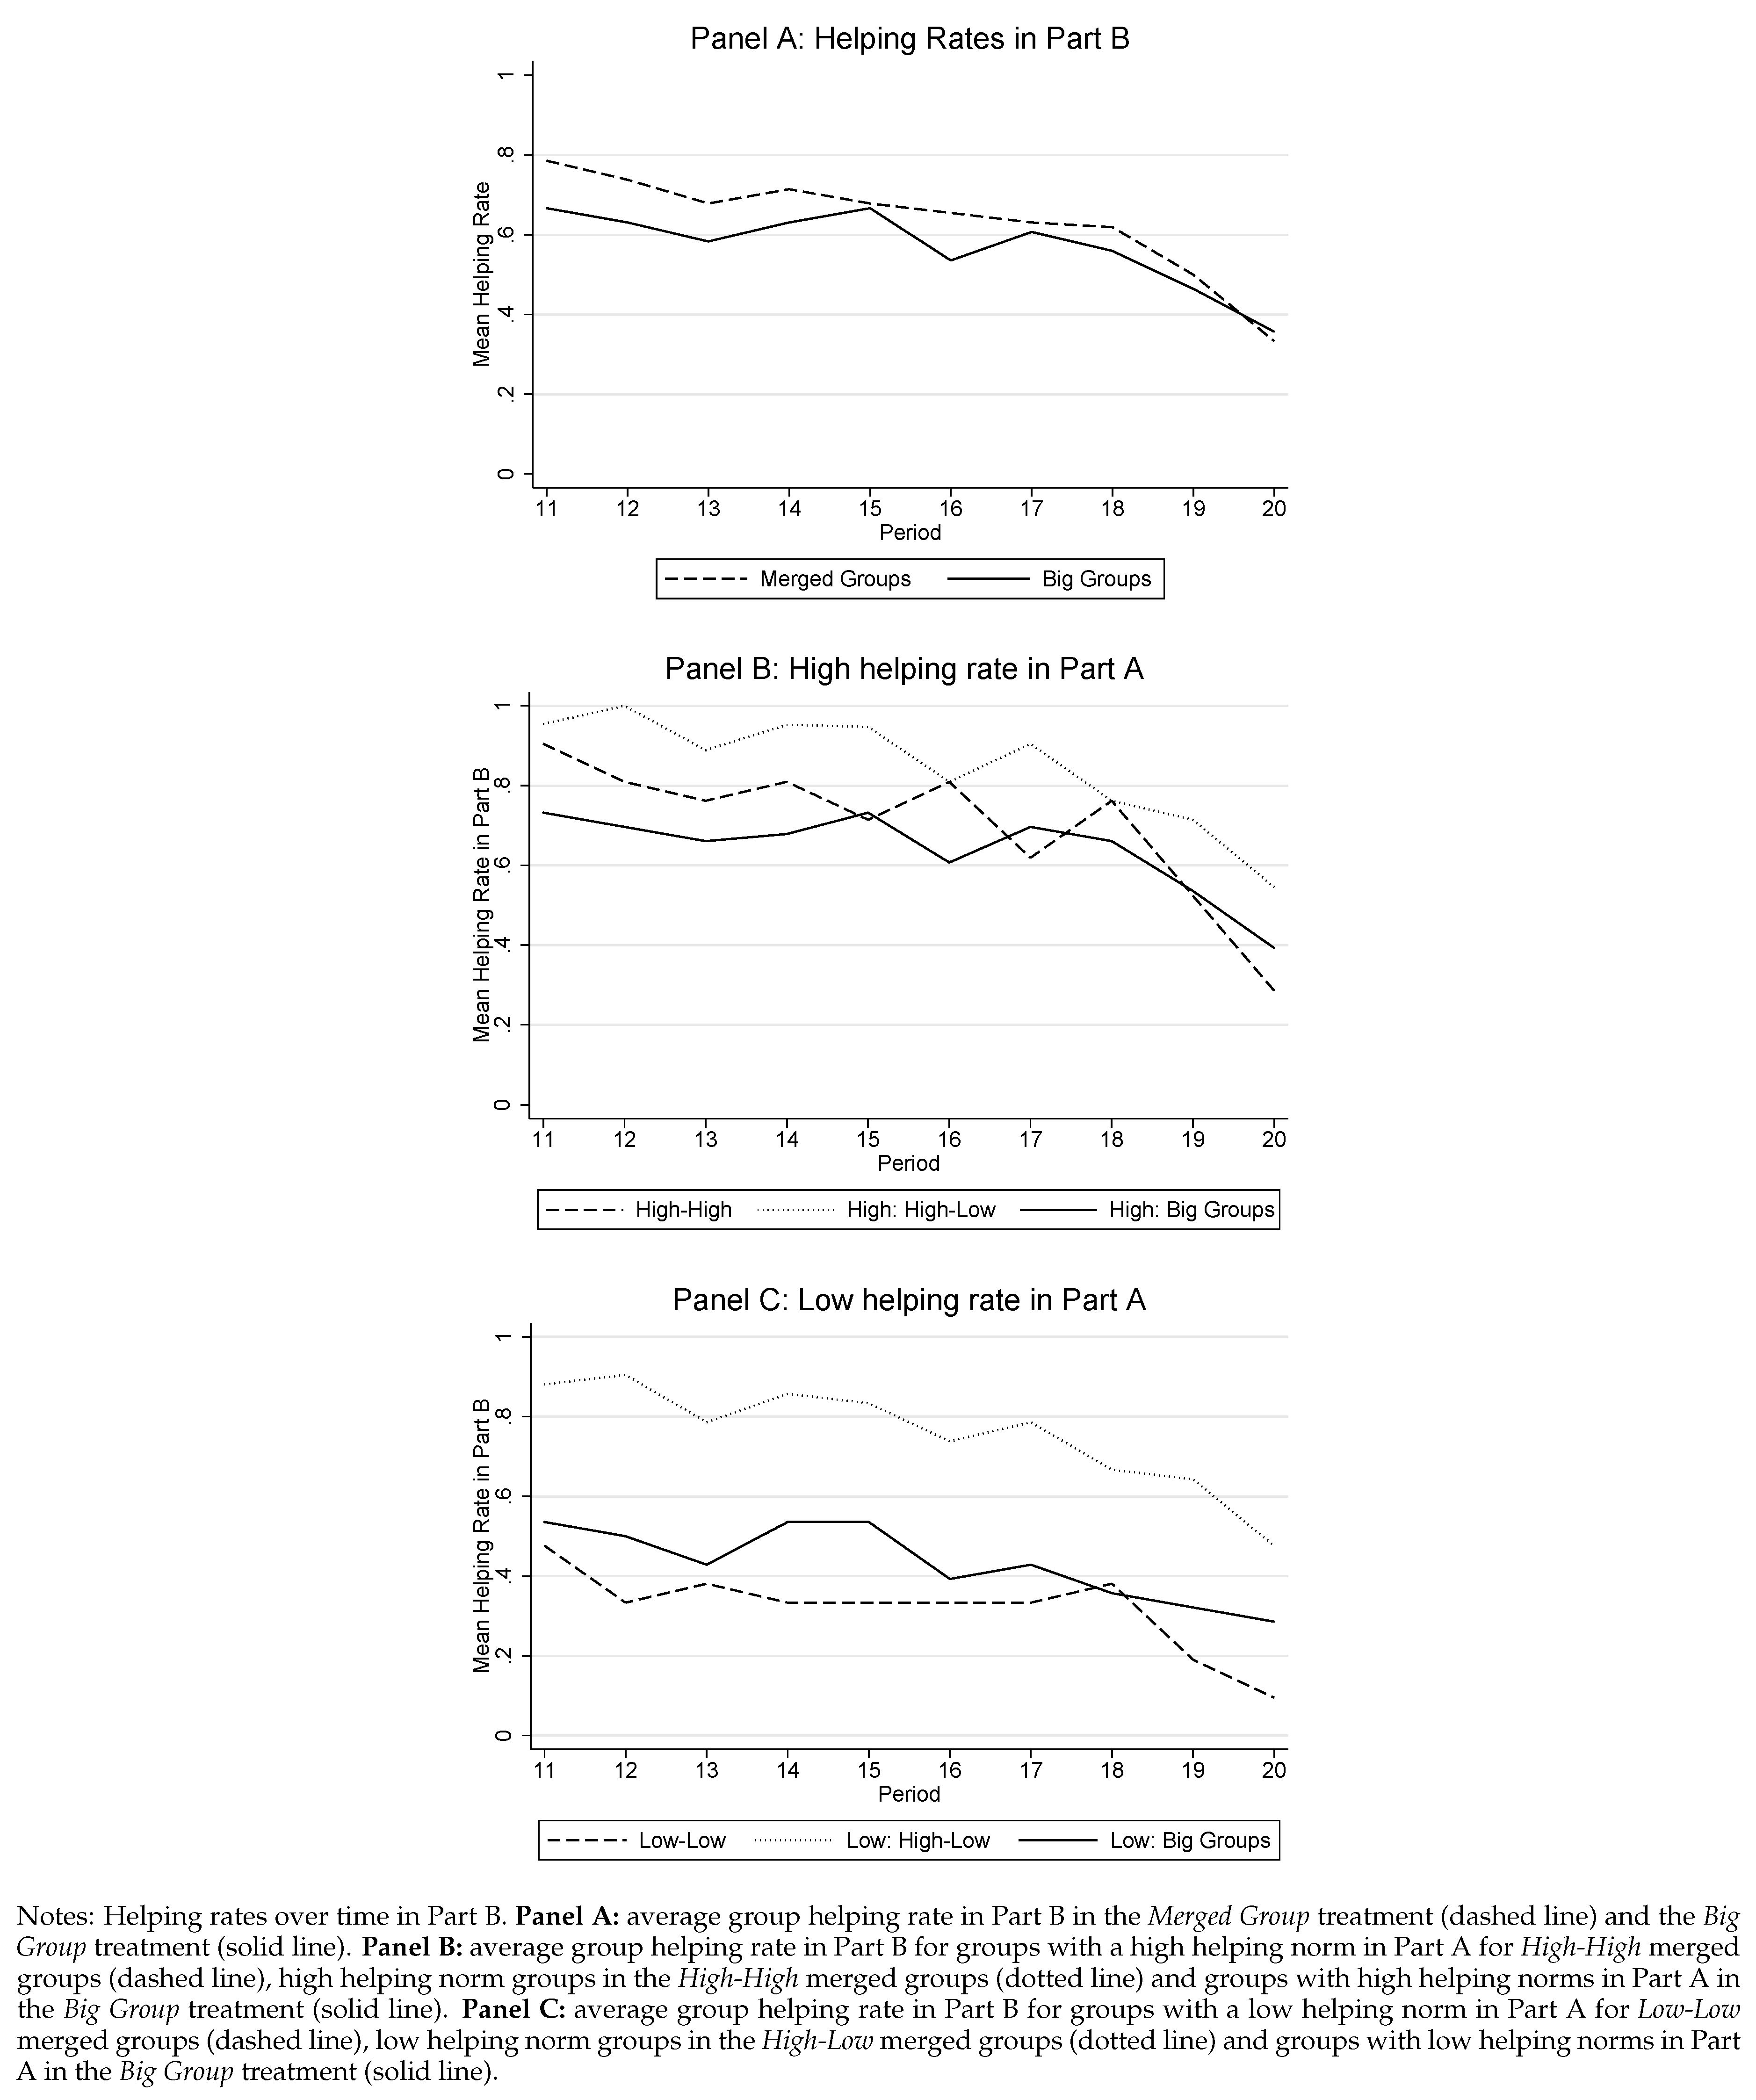
| Big Group | All vs. | High vs. | Low vs. | ||
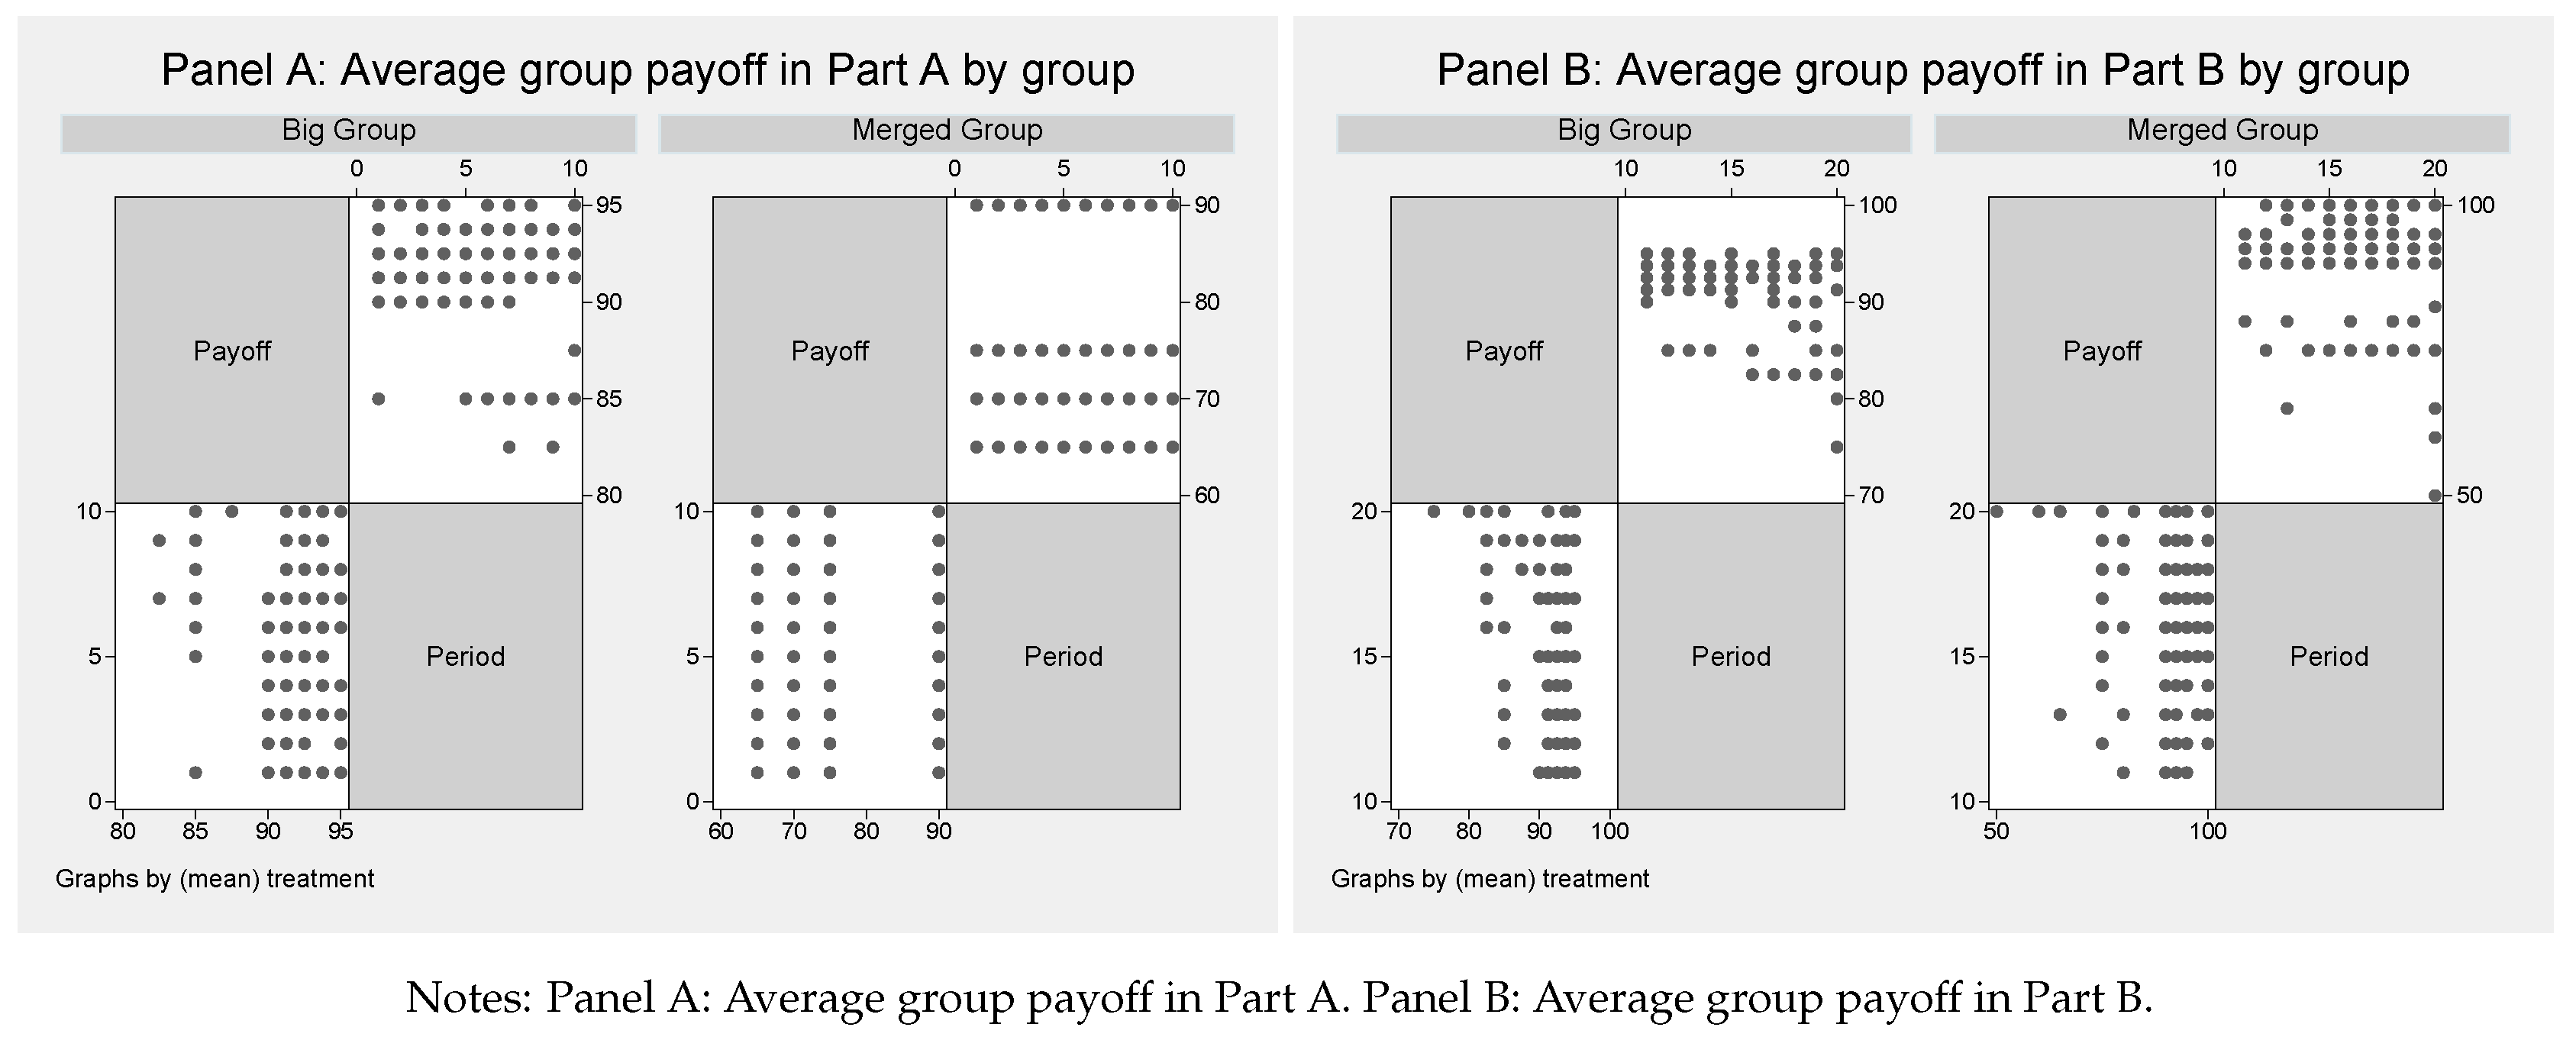
|---|---|---|---|---|---|
| Merged Group | All | High-High | High-Low | High-Low | Low-Low |
| (1) | (2) | (3) | (4) | (5) | |
| Merged Group | 0.433 | 0.433 | 0.833 | 2.258 | −0.842 |
| (0.238) | (0.323) | (0.257) | (0.323) | (0.414) | |
| Constant | 4.025 | 4.500 | 4.500 | 3.075 | 3.075 |
| (0.140) | (0.145) | (0.145) | (0.243) | (0.244) | |
| Observations | 240 | 110 | 140 | 100 | 70 |
| F | 3.308 | 1.795 | 10.55 | 48.88 | 4.141 |
| R | 0.0137 | 0.0195 | 0.0756 | 0.327 | 0.0600 |
| Helping Rate | #Helpers | Payoff | |
|---|---|---|---|
| (1) | (2) | (3) | |
| Merged Group | 0.132 | −2.146 | -8.385 |
| (0.0306) | (0.152) | (0.651) | |
| Part B | −0.0655 | −0.425 | −0.510 |
| (0.0279) | (0.194) | (0.429) | |
| Merged Group × Part B | −0.0692 | 2.579 | 7.406 |
| (0.0426) | (0.247) | (0.852) | |
| Constant | 0.636 | 4.450 | 92.09 |
| (0.0192) | (0.134) | (0.253) | |
| Observations | 720 | 720 | 720 |
| F | 13.55 | 121.0 | 56.65 |
| R | 0.0532 | 0.266 | 0.215 |
| Panel A: Median Split | Big Group | Merged Group | |||||
| All | High | Low | All | High-High | High-Low | Low-Low | |
| Helping Rate | 0.570 | 0.671 | 0.469 | 0.633 | 0.70 | 0.757 | 0.319 |
| (0.168) | (0.108) | (0.162) | (0.250) | (0.049) | (0.169) | (0.265) | |
| 0.844; 0.674 | |||||||
| (0.117; 0.265) | |||||||
| #Helpers | 3.99 | 4.7 | 3.28 | 4.433 | 4.9 | 5.3 | 2.23 |
| (1.179) | (0.770) | (1.359) | (1.753) | (0.346) | (1.184) | (1.855) | |
| 2.88; 2.42 | |||||||
| (0.402; 0.945) | |||||||
| Payoff | 91.58 | 91.97 | 91.19 | 90.60 | 91.29 | 91.45 | 88.21 |
| (2.126) | (1.165) | (2.865) | (2.026) | (2.19) | (1.185) | (2.444) | |
| 90.78; 93.07 | |||||||
| (0.754; 2.491) | |||||||
| Panel B: Mean Split | Big Group | Merged Group | |||||
| All | High | Low | All | High-High | High-Low | Low-Low | |
| Helping Rate | 0.570 | 0.671 | 0.469 | 0.633 | 0.72 | 0.714 | 0.192 |
| (0.168) | (0.108) | (0.162) | (0.250) | (0.136) | (0.170) | (0.212) | |
| 0.838; 0.599 | |||||||
| (0.151; 0.252) | |||||||
| #Helpers | 3.99 | 4.7 | 3.28 | 4.433 | 5.08 | 5 | 1.35 |
| (1.179) | (0.770) | (1.359) | (1.753) | (0.951) | (1.191) | (1.484) | |
| 2.78; 2.22 | |||||||
| (0.567; 0.953) | |||||||
| Payoff | 91.58 | 91.97 | 91.19 | 90.60 | 91.13 | 91.53 | 87.19 |
| (2.126) | (1.165) | (2.865) | (2.026) | (1.657) | (2.157) | (2.303) | |
| 91.00; 93.09 | |||||||
| (0.869; 2.738) | |||||||
Appendix A.2. Number of Helpers and Group Payoff
| Big Group | Merged Group | ||||||
|---|---|---|---|---|---|---|---|
| All | High | Low | All | High-High | High-Low | Low-Low | |
| #Helpers | 3.99 | 4.7 | 3.28 | 4.433 | 4.9 | 5.3 | 2.23 |
| (1.179) | (0.770) | (1.359) | (1.753) | (0.346) | (1.184) | (1.855) | |
| 2.88; 2.42 | |||||||
| (0.402; 0.945) | |||||||
| Payoff | 91.58 | 92.13 | 90.60 | 90.60 | 91.29 | 91.45 | 88.20 |
| (2.126) | (1.629) | (3.323) | (2.427) | (2.188) | (1.786) | (2.467) | |
| 90.54; 92.38 | |||||||
| (0.827; 2.078) | |||||||
| Big Group | All vs. | High vs. | Low vs. | High vs. | Low vs. | ||
|---|---|---|---|---|---|---|---|
| Merged Group | All | High-High | High-Low | High-Low | High-Low | High-Low | Low-Low |
| (1) | (2) | (3) | (4) | (5) | (6) | (7) | |
| Merged Group | −0.979 | −0.833 | −0.667 | 0.958 | −1.583 | 1.875 | −2.292 |
| (0.516) | (0.632) | (0.516) | (0.830) | (0.516) | (0.867) | (1.349) | |
| Constant | 91.58 | 92.12 | 92.12 | 90.50 | 92.13 | 90.50 | 90.50 |
| (0.347) | (0.355) | (0.354) | (0.740) | (0.354) | (0.740) | (0.743) | |
| Observations | 240 | 110 | 140 | 100 | 140 | 100 | 70 |
| F | 3.601 | 1.736 | 1.667 | 1.332 | 9.398 | 4.680 | 2.885 |
| R | 0.0149 | 0.0144 | 0.0117 | 0.0160 | 0.0623 | 0.0508 | 0.0438 |
| All | High | Low | |
|---|---|---|---|
| (1) | (2) | (3) | |
| High-High | 2.700 *** | ||
| (0.442) | |||
| High-Low | 3.100 *** | 0.433 *** | 1.300 *** |
| (0.395) | (0.164) | (0.205) | |
| Constant | 2.233 *** | 2.450 *** | 1.117 *** |
| (0.333) | (0.127) | (0.130) | |
| Observations | 120 | 120 | 120 |
| F | 31.81 | 6.995 | 40.21 |
| R | 0.378 | 0.0560 | 0.254 |
| All | High | Low | |
|---|---|---|---|
| (1) | (2) | (3) | |
| High-High | −0.905 | ||
| (1.133) | |||
| High-Low | −1.143 | −1.375 * | 0.0556 |
| (1.056) | (0.762) | (1.103) | |
| Constant | 93.10 *** | 92.15 *** | 93.11 *** |
| (1.016) | (0.674) | (1.024) | |
| Observations | 120 | 120 | 120 |
| F | 0.623 | 3.258 | 0.00254 |
| R | 0.0185 | 0.0269 | 0.0000215 |
Appendix A.3. Helping: New vs. Old Group Members
| Individual Decision to Help | |
|---|---|
| (1) | |
| High-low | 0.409 *** |
| (0.0611) | |
| Constant | 0.341 *** |
| (0.0410) | |
| Observations | 227 |
| F | 44.85 |
| R | 0.162 |
| Merged Group | ||||
|---|---|---|---|---|
| High-High | High-Low | High-Low | Low-Low | |
| Old Group | 0.645 | 0.883 | 0.585 | 0.297 |
| (0.122) | (0.152) | (0.312) | (0.227) | |
| New Group | 0.593 | 0.813 | 0.712 | 0.356 |
| (0.237) | (0.145) | (0.273) | (0.279) | |
| Helping Rate | ||
|---|---|---|
| (1) | (2) | |
| New Group | 0.0341 | 0.104 |
| (0.0390) | (0.0523) | |
| Constant | 0.711 | 0.435 |
| (0.0192) | (0.0309) | |
| Observations | 200 | 160 |
| F | 0.767 | 3.949 |
| R | 0.00415 | 0.0255 |
Appendix A.4. Efficiency
| # Subjects Help | Group of 4 Payoff | Group of 8 Payoff |
|---|---|---|
| 0 | 300 | 700 |
| 1 | 260 | 630 |
| 2 | 280 | 680 |
| 3 | 360 | 760 |
| 4 | – | 750 |
| 5 | – | 740 |
| 6 | – | 730 |
| 7 | – | 720 |
| Part: | Part A | Part B | ||
|---|---|---|---|---|
| Treatment: | Big Group | Merged Group | Big Group | Merged Group |
| (1) | (2) | (3) | (4) | |
| Efficient Helping () | 0.217 | 0.715 | 0.129 | 0.401 |
| (0.0737) | (0.0725) | (0.115) | (0.147) | |
| Over Efficient Helping () | 0.412 | 0.375 | 0.615 | |
| (0.0607) | (0.0520) | (0.0966) | ||
| Period | −0.0113 | −0.00836 | −0.0168 | −0.0179 |
| (0.00690) | (0.00553) | (0.00476) | (0.00766) | |
| Constant | 0.358 | 0.321 | 0.524 | 0.404 |
| (0.0785) | (0.0627) | (0.0842) | (0.158) | |
| Observations | 756 | 648 | 840 | 840 |
| F | 21.97 | 52.98 | 31.02 | 26.86 |
| R | 0.0758 | 0.612 | 0.0924 | 0.228 |
| Panel A: Helpreason | Big Group | Merged Group | Total |
| Efficiency | 0 | 0 | 0 |
| (0) | (0) | (0) | |
| Reciprocity | 0.313 | 0.406 | 0.359 |
| (0.466) | (0.494) | (0.481) | |
| Pro Social | 0.323 | 0.333 | 0.328 |
| (0.470) | (0.474) | (0.471) | |
| Payoff | 0.0208 | 0.0625 | 0.0417 |
| (0.144) | (0.243) | (0.200) | |
| Other | 0.0833 | 0.0208 | 0.0521 |
| (0.278) | (0.144) | (0.223) | |
| Panel G: Reason Not to Help | Big Group | Merged Group | Total |
| Efficiency | 0.0313 | 0.0417 | 0.0365 |
| (0.175) | (0.201) | (0.188) | |
| Reciprocity | 0.0729 | 0.135 | 0.104 |
| (0.261) | (0.344) | (0.306) | |
| Pro Social | 0 | 0 | 0 |
| (0) | (0) | (0) | |
| Payoff | 0.125 | 0.0833 | 0.104 |
| (0.332) | (0.278) | (0.306) | |
| Other | 0.0833 | 0.0208 | 0.0521 |
| (0.278) | (0.144) | (0.223) |
Appendix A.5. Part A Behavior, Period 11 Behavior and Behavior over Time
| Panel A: Full Solidarity | Big Group | Merged Group | ||||
| All | High | Low | All | High | Low | |
| Helping Rate | 0.635 | 0.730 | 0.446 | 0.768 | 1 | 0.536 |
| (0.178) | (0.113) | (0.124) | (0.351) | (0) | (0.374) | |
| #Helpers | 4.45 | 5.11 | 3.13 | 2.30 | 3 | 1.61 |
| (1.248) | (0.790) | (0.866) | (1.052) | (0) | (1.122) | |
| Payoff | 92.03 | 92.35 | 91.56 | 83.71 | 90 | 77.42 |
| (1.336) | (0.987) | (1.927) | (8.440) | (0) | (7.911) | |
| Panel B: Median Split | Big Group | Merged Group | ||||
| - | High | Low | - | High | Low | |
| Helping Rate | 0.769 | 0.502 | 1 | 0.356 | ||
| (0.103) | (0.129) | (0) | (0.255) | |||
| #Helpers | 5.38 | 3.52 | 3 | 1.07 | ||
| (0.719) | (0.906) | (0) | (0.765) | |||
| Payoff | 92.02 | 92.17 | 90 | 74.08 | ||
| (0.899) | (1.763) | (0) | (4.732) | |||
| Panel B: Mean Split | Big Group | Merged Group | ||||
| - | High | Low | - | High | Low | |
| Helping Rate | 0.769 | 0.502 | 0.991 | 0.321 | ||
| (0.103) | (0.129) | (0.149) | (0.247) | |||
| #Helpers | 5.38 | 3.52 | 2.97 | 0.96 | ||
| (0.719) | (0.906) | (0.447) | (0.741) | |||
| Payoff | 92.02 | 92.17 | 89.5 | 72.13 | ||
| (0.899) | (1.763) | (0.894) | (1.529) | |||
| Big Group | All vs. | High vs. | Low vs. | High vs. | Low vs. | ||
|---|---|---|---|---|---|---|---|
| Merged Group | All | High-High | High-Low | High-Low | High-Low | High-Low | Low-Low |
| (1) | (2) | (3) | (4) | (5) | (6) | (7) | |
| Merged Group | 0.104 | 0.151 | 0.130 | 0.302 | 0.234 | 0.198 | −0.0521 |
| (0.0694) | (0.104) | (0.0861) | (0.108) | (0.0913) | (0.133) | (0.136) | |
| Constant | 0.583 | 0.641 | 0.641 | 0.469 | 0.641 | 0.469 | 0.469 |
| (0.0506) | (0.0607) | (0.0605) | (0.0893) | (0.0607) | (0.0898) | (0.0898) | |
| Observations | 192 | 88 | 112 | 80 | 88 | 56 | 56 |
| F | 2.251 | 2.130 | 2.288 | 7.762 | 6.583 | 2.217 | 0.146 |
| R | 0.0117 | 0.0209 | 0.0196 | 0.0963 | 0.0523 | 0.0388 | 0.00269 |
| All | High | Low | |
|---|---|---|---|
| (1) | (2) | (3) | |
| High-High | 0.375 | ||
| (0.132) | |||
| High-Low | 0.354 | 0.0833 | 0.250 |
| (0.119) | (0.109) | (0.142) | |
| Constant | 0.417 | 0.792 | 0.417 |
| (0.102) | (0.0847) | (0.103) | |
| Observations | 96 | 48 | 48 |
| F | 5.072 | 0.582 | 3.090 |
| R | 0.114 | 0.0125 | 0.0629 |
| Big Group | Merged Group | ||||
|---|---|---|---|---|---|
| All | High-High | High-Low | Low-Low | ||
| (1) | (2) | (3) | (4) | (5) | |
| Period 12 | −0.0313 | −0.0417 | −0.0833 | 0.0208 | −0.125 |
| (0.0718) | (0.0683) | (0.127) | (0.0853) | (0.140) | |
| Period 13 | −0.0729 | −0.0937 | -0.125 | −0.0833 | −0.0833 |
| (0.0720) | (0.0693) | (0.130) | (0.0913) | (0.142) | |
| Period 14 | -0.0313 | −0.0625 | −0.0833 | −0.0208 | -0.125 |
| (0.0718) | (0.0688) | (0.127) | (0.0880) | (0.140) | |
| Period 15 | −4.59e-18 | −0.0937 | −0.167 | −0.0417 | −0.125 |
| (0.0715) | (0.0693) | (0.132) | (0.0892) | (0.140) | |
| Period 16 | −0.115 | −0.115 | −0.0833 | −0.125 | −0.125 |
| (0.0720) | (0.0695) | (0.127) | (0.0929) | (0.140) | |
| Period 17 | −0.0521 | −0.135 | −0.250 | -0.0833 | −0.125 |
| (0.0720) | (0.0697) | (0.134) | (0.0913) | (0.140) | |
| Period 18 | −0.0938 | −0.146 | −0.125 | −0.187 | −0.0833 |
| (0.0720) | (0.0698) | (0.130) | (0.0945) | (0.142) | |
| Period 19 | −0.177 | −0.250 | −0.333 | −0.208 | −0.250 |
| (0.0714) | (0.0697) | (0.134) | (0.0948) | (0.129) | |
| Period 20 | −0.229 | −0.365 | −0.500 | -0.312 | −0.333 |
| (0.0705) | (0.0676) | (0.127) | (0.0951) | (0.118) | |
| Constant | 0.583 | 0.687 | 0.792 | 0.771 | 0.417 |
| (0.0506) | (0.0476) | (0.0847) | (0.0613) | (0.103) | |
| Observations | 960 | 960 | 240 | 480 | 240 |
| F | 2.291 | 4.807 | 2.460 | 2.396 | 1.611 |
| R | 0.0206 | 0.0413 | 0.0834 | 0.0449 | 0.0380 |
Appendix A.6. Controls
| Big Group | All vs. | High vs. | Low vs. | High vs. | Low vs. | ||
|---|---|---|---|---|---|---|---|
| Merged Group | All | High-High | High-Low | High-Low | High-Low | High-Low | Low-Low |
| (1) | (2) | (3) | (4) | (5) | (6) | (7) | |
| Merged Group | 0.0935 | 0.0737 | 0.123 | 0.208 | 0.156 | 0.304 | −0.103 |
| (0.0293) | (0.0379) | (0.0336) | (0.0302) | (0.0546) | (0.0442) | (0.0758) | |
| Quiz Points | 0.0145 | 0.000708 | 0.00900 | −0.00563 | 0.0213 | −0.0636 | −0.00346 |
| (0.00811) | (0.00843) | (0.0118) | (0.0175) | (0.01000) | (0.0198) | (0.0170) | |
| Cooperative Chat | 0.243 | 0.134 | 0.0418 | 0.0465 | 0.0297 | 0.214 | 0.184 |
| (0.0351) | (0.0350) | (0.0408) | (0.0612) | (0.0353) | (0.0500) | (0.0539) | |
| Time Trend | −0.0319 | −0.0320 | −0.0312 | −0.0337 | −0.0315 | −0.0330 | −0.0264 |
| (0.00515) | (0.00676) | (0.00600) | (0.00711) | (0.00572) | (0.00824) | (0.00819) | |
| Constant | 0.726 | 1.025 | 0.970 | 1.020 | 0.815 | 1.769 | 0.843 |
| (0.135) | (0.139) | (0.153) | (0.257) | (0.123) | (0.304) | (0.275) | |
| Observations | 240 | 110 | 140 | 100 | 140 | 100 | 70 |
| F | 30.64 | 17.93 | 13.76 | 23.52 | 28.85 | 26.74 | 5.782 |
| R | 0.293 | 0.298 | 0.254 | 0.454 | 0.418 | 0.339 | 0.227 |
| All | High | Low | |
|---|---|---|---|
| (1) | (2) | (3) | |
| High-High | 0.333 | ||
| (0.0458) | |||
| High-Low | 0.388 | 0.123 | 0.363 |
| (0.0494) | (0.0455) | (0.0665) | |
| Quiz Points | 0.00170 | 0.00640 | −0.0207 |
| (0.00793) | (0.00879) | (0.0204) | |
| Cooperative Chat | 0.102 | 0.0695 | 0.0708 |
| (0.0358) | (0.0405) | (0.0539) | |
| Time Trend | −0.0376 | −0.0435 | −0.0317 |
| (0.00570) | (0.00725) | (0.00846) | |
| Constant | 0.863 | 1.257 | 1.039 |
| (0.124) | (0.117) | (0.281) | |
| Observations | 240 | 120 | 120 |
| F | 37.88 | 12.59 | 16.48 |
| R2 | 0.430 | 0.359 | 0.338 |
Appendix B. Instructions

References
- Comer, D.R. A model of social loafing in real work groups. Hum. Relat. 1995, 48, 647–667. [Google Scholar] [CrossRef]
- Margarida Passos, A.; Caetano, A. Exploring the effects of intragroup conflict and past performance feedback on team effectiveness. J. Manag. Psychol. 2005, 20, 231–244. [Google Scholar] [CrossRef]
- Schermerhorn, J.R.J. Management, 9th ed.; John Wiley & Sons, Inc.: Hoboken, NJ, USA, 2008. [Google Scholar]
- Bowles, S. Group competition, reproductive leveling, and the evolution of human altruism. Science 2006, 314, 1569–1572. [Google Scholar] [CrossRef] [PubMed]
- Fehr, E.; Fischbacher, U. The nature of human altruism. Nature 2003, 425, 785–791. [Google Scholar] [CrossRef] [PubMed]
- Hu, J.; Liden, R.C. Making a difference in the teamwork: Linking team prosocial motivation to team processes and effectiveness. Acad. Manag. J. 2015, 58, 1102–1127. [Google Scholar] [CrossRef]
- Schjoedt, L.; Monsen, E.; Pearson, A.; Barnett, T.; Chrisman, J.J. New venture and family business teams: Understanding team formation, composition, behaviors, and performance. Entrep. Theory Pract. 2013, 37, 1–15. [Google Scholar] [CrossRef]
- Akerlof, G.A.; Kranton, R.E. Identity and the Economics of Organizations. J. Econ. Perspect. 2005, 19, 9–32. [Google Scholar] [CrossRef]
- Dur, R.; Sol, J. Social interaction, co-worker altruism, and incentives. Games Econ. Behav. 2010, 69, 293–301. [Google Scholar] [CrossRef]
- Kandel, E.; Lazear, E.P. Peer pressure and partnerships. J. Political Econ. 1992, 100, 801–817. [Google Scholar] [CrossRef]
- Rob, R.; Zemsky, P. Social capital, corporate culture, and incentive intensity. RAND J. Econ. 2002, 33, 243–257. [Google Scholar] [CrossRef]
- Adler, P.S.; Kwon, S.W. Social capital: Prospects for a new concept. Acad. Manag. Rev. 2002, 27, 17–40. [Google Scholar] [CrossRef]
- Putnam, R.D. The prosperous community. Am. Prospect 1993, 4, 35–42. [Google Scholar]
- Kitzmueller, M.; Shimshack, J. Economic perspectives on corporate social responsibility. J. Econ. Lit. 2012, 50, 51–84. [Google Scholar] [CrossRef]
- Lins, K.V.; Servaes, H.; Tamayo, A. Social capital, trust, and firm performance: The value of corporate social responsibility during the financial crisis. J. Financ. 2017. [Google Scholar] [CrossRef]
- Schmitz, J.; Schrader, J. Corporate Social Responsibility: A Microeconomic Review of the Literature. J. Econ. Surv. 2015, 29, 27–45. [Google Scholar] [CrossRef]
- Latane, B.; Darley, J.M. Group inhibition of bystander intervention in emergencies. J. Personal. Soc. Psychol. 1968, 10, 215. [Google Scholar] [CrossRef]
- Dana, J.; Weber, R.; Kuang, J. Exploiting moral wiggle room: experiments demonstrating an illusory preference for fairness. Econ. Theory 2007, 33, 67–80. [Google Scholar] [CrossRef]
- Diekmann, A. Volunteer’s Dilemma. J. Confl. Resolut. 1985, 29, 605–610. [Google Scholar] [CrossRef]
- Latane, B.; Nida, S. Ten years of research on group size and helping. Psychol. Bull. 1981, 89, 308–324. [Google Scholar] [CrossRef]
- Panchanathan, K.; Frankenhuis, W.E.; Silk, J.B. The bystander effect in an N-person dictator game. Organ. Behav. Hum. Decis. Process. 2013, 120, 285–297. [Google Scholar] [CrossRef]
- Darai, D.; Rouxy, C.; Schneider, F. Endogenous Mergers, Mavericks and Tacit Collusion: Experimental Evidence; Mimeo, Cambride University: Cambride, UK, 2019. [Google Scholar]
- Goette, L.; Schmutzler, A. Merger policy: What can we learn from competition policy. In Experiments and Competition Policy; Hinloopen, J., Normann, H.T., Eds.; Cambridge University Press: Cambridge, MA, USA, 2009; pp. 185–216. [Google Scholar]
- Frey, B.S.; Meier, S. Social Comparisons and Pro-Social Behavior: Testing “Conditional Cooperation” in a Field Experiment. Am. Econ. Rev. 2004, 94, 1717–1722. [Google Scholar] [CrossRef]
- Frey, B.S.; Torgler, B. Tax morale and conditional cooperation. J. Comp. Econ. 2007, 35, 136–159. [Google Scholar] [CrossRef]
- Fischbacher, U.; Gächter, S.; Fehr, E. Are people conditionally cooperative? Evidence from a public goods experiment. Econ. Lett. 2001, 71, 397–404. [Google Scholar] [CrossRef]
- Keser, C.; Van Winden, F. Conditional cooperation and voluntary contributions to public goods. Scand. J. Econ. 2000, 102, 23–39. [Google Scholar] [CrossRef]
- Charness, G.; Yang, C.L. Starting small toward voluntary formation of efficient large groups in public goods provision. J. Econ. Behav. Organ. 2014, 102, 119–132. [Google Scholar] [CrossRef]
- Ehrhart, K.; Keser, C. Cooperation and mobility: On the run; Working Paper; CIRANO and University of Karlsruhe: Karlsruhe, Germnay, 1999; p. 99s-24. [Google Scholar]
- Gürerk, Ö.; Irlenbusch, B.; Rockenbach, B. On cooperation in open communities. J. Public Econ. 2014, 120, 220–230. [Google Scholar] [CrossRef]
- Guido, A.; Robbett, A.; Romaniuc, R. Group formation and cooperation in social dilemmas: A survey and meta-analytic evidence. Econ. Behav. Organ. 2019, 159, 192–209. [Google Scholar] [CrossRef]
- Feiler, L.; Camerer, C.F. Code creation in endogenous merger experiments. Econ. Inq. 2010, 48, 337–352. [Google Scholar] [CrossRef]
- Ranehill, E.; Schneider, F.; Weber, R.A. Growing Groups, Cooperation, and the Rate of Entry. CESifo Working Paper Series 2014, No. 4719. Available online: https://papers.ssrn.com/sol3/papers.cfm?abstract_id=2425583 (accessed on 15 December 2018).
- Weber, R.A.; Camerer, C.F. Cultural conflict and merger failure: An experimental approach. Manag. Sci. 2003, 49, 400–415. [Google Scholar] [CrossRef]
- Weber, R.A. Managing growth to achieve efficient coordination in large groups. Am. Econ. Rev. 2006, 96, 114–126. [Google Scholar] [CrossRef]
- Archetti, M. The volunteer’s dilemma and the optimal size of a social group. J. Theor. Biol. 2009, 261, 475–480. [Google Scholar] [CrossRef]
- Diekmann, A. Volunteers Dilemma. A Social Trap without a Dominant Strategy and some Empirical Results. In Paradoxical Effects of Social Behavior; Springer: Berlin, Germany, 1986; pp. 187–197. [Google Scholar]
- Murnighan, J.K.; Kim, J.W.; Metzger, A.R. The volunteer dilemma. Adm. Sci. Q. 1993, 38, 515–538. [Google Scholar] [CrossRef]
- Isaac, R.M.; Walker, J.M. Group size effects in public goods provision: The voluntary contributions mechanism. Q. J. Econ. 1988, 103, 179–199. [Google Scholar] [CrossRef]
- Isaac, R.M.; Walker, J.M.; Williams, A.W. Group size and the voluntary provision of public goods: experimental evidence utilizing large groups. J. Public Econ. 1994, 54, 1–36. [Google Scholar] [CrossRef]
- Carpenter, J.P. Punishing free-riders: How group size affects mutual monitoring and the provision of public goods. Games Econ. Behav. 2007, 60, 31–51. [Google Scholar] [CrossRef]
- Feri, F.; Irlenbusch, B.; Sutter, M. Efficiency gains from team-based coordinationlarge-scale experimental evidence. Am. Econ. Rev. 2010, 100, 1892–1912. [Google Scholar] [CrossRef]
- Gaube, T. Altruism and charitable giving in a fully replicated economy. J. Public Econ. 2006, 90, 1649–1667. [Google Scholar] [CrossRef][Green Version]
- Nosenzo, D.; Quercia, S.; Sefton, M. Cooperation in small groups: The effect of group size. Exp. Econ. 2015, 18, 4–14. [Google Scholar] [CrossRef]
- Huckman, R.S.; Staats, B.R.; Upton, D.M. Team familiarity, role experience, and performance: Evidence from Indian software services. Manag. Sci. 2009, 55, 85–100. [Google Scholar] [CrossRef]
- Smeets, V.; Ierulli, K.; Gibbs, M. An Empirical Analysis of Post-Merger Organizational Integration. Scand. J. Econ. 2016, 118, 463–493. [Google Scholar] [CrossRef]
- Ashforth, B.E.; Mael, F. Social identity theory and the organization. Acad. Manag. Rev. 1989, 14, 20–39. [Google Scholar] [CrossRef]
- Bernhard, H.; Fehr, E.; Fischbacher, U. Group affiliation and altruistic norm enforcement. Am. Econ. Rev. 2006, 96, 217–221. [Google Scholar] [CrossRef]
- Efferson, C.; Lalive, R.; Fehr, E. The coevolution of cultural groups and ingroup favoritism. Science 2008, 321, 1844–1849. [Google Scholar] [CrossRef]
- Falk, A.; Zehnder, C. A city-wide experiment on trust discrimination. J. Public Econ. 2013, 100, 15–27. [Google Scholar] [CrossRef]
- Goette, L.; Huffman, D.; Meier, S. The Impact of Group Membership on Cooperation and Norm Enforcement: Evidence Using Random Assignment to Real Social Groups. Am. Econ. Rev. 2006, 96, 212–216. [Google Scholar] [CrossRef]
- Charness, G.; Rigotti, L.; Rustichini, A. Individual behavior and group membership. Am. Econ. Rev. 2007, 97, 1340–1352. [Google Scholar] [CrossRef]
- Grund, C.; Harbring, C.; Thommes, K. Public good provision in blended groups of partners and strangers. Econ. Lett. 2015, 134, 41–44. [Google Scholar] [CrossRef]
- Grund, C.; Harbring, C.; Thommes, K. Group (Re-) formation in Public Good Games: The Tale of the Bad Apple? Econ. Behav. Organ. 2018, 145, 306–319. [Google Scholar] [CrossRef]
- Attanasi, G.; Hopfensitz, A.; Lorini, E.; Moisan, F. Social connectedness improves co-ordination on individually costly, efficient outcomes. Eur. Econ. Rev. 2016, 90, 86–106. [Google Scholar] [CrossRef]
- Bisin, A.; Verdier, T. Beyond the melting pot: cultural transmission, marriage, and the evolution of ethnic and religious traits. Q. J. Econ. 2000, 115, 955–988. [Google Scholar] [CrossRef]
- Bisin, A.; Verdier, T. The Economics of Cultural Transmission and the Dynamics of Preferences. J. Econ. Theory 2001, 97, 298–319. [Google Scholar] [CrossRef]
- Fehr, E.; Gächter, S. Cooperation and punishment in public goods experiments. Am. Econ. Rev. 2000, 90, 980–994. [Google Scholar] [CrossRef]
- Feld, L.P.; Torgler, B. Tax Morale after the Reunification of Germany: Results from a Quasi-Natural Experiment. CESifo Working Paper. 2007, No. 1921. Available online: https://ideas.repec.org/p/ces/ceswps/_1921.html (accessed on 15 Decmeber 2018).
- Feld, L.P.; Torgler, B.; Dong, B. Coming Closer? Tax Morale, Deterrence and Social Learning after German Unification; Working Paper No. 232; Queensland University of Technology, School of Economics and Finance: Brisbane, Australia, 2008. [Google Scholar]
- Attanasi, G.; Dessi, R.; Moisan, F.; Robertson, D. Public Goods and Future Audiences: Acting as Role Models?: The Audience Matters; No. 17-860; Toulouse School of Economics (TSE), Working Paper; Toulouse School of Economics: Toulouse, France, 2018. [Google Scholar]
- Brosig-Koch, J.; Helbach, C.; Ockenfels, A.; Weimann, J. Still different after all these years: Solidarity behavior in East and West Germany. J. Public Econ. 2011, 95, 1373–1376. [Google Scholar] [CrossRef]
- Ockenfels, A.; Weimann, J. Types and patterns: An experimental East-West-German comparison of cooperation and solidarity. J. Public Econ. 1999, 71, 275–287. [Google Scholar] [CrossRef]
- Selten, R.; Ockenfels, A. An Experimental Solidarity Game. Econ. Behav. Organ. 1998, 34, 517–539. [Google Scholar] [CrossRef]
- Croson, R.T.; Marks, M.B. Step returns in threshold public goods: A meta-and experimental analysis. Exp. Econ. 2000, 2, 239–259. [Google Scholar] [CrossRef]
- Fischbacher, U. z-Tree: Zurich Toolbox for Ready-made Economic Experiments. Exp. Econ. 2007, 10, 171–178. [Google Scholar] [CrossRef]
- Greiner, B. Subject pool recruitment procedures: organizing experiments with ORSEE. J. Econ. Sci. Assoc. 2015, 1, 114–125. [Google Scholar] [CrossRef]
- Hugh-Jones, D.; Leroch, M. Intergroup Revenge: A Laboratory Experiment. Homo Oeconomicus 2017, 34, 117–135. [Google Scholar] [CrossRef]
- Chaudhuri, A. Sustaining cooperation in laboratory public goods experiments: A selective survey of the literature. Exp. Econ. 2011, 14, 47–83. [Google Scholar] [CrossRef]
- Ledyard, J. Public Goods: A Survey of Experimental Research. In Handbook of Experiment Economic; Kagel, J., Roth, A., Eds.; Princeton University Press: Princeton, NJ, USA, 1995; pp. 111–194. [Google Scholar]
- Przepiorka, W.; Diekmann, A. Heterogeneous groups overcome the diffusion of responsibility problem in social norm enforcement. PLoS ONE 2018, 13, e0208129. [Google Scholar] [CrossRef]
- Miller, D.L.; Cameron, A.C. Robust Inference with Clustered Data. In Handbook of Empirical Economics and Finance; Chapman and Hall/CRC: Boca Raton, FL, USA, 2016; pp. 16–43. [Google Scholar]
- Cameron, A.C.; Gelbach, J.B.; Miller, D.L. Bootstrap-based improvements for inference with clustered errors. Rev. Econ. Stat. 2008, 90, 414–427. [Google Scholar] [CrossRef]
- Roodman, D.; Ørregaard Nielsen, M.; MacKinnon, J.G.; Webb, M.D. Fast and wild: Bootstrap inference in Stata using boottest. Stata J. 2019, 19, 4–60. [Google Scholar] [CrossRef]
- Duca, S.; Nax, H.H. Groups and scores: The decline of cooperation. J. R. Soc. Interface 2018, 15. [Google Scholar] [CrossRef]
| 1 | |
| 2 | The Part A findings on helping behavior contribute to the literature studying diffusion of responsibility and group size. Existing literature studying pure group size effects finds ambiguous results. Without immediate individual gains from cooperation, individuals diffuse responsibility and are more hesitant to help in larger groups (Latane and Darley [17]; Latane et al. [20]). Dana et al. [18] and Panchanathan et al. [21] find similar effects in multiple dictator games. In a one shot volunteer’s dilemma, the effects are similar (Archetti [36]; Diekmann [19,37]; Murnighan et al. [38]). In other social dilemmas like public goods games, however, empirical evidence does not identify a pure group-size effect. Isaac and Walker [39], Isaac et al. [40], and Carpenter [41], for example, do not find evidence for group-size effects on the provision of costly public goods (or punishment of free riders). In addition, Feri et al. [42] also highlight that groups (of three) are better able to coordinate on efficiency than individuals. Furthermore, Gaube [43] theoretically points out that if groups consist of altruistic individuals, an increase in group size may reduce underprovision of public goods. Nosenzo et al. [44] observe a negative group-size effect with high marginal per capita return and a positive effect of group size when the individual benefits from cooperation are low. In these cases, social considerations may outweigh negative group-size effects. In this study, the lower helping rates in big groups in Part A points to a bystander effect as they are related to the group size. Other factors, such as reputation building or increased reciprocity in small groups may, however, also play a role. |
| 3 | The random combination of groups in Part B of the experiment also relates to the literature on in-group favoritism (see, e.g., Ashforth and Mael [47]; Bernhard et al. [48]; Efferson et al. [49]; Falk and Zehnder [50]; Goette et al. [51]). Given that merged groups consist of two small groups in which subjects previously interacted, the likelihood of expressed solidarity may depend on the pre-merger group affiliation of the subjects who need support. Charness et al. [52] highlight that group membership indeed affects behavior in social dilemmas and individuals cooperate more with their in-group. Furthermore, Grund et al. [53] highlight that cooperation may decrease in blended groups. However, Grund et al. [54] indicate that when groups are newly composed but do not increase in size, previous group history only rarely affects cooperation negatively. Thus, if individuals still discriminate against new group members’ post merger solidarity is likely affected negatively. If, however, individuals welcome the new group members as belonging to their own group, negative consequences from in-group favoritism will not be observed in this experiment. In addition, Attanasi et al. [55] analyze coordination among players interacting with partners from different in-groups in terms of size and social ties. They find that smaller and more salient in-groups lead to significantly more group beneficial choices. |
| 4 | Brosig-Koch et al. [62] use a student subject population and find that norms are still different between the two parts of Germany after 20 years of reunification. They compare their results to behavior of a different student population in Ockenfels and Weimann [63] and ascertain that solidarity norms between Eastern and Western Germans are still different. Their findings indicate that norms harmonize rather slowly over time. |
| 5 | In the helping game, helping is socially inefficient if more or less than three subjects help. |
| 6 | Appendix A.4 in the Appendix highlights that the decision to help or not was really the focus of subjects’ action. |
| 7 | One subject did not provide his or her age. Subjects’ age ranges between 19 and 45 years. |
| 8 | This disparity in number of observations was necessary to gather sufficiently rich data to make meaningful inferences about behavior in Part B of the experiment in which two groups of four were randomly combined to one group of eight. |
| 9 | Average hourly student wage in Germany is 10 Euro. |
| 10 | In addition, before the helping game started in Part A, subjects participated in an incentivized quiz in which subjects solved 20 questions within a time constraint of ten minutes to receive additional income [68]. To avoid grief, envy and income effects in the subsequent parts, the subjects were told about their group performance in the quiz only after the second part of the experiment and before the final questionnaire which was administered to elicit socio demographic variables (like, e.g., age and gender). Detailed experimental instructions can be found in the Appendix B and Supplementary Materials. |
| 11 | Note that I concentrate on the helping rate by group as the main dependent variable. This allows for comparing the share of subjects who help across groups. I also perform analysis on the number of helpers per group and on average group payoffs. |
| 12 | Higher helping behavior in the Merged Group treatment may also impact group welfare. In the helping game, group income is highest if exactly three subjects help. Consequently, excess helping reduces group income. If fewer than three subjects help, however, group payoff is lower compared with the case in which more than three subjects decide to help. Higher norms of helping in the Merged Group treatment may therefore also impact payoffs since the critical threshold of three helpers may be less likely to be reached in the Big Group treatment. For brevity, I concentrate on hypothesis for helping behavior. |
| 13 | Groups with a “high” helping norm are thereby characterized by an average of three (or more in the Big Group treatment) helpers in Part A. Other groups are classified as groups with a "low" helping norm. More information on group classification is provided in Section 3. |
| 14 | The average helping rate by group is defined by the number of subjects in a group who help (between one and seven) divided by the number of potential helpers in a group (seven). In Part A, the average group helping rate in small groups is defined similarly. However, here only three potential helpers are present. |
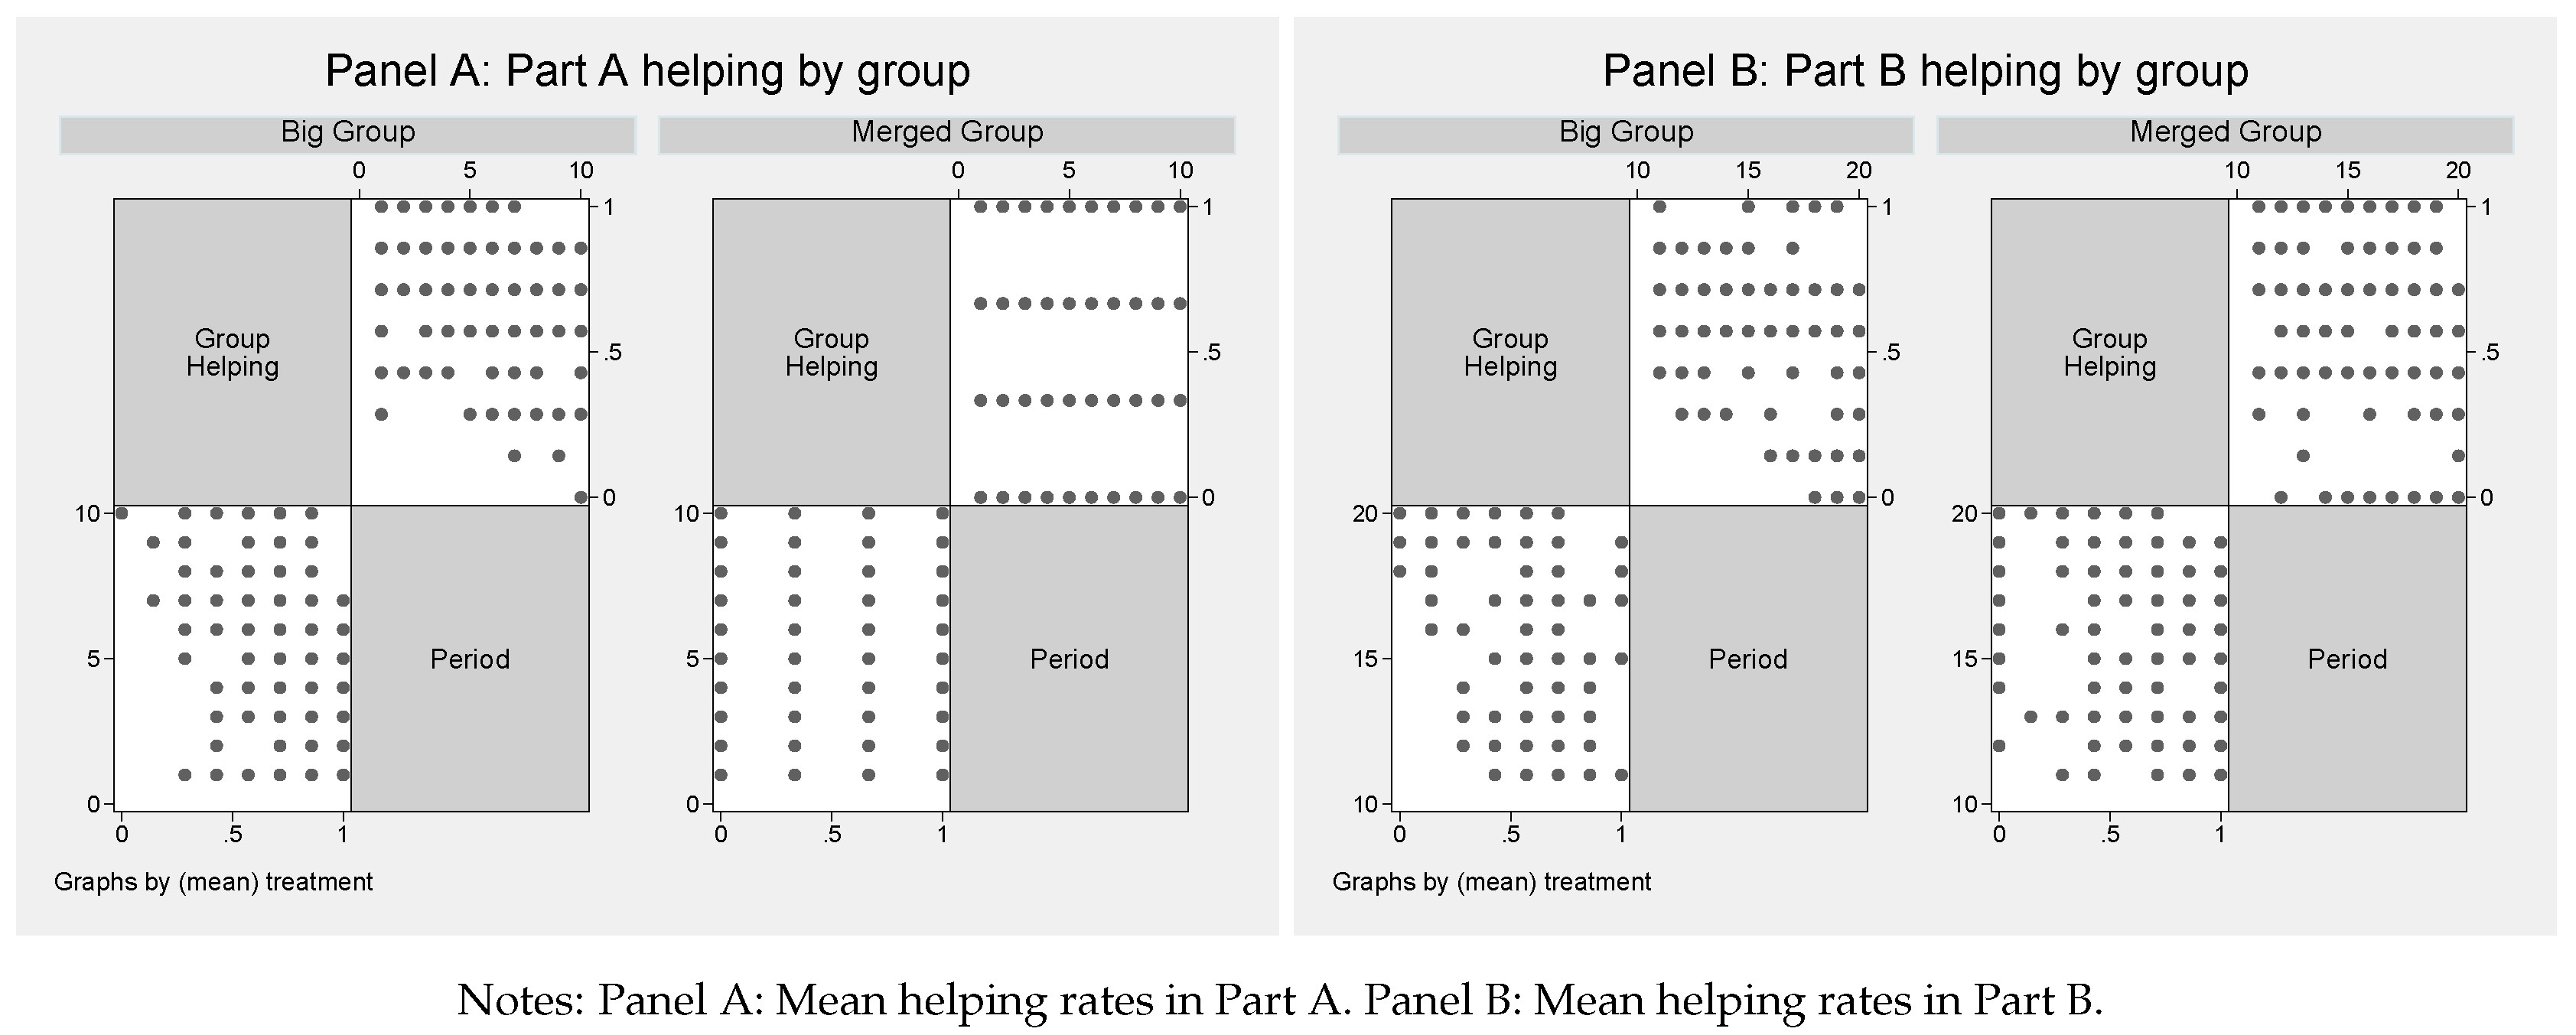
| 15 | Because of a limited number of clusters, I rely on group averages as observations in the regressions instead of using regressions with individual decisions as observations and clustering (Miller and Cameron [72]). Regression results are robust to including controls for period effects and behavior in the quiz (see Appendix A.6). Moreover, regression results are mostly comparable when using individual decisions as observations with bootstrap inference (wild bootstrap) to account for the limited number of clusters (Cameron et al. [73]; Roodman et al. [74]). Furthermore, effects are (at least directionally) already present in Period 11 (see Appendix A.5). |
| 16 | Figure A2 in Appendix A.1 shows the group composition in Part B by high and low helping norms in Part A. |
| 17 | This distinction allows for comparing behavior between small and big groups as all groups in which the subject who lost the endowment received full helping are characterized as those who have established a high helping norm in Part A in both treatments. Other classifications are, however, also possible. Table A3 in Appendix A.1 shows that the results do not change when classifying groups by median or mean helping rate in Part A as having a high or a low helping norm. |
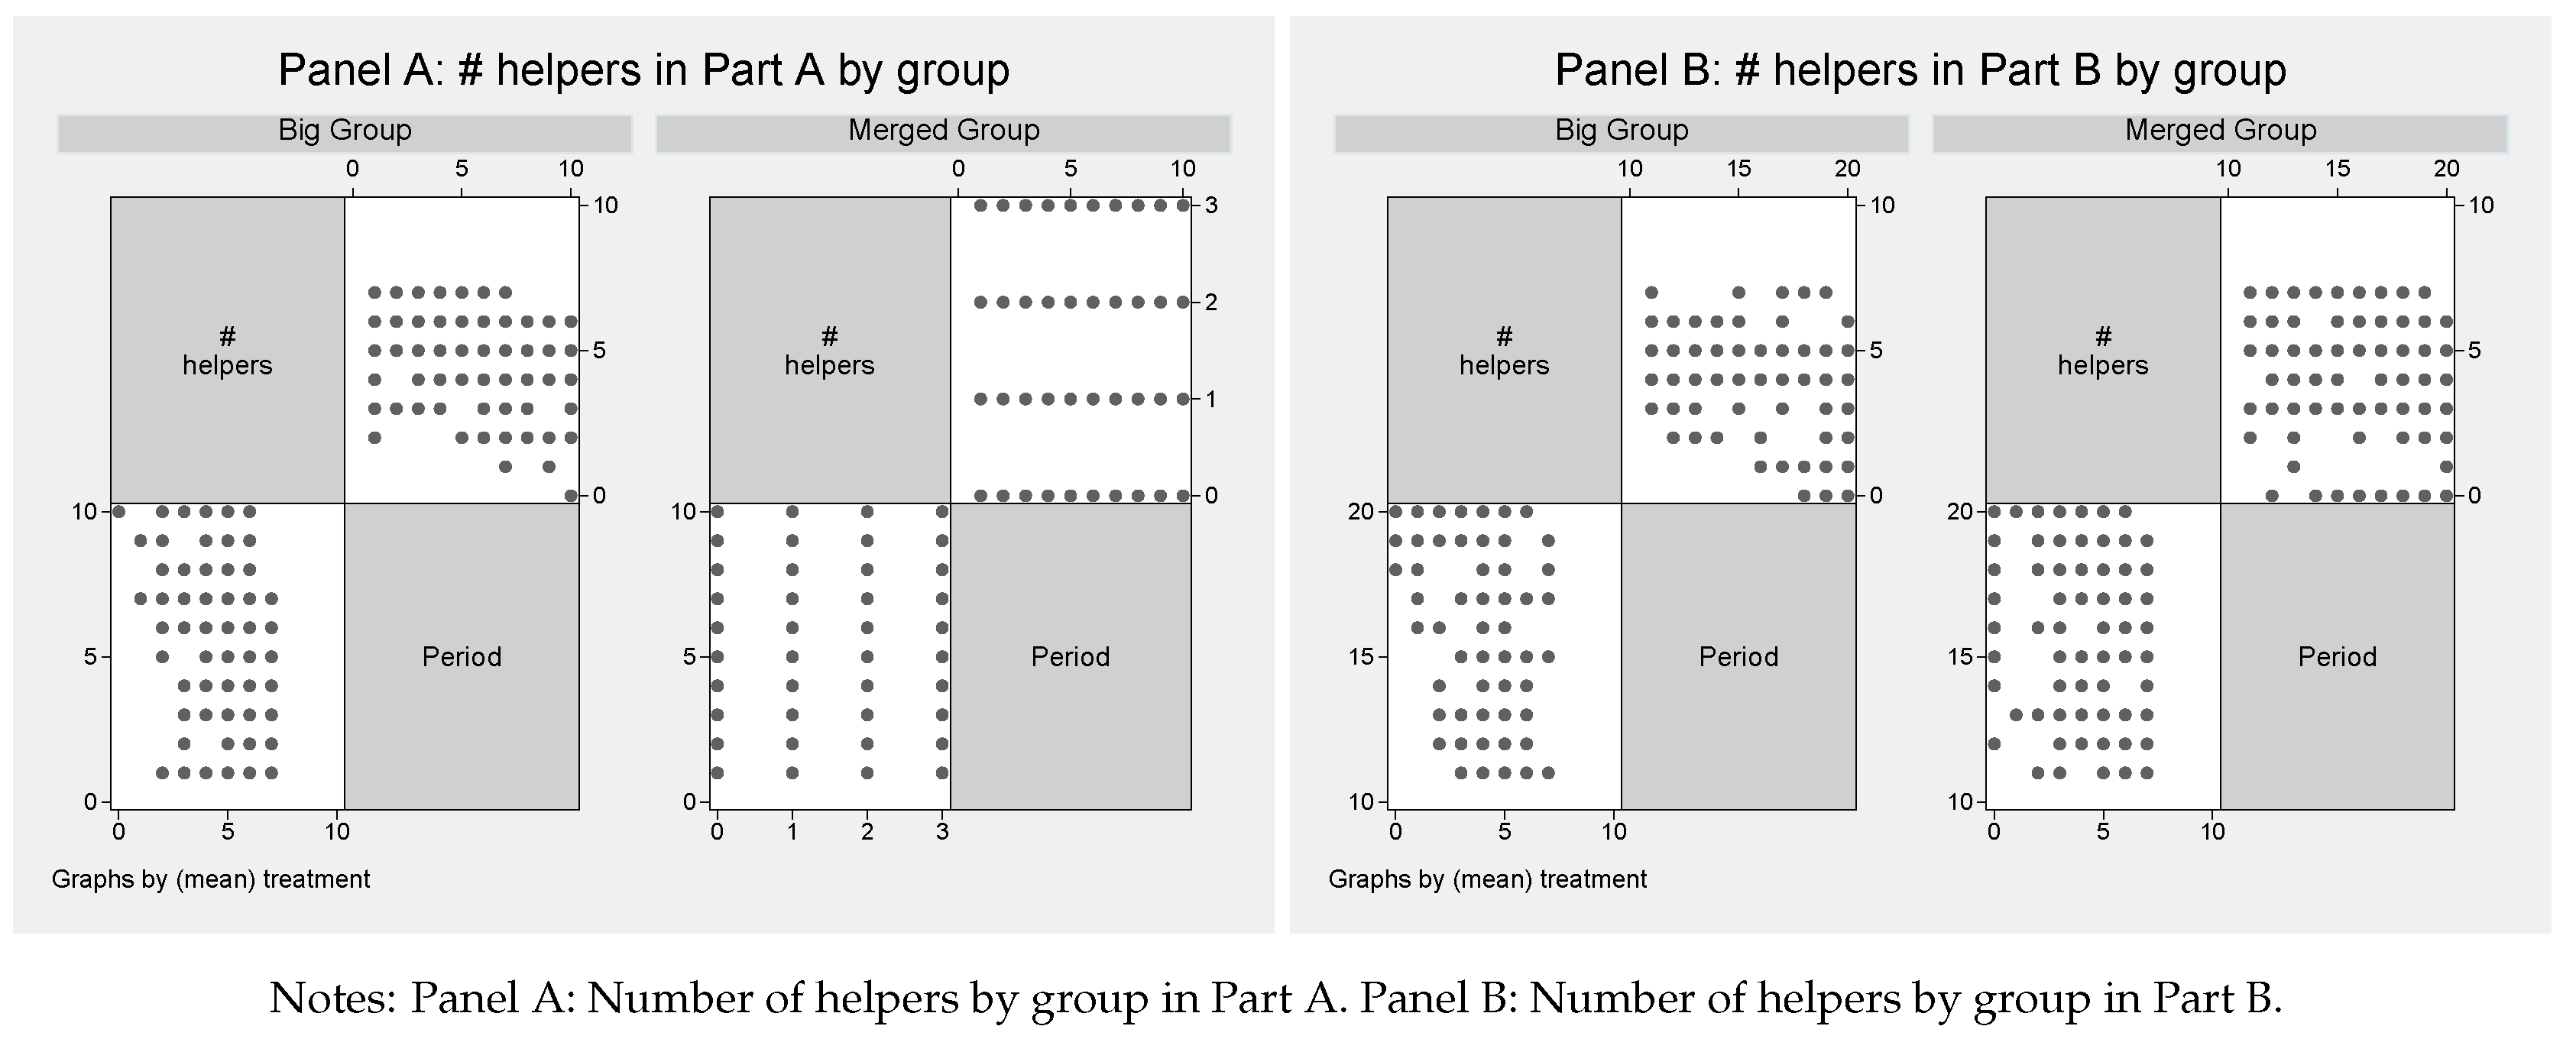
| 18 | Table A4 in Appendix A.2 presents summary statistics for the average number of helpers per group and the average group payoff. The table results on the number of helpers per group concur with the findings for the average helping rates. The table further reveals that there is little variance in group payoffs between treatments and sub-groups. Table A1 presents statistical evidence for the average number of helpers in a group which is likewise in line with the findings on helping rates. Regression results on average group payoffs are presented in Table A5. The results indicate that subjects in the Merged Group treatment earn on average 1 point less than subjects in the Big Group treatment. While this difference is marginally significant it is economically meaningless (1 token transfers to 4 cent). Furthermore, the regressions indicate that the difference is mainly driven by merging of to groups with low helping norms which earn on average 2.3 token less compared with big groups with a low helping rate. |
| 19 | Table A6 in Appendix A.2 presents results from regressions on the average number of helpers per group within the Merged Group treatment. The results show that high helping norms are more influential than low helping norms in the merged groups. Table A7 shows regression results with the average group payoff as the dependent variable within the Merged Group treatment. The table shows that there are little payoff differences between sub-groups, but subjects in groups with a high helping norm forgo profit (1.3 token) in order to help others. |
| 20 | In groups with low helping norms about 26% of the subjects only infrequently help in Part A. In the big groups, 53% of subjects only help sometimes; 31% of the subjects always help and 15% never help in Part A. In small groups, 64% of the subjects always help and only 8% of subjects behave selfishly in Part A. |
| 21 | Furthermore, because subjects know the id of the subject who lost her endowment in the helping game, subjects in the Merged Group treatment are able to distinguish old group members from new group members in Part B of the experiment. Table A9 and Table A10 in Appendix A.3 highlight that groups with a high helping norm are slightly, alas insignificantly, more likely to help if a subject who lost her endowment stems from the same group they have interacted with in Part A of the experiment already. Groups with low helping norms are, however, significantly more likely to help group members who stem from the new group with which they have been merged in Part B. This, however, is not surprising given that the old group has proven to behave in an unsolidaric manner in Part A already. |
| 22 | Duca and Nax [75] study a four image scoring mechanism (plus a control group) which all result in a steady decline in cooperation in repeated multi person prisoner’s dilemma. |
| 23 | Note that average points per group were 109 in the Big Group treatment and 50 points in the Merged Group treatment. This was because of the different group sizes in the quiz. Dividing the total points by group size is thus necessary to identify whether big groups or small groups were more productive in the quiz. |
| # Helpers | Payoff: Subject in Need | Payoff: Helpers | Payoff: Non-Helpers |
|---|---|---|---|
| 0 | 0 | - | 100 |
| 1 | 30 | 30 | 100 |
| 2 | 60 | 60 | 100 |
| 3 + | 90 | 90 | 100 |
| Merged Group | Big Group | |
|---|---|---|
| Part A | Group of 4 | Group of 8 |
| (Period 1–10) | (24) | (12) |
| Part B | Group of 8 | Group of 8 |
| (Period 11–20) | (12) | (12) |
| Big Group | Merged Group | ||||||
|---|---|---|---|---|---|---|---|
| All | High | Low | All | High-High | High-Low | Low-Low | |
| Helping Rate | 0.570 | 0.639 | 0.432 | 0.633 | 0.697 | 0.759 | 0.319 |
| (0.168) | (0.110) | (0.194) | (0.250) | (0.091) | (0.215) | (0.243) | |
| High; Low | |||||||
| 0.844; 0.674 | |||||||
| (0.117; 0.265) | |||||||
| Big Group | All vs. | High vs. | Low vs. | High vs. | Low vs. | ||
|---|---|---|---|---|---|---|---|
| Merged Group | All | High-High | High-Low | High-Low | High-Low | High-Low | Low-Low |
| (1) | (2) | (3) | (4) | (5) | (6) | (7) | |
| Merged Group | 0.0631 | 0.0607 | 0.118 | 0.325 | 0.211 | 0.235 | −0.113 |
| (0.0342) | (0.0466) | (0.0370) | (0.0463) | (0.0352) | (0.0541) | (0.0591) | |
| Constant | 0.570 | 0.639 | 0.639 | 0.432 | 0.639 | 0.432 | 0.432 |
| (0.0203) | (0.0212) | (0.0211) | (0.0348) | (0.0211) | (0.0348) | (0.0349) | |
| Observations | 240 | 110 | 140 | 100 | 140 | 100 | 70 |
| F | 3.412 | 1.696 | 10.14 | 49.38 | 35.92 | 18.77 | 3.661 |
| R | 0.0141 | 0.0182 | 0.0725 | 0.329 | 0.213 | 0.142 | 0.0534 |
| All | High | Low | |
|---|---|---|---|
| (1) | (2) | (3) | |
| High-High | 0.381 | ||
| (0.0633) | |||
| High-Low | 0.438 | 0.150 | 0.350 |
| (0.0566) | (0.0438) | (0.0549) | |
| Constant | 0.319 | 0.700 | 0.317 |
| (0.0476) | (0.0336) | (0.0361) | |
| Observations | 120 | 120 | 120 |
| F | 31.05 | 11.70 | 40.61 |
| R | 0.372 | 0.0902 | 0.256 |
© 2019 by the author. Licensee MDPI, Basel, Switzerland. This article is an open access article distributed under the terms and conditions of the Creative Commons Attribution (CC BY) license (http://creativecommons.org/licenses/by/4.0/).
Share and Cite
Schmitz, J. When Two Become One: How Group Mergers Affect Solidarity. Games 2019, 10, 30. https://doi.org/10.3390/g10030030
Schmitz J. When Two Become One: How Group Mergers Affect Solidarity. Games. 2019; 10(3):30. https://doi.org/10.3390/g10030030
Chicago/Turabian StyleSchmitz, Jan. 2019. "When Two Become One: How Group Mergers Affect Solidarity" Games 10, no. 3: 30. https://doi.org/10.3390/g10030030
APA StyleSchmitz, J. (2019). When Two Become One: How Group Mergers Affect Solidarity. Games, 10(3), 30. https://doi.org/10.3390/g10030030


