Article

The Application of Ant Colony Algorithms to Improving the Operation of Traction Rectifier Transformers †

1
Faculty of Electrical Engineering, Silesian University of Technology, 44-100 Gliwice, Poland
2
Faculty of Applied Mathematics, Silesian University of Technology, 44-100 Gliwice, Poland
*
Author to whom correspondence should be addressed.
This paper is an extended version of our paper published in proceedings of the 24th International Conference on Information and Software Technologies (ICIST), Kaunas University of Technology, Lithuania, 4–6 October 2018.
Computers 2019, 8(2), 28; https://doi.org/10.3390/computers8020028
Submission received: 26 February 2019 / Revised: 24 March 2019 / Accepted: 26 March 2019 / Published: 28 March 2019

Abstract

:
In this paper, we discuss a technical issue occurring in electric traction. Tram traction may use DC voltage; this is obtained by rectifying AC voltage supplied by the power grid. In the simplest design— one which is commonly used—only diode uncontrolled rectifiers are used. The rectified voltage is not smooth; it always contains a pulsating (AC) component. The amount of pulsation varies. It depends, among other factors, on the design of the transformer-rectifier set. In the 12-pulse system, we use a three-winding transformer, consisting of one primary winding and two secondary windings: one is delta-connected and the other is star-connected. The unbalance of secondary windings is an extra factor increasing the pulsation of DC voltage. To equalize secondary side voltages, a tap changer may be used. The setting of the tap changer is the question resolved in this paper; it is optimized by application of the ACO (ant colony optimization algorithm). We have analyzed different supply voltage variants, and in particular, distorted voltage containing 5th and 7th harmonics. The results of ant colony optimization application are described in this paper.

1. The General Issue: Applying the Swarm Intelligence Algorithm to Optimization Problems

Engineering nowadays often requires the numerical optimization of many and diverse problems. New optimization algorithms are invented all the time; among them, we may distinguish different types of metaheuristic algorithms. The heuristic approach may be termed practical; it may not be optimal in the mathematical sense of the word, but it is quite often sufficient enough from engineering viewpoint. Usually, its main advantage lies in its speed—a satisfactory solution may be found more quickly than in cases when more elaborate numerical algorithms are used.
Among the metaheuristic algorithms, we find lots of procedures based on swarm intelligence. They are inspired by the behaviour of a large population of individuals belonging to one species. The performance of such a group seems to be co-ordinated, even though we cannot identify a leader, i.e., some sort of central control. Every individual in a swarm sends information and receives information from other members of the group, in a way that is peculiar to a given species. It must be stressed that information on the optimum way of acting (e.g., the shortest way to food source) is also exchanged. The entire swarm (system) progresses dynamically. When some individuals find the most effective course of action, the others (receivers of this information) concentrate in the regions of search areas that have proven to be most successful from the viewpoint of the desired goal (e.g., the source of food). Thus, the solution to the problem is attained [1]. Apart from searching for food, other behaviour patterns such as communication, task allotment, decision making, the localization of HQ, choice of partners, mating, and propagation have been the source of inspiration for population algorithms.
Ant colony optimization [2,3,4,5] is one such algorithm. This particular algorithm imitates the social behaviour of ants. The main problem to be solved is how to find—quickly and efficiently—the source of food. An extensive list of other algorithms inspired by animals (including swarm) intelligence may be found, e.g., in [6].
Electrical engineering has started to adopt population-based algorithms, and they have been applied to solve diverse problems such as, e.g., the wind power station energy storage problem [7], the location of capacitor banks in the distribution system [8], the optimized placing of charging stations in the distribution system [9], the optimization of the voltage profile in the distribution system with distributed electricity sources [10], the assessment of 3-phase induction motor parameters [11], some railway transport issues [12], and current balancing in the railway system [13].
We will discuss two technical problems in this paper; to both problems we have applied the ant colony algorithm (ACO) as a solution. One problem is improving the “quality” of the output voltage of the rectifier transformer used in supply of DC tram traction lines; the other problem is equalizing the distribution of loads between secondary windings and rectifiers of the rectifier-transformer set.

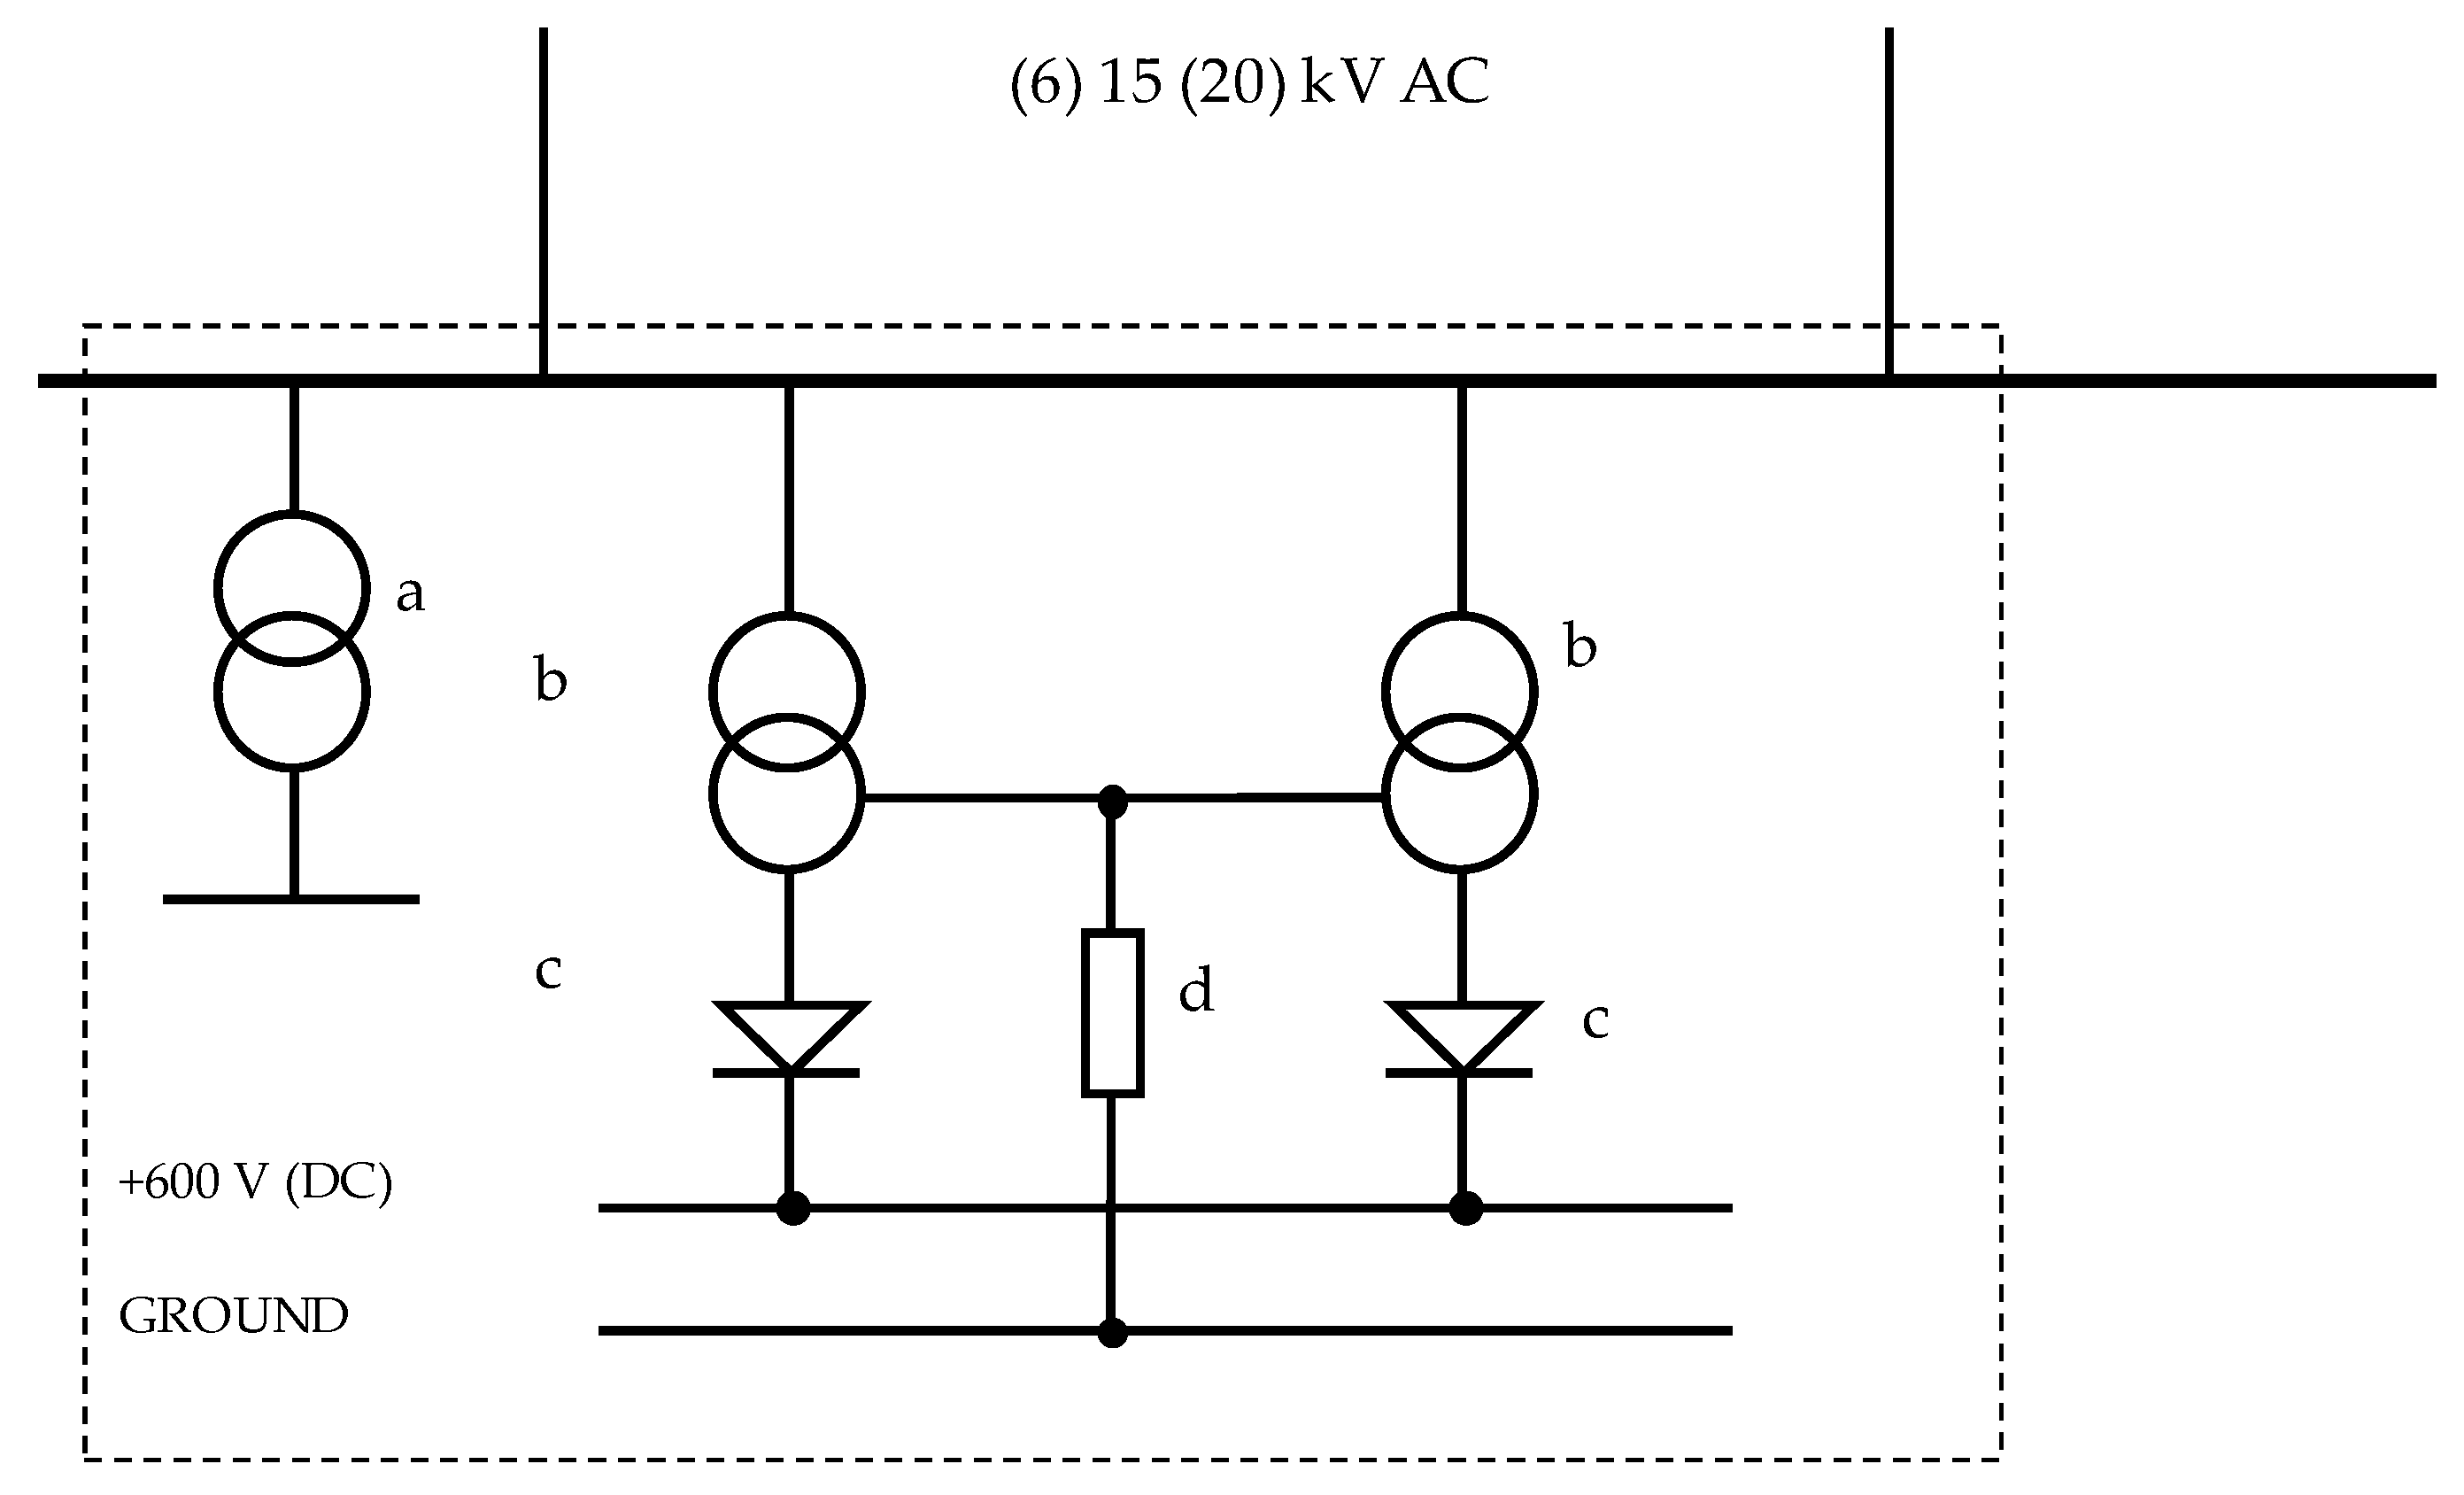
2. Tram Traction Substations in Poland: Voltage Rectification System

DC voltage is used for the entire electric traction supply in Poland; this includes vehicles such as locomotives, electromotive units, and metro and light urban vehicles (e.g., trams). The energy transformation circuit for the tram city network is shown in Figure 1. The main supply line (6, 15, or 20 kV AC voltage) comes from power grid. The traction substation contains HV switching apparatus, devices dedicated to AC/DC transformation and DC switching station.
In this paper we have applied ourselves to discussing a popular and widespread 12-pulse system. This system employs a three-winding, three-phase transformer (Figure 2a). Secondary windings are configured as delta- and star-connected, respectively (this is necessary on account of eliminating magnetic flux harmonics of 3n order, and it is a standard rule followed in transformer construction [14,15]); the result is that secondary voltages are shifted in relation to each other by 30 degrees (el) (see Figure 2b). Of course, this configuration of six voltages may be achieved by other means, e.g., using two two-winding transformers. Our analysis is focused on a technical design that is quite common in practice; relatively simple; and relatively cheap, since such 6-phase transformers are batch-manufactured.
Transformer’s secondary windings are connected to uncontrolled rectifiers, each consisting of six diodes. The rectifiers in tram supply are connected in parallel—see Figure 3.

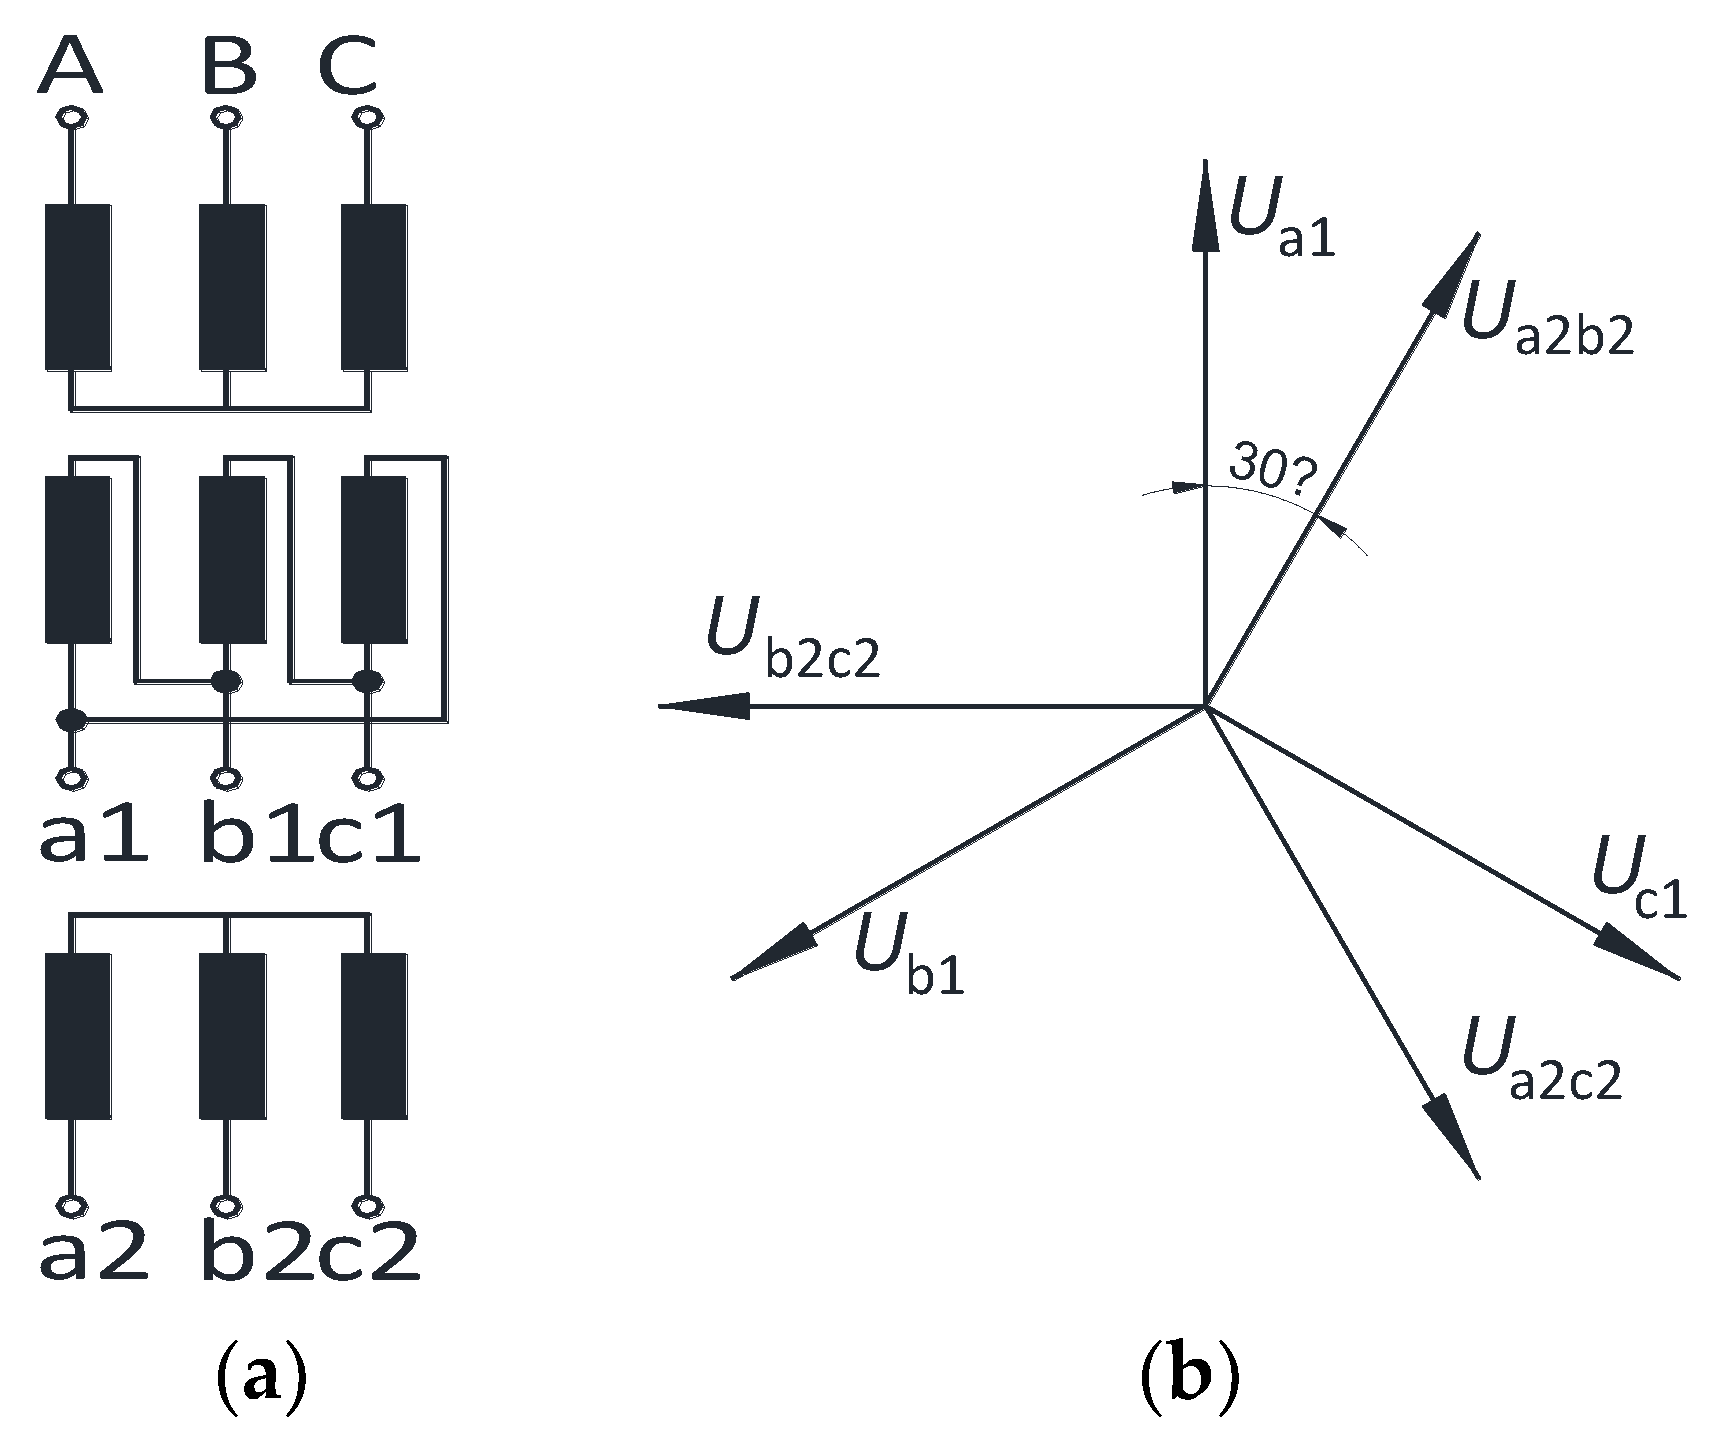
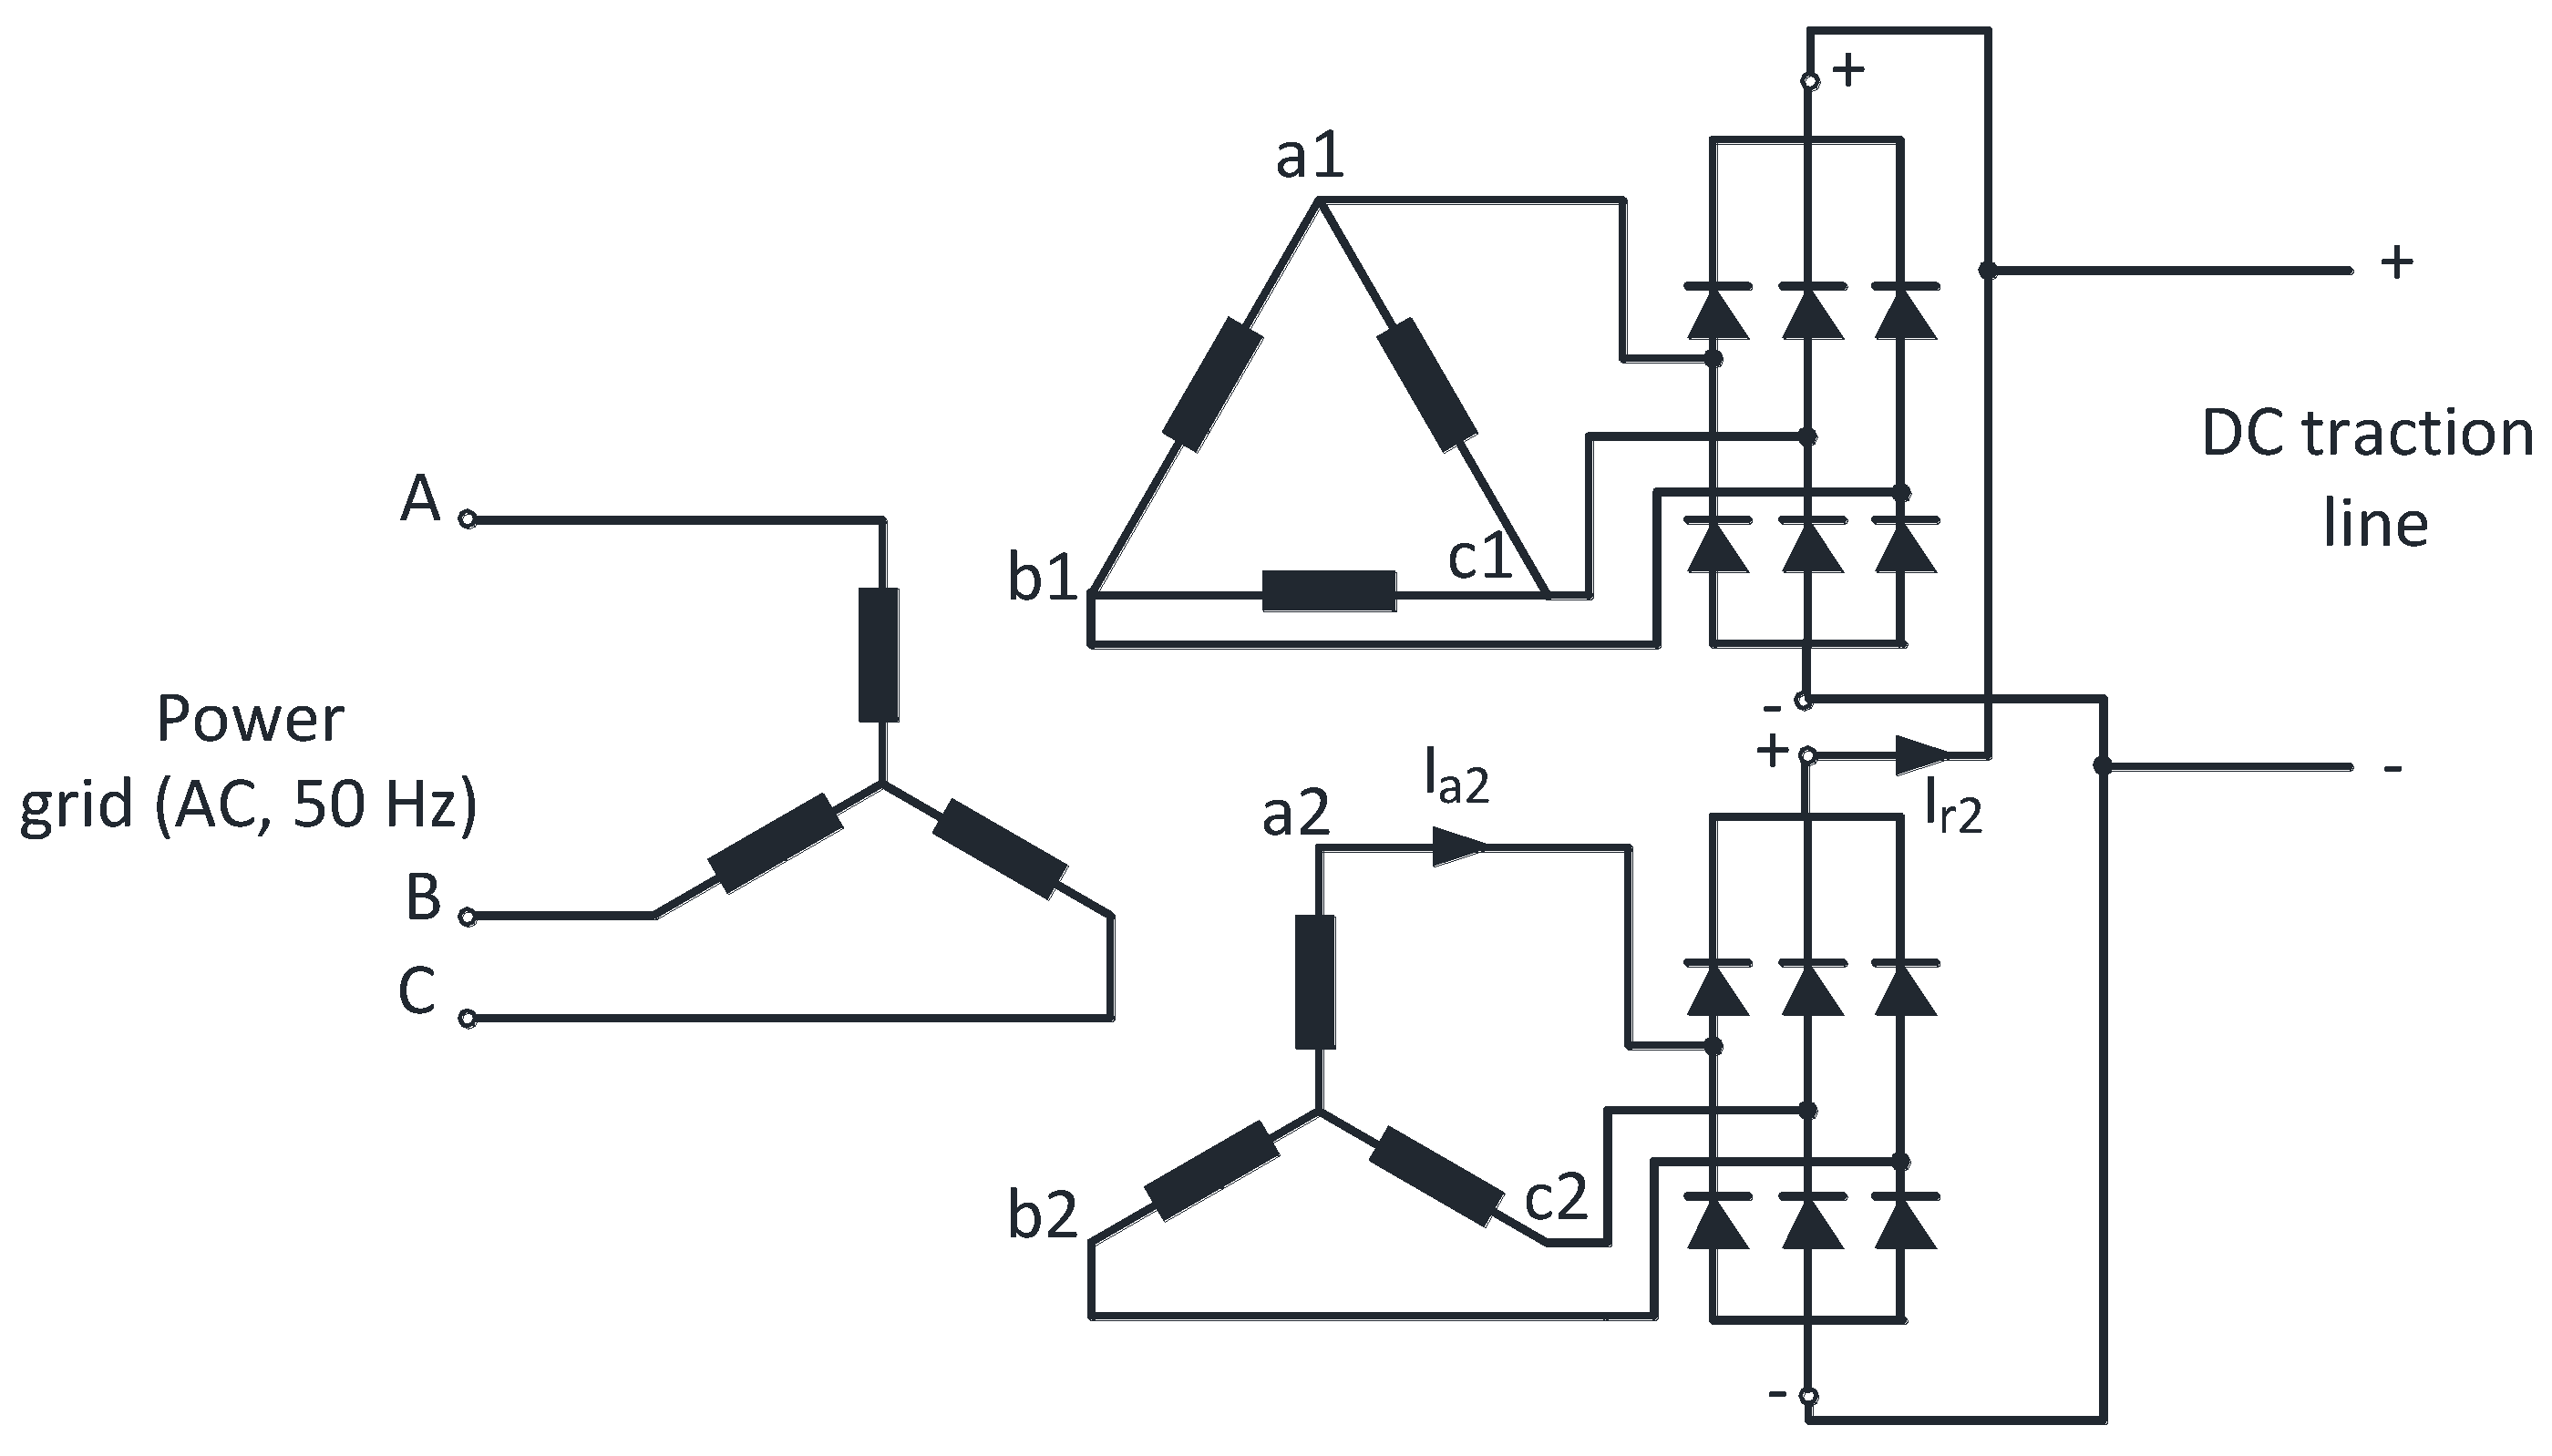
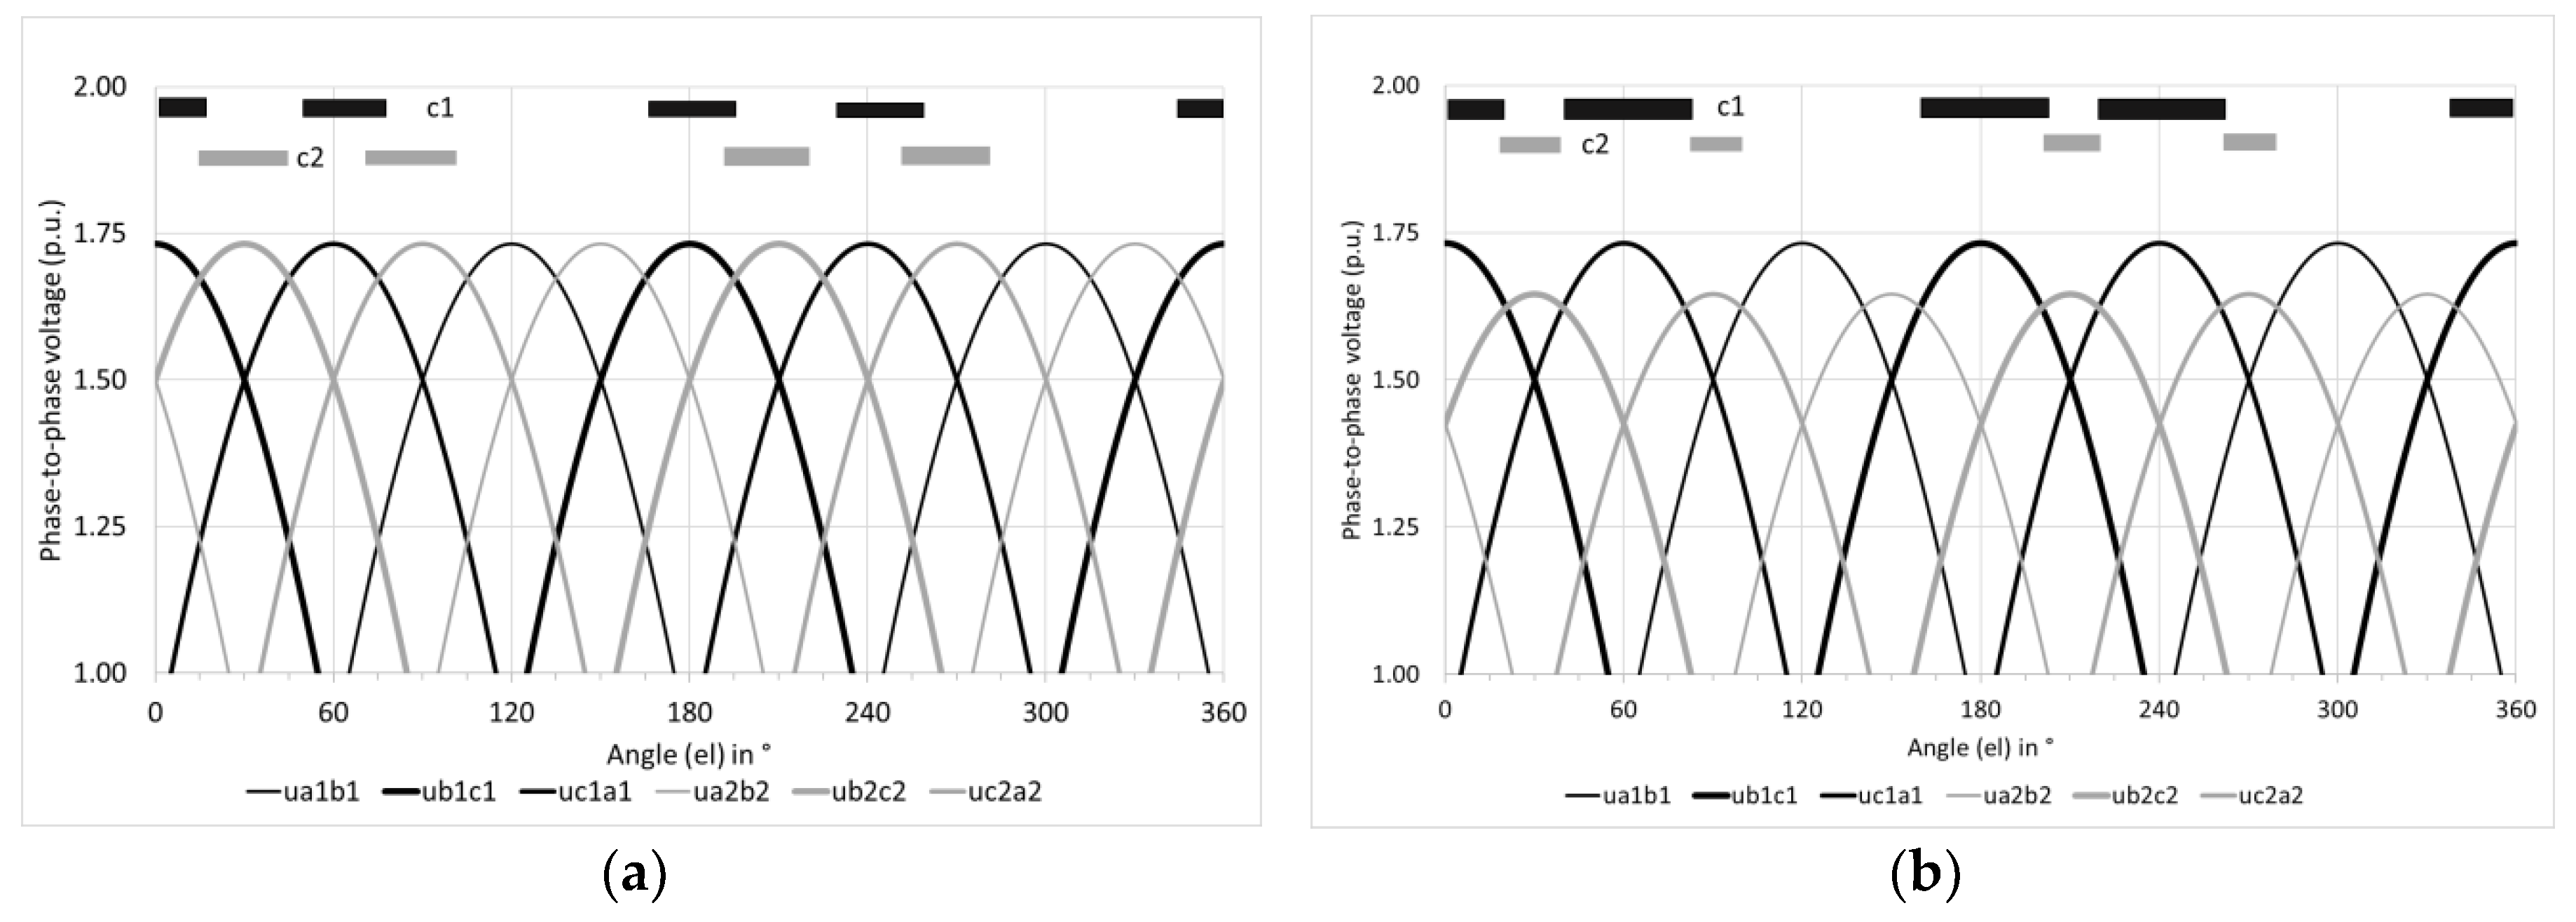
3. Voltage and Current Waveforms in Transformer-Rectifier Set

A starting point for analysis of rectifier-transformer set operation will be an idealized case, when transformer’s secondary voltages are shifted in phase by exactly 30° and phase-to-phase magnitudes of all voltages are identical [16]. Voltages are subjected to rectifier operation (6D rectifier set connected to each secondary winding). The outcome is, that pulses in DC (output) voltage are identical as to magnitude and duration (see Figure 4a). By “pulse” we mean a fragment of the rectified voltage waveform, representing the particular section of phase-to-phase voltage of the secondary winding, which is currently in operation. For instance, let us look at Figure 4a: for angle interval (15°; 45°), it is a fragment of ub2c2 voltage waveform, which is present and operates at the output terminals (+, -) (DC traction line terminals—see Figure 3). The shape of this waveform corresponds to a top fragment of sine waveform (this particular drawing refers to purely sinusoidal supply voltage, hence all pulses are symmetrical: duration of each pulse is 30°, amplitudes of successive pulses are equal). A more realistic case is when voltages are not equal in magnitude, even though the phase shifts remain same as before (let it be noted, that phase shift, or angular displacement of one voltage against the other, depends on spatial distribution of windings in transformer). The outcome is that pulsations in DC (output) voltage are increased (magnitude of voltages corresponding to rectified voltages of one winding is greater) and time durations are different (see Figure 4b). This may occur when numbers of turns in star-connected winding and delta-connected winding are such that induced phase-to-phase voltages are not exactly the same. Ideally, numbers of turns should meet the following conditions:
N 1 = 3 N 2
where N1 and N2 relate to delta- and star-connected windings, respectively.
This effect is due to change in diode conducting times, and, consequently, different durations of transformer winding phase conduction. We assume that output load current is of constant value (this is a usual and justified assumption for DC traction systems). Under ideal conditions, each phase conducts current for 1/3 of total fundamental frequency period; this corresponds to 120 degrees (electrical) of the fundamental sine wave. When windings are unbalanced, one winding will conduct current for a longer time and the other for a shorter time. This effect may be clearly observed in Figure 4b. The dependence of diode conducting times and winding phase current (RMS-value) on the winding unbalance coefficient is shown in Figure 5a,b.
Some problems associated with performance of rectifier transformers operating under diverse supply voltage conditions have been previously indicated e.g., in [17]. Where higher harmonics are considered, we usually focus on the THD, or total harmonic distortion coefficient. From the experimental point of view, this could be measured and monitored continuously using a smart, feasible device dedicated to power quality assessment, an example of which may be found in [18]. This is defined on the basis of RMS values of appropriate quantities (voltages or currents). However, we must point out that apart from RMS values, any change in phase shifts of higher harmonics will also affect the waveform shape. As a result, the rectifier operation for different shapes of supply voltages will yield different diode conducting times and different currents (RMS-values) in transformer’s secondary windings. This means that secondary windings’ loading will become more uneven.
Let us look at rectifier transformer performance, when supply voltage is distorted by 5th and 7th harmonic. We assume the harmonic content in terms of RMS values as 6% and 5% (relative to RMS value of 1st, i.e., fundamental harmonic), in mathematical terms u5% = U5/U1 = 0.06, u7% = U7/U1 = 0.05. When THD coefficient of the supply voltage is calculated, then it is equal to 7.81%; this is less than obligatory limit of 8% enforced by appropriate Polish regulations [19]. An example of system operation, when phase shifts of 5th and 7th harmonic are equal to, respectively, φ5 = 180° and φ7 = 180°, is shown in Figure 6a,b. The equal loading of both windings does no longer occur for unbalance coefficient equal to 1 (unbalance coefficient is defined as the ratio of star to delta winding phase-to-phase voltage). Only these voltages differ slightly, i.e., with unbalance coefficient different from unity; the two windings are evenly loaded (Figure 6b).
From the technical viewpoint of rectifier transformer’s operation, the uniform loading of both transformer secondary windings is important. Uneven loads may lead to problems associated with currents exceeding allowable values such as, e.g., overheating. The same principle applies to rectifiers: one may be underloaded, the other overloaded. This is turn may lead to possible damage of rectifier diodes.

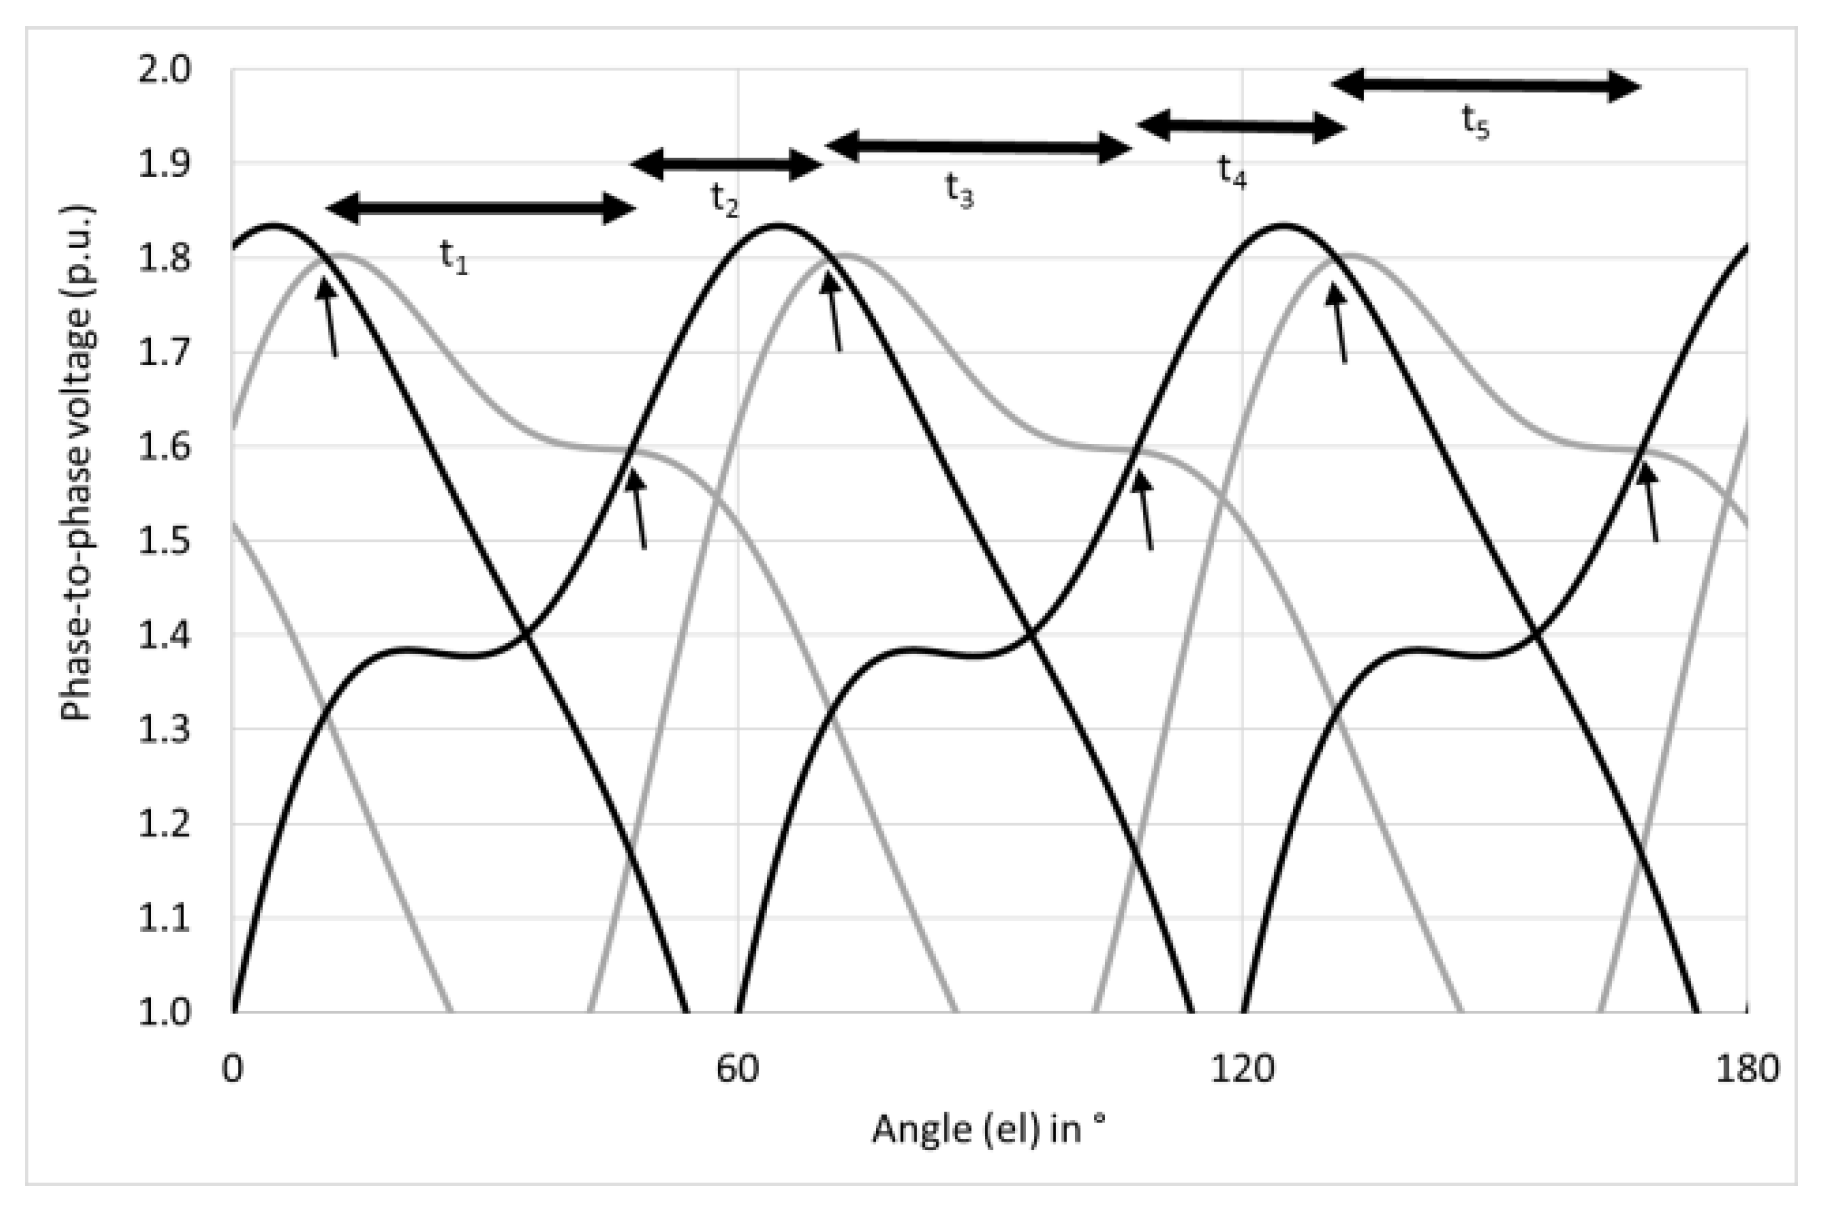
4. Reduction of AC Component in DC Voltage

The analysis will focus on distorted supply case as defined earlier (RMS values for 5th and 7th harmonic are U5 = 0.06 U1 and U7 = 0.05 U1). The phase shifts for higher harmonics may range from 0° to 180°. In accordance with relationships discussed in the previous section, it is obvious that loading of star- and delta-connected windings will depend on the phase shifts—see Figure 7.
“Quality” of DC, i.e., rectified voltage may be assessed by different means. We have decided to apply the pulsation level as decisive factor. Pulsation level of rectifier voltage (uDC) is defined as follows:
p = u D C max u D C min 2 u D C a v , where   u D C a v = u D C max + u D C min 2 ,
where uDCmax and uDCmin are maximum and minimum values of the pulsating rectified voltage (cf. Figure 4b: the peaks of phase-to-phase voltages marked in black /these correspond to first secondary winding are equal to uDCmax, while the intersection points between voltages of first and second winding—known as points of natural commutation—correspond to uDCmin.
If the shape of supply waveform varies, then impact of unbalanced turns (when voltages of secondary windings are uneven as explained earlier) alters as well. For the sake of DC traction voltage analysis, it is usually justly assumed that traction network current is constant. Therefore, pulsation of instantaneous power transmitted by traction network (and fed to traction vehicles, in particular the traction drives) mirrors the pulsation in rectified voltage.
In order to reduce ripple in DC voltage, we will try to compensate the unbalance of secondary windings’ voltages. This might be achieved by applying on-load tap changer, which should adjust voltage of one secondary winding. Furthermore, adjustment of secondary winding voltage may also be used to equalize the uneven loading of transformer windings. The principle is demonstrated in Figure 8.
The problem posed here is calculation of tap changer setting. This should be adjusted in step with varying harmonic distortions of supply voltage (here we should consider not only the value of THD coefficient but also phase angles of analyzed harmonics). In the analysis, THD was assumed to be equal to 7.81% (with 5th and 7th harmonic present). We assumed that phase shifts of harmonics n = 5 and n = 7 would be changed in a continuous manner from 0° to 360°.
This solution of this problem is shown in subsequent section; swarm population algorithm has been utilized.

5. Optimization of Voltage Transformation—Application of Ant Colony Algorithm

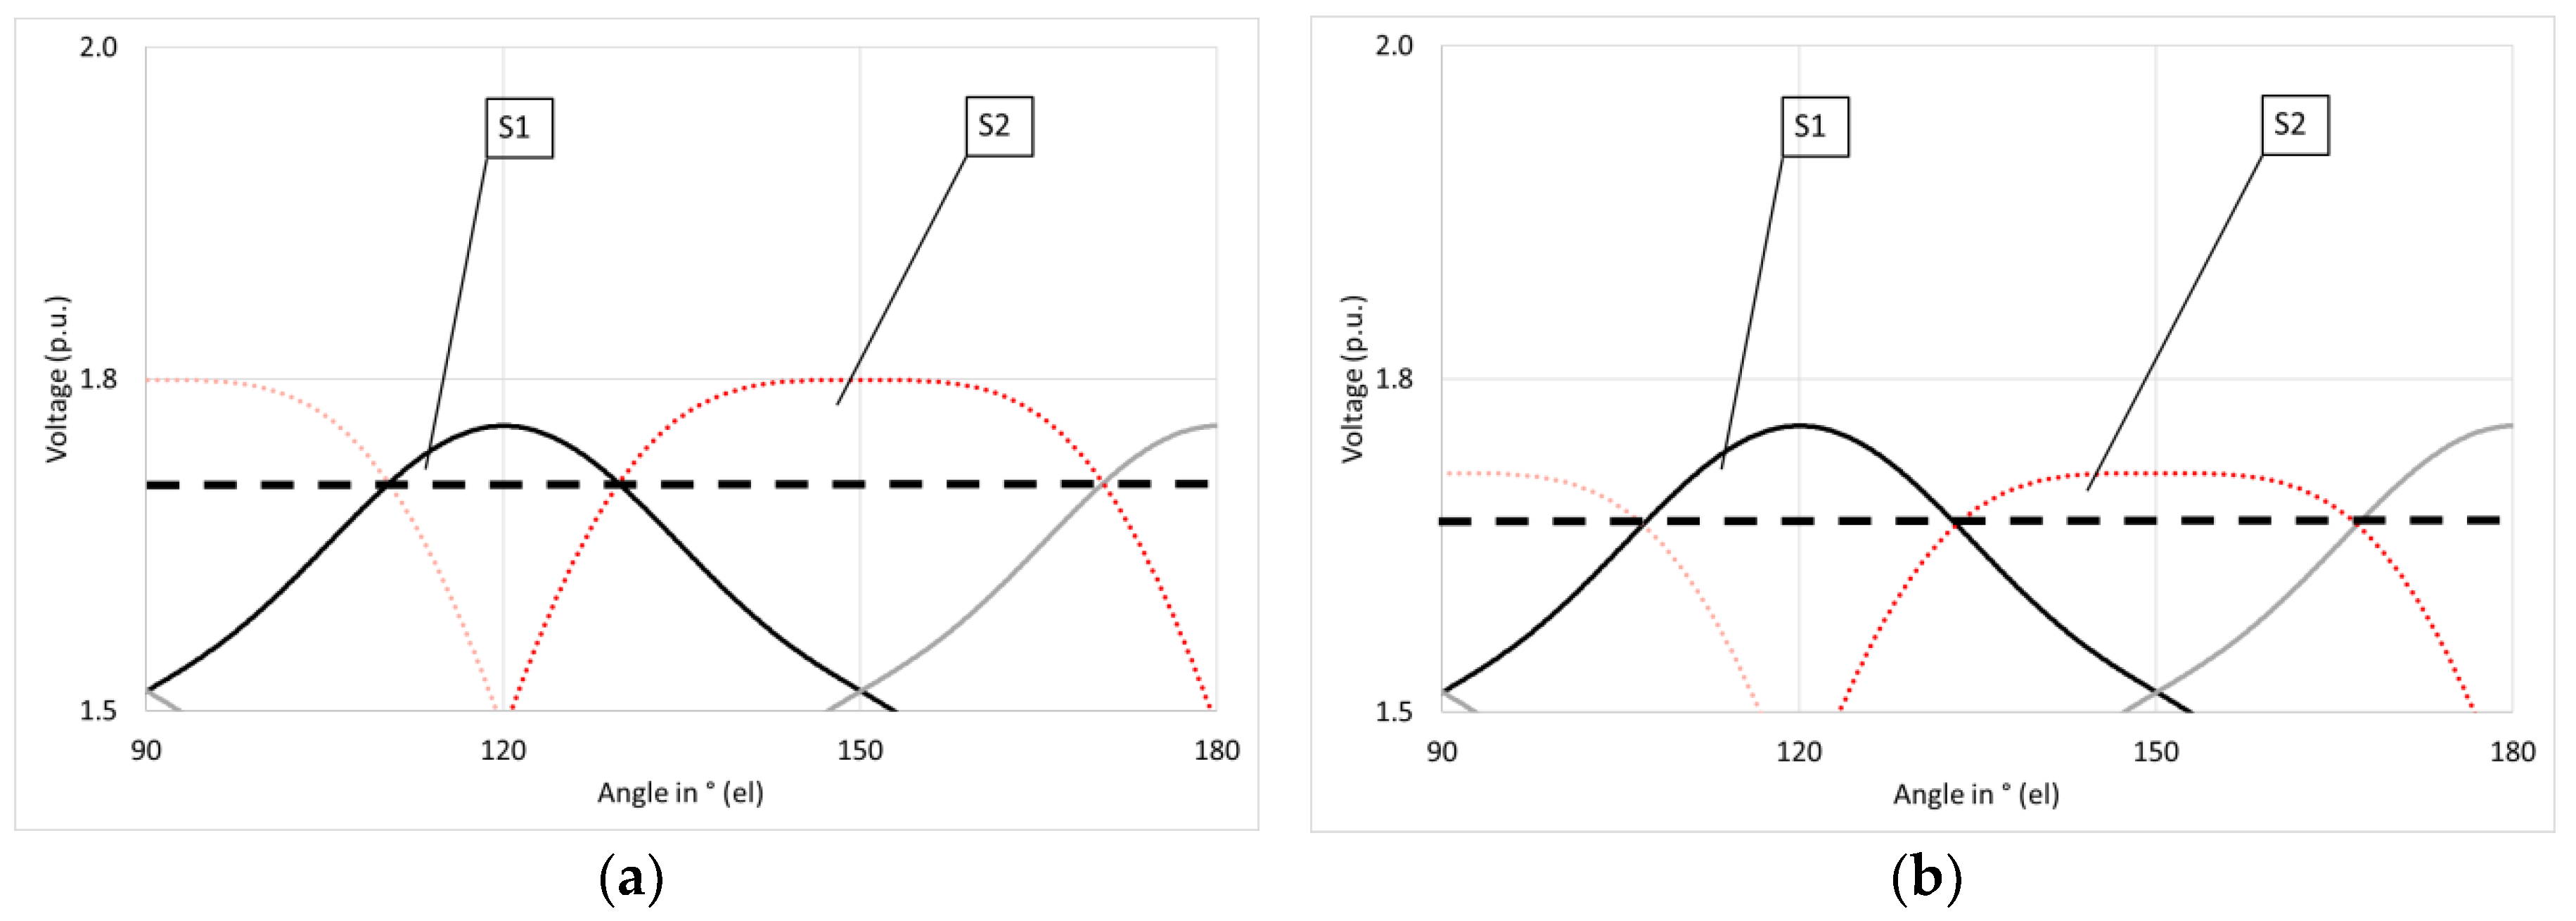
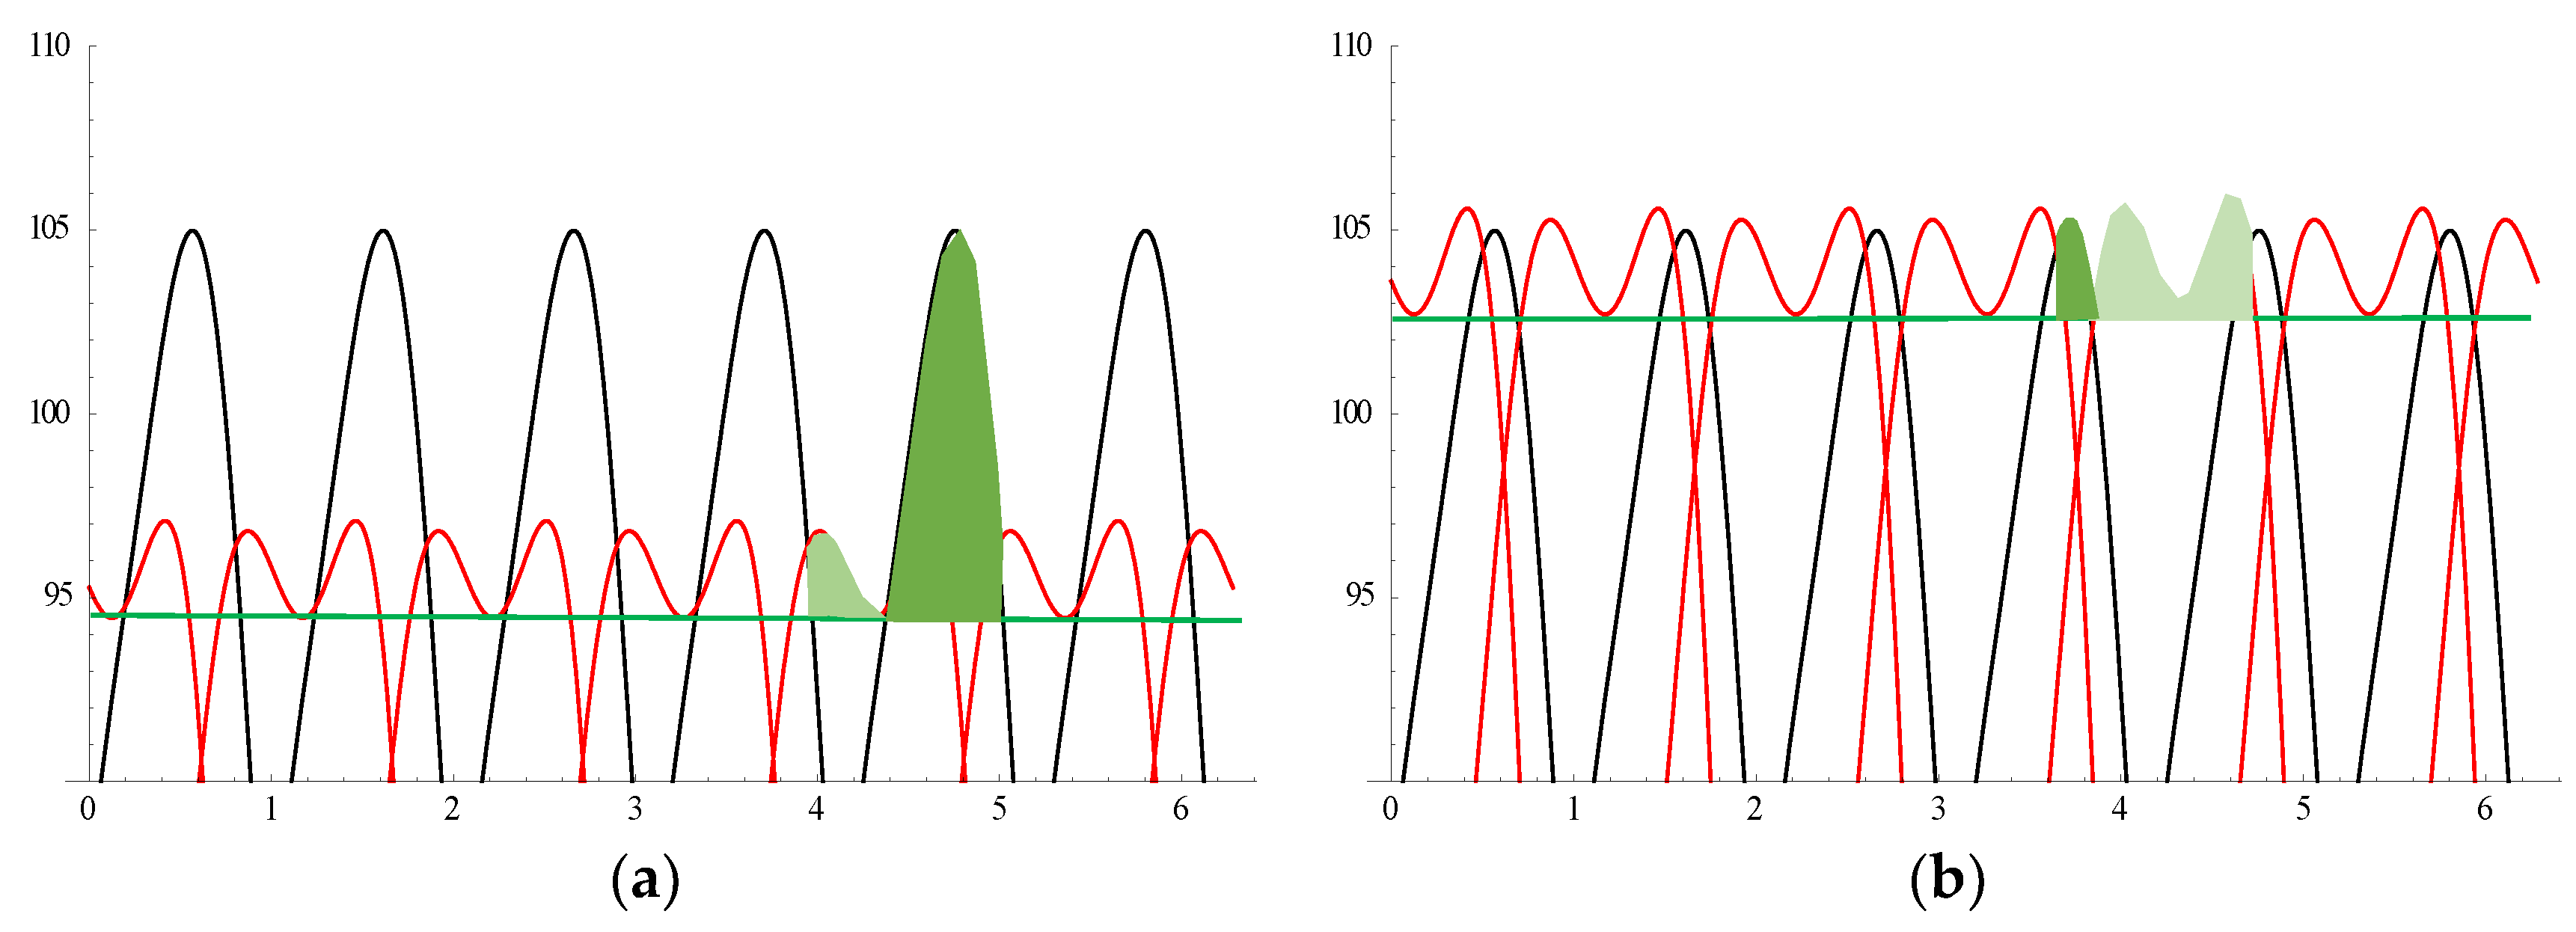
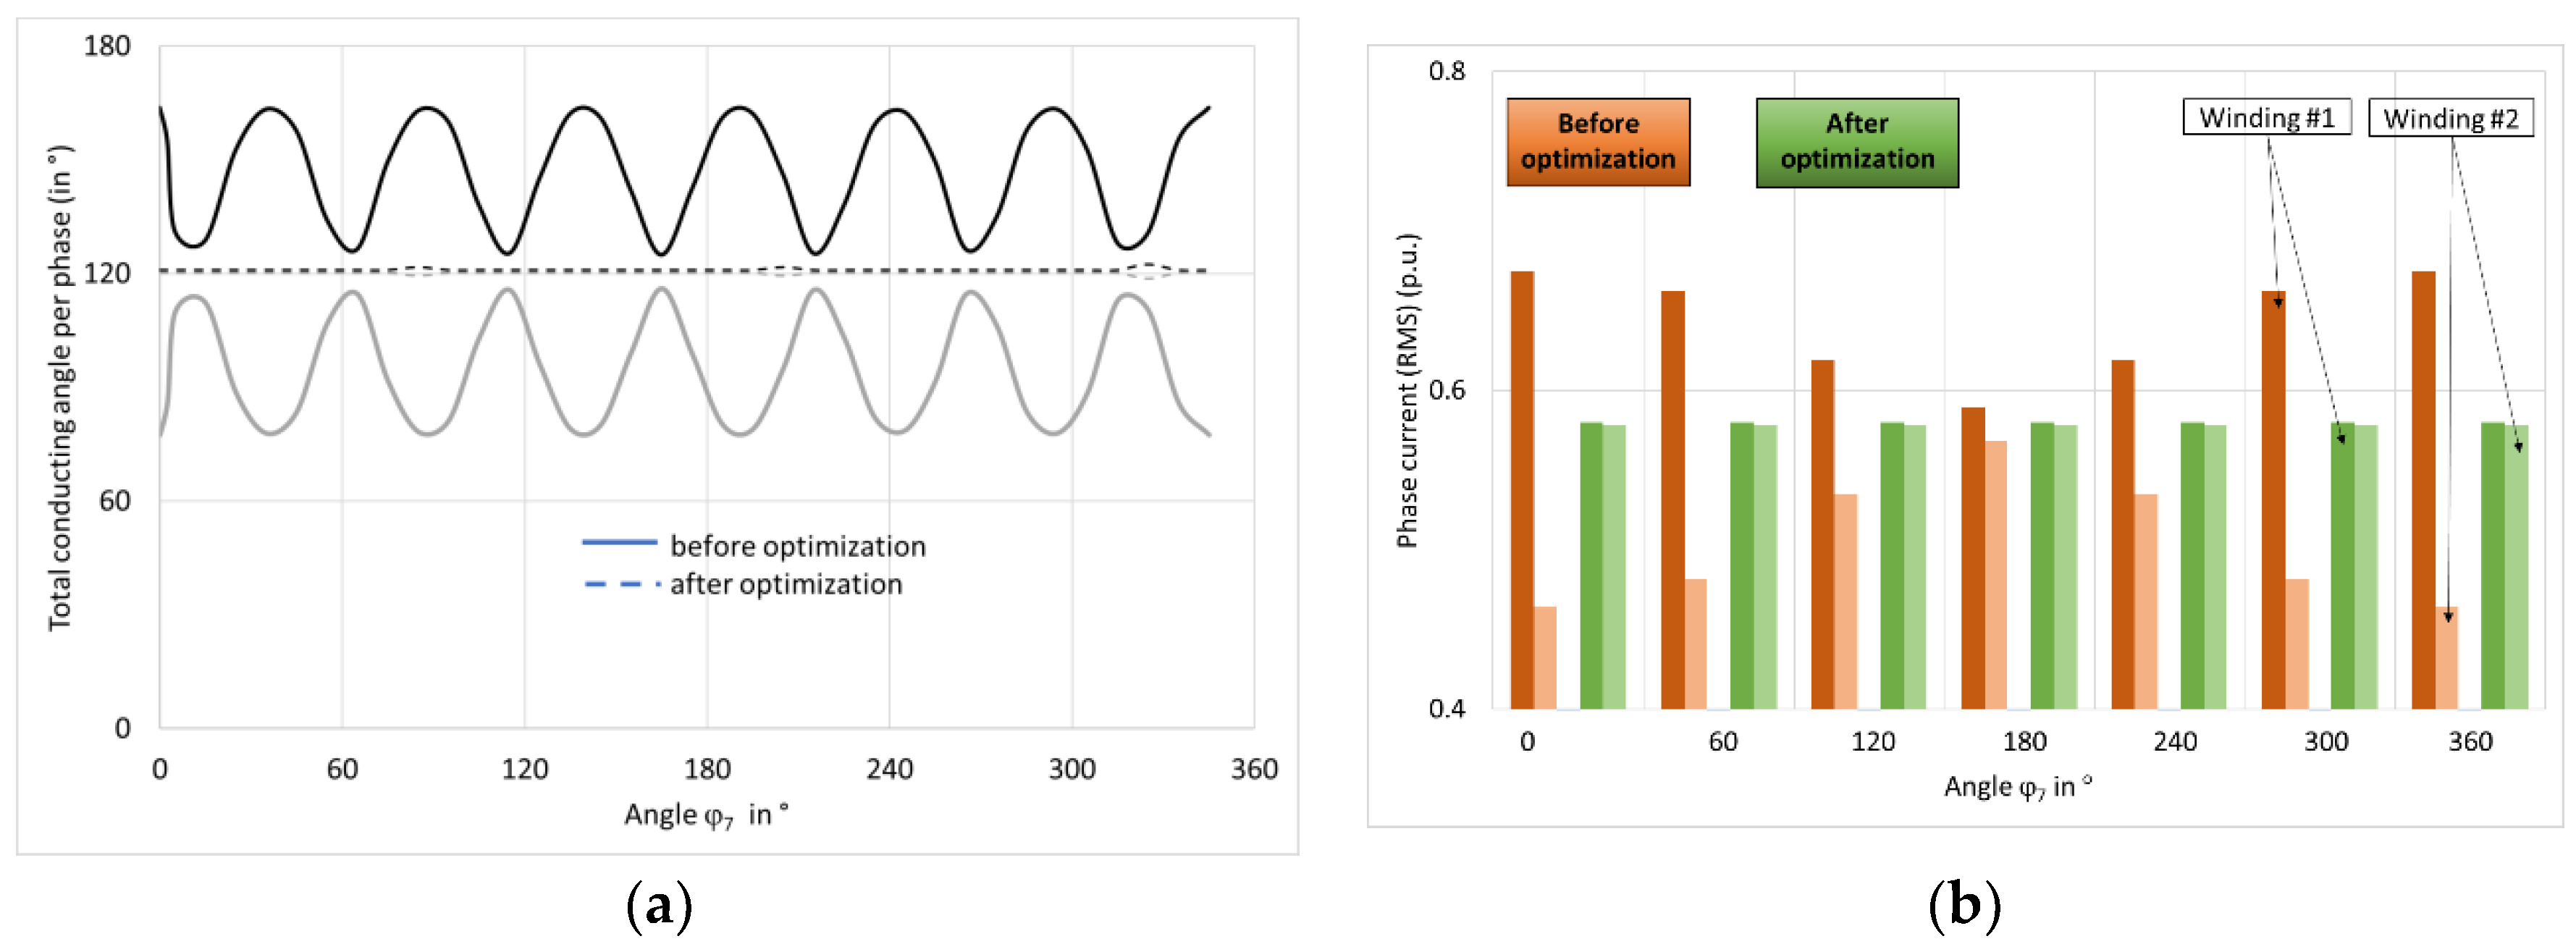
5.1. Reduction of AC Component in DC Rectified Voltage

The ant colony algorithm was invented by Marco Dorigo many years ago [] and has subsequently been modified and adapted by many researchers. The particular variant of ACO algorithm used here was proposed by Taksari for purposes of function minimization [3]. The entire algorithm has been described previously in detail [20]. A minimized function has to be defined, but only values of this function are known. This ACO algorithm belongs to the group of metaheuristic algorithms, so the result may not be optimization in the strictly mathematical understanding of the word. From the purely technical point of view, we are satisfied with a “good enough” solution. When ACO algorithm yields a result (after a series of “experiments”, i.e., numerical simulations), then the procedure may be repeated over and over; each time the result may be slightly different, and it is for us to select a particular result as the “best” one.
To solve our problems, the first step was the choice of the objective functions.
In case of minimizing the ripple in DC voltage, we have chosen a procedure based on minimizing the difference in areas under subsequent pulses. Illustration of this method is given in Figure 9.
Minimized function is sum of areas S1 and S2; one area corresponds to pulse obtained by rectification of delta-connected winding voltage, the other corresponds to pulse obtained by rectification of star-connected winding voltage. Calculation is conducted for 1/6 of time period corresponding to line frequency (50 Hz). Area shapes depend on supply voltage waveform; when output voltage of one secondary winding is increased by means of tap changer (some winding turns are either added or subtracted), then the areas change. From the algorithm’s viewpoint, tap changer position is determined by a gain coefficient. So, optimization problem is posed as selection of such gain coefficients, so that sum of areas of two consecutive pulses is minimum (other pulses—over the entire time period corresponding to 50 Hz frequency—are repeatable, i.e., they are the same as analyzed two pulses. This is due to the fact that with 6-phase transformer used, voltage pulsation in DC network is 12f, where f is line pulsation, 50 Hz). When the optimization procedure is run and results obtained, they may be easily verified; all that is needed is a simple calculation.
The objective function has been defined starting with definition of transformer’s secondary side phase voltages, first at delta-connected winding (see Figure 2b):
u a 1 ( t ) = A p h _ 1 sin ( ω t ) + A p h _ 5 sin ( 5 ( ω t + φ 5 ) ) + A p h _ 7 sin ( 7 ( ω t + φ 7 ) ) u b 1 ( t ) = A p h _ 1 sin ( ( ω t + 2 3 π ) ) + A p h _ 5 sin ( 5 ( ω t + 2 3 π + φ 5 ) ) + A p h _ 7 sin ( 7 ( ω t + 2 3 π + φ 7 ) ) u c 1 ( t ) = A p h _ 1 sin ( ( ω t + 4 3 π ) ) + A p h _ 5 sin ( 5 ( ω t + 4 3 π + φ 5 ) ) + A p h _ 7 sin ( 7 ( ω t + 4 3 π + φ 7 ) )
where Aph is maximum value of appropriate harmonic, index “1” relates to fundamental, and index “5” and “7” to 5th and 7th harmonic, respectively. Symbols a1, b1, or c1 relate to appropriate phase of the winding.
For delta-connected winding, phase voltage is identical with phase-to-phase voltage.
Voltages of star-connected secondary winding are calculated referring to voltages of the delta-connected winding. These relations are generally known from electric circuit theory.
u a 2 ( t ) = k a ( u a 1 ( t ) u b 1 ( t ) ) / 3 u b 2 ( t ) = k b ( u b 1 ( t ) u c 1 ( t ) ) / 3 u c 2 ( t ) = k c ( u c 1 ( t ) u a 1 ( t ) ) / 3 .
Parameters ka, kb, kc are termed gain coefficients, and they relate to correction (subtraction or addition) of operating number of turns at the second secondary winding (adjustment of taps by on-load tap changer). This is also called unbalance coefficient.
Objective function is finally defined as follows:
f ( k a , k b , k c ) = min 0 T / 6 ( u p h ( t ) u p h min ) d t ,
where uph(t) is voltage ua1 or ub1 or uc1 and so on and uphmin is minimum voltage value; time interval considered is 1/6 of time period corresponding to line frequency 50 Hz; this has been explained before (cf. Figure 9).
Parameters of ACO used in the calculations are detailed in [18] (number of ants N = 5, number of iterations I = 6, and neighbourhood parameter α = 0.2); Mathematica software has been used for computations.
The gain coefficients ka, kb, kc diverge from 1 by ±15% (k < 1—decreased number of turns, k > 1—increased number of turns in the winding). For this particular problem, we have tried to adopt slightly different ACO parameters (in the calculations it is possible to change number of ants, number of iterations and neighbourhood parameters, see [18]). We have found that while the results do not change much, the computation time is substantially longer.
Areas shown in Figure 9 (S1 and S2) have been calculated by numerical integration. It was sufficient to use trapezoidal rule, with number of nodes equal to 50. Integration interval is 1/6 of 20 ms, where 20 ms is time period corresponding to line frequency of 50 Hz. Out of 12 resultant pulses (over 20 ms), only two neighbouring pulses are compared.
A “reverse” calculation has been applied to DC voltage, by using a calculated gain coefficient for a particular case, THD of supply voltage equal to 7.81%, and phase shifts of 5th and 7th harmonic equal to 5° and 110°, respectively. Figure 10a shows the output voltages of both secondary windings before correction together with areas, which will be subjected to optimization in accordance with Equation (5). Application of gain coefficient (correction of number of turns in one secondary winding) brings about balancing of these voltages shown as areas in Figure 10b. This is given just as an example of optimization, to show graphical benefits due to the applied algorithm (cf. Equation (5)). Sum of areas in Figure 10a is obviously larger than in Figure 10b and the ripple is also bigger. When optimization is applied over the entire range of variable parameters (phase shifts of 5th and 7th harmonic), then we are able to calculate the decrease in ripple for each case. Calculated decrease of the ripple is equal to 27% (average value) [18].

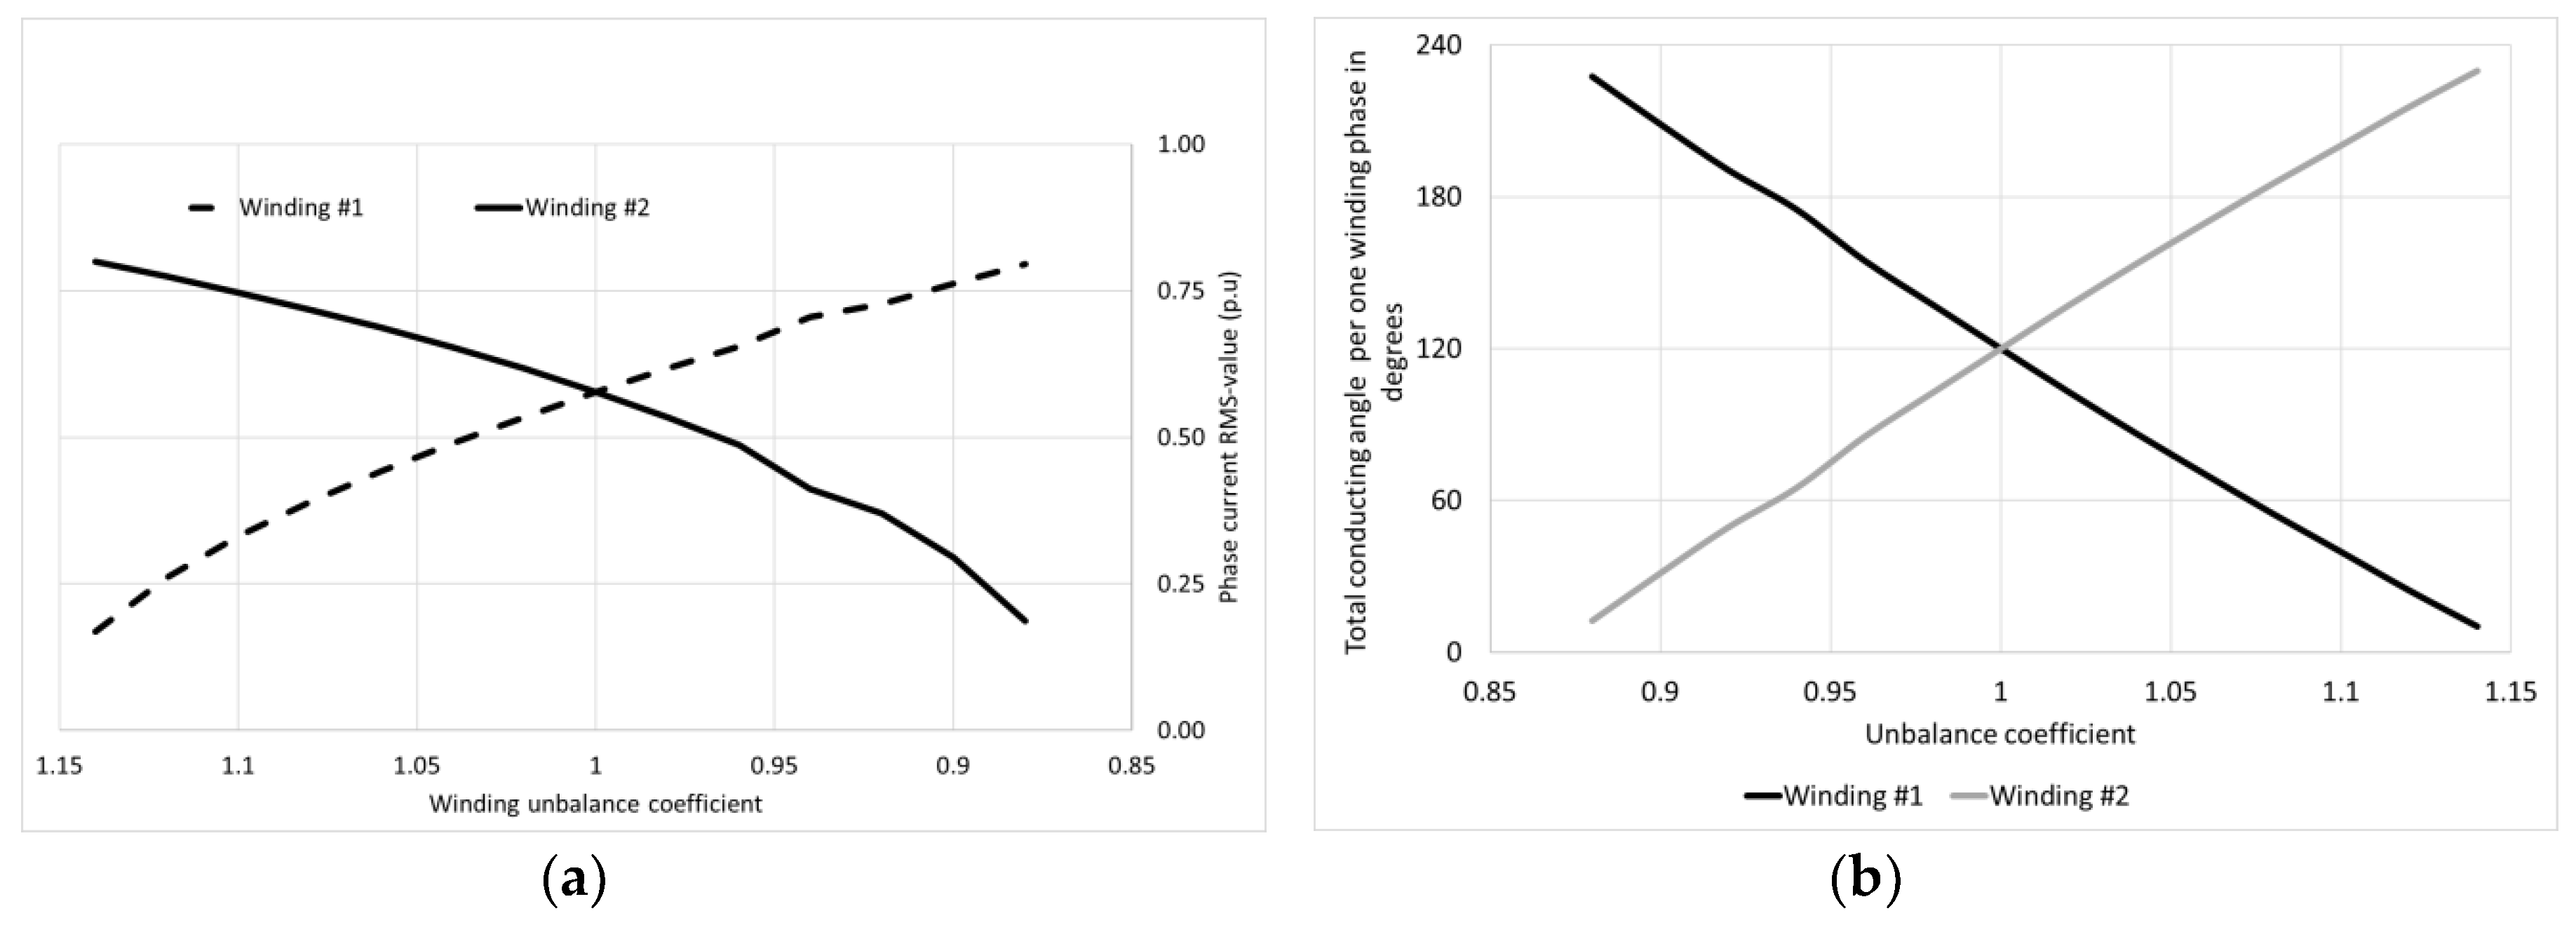
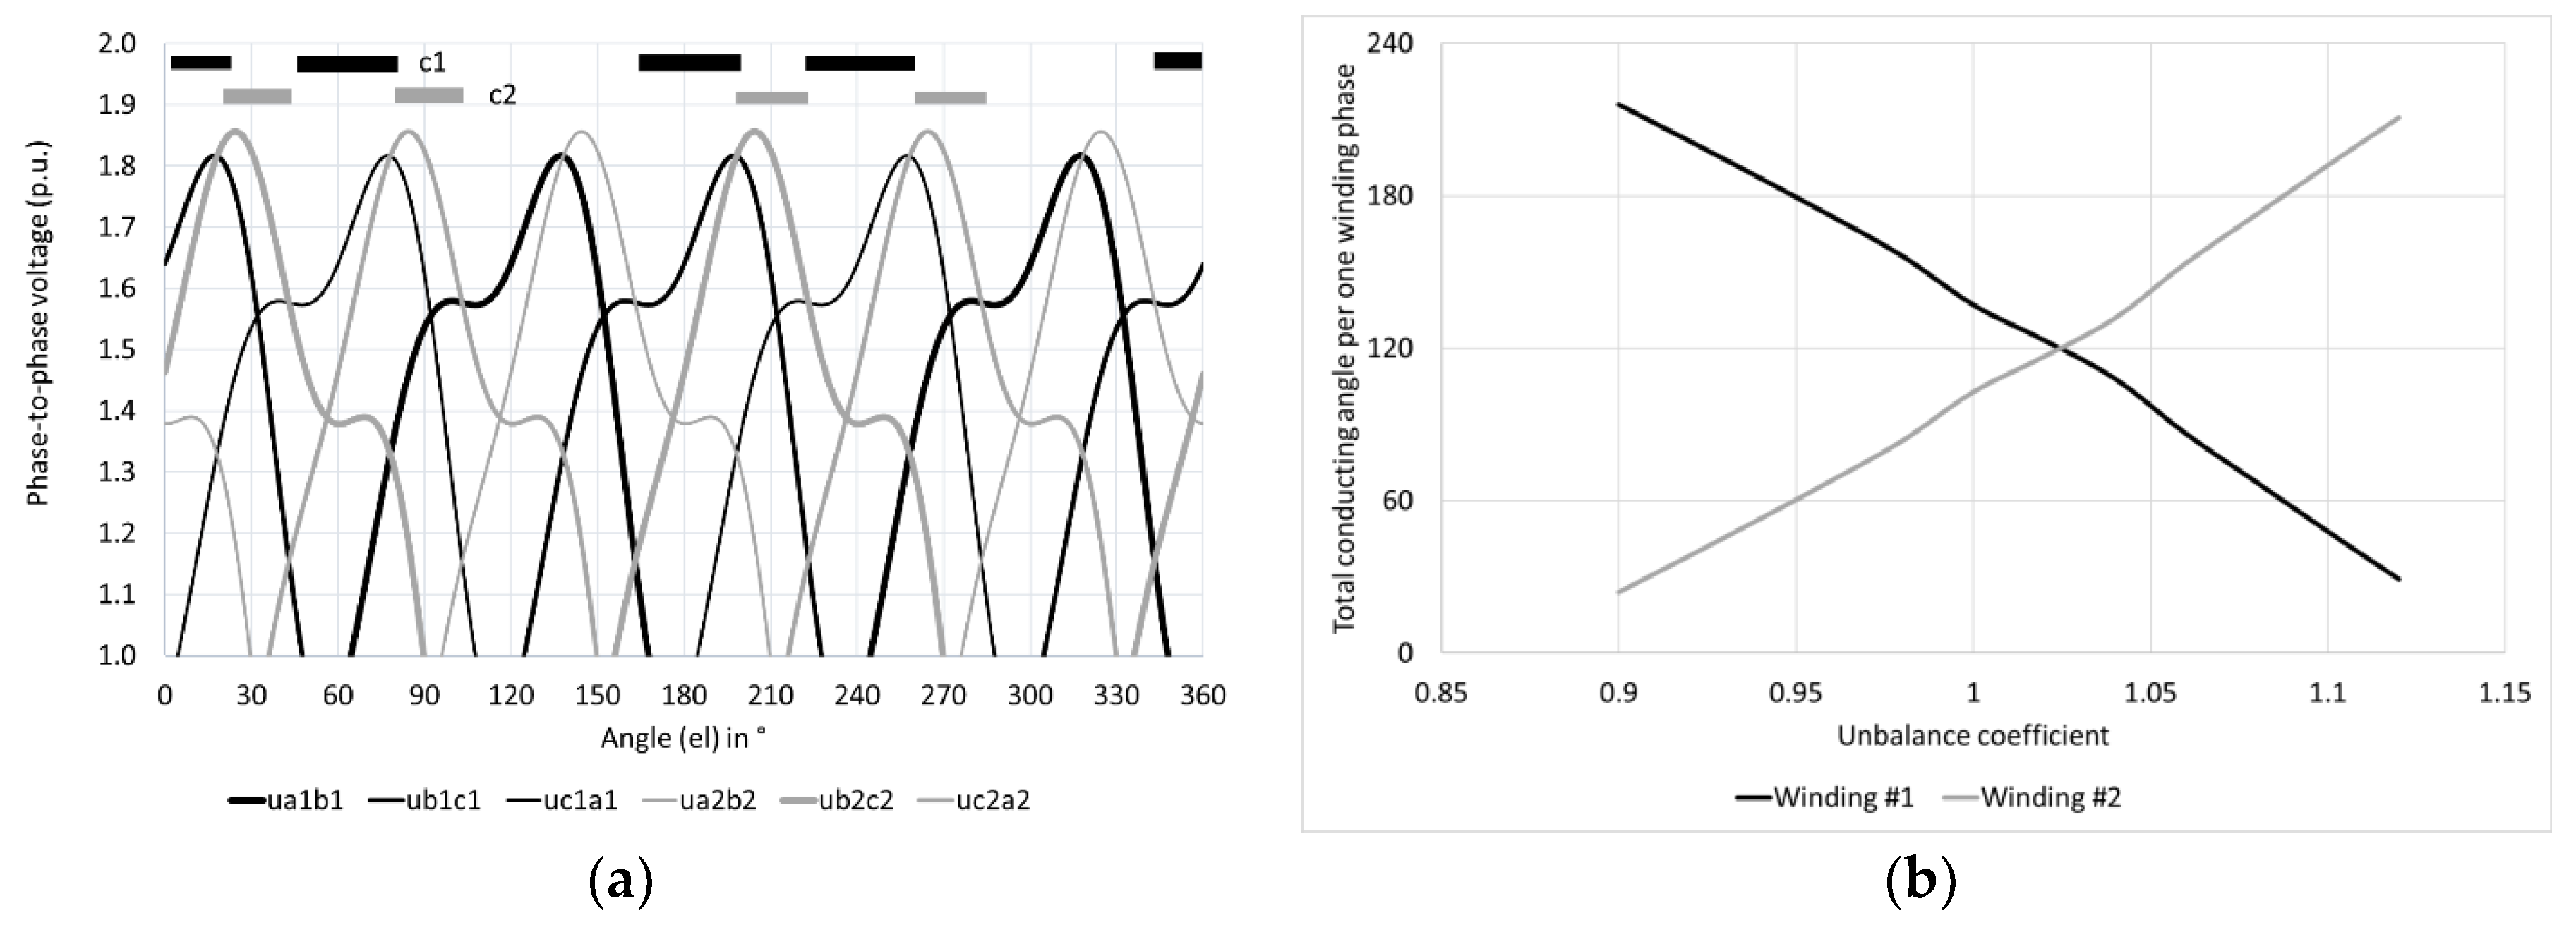
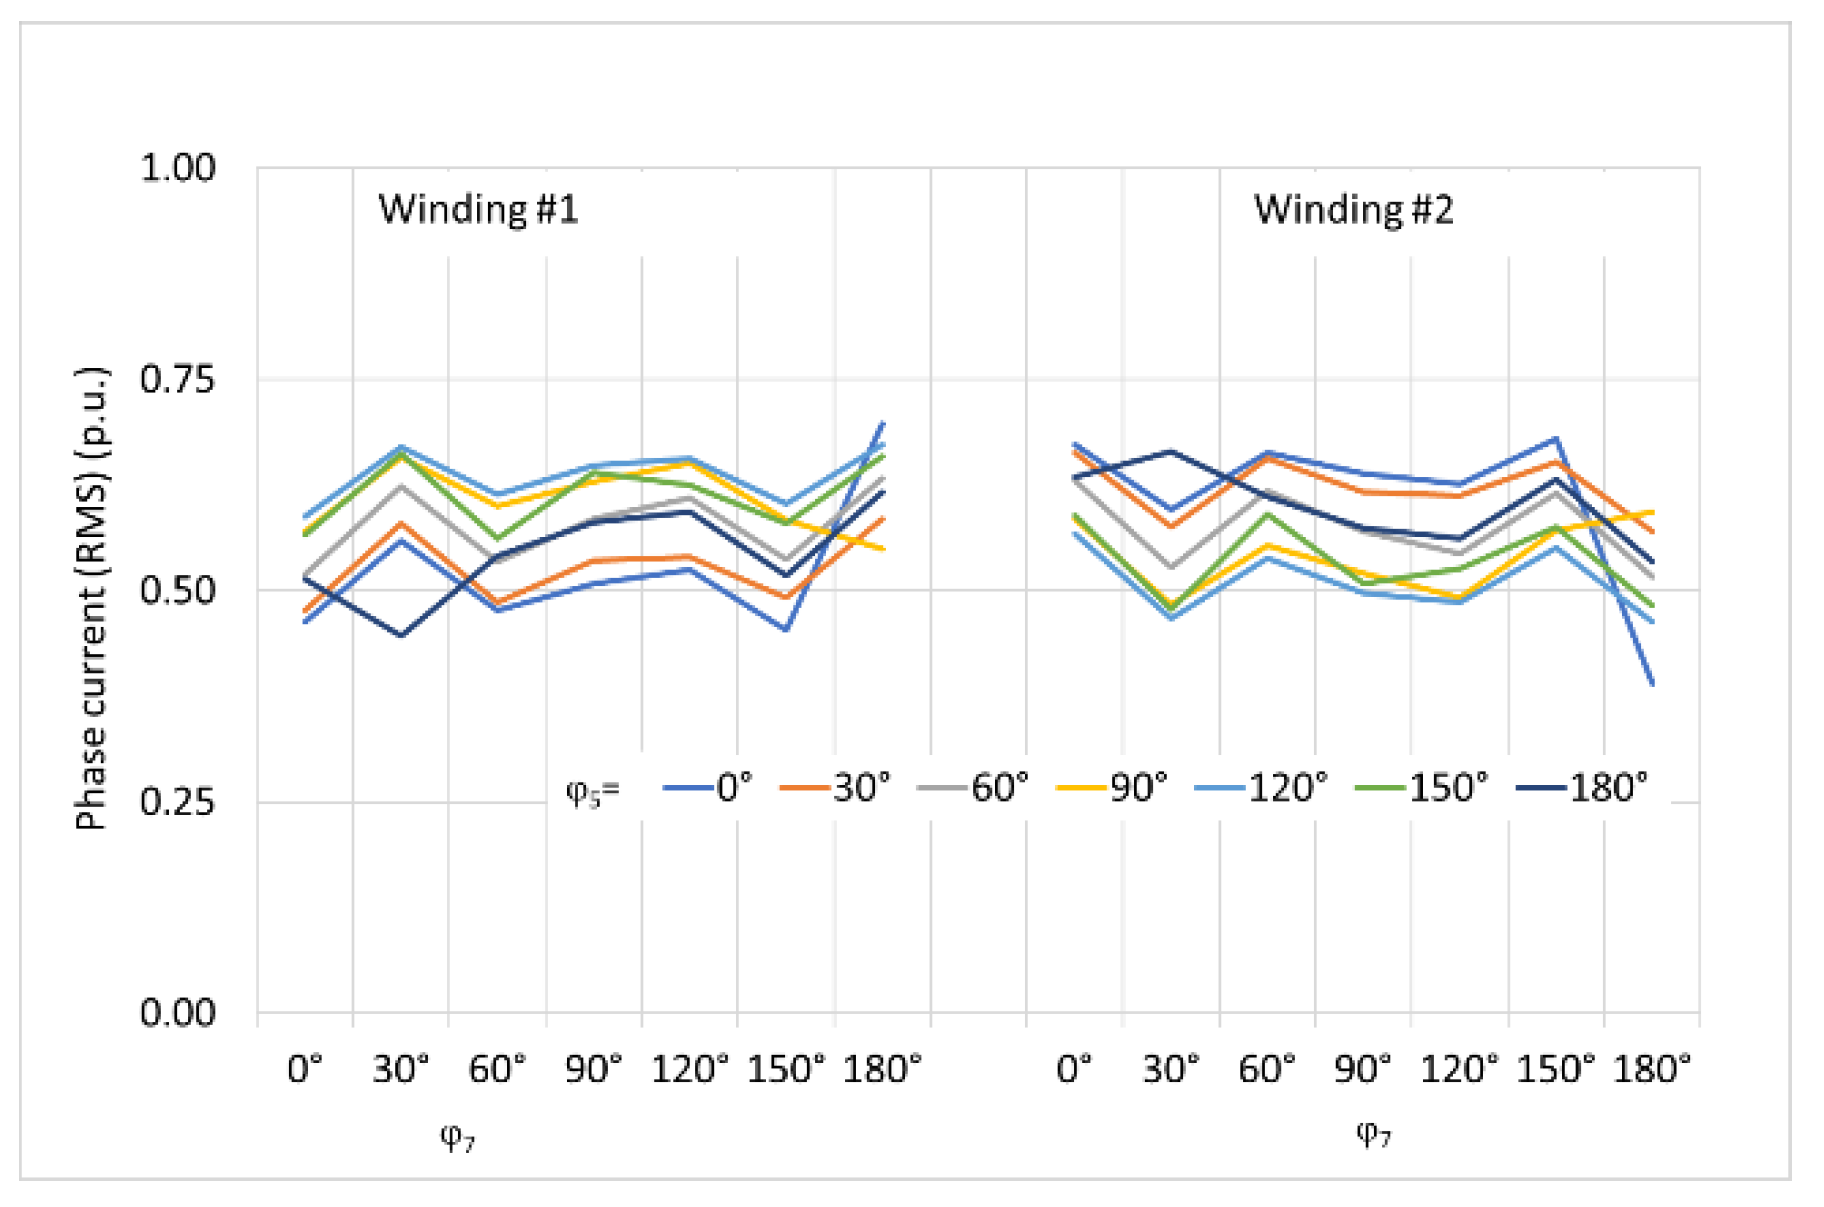
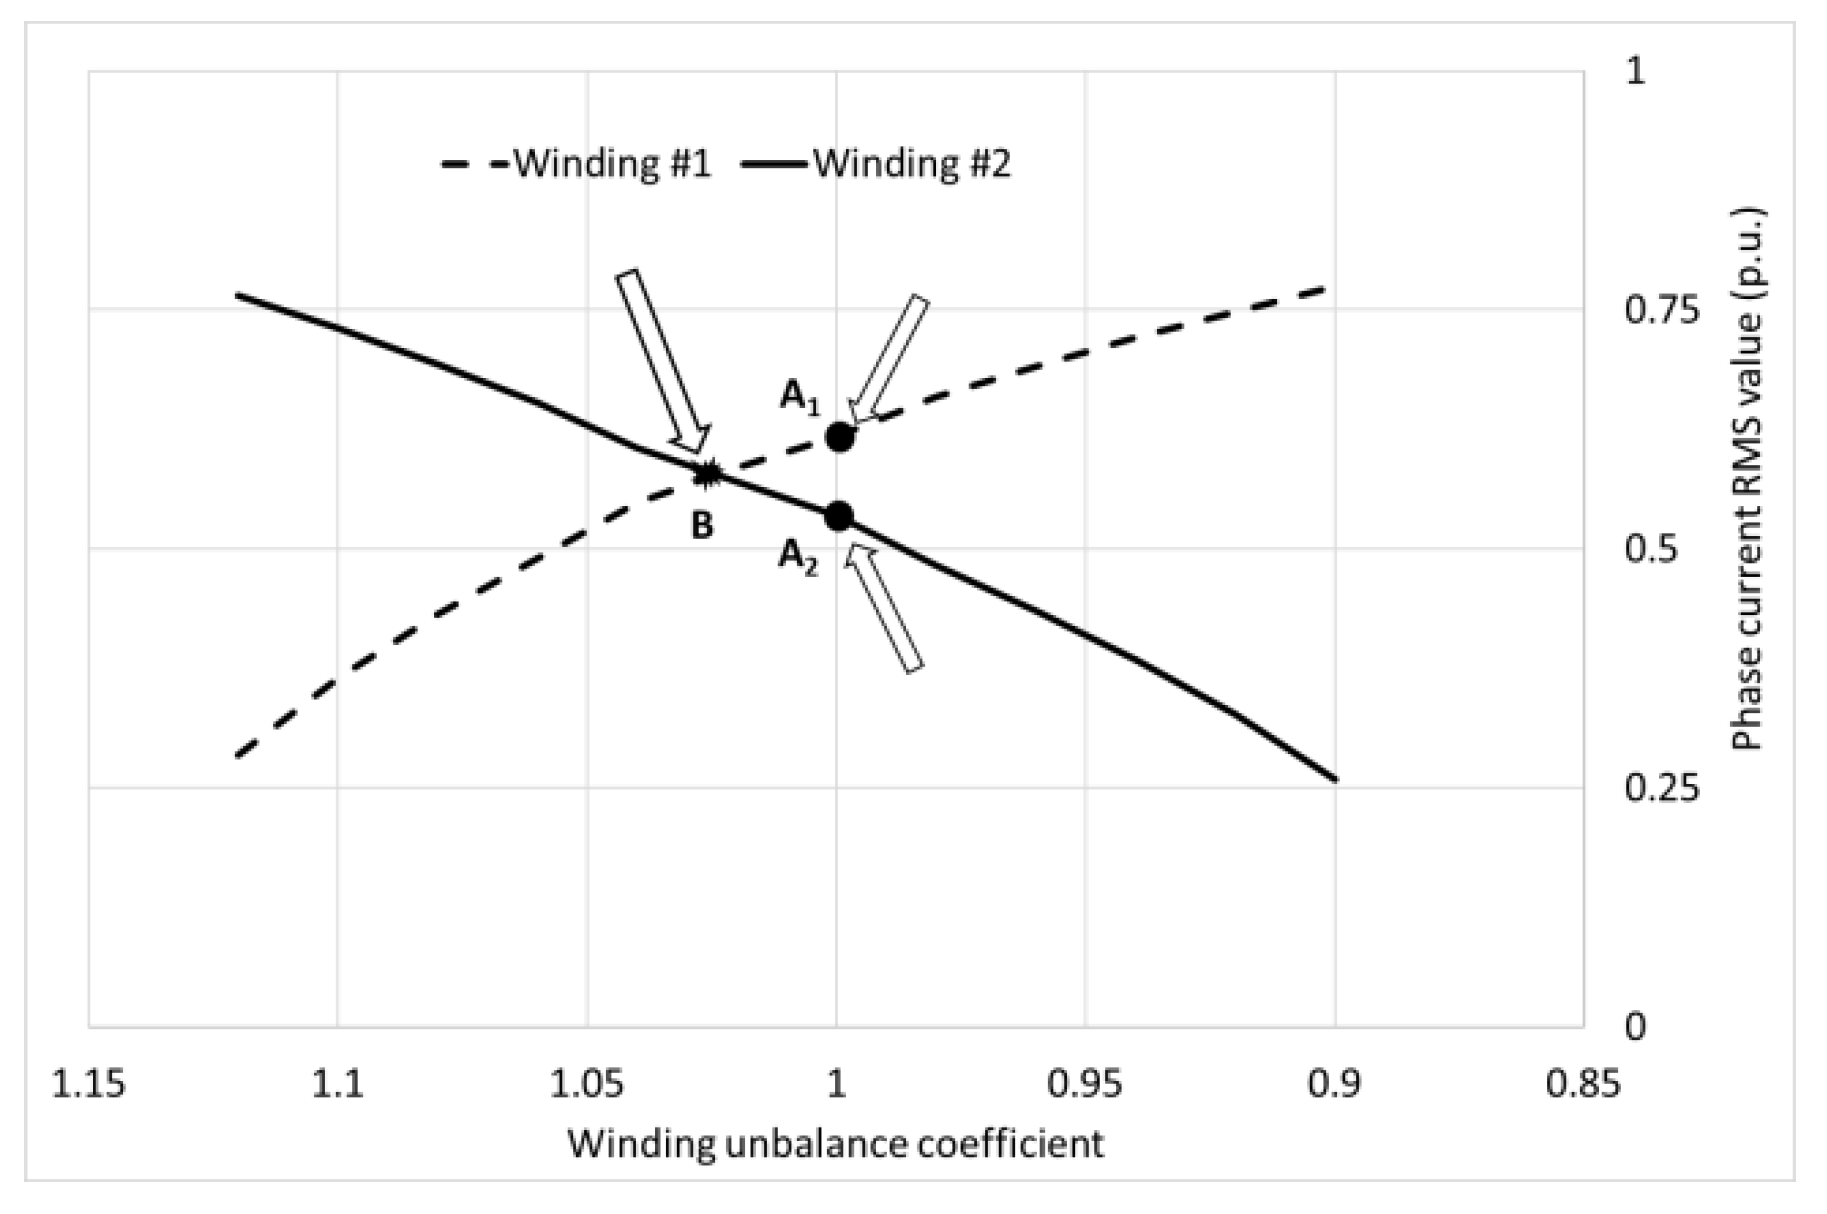
5.2. Load Balancing in Transformer

In case of equalizing the winding currents, the idea is based upon comparing current conducting periods. It may be stated that if currents of different winding phases are to be equal, then conducting times for those phases must be the same (cf. Figure 4a, where conducting times for phases c1 and c2 are marked). With distorted voltages, those times differ (see Figure 6a). For the discussed circuit (Figure 3), the conducting time for each winding phase should correspond to 120 degrees (electrical), which means that this time is equal to one third of the fundamental harmonic period, i.e., (20/3) ms. The conducting angles/times may be calculated from natural commutation points (see Figure 11), i.e., points, where output voltages of both secondary windings are identical in value.
For one entire period of fundamental harmonic, i.e., 20 ms (or 360 degrees el), we get twelve commutation times/angles of different lengths t1t12. If ti denotes ith commuting time and t ¯ is the average time of all commuting times, then we may state the objective function simply as follows:
i = 1 12 ( t ¯ t i ) 2 0
Optimization results are shown in Figure 12. Brown colours (darker and lighter) represent phase output currents of secondary windings, while green colours (darker and lighter) show respective phase currents after optimization. For each phase shift φ7 we have four columns; each column pair represents difference in phase currents. Before optimization, discrepancy is great; after optimization, phase currents are more or less equal. This means that transformer’s secondary windings, one delta-connected and one star-connected, are loaded almost equally; the same is true of two rectifiers connected to these windings. The entire load of the system is thus evenly distributed between two circuits.

6. Conclusions

Swarm intelligence algorithms have become quite popular in solving different and often complex engineering problems. In this paper, we have undertaken to propose a solution to two issues arising from the typical AC/DC voltage transformation used in tram traction supply. Rectified (DC) voltage always exhibits a pulsating (i.e., AC) component; this is due to the structure of transformation circuit, which contains a transformer with one, two, or more secondary side windings and diode rectifier sets connected to these windings in different manners. The content of AC component in DC rectified voltage varies depending on factors such as connection of rectifiers (parallel or series), supply voltage harmonic content, and load. We have analyzed a popular 12-pulse system, which contains a six-phase transformer, where one three-phase secondary winding is connected into delta configuration, while the other winding is given a star arrangement. The output voltages of these windings may not be evenly balanced, and this constitutes an extra factor contributing to the DC voltage pulsation.
Reduction in DC ripple is important from the viewpoint of traction line and traction drive performance. Presence of additional harmonics in DC voltage also means that harmonic content in supply current (i.e., current drawn from power grid) will be increased, which is equivalent to a worsening of supply voltage quality. The details have not been examined in this paper; the authors have focused their attention on the proposed method of reducing the AC component in rectified (traction line) voltage.
It has been demonstrated that under steady-state conditions, this AC ripple may be altered by adjusting the voltage of one secondary winding with the use of a conventional on-load tap changer (a well-known device, which modifies slightly the winding voltage by putting into operation. i.e., “adding” or removing from operation, i.e., “subtracting” some winding turns). The performance of the transformer-rectifier set has been examined in the case of distorted voltage supply (the THD coefficient is not higher than appropriate legal rules). An ant colony algorithm has been applied in order to optimize the gain (unbalance) coefficient of voltage at one secondary winding, which corresponds to the tap changer setting. We have demonstrated that it is possible to reduce the voltage ripple in DC voltage by 27% (in a particular case). The other discussed problem was the unevenness of loading, which applies to both transformer secondary windings and to rectifiers. This is true in the case of distorted voltage, since current conducting times change from one commutation to another. This problem is important from the viewpoint of the reliability of the rectifier transformer set operation. With uneven loading, the possibility of overheating is present; this may in turn lead to an increased fatigue rate of transformer insulation, while overloading of rectifier diodes may cause direct damage, e.g., in the form of short-circuiting. Again, the technical details have not been examined in all particulars; we have focused on the proposed method of balancing loads in two secondary circuits of the rectifier transformer set. Adjustment of one secondary winding voltage by an on-load tap changer results in a practically complete equalization of the phase winding currents and, consequently, of the rectifier currents. The position of the tap changer has been determined by the application of the ACO algorithm.

Author Contributions

Conceptualization, B.K. and A.S.; Data curation, A.S. and A.Z.; Formal analysis, B.K., A.S. and A.Z.; Investigation, B.K., A.S., and A.Z.; Methodology, B.K., A.S., and A.Z.; Resources, B.K., A.S., and A.Z.; Software, A.Z.; Supervision, A.S.; Validation, A.S.; Visualization, B.K.; Writing—original draft, B.K.; Writing—review and editing, B.K.

Funding

This research received no external funding.

Conflicts of Interest

The authors declare no conflict of interest.

References

  1. Kennedy, J. Particle swarm optimization. In Encyclopedia of Machine Learning; Springer: Berlin/Heidelberg, Germany, 2011; pp. 760–766. [Google Scholar]
  2. Dorigo, M. Optimization, Learning and Natural Algorithms (in Italian). Ph.D. Thesis, Politecnico di Milano, Milano, Italy, 1992. [Google Scholar]
  3. Toksari, M.D. Ant colony optimization for finding the global minimum. Appl. Math. Comput. 2006, 176, 308–316. [Google Scholar] [CrossRef]
  4. Połap, D.; Woźniak, M.; Napoli, C.; Tramontana, E.; Damaševičius, R. Is the colony of ants able to recognize graphic objects? In International Conference on Information and Software Technologies; Dregvaite, G., Damasevicius, R., Eds.; Springer: Cham, Switzerland, 2015; Volume 538, pp. 376–387. [Google Scholar]
  5. Woźniak, M.; Połap, D. On some aspects of genetic and evolutionary methods for optimization purposes. Int. J. Electron. Telecommun. 2015, 61, 7–16. [Google Scholar] [CrossRef]
  6. Karaboga, D.; Gorkemli, B.; Ozturk, C.; Karaboga, N. A comprehensive survey: Artificial bee colony (ABC) algorithm and applications. Artif. Intell. Rev. 2014, 42, 21–57. [Google Scholar] [CrossRef]
  7. Lee, T.-Y. Operating schedule of battery energy storage system in a time-of-use rate industrial user with wind turbine generators: A multipass iteration particle swarm optimization approach. IEEE Trans. Energy Convers. 2007, 22, 774–782. [Google Scholar] [CrossRef]
  8. Lee, C.-S.; Ayala, H.V.H.; Dos Santos Coelho, L. Capacitor placement of distribution systems using particle swarm optimization approaches. Int. J. Electr. Power Energy Syst. 2015, 64, 839–851. [Google Scholar] [CrossRef]
  9. Kumar, D.; Samantaray, S.R.; Kamwa, I.; Sahoo, N.C. Reliability-constrained based optimal placement and sizing of multiple distributed generators in power distribution network using cat swarm optimization. Electr. Power Compon. Syst. 2014, 42, 149–164. [Google Scholar] [CrossRef]
  10. Di Fazio, A.R.; Russo, M.; De Santis, M. Zoning evaluation for voltage optimization in distribution networks with distributed energy resources. Energies 2019, 12, 390. [Google Scholar] [CrossRef]
  11. Mohammadi, H.R.; Akhavan, A. Parameter estimation of three-phase induction motor using hybrid of genetic algorithm and particle swarm optimization. J. Eng. 2014, 2014. [Google Scholar] [CrossRef]
  12. Wu, Q.; Cole, C.; McSweeney, T. Applications of particle swarm optimization in the railway domain. Int. J. Rail Transp. 2016, 4, 167–190. [Google Scholar] [CrossRef]
  13. Zhu, H.P.; Luo, L.F.; Li, Y.; Rehtanz, C. A hybrid active power compensation device for current balance of electrical railway system. In Proceedings of the 2010 International Conference on Power System Technology (POWERCON), Hangzhou, China, 24–28 October 2010; pp. 1–6. [Google Scholar]
  14. McPherson, G.; Laramore, R.D. An Introduction to Electrical Machines and Transformers, 2nd ed.; Wiley: New York, NY, USA, 1990. [Google Scholar]
  15. Polish Committee of Standardization. Transformers. General Requirements; Polish Committee of Standardization: Warsaw, Poland, 2011; p. 75. [Google Scholar]
  16. Sikora, A.; Kulesz, B.; Zielonka, A. Application of swarm algorithm to solving voltage unbalance problem in DC tram traction supply system. In Proceedings of the 2018 Innovative Materials and Technologies in Electrical Engineering (i-MITEL), Sulecin, Poland, 18–20 April 2018; pp. 1–6. [Google Scholar] [CrossRef]
  17. Sikora, A.; Kulesz, B.; Grzenik, R. 12-pulse and 24-pulse ac/dc voltage transformation circuits. Sci. J. Sil. Univ. Technol. Elektr. 2015, 3, 29–64. [Google Scholar]
  18. Di Manno, M.; Varilone, P.; Verde, P.; De Santis, M.; Di Perna, C.; Salemme, M. User friendly smart distributed measurement system for monitoring and assessing the electrical power quality. In Proceedings of the 2015 AEIT International Annual Conference, Naples, Italy, 14–16 October 2015; pp. 1–5, ISBN 978-8-8872-3728-3. [Google Scholar] [CrossRef]
  19. Ministry of Economy. Ruling on detailed conditions of power engineering system operation. J. Laws 2007, 93, 623. [Google Scholar]
  20. Sikora, A.; Kulesz, B.; Zielonka, A. Minimization of power pulsations in traction supply—Application of ant colony algorithm. In International Conference on Information and Software Technologies; Damaševičius, R., Vasiljevienė, G., Eds.; Springer: Cham, Switzerland, 2018; Volume 920, pp. 399–411. [Google Scholar] [CrossRef]
Figure 1. Tram traction substation—simplified functional diagram: a—transformer used for loads other than traction network, b—rectifier transformer, c—rectifiers, and d—return cables.
Computers 08 00028 g001
Figure 2. Six-phase transformer: (a) winding configuration; (b) vector diagram of phase-to-phase voltages.
Computers 08 00028 g002
Figure 3. Configuration of the energy transformation circuit: six phase transformer and two diode rectifiers connected in parallel; Ia2 marks a phase current in one secondary winding and Ir2 marks total output load current of the same winding (other currents are not marked here for clarity’s sake).
Computers 08 00028 g003
Figure 4. Transformer voltages: secondary side phase-to-phase voltages are marked with in black and grey; each colour corresponds to one winding: (a) star and delta winding voltages (phase-to-phase) are exactly the same and (b) star and delta winding voltages (phase-to-phase) are slightly different (UD = 0.95UY, where UD, UY—RMS-values of phase-to-phase delta and star winding voltages, respectively); conducting times of corresponding phases (c1 and c2) in both secondary windings are also shown. Supply voltage is sinusoidal.
Computers 08 00028 g004
Figure 5. The effect of secondary winding unbalance: (a) divergence of phase currents in secondary windings, (b) total diode conduction angles in both windings vs. unbalance coefficient; data is shown for corresponding phases (c1 and c2—see Figure 2 and Figure 3 for phase currents). Supply voltage is sinusoidal. Currents are given in reference to total DC load current of the entire circuit.
Computers 08 00028 g005
Figure 6. Operation in case of balanced windings and distorted supply voltage (RMS values U5 = 0.06 U1, U7 = 0.05 U1; phase shifts are φ5 = 180° and φ7 = 180°); (a) secondary voltages (phase-to-phase), black and grey lines denote star and delta-connected windings, respectively; conducting times of corresponding phases (c1 and c2) in both secondary windings are also shown; (b) total conduction angles in both windings vs. unbalance coefficient.
Computers 08 00028 g006
Figure 7. Phase currents of both secondary windings; supply voltage is distorted, RMS values U5 = 0.06 U1, U7 = 0.05 U1; phase shifts of 5th (φ5) and 7th harmonic (φ7) range from 0° to 180°, as marked in the chart. Values of winding currents are referenced to load current.
Computers 08 00028 g007
Figure 8. Counteracting the unbalance of phase currents in secondary windings; supply voltage is deformed, RMS-values of 5th and 7th harmonic are U5 = 0.06 U1 and U7 = 0.05 U1, phase shifts are φ5 = 180° and φ7 = 180°; points A1 and A2 mark currents’ divergence in case of balanced windings; point B marks equal loading of windings, when number of turns of one winding is changed by application of tap changer (unbalance coefficient ≈ 1.025).
Computers 08 00028 g008
Figure 9. Compensation principle for reducing voltage ripple in DC voltage: black and red lines mark the voltage of star-and delta-connected windings, respectively; (a) areas S1 and S2 differ; (b) gain coefficients have been introduced, number of turns has been slightly changed, and areas S1 and S2 are similar. Thick dashed line marks voltage ripple minimum value.
Computers 08 00028 g009
Figure 10. Single example of tap-changer correction of turn (voltage) unbalance of secondary windings in 6-phase rectifier transformer: black/red lines denote voltages of two secondary windings (after rectification—tops of pulses are shown); supply voltage is distorted as described in the text (THD = 7.81%, φ5 = 5°, φ7 = 110°; (a) before correction, i.e., gain coefficient ka, kb, kc is 1; (b) gain coefficient is corrected in accordance with ACO and is equal to 1.08747. Green line marks minimum ripple voltage (uphmin), and light and dark green areas correspond to S1 and S2 areas explained in Figure 9.
Computers 08 00028 g010
Figure 11. Several pulses of phase-to-phase voltages (black and grey lines denote voltages of both secondary windings—star-connected and delta-connected winding, respectively); natural commutation points are distinguished by arrows and commuting angles/times shown.
Computers 08 00028 g011
Figure 12. Optimization results: (a) total conducting time per phase before (solid lines) and after optimization (dashed lines); (b) winding phase current before (brown shades) and after optimization (green shades); supply voltage is distorted (RMS-values of 5th and 7th harmonic are U5 = 0.06 U1 and U7 = 0.05 U1); phase shift of 5th harmonic is φ5 = 0°; in each 4-column set, columns 1 and 3 refer to one secondary winding and columns 2 and 4 to the other secondary winding.
Computers 08 00028 g012

