1. Introduction
In the age of Industry 5.0 and industrial cyber-physical systems (CPS), improving supply networks has become vital for attaining operational efficiency, lowering costs, and boosting responsiveness to customer needs. Job Shop Scheduling (JSS) plays a pivotal role in streamlining manufacturing processes, mitigating bottlenecks, and ensuring efficient resource utilization in supply networks [
1,
2]. With the increasing complexity and dynamism of industrial settings, there is a demand for generative AI strategies—to overcome the shortcomings of conventional scheduling techniques and facilitate adaptive, resilient manufacturing for Industry 5.0.
The JSS problem remains a critical challenge in modern manufacturing environments, particularly as we enter the era of the Industrial Internet of Things (IIOT) [
3]. With the increasing complexity and dynamism of production systems, traditional scheduling methods often fail to address real-time decision-making needs and adapt to unexpected events. This can reduce productivity and profitability. Bottlenecks, which arise from various factors such as resource constraints, workload imbalances, or capacity limitations, can significantly impact the overall throughput and responsiveness of supply networks [
4]. These bottlenecks act as constraints, limiting overall throughput and causing delays in the production process. Unaddressed bottlenecks can lead to longer lead times, higher inventory levels, and reduced response to customer demand, ultimately affecting the overall performance of the supply network. Recent advances in artificial intelligence (AI), particularly Generative Artificial Intelligence (GenAI) and reinforcement learning (RL), have shown promising results in tackling complex scheduling problems [
5]. GenAI can facilitate the development and continuous refinement of digital twins, enhancing predictive accuracy and supporting a wide range of smart manufacturing applications [
6]. However, these approaches often struggle with the high-dimensional state spaces and intricate constraints inherent in real-world manufacturing systems. Moreover, they frequently fail to identify and prioritize bottlenecks effectively, critical factors in optimizing overall system performance.
To address these challenges, we propose a novel framework that integrates Generative Adversarial Networks (GANs) with the Local Outlier Factor (LOF)-enhanced Q-learning-based Reinforcement Learning (QRL) for adaptive job shop scheduling in Industry 5.0 environments. The GAN generates synthetic scheduling scenarios that mimic real-world production dynamics, while the LOF algorithm identifies system bottlenecks in real time. This hybrid approach enables the QRL agent to learn robust scheduling policies from both real and GAN-generated data, prioritizing bottleneck mitigation while optimizing makespan. The framework is validated using a state-of-the-art Festo Didactics Cyber Physical Lab (CPLab), featuring eight manufacturing processes with industry-grade controls and an integrated Manufacturing Execution System (MES). This testbed serves as a physical-digital platform to evaluate the proposed solution under dynamic production conditions. Results demonstrate that the GAN-augmented LOF-QRL method achieves 70.8 % average makespan reduction across varying order volumes (12–18 orders), while improving adaptability to unexpected disruptions compared to traditional RL approaches.
1.1. Contributions
The proposed approach introduces a novel framework that integrates the GAN with LOF and QRL to optimize JSS decisions and reduce makespan in dynamic manufacturing environments. This method is validated using a state-of-the-art Festo Didactics CPLab exemplar with eight distinct manufacturing processes and an integrated MES. The proposed framework introduces three key innovations for industrial CPS:
A GAN generates synthetic scheduling scenarios that expand the diversity of training data, exposing the RL agent to rare bottleneck events and complex production patterns.
Integration of LOF-based anomaly detection with QRL enables real-time identification and prioritization of system constraints.
Implementation and testing on a physical testbed with digital twin capabilities, featuring eight manufacturing processes and MES integration.
1.2. Paper Organization
The remainder of this paper is organized as follows:
Section 2 reviews foundational and recent works in JSS, GAN, and RL, with emphasis on their applications in industrial CPS and bottleneck detection.
Section 3 details the proposed GAN-LOF-QRL framework, including the synergistic integration of generative AI for synthetic scenario generation, LOF-based bottleneck detection, and Q-learning for adaptive scheduling.
Section 4 presents experimental validation using the Festo Didactics CPS testbed.
Section 5 concludes with insights into the transformative potential of generative AI in industrial CPS and outlines future directions for scaling the framework to large-scale, multi-objective manufacturing systems.
2. Related Literature
This section reviews the relevant literature in the field of JSS, bottleneck detection, and optimization using advanced techniques such as deep reinforcement learning (DRL), graph neural networks (GNN), and statistical methods. The following paragraphs highlight key contributions that address various aspects of manufacturing optimization, from dynamic scheduling to real-time bottleneck control.
A study by Zhang et al. [
7] applies DRL with proximal policy optimization to dynamic JSS, addressing machine failures in Industry 4.0 contexts. The presented method outperforms traditional heuristics in a real-world environment, enhancing decision-making efficiency in complex, rapidly changing manufacturing systems. Similarly, Serrano et al. [
8] applied DRL to smart manufacturing scheduling in complex job shops. Using OpenAI Gym and proximal policy optimization, the approach enhances flexibility and real-time decision-making, outperforming traditional heuristics in dynamic production environments. A study by Zhou et al. [
9] presents a smart scheduler using DRL for dynamic JSS. The approach introduces composite reward functions to improve real-time decision-making and handle unexpected events. Experiments on a smart factory testbed demonstrate the model’s ability to balance efficiency and profits while adapting to dynamic manufacturing environments. A study by Abadi et al. [
10] provides scholars with a comprehensive guideline for selecting various types of AI methods to address common challenges in energy-efficient manufacturing systems and how digital twins, equipped with AI techniques, can be applied to solve energy issues in manufacturing systems.
Huang et al. [
11] present a novel DRL approach for the Flexible Job Shop Scheduling Problem (FJSP). The authors introduce a Graph Gated Channel Transformation model and modify disjunctive graph feature expressions to improve scalability. The method significantly reduces the average makespan on both generated and classical datasets, outperforming existing techniques in FJSP optimization. Recent research by Pu et al. [
12] proposes a novel JSS approach using GNN and DRL. Their distributed multi-agent architecture with GE-HetGNN demonstrates improved performance, scalability, and real-world applicability compared to traditional methods, addressing key challenges in dynamic manufacturing environments. The work of Yang et al. [
13] proposes a novel approach to dynamic JSS problems using GNN and DRL. The method constructs an agent model that analyzes job shop states through graphs, avoiding reliance on artificial state feature vectors. A new reward function is introduced, demonstrating improved effectiveness compared to traditional DRL algorithms in minimizing completion times.
Elsayed et al. [
14] introduce DRL with an Actor–Critic algorithm for JSS Problems. Using Graph Isomorphism Networks and Markov Decision Processes, the approach demonstrates superior performance compared to traditional and trending methods, achieving lower average percentage deviations in benchmark tests. In their latest contribution to the field, Wang et al. [
15] introduce a deep temporal difference RL approach for the flexible double shop scheduling problem. The method combines job shop and assembly shop scheduling, using ten state features and eight heuristics as actions. Experiments demonstrate superior performance compared to most other methods in solving practical manufacturing scheduling problems. Taghipour et al. [
16] has developed a deep RL-based multi-agent approach for real-time scheduling in flexible manufacturing systems. The method combines offline learning and Deep Q-learning with a two-level self-organizing map to determine optimal multiple dispatching rules. Experiments show superior performance in total weighted tardiness, throughput, and mean cycle time compared to traditional and other AI-based scheduling strategies.
The scholarly work by Li et al. [
17] introduces a real-time bottleneck control method for manufacturing systems, focusing on short-term production analysis. Using initial buffer adjustment and maintenance task prioritization, the approach aims to balance production lines and increase throughput. An automotive assembly line case study demonstrates significant improvements over traditional methods in dynamic manufacturing environments. Another paper by Li et al. [
18] introduces a novel approach for predicting throughput bottlenecks in production lines using an Autoregressive Moving Average (ARMA) model. The method analyzes blockage and starvation times as a time series to forecast bottlenecks, considering production dynamics and internal material flow. This technique improves upon existing long-term analysis methods by accounting for bottleneck shifts. Results show the ARMA model accurately predicts station-specific blockage and starvation information, enabling precise throughput bottleneck forecasting for targeted production improvements. The research conducted by Roy et al. [
19] addresses job sequencing in custom machine setups with precedence constraints, adapting the Nawaz–Enscore–Ham (NEH) and Campbell–Dudek–Smith (CDS) algorithms for a real-life manufacturing scenario. The research compares these modified algorithms in flow shop and job shop environments, finding NEH outperforms CDS in job shop scenarios with varied product ratios. A sensitivity analysis examines additional parameters’ effects on the makespan time.
Recent progress in robotics optimization and smart manufacturing scheduling illustrates the important role of strong optimization and anomaly detection methods in improving system dependability and decision-making. Improved multi-objective BxR algorithms by Rao et al. [
20] have demonstrated success in solving complex robotic problems with multiple objectives, outperforming older parameter-based methods throughout various engineering fields. In job shop scheduling, hybrid learning systems like GQN-EREA combine expert-rule-based reinforcement learning with graph neural models to provide scalable, real-time decision support that improves both production output and equipment upkeep [
21]. Gaffet et al. [
22] showed that the Multi-block Local Outlier Factor (MLOF) greatly improved the detection of rare or unusual events in complex, data-limited situations. Deep reinforcement learning (DRL) methods, such as the Heterogeneous Graph Scheduler (HGS), have achieved near-optimal scheduling results over various scales by representing operations, machines, and transportation as heterogeneous graphs, thereby addressing the problem of scaling flexible job-shop scheduling with transportation limits [
23]. Also, combining digital twin technology with model-driven scheduling models has allowed the merging of real and virtual shop-floor data, leading to better training data and improved scheduling results [
24]. Together, these advances show a move toward smart, scalable, and versatile scheduling solutions in Industry 4.0.
The current research highlights a significant gap between theoretical algorithmic advancements and practical implementation in dynamic manufacturing environments. While AI-driven adaptive scheduling techniques like DRL and multi-agent systems optimize JSS, the GAN-LOF-QRL framework offers unique benefits for dynamic industrial CPS. Unlike existing DRL methods, which depend on historical and real-time data, this framework utilizes GANs to enhance training datasets with rare bottleneck scenarios, improving the Q-learning agent’s response to edge cases and disruptions without extensive experimentation. Additionally, the LOF anomaly detection enhances bottleneck identification, which standard DRL methods achieve indirectly. By integrating generative AI for data enrichment, anomaly detection, and Q-learning for decision-making, the framework addresses bottleneck-aware scheduling challenges in Industry 5.0. This research addresses these limitations by integrating anomaly detection capabilities with RL within an industrial-grade cyber-physical testbed, providing a more realistic evaluation framework.
3. Materials and Methods
This section outlines the overall research design, detailing the methods and techniques employed to address the study’s objectives.
3.1. Data Acquisition and Experimental Setup
The dataset used for this study was collected through the FestoDidactics CPLab with eight individual manufacturing processes, equipped with various sensors and programmable logic controllers for on-site data collection and connectivity.
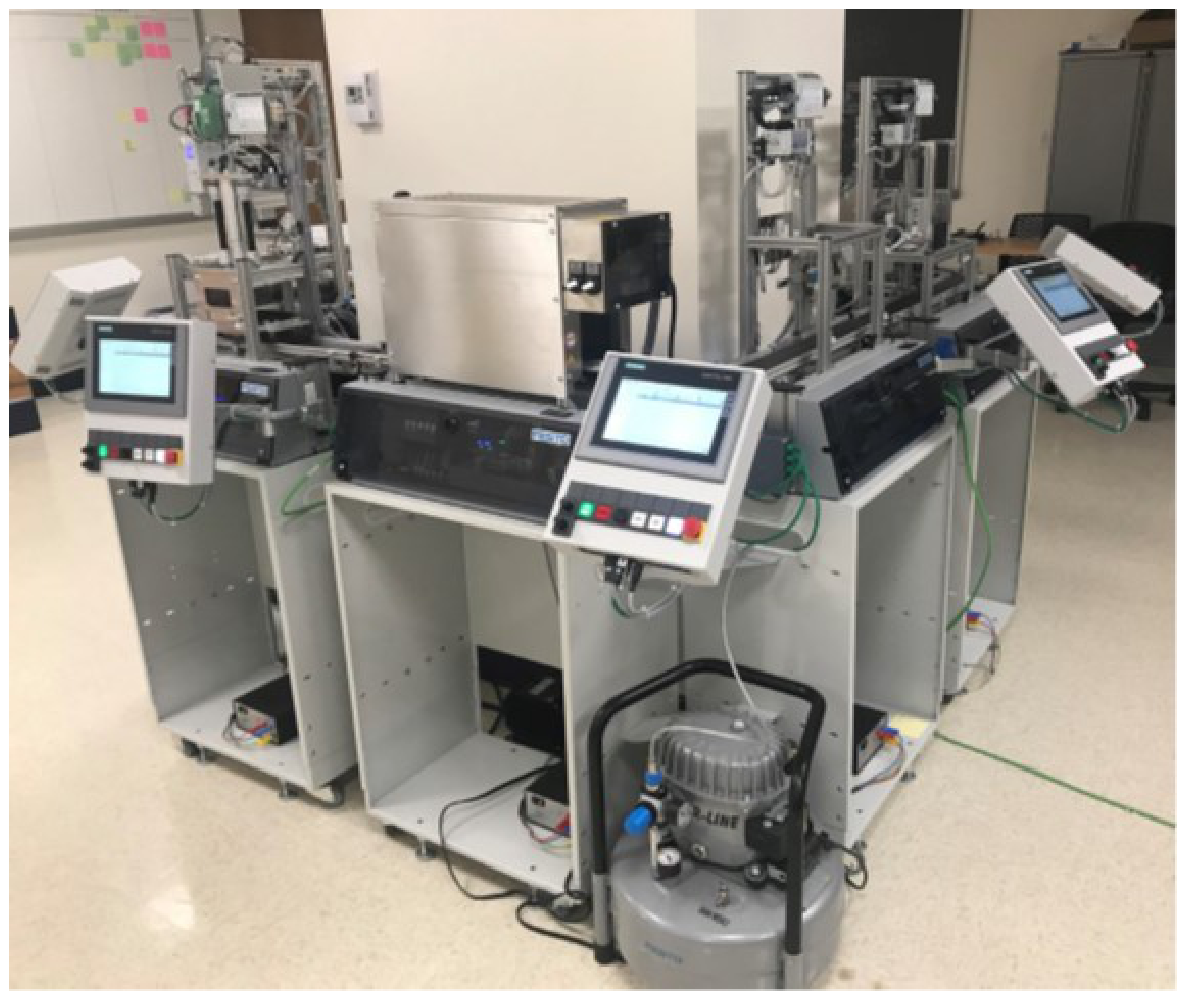
Figure 1 shows the Festo Didactic Learning System, an integrated eight-station manufacturing simulation platform for advanced JSS research. It is an industrial-grade operator training system designed for educational purposes. This modular system comprises eight unique manufacturing cells, each equipped with a Siemens Simatic ET 200SP and Human–Machine Interface. The CPLab simulates a discrete manufacturing process for mock cellular phones, controlled by Festo MES 4, a proprietary Manufacturing Execution System.
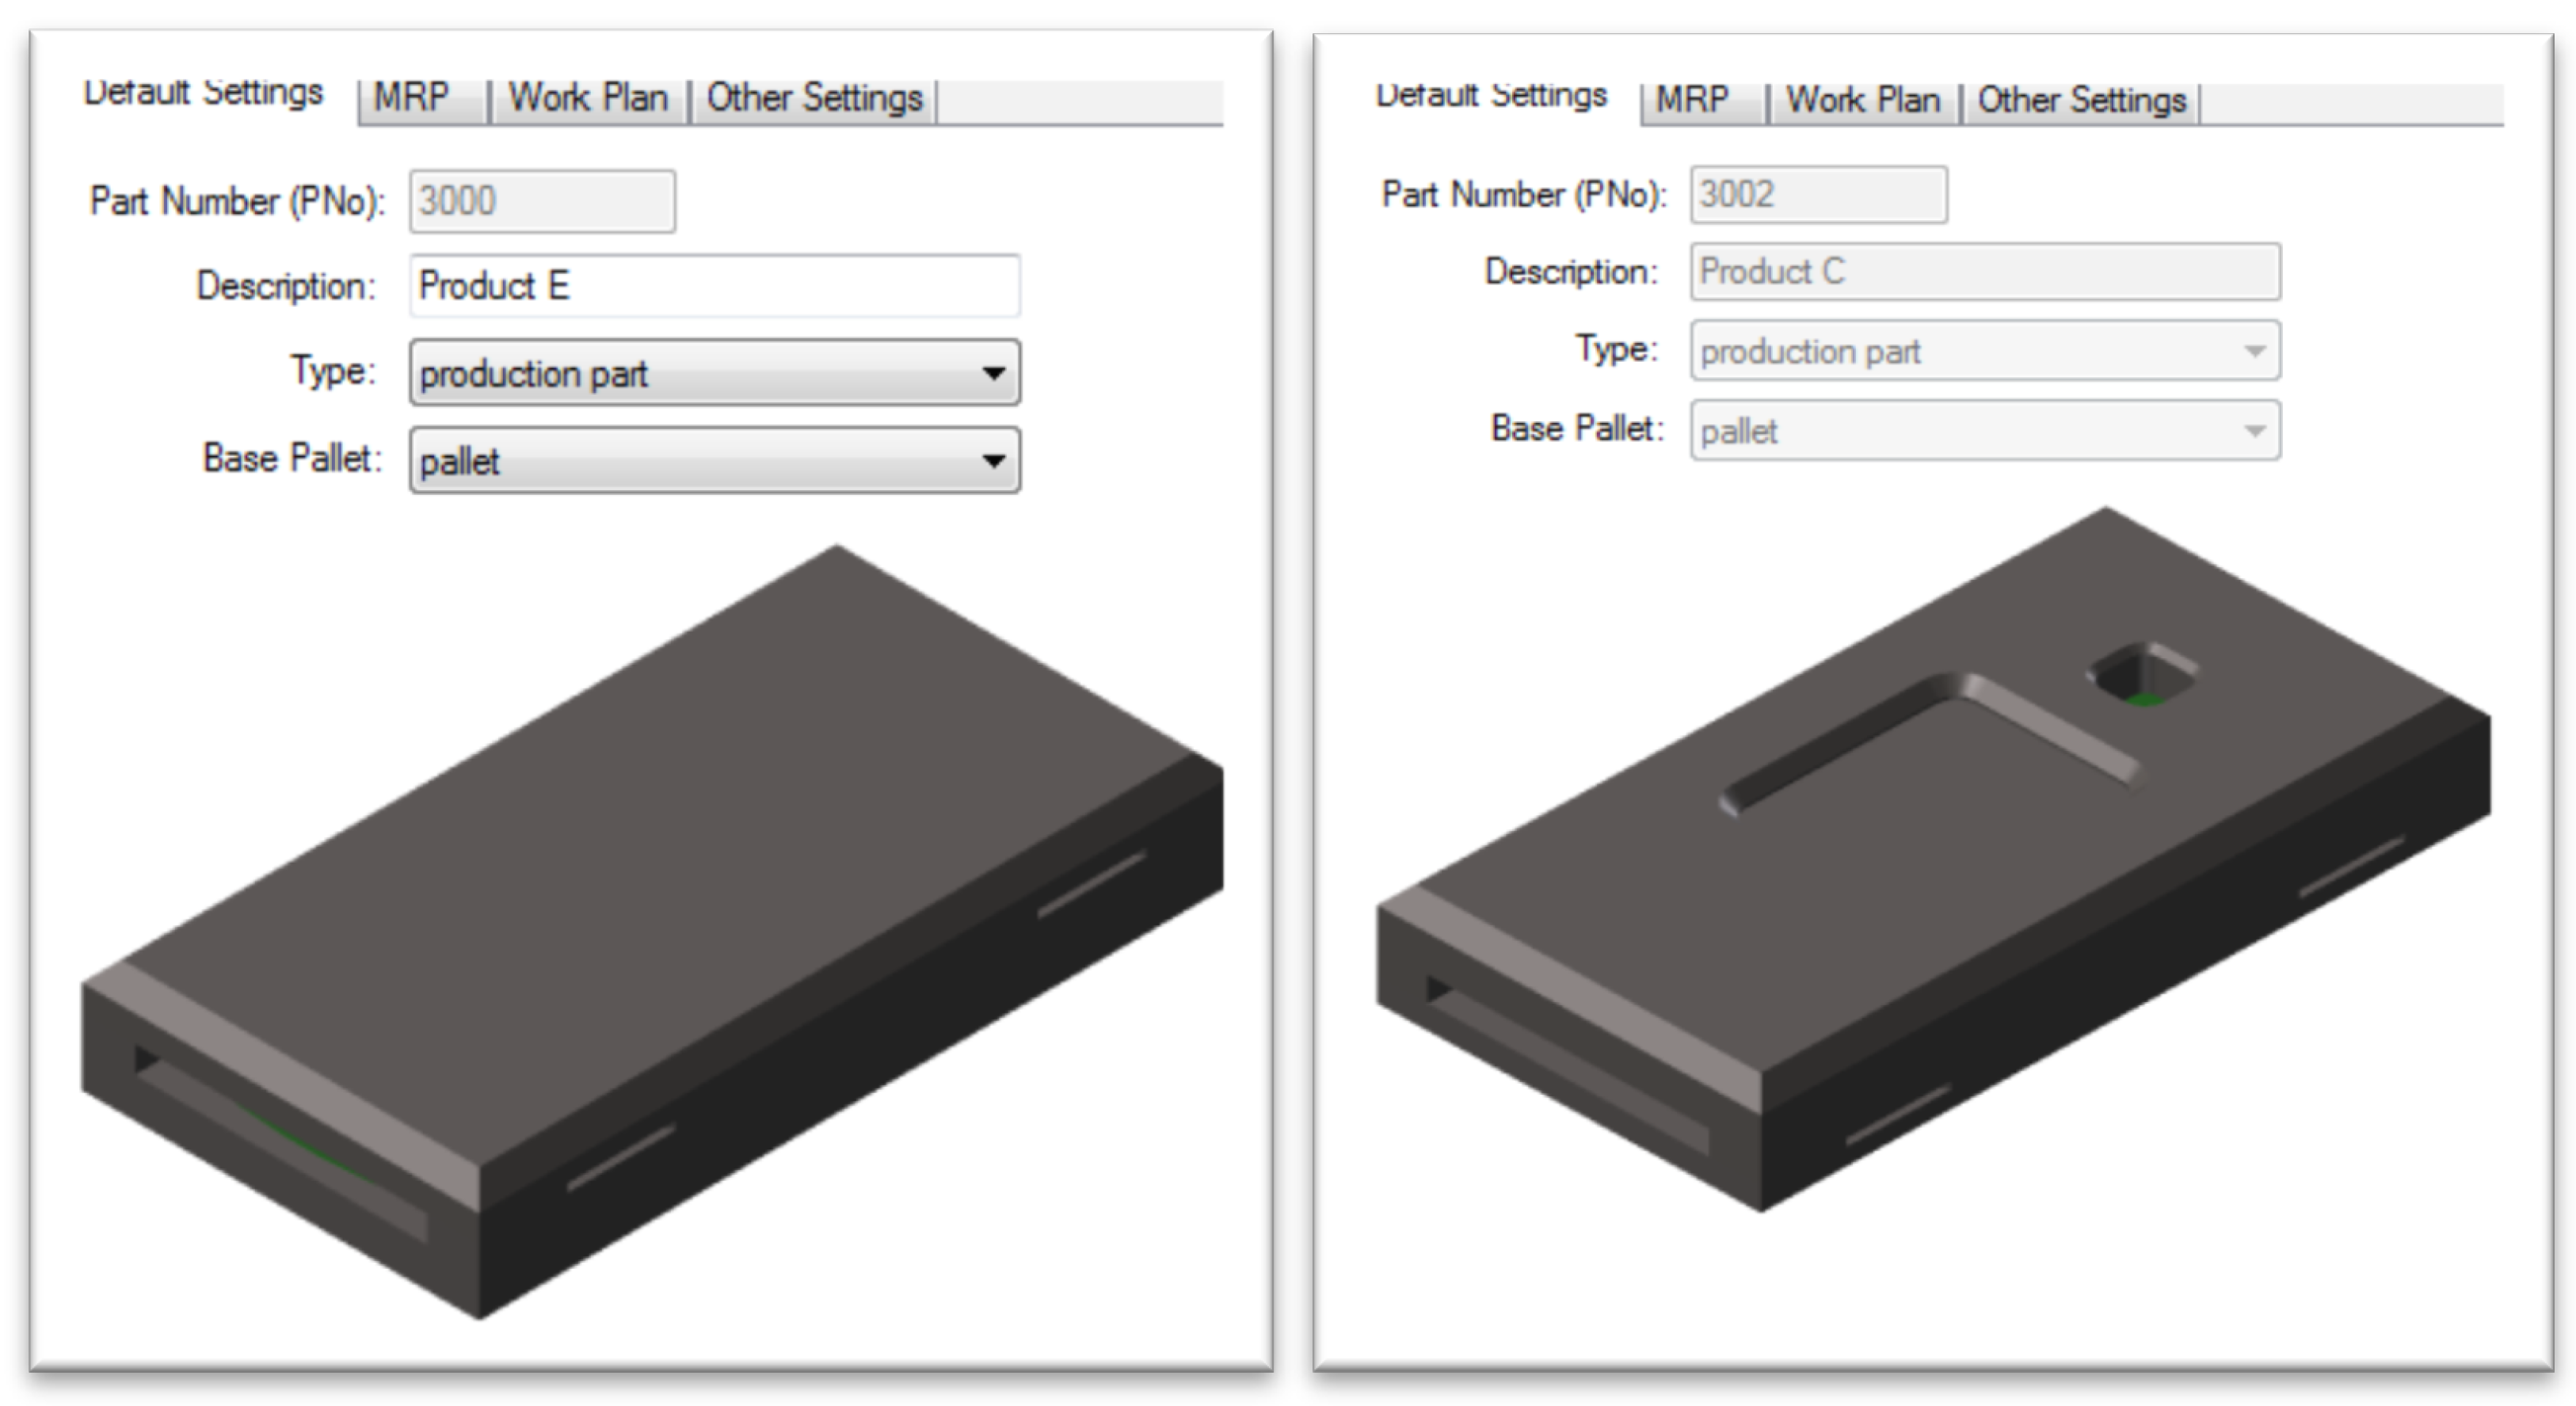
Figure 2 shows the front and back views of pallets used in this system, showcasing the versatile carriers for workpieces throughout the simulated manufacturing process. Station 1 dispenses top parts, Station 2 performs quality inspection, Station 3 drills holes, Station 4 adds bottom parts, Station 5 assembles components, Station 6 provides heat treatment, Station 7 flips the product, and Station 8 sorts and outputs finished items. The path that determines the complexity of the work plan followed to complete a job is categorized as Easy, Medium, or Complex. The system also includes an open MES to provide additional supply-chain-relevant data such as scheduling and throughput. This advanced setup serves as both a physical entity for prototype digital twin representation and a testbed to evaluate and showcase the application of our proposed solution.
3.2. Research Methodology
The integration of GAN and LOF with DRL addresses a critical limitation in current scheduling optimization approaches. While existing DRL methods have demonstrated promising results in tackling complex scheduling problems, they often lack effective mechanisms for detecting and prioritizing system bottlenecks, which are crucial constraints limiting overall system throughput. The LOF algorithm’s ability to identify local density deviations in processing times and resource utilization provides a precise bottleneck detection capability that traditional DRL approaches cannot achieve independently. We established connectivity for the CPLab system, integrating it with the cloud platform. We developed Information Models for the testbed using the Open Platform Communications Unified Architecture standard Extensible Markup Language Nodeset format, ensuring interoperability and standardized data exchange.
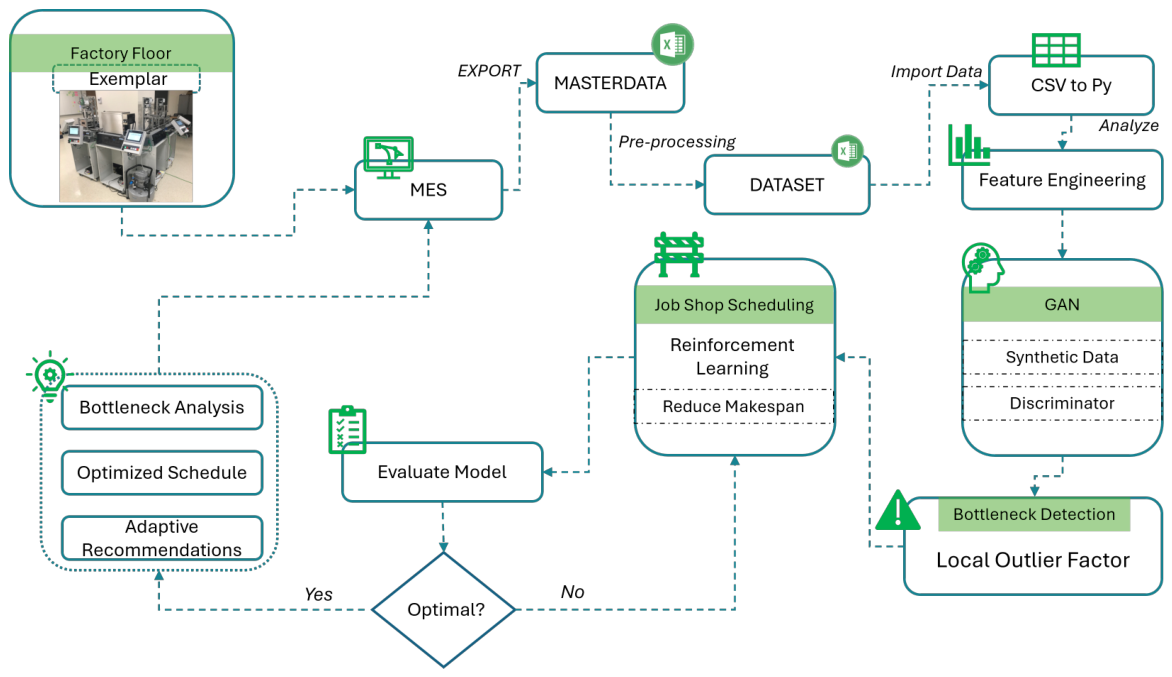
Figure 3 illustrates the proposed optimization framework for JSS in a smart manufacturing environment. The process begins with comprehensive data collection from the factory floor exemplar, which is exported through the MES to create a master dataset. This study encompassed a diverse range of JSS scenarios, systematically executing easy, medium, and complex production orders. We thoroughly analyzed work plan complexity, focusing on total lateness and processing time for various order quantities (12, 15, and 18) to ensure a robust dataset for our optimization framework. The collected data undergo preprocessing before being imported into a Python 3.13.15 environment for feature engineering and advanced analysis. These data are then augmented using a GAN to create realistic synthetic scheduling scenarios, enhancing the diversity and coverage of the training set.
This integration creates a focused learning objective where the QRL agent not only optimizes for overall makespan reduction but specifically prioritizes decisions that address the most critical system constraints. The framework rigorously evaluates the optimized schedule against predefined criteria and, upon achieving optimality, generates comprehensive bottleneck analysis, an optimized production schedule, and adaptive recommendations for continuous improvement.
Predefined Optimization Criteria
The predefined criteria employed in the framework evaluation serve as quantitative benchmarks to assess schedule optimality and manufacturing performance. These criteria are derived from established manufacturing science principles and industry practice standards, specifically:
Makespan Minimization, defined as the total production time from the first job’s start to the last job’s completion, representing a fundamental metric in JSS optimization.
Bottleneck Mitigation, measured through the reduction in outlier scores (LOF values) assigned to critical resources, derived from the theoretical foundation of anomaly detection and constraint theory
Resource Utilization Efficiency, quantifying the percentage of available machine time productively allocated versus idle time
These criteria were selected based on their direct correlation with manufacturing performance outcomes—reduced makespan improves throughput and responsiveness, bottleneck mitigation addresses system constraints that limit overall productivity, and improved resource utilization reduces operational costs and environmental impact. Within the GAN-LOF-QRL framework, these criteria guide the reward function design, where the agent receives higher rewards for decisions that simultaneously reduce makespan, address identified bottlenecks, and improve resource allocation. Upon convergence of the Q-learning model, the framework evaluates whether the optimized schedule meets all three criteria thresholds; only when all criteria are satisfied does the framework generate the final recommendations.
3.3. Algorithmic Implementation
The proposed approach employs a bottleneck-mapping framework utilizing LOF to detect anomalies in processing times and resource utilization. These data are then augmented using a GAN to create realistic synthetic scheduling scenarios and then fed into a QRL-based optimization strategy that dynamically adapts scheduling decisions to mitigate identified bottlenecks. These algorithms were selected for their complementary strengths: LOF’s ability to detect local deviations in data density, which is crucial for identifying bottlenecks, and QRL’s capacity to learn optimal scheduling policies in complex, dynamic environments. By combining these techniques, our method not only enhances energy-efficient practices but also streamlines production workflows, resulting in significant reductions in overall makespan.
3.3.1. Generative Adversarial Network
In the proposed framework, a Generative Adversarial Network (GAN) is used to augment the original dataset for JSS with realistic synthetic scenarios, thus increasing the diversity and representativeness of training data available to the RL agent. The GAN consists of a generator that learns to produce plausible scheduling samples and a discriminator that distinguishes between real and synthetic data [
25]. The generator and the discriminator are both trained in an adversarial manner until the synthetic data become indistinguishable from real-world samples. This synthetic data generation process enables the learning agent to encounter a broader range of production patterns, including rare bottleneck events, which are often underrepresented in experimental datasets.
By exposing the RL model to real and GAN-generated scheduling scenarios, the framework improves the agent’s ability to generalize, adapt to dynamic manufacturing conditions, and optimize scheduling decisions in complex industrial CPS.
The GAN architecture used in this framework consists of two multilayer perceptron networks, a discriminator network
D, and a generator network
G.
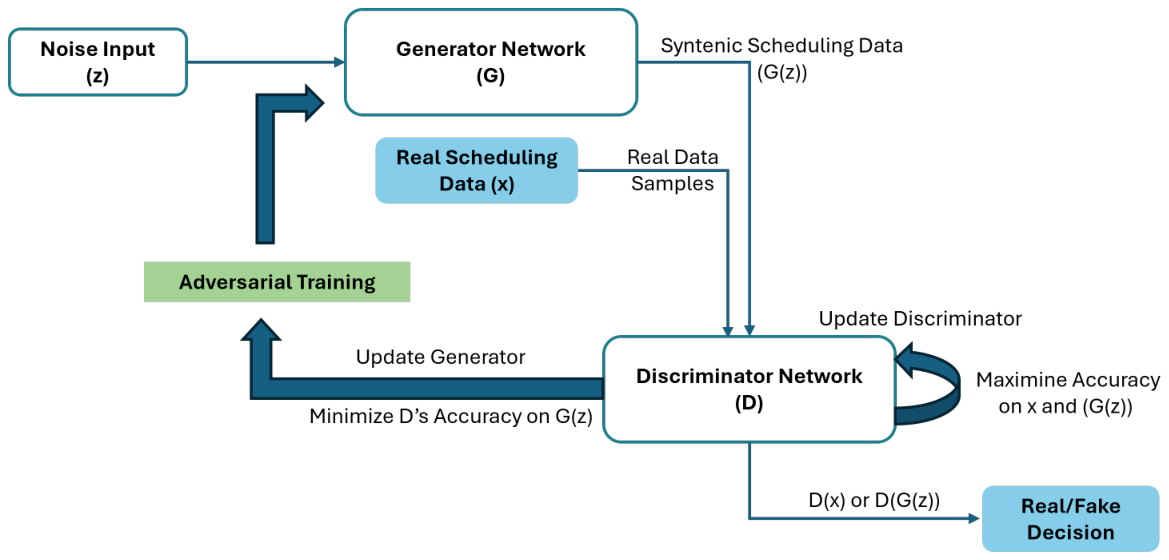
Figure 4 shows the GAN architecture for the adversarial training loop between the generator and discriminator networks.
The generator G creates synthetic scheduling feature vectors, such as processing times, resource allocations, and job sequences, by mapping random noise vectors sampled from a latent space. The discriminator D outputs a probability score that indicates whether the input is generated or real after receiving both synthetic samples from G and real scheduling data from the Festo CPLab. In order to accurately distinguish between real and synthetic samples, the discriminator minimizes the binary cross-entropy loss during training, while the generator maximizes the discriminator’s error rate by creating increasingly realistic scheduling scenarios. Until the generator generates artificial data that are statistically identical to actual production records, this adversarial process will continue. The Q-learning agent can learn scheduling policies that are resilient to a wider range of production conditions by combining these augmented samples with actual data to create an enriched training set.
The GAN architecture consists of a generator that receives a 100-dimensional latent noise vector, which is processed through two dense hidden layers with 128 and 256 units, respectively, both utilizing ReLU activations. The output layer matches the feature dimension (X.shape[1]) and employs a Sigmoid activation to generate synthetic samples. The discriminator processes either real or generated samples through two dense hidden layers with 256 and 128 units (ReLU activations), followed by a single-unit Sigmoid output layer for authenticity prediction. Both networks are trained using the binary cross-entropy loss and optimized with the Adam optimizer at a learning rate of 0.0001 and a batch size of 32. Training is performed for a fixed 1000 epochs without early stopping.
3.3.2. Local Outlier Factor
The Local Outlier Factor (LOF) is an unsupervised anomaly detection method that identifies outliers by computing the local density deviation of each data point relative to its neighbors, assigning higher scores to isolated points with lower densities compared to their surroundings [
26].
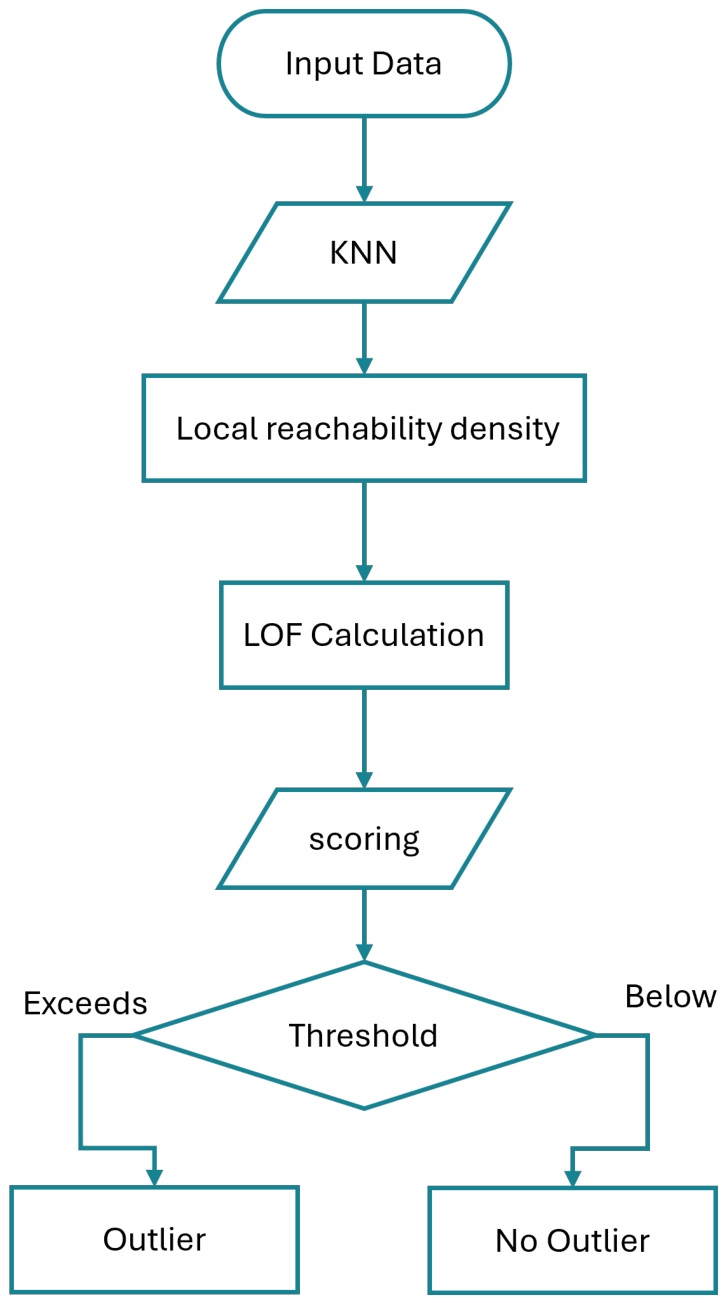
Figure 5 explains the flow process of LOF working. LOF takes the input data and finds the k-nearest neighbors for each data point based on a distance metric. It then calculates the local reachability density of each point, which is based on the distance to its kth nearest neighbor. Next, LOF computes the local outlier factor for each point by summing up the reachability densities of its k-nearest neighbors and dividing by the average reachability density of those neighbors. A higher LOF value indicates that the point is more isolated compared to its neighbors, making it more likely to be an outlier. The model assigns an Outlier label (−1 for outlier, 1 for inlier) and provides an Outlier Score for each sample. A new feature,
IsBottleneck, is introduced in the main dataframes. This flag is set to True for jobs matching the
ResourceID and
ProcessingTime characteristics of detected bottlenecks (those with an Outlier label of −1 from the LOF analysis). This enables the agent to learn scheduling policies that account for identified bottlenecks. The LOF model is configured with a neighborhood size of 20 and an anomaly threshold of 0.1.
StandardScaler() is applied for data normalization.
3.3.3. Reinforcement Learning
RL is the category of machine learning where an agent learns to make decisions by interacting with an environment. The agent receives rewards or penalties for the actions it takes and seeks to maximize cumulative reward over time [
27]. Q-learning is a value-based RL algorithm where an agent learns to make decisions by maintaining a table (Q-table) of state–action pairs and their expected rewards. The “Q” stands for “Quality,” representing the quality or value of an action in a given state. The algorithm works by iteratively updating these Q-values based on the rewards received from the environment, using the following Bellman Equation (
1):
where
is the Q-value for state
and action
.
is the learning rate (0 <
≤ 1).
is the reward received and
is the discount factor (0 ≤
< 1).
is the maximum Q-value for the next state
. Through this process, the agent learns which actions are most valuable in each state, eventually developing an optimal policy for decision-making without needing a model of the environment.
The Q-learning algorithm implementation utilizes a set of hyperparameters for its learning behavior. Learning rate controls the step size for updating the Q-values based on newly acquired information; discount factor determines the importance of future rewards relative to immediate outcomes; exploration rate balances the exploration–exploitation trade-off.
This trade-off is achieved by defining the probability of taking random actions instead of exploiting known high-value actions; and training continues for episodes to ensure sufficient exploration of the state-action space and convergence of the Q-table.
Algorithm 1 shows the steps for Q-Learning that are used for JSS. The notations used in this algorithm and their explanation are as follows:
| Algorithm 1: Q-Learning for Job Shop Scheduling |
- 1
Initialize Q-table with zeros; - 2
Set learning rate , discount factor , exploration rate ; - 3
for each episode do; - 4
Initialize state s; - 5
while not done do; - 6
if random() < then; - 7
Choose random action a; - 8
else; - 9
Choose action ; - 10
Take action a, observe reward r and next state ; - 11
Update Q-value:; - 12
; - 13
; - 14
return Q-table;
|
s: Current state of the environment
: Next state of the environment
a: Action taken by the agent
: Possible actions in the next state
: Learning rate (determines how much new information overrides old information)
: Discount factor (determines the importance of future rewards)
: Exploration rate (probability of choosing a random action)
: Maximum Q-value for the next state across all possible actions
The LOF algorithm’s outlier scores are integrated into the state space and reward function.
The LOF algorithm assigns outlier scores to each job based on the processing time and resource ID. These scores are then used to set the bottleneck flag in the state space and to modify the reward calculation.
Equation (
2) shows the mathematical formulation of the reward function:
where
is the processing time of job
j,
is the resource ID required by job
j, and
a is the action.
In the reward function, makespan reduction is implicitly addressed by providing higher rewards for jobs with shorter processing times ( term). Bottleneck mitigation is prioritized by doubling the reward for bottleneck jobs, and the negative reward (−1) for incorrect resource selection ensures the agent learns to assign jobs to appropriate resources.
3.3.4. Advantages over Conventional RL/DRL
Traditional reinforcement learning (RL) methods for JSS face limitations due to the less available data of critical events in manufacturing, that leads to poor generalization. The proposed GAN-augmented framework overcomes these challenges by generating synthetic scheduling scenarios to augment training data, reducing overfitting by exposing the Q-learning agent to both real and synthetic data, and offering computational efficiency compared to gathering extensive real-world data. Experimental results indicate that the GAN-LOF-QRL approach achieves a 13.4% reduction in makespan compared to the baseline, highlighting the efficacy of generative AI in improving RL-based scheduling in dynamic environments.
3.4. Data Analysis
This section explains the data used and visualizes different graphs to explain different columns of the dataset.
The Gantt Chart in
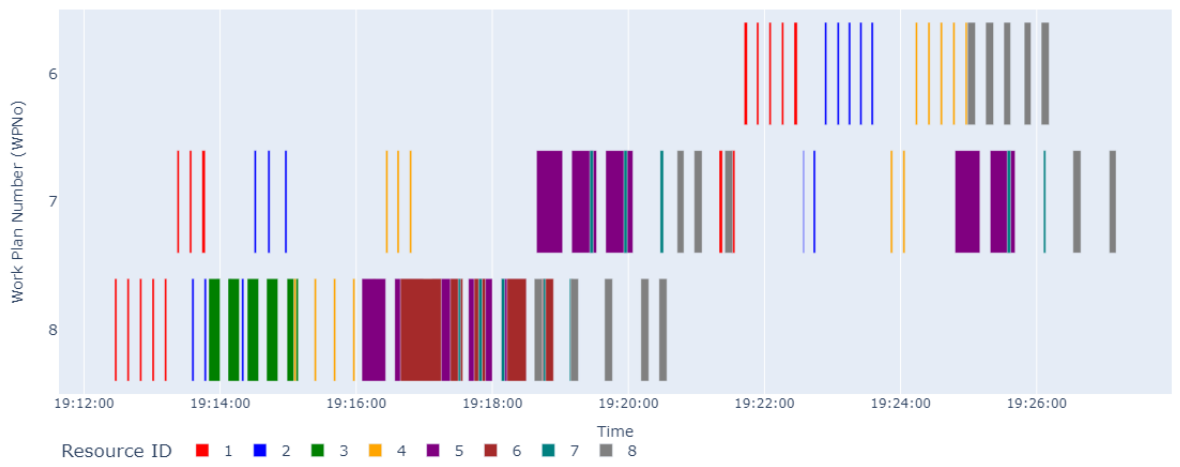
Figure 6 visualizes the production process, illustrating task sequences, durations, and resource allocations across different work plans. Each horizontal bar represents a task, with its length indicating duration. The y-axis displays Work Plan Numbers (WPNo), while the x-axis shows the timeline in hours and minutes. Color-coding denotes different resource IDs, enabling quick identification of resource allocation throughout the process. This visualization allows for efficient analysis of task dependencies, resource utilization, and overall production flow.
Table 1 presents a summary of the dataset generated from the Festo Didactic CPLab. The table shows various aspects of the production process, including product numbers (PNo), order numbers (ONo), order positions (OPos), step descriptions, operation numbers (OpNo), and step sequencing (NextStepNo, FirstStep). Timing information is recorded through each step’s planned and actual start/end times. The dataset also includes details on resource allocation (ResourceID), transport times between steps, and error flags. Each step is associated with a specific resource, numbered from 1 to 8, corresponding to the eight unique manufacturing cells in the CPLab. The process begins with feeding parts from a magazine and progresses through measurement, drilling, assembly, pressing, heating, turning, and final delivery. The ‘WPNo’ column indicates the complexity of work plans, with three levels: 6 (easy), 7 (medium), and 8 (complex). The dataset shown in the table represents 15 orders, which is the primary focus of this manuscript and subsequent data visualizations. Additionally, the results section covers two other datasets for 12 and 18 orders for comparative analysis. This comprehensive dataset captures the intricacies of the manufacturing process, including timing, resource allocation, and step sequencing, providing a rich foundation for analysis and optimization studies.
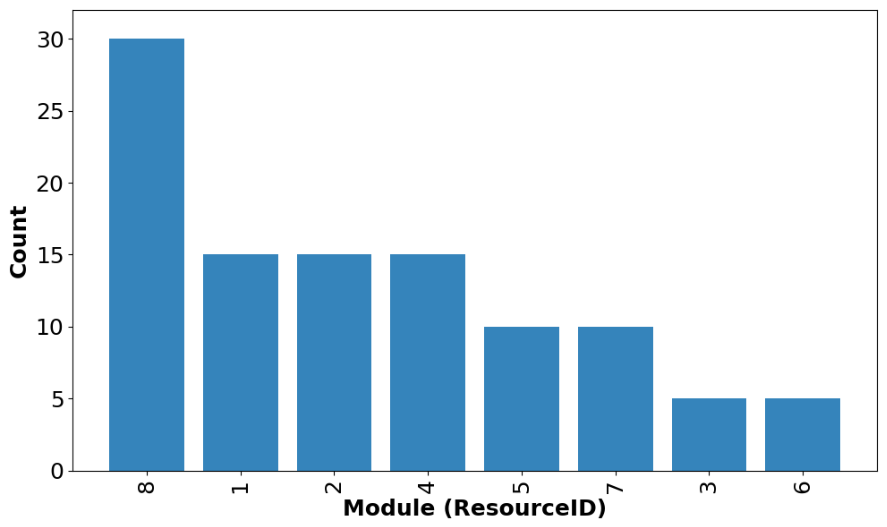
Figure 7 shows each module’s value count. Module 8 is the final unit, hence it is associated with the most readings.
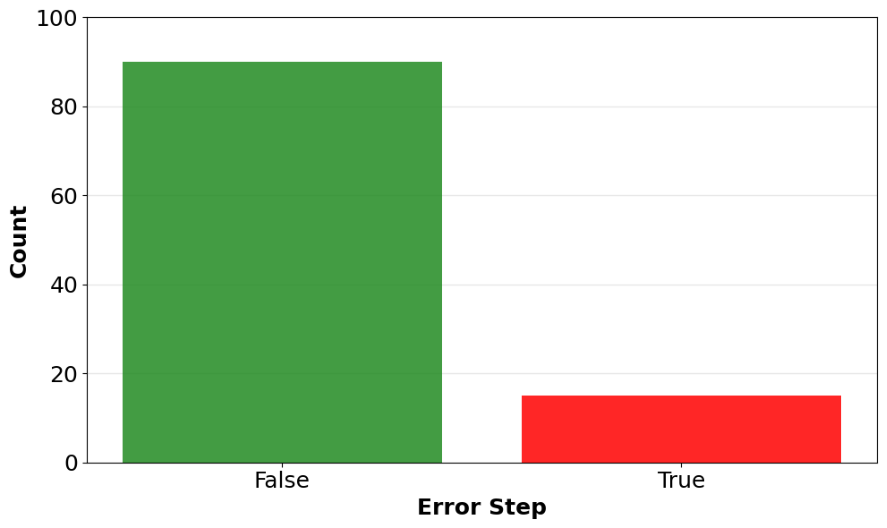
Figure 8 shows how often errors happen during the manufacturing process. The green bar represents the number of steps that went smoothly without any errors. The red bar shows how many times something went wrong during a step. This helps us to see whether the process is running well or if there are frequent problems.
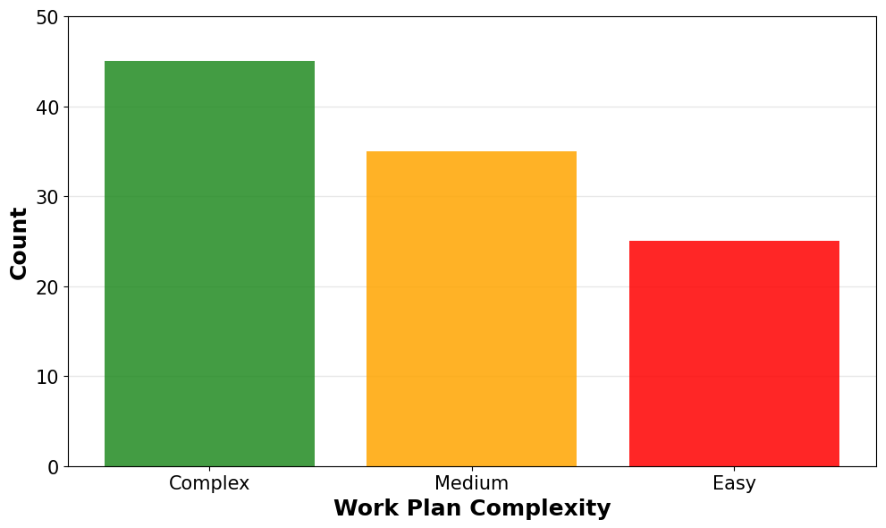
Figure 9 shows the count of the work plan complexity values. This categorization into easy, medium, and complex workflows enables standardized assessment of the framework across varying levels of manufacturing complexity.
Figure 10 displays how long each station typically takes to complete its task. Stations 3, 5, and 6 take the most time. These stations are where we drill holes in the front piece, press the pieces together, and heat-treat the assembled parts. Because these stations take longer, they tend to slow down the whole process and cause delays.
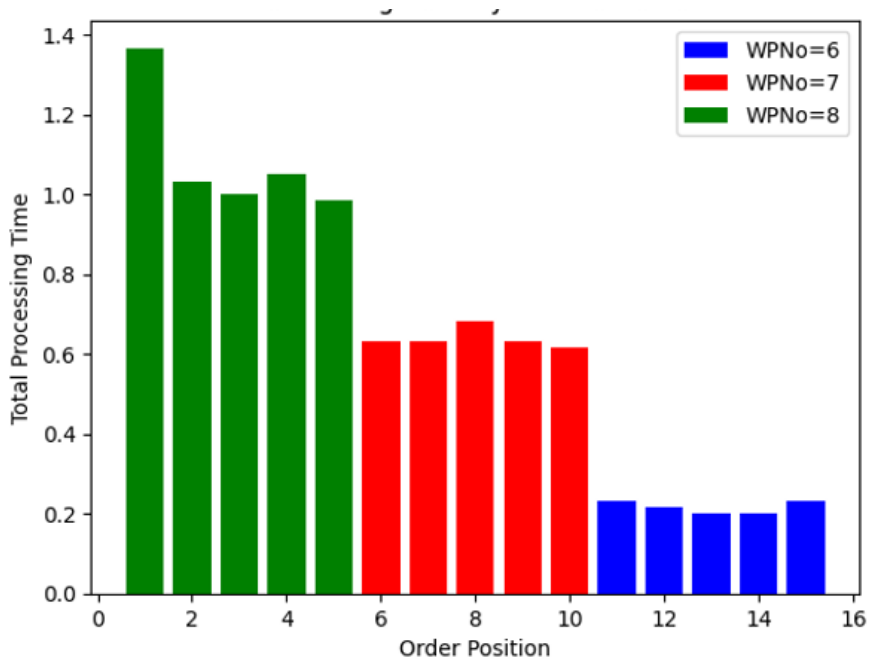
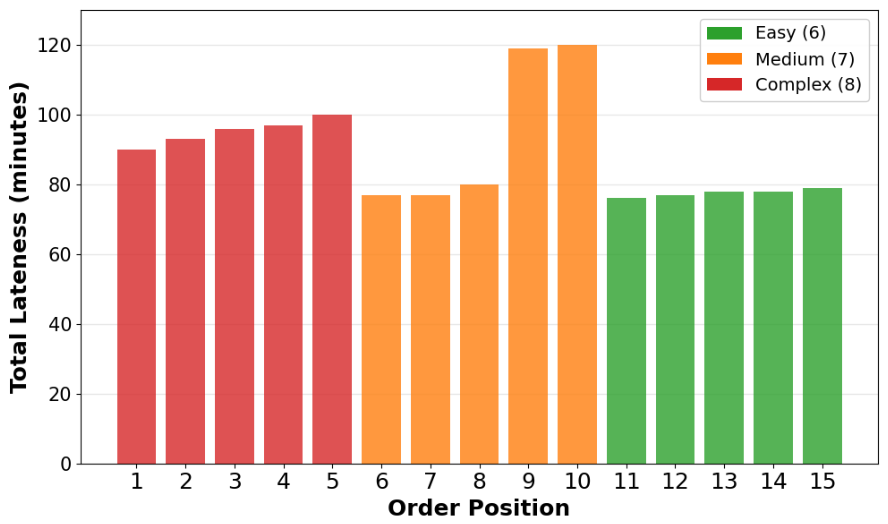
Figure 11 shows how late each order is compared to when it was supposed to start. We calculate this by comparing when a step actually began to when it was planned to begin. The graph uses different colors to show how complex each order is: green for easy orders, yellow for medium difficulty, and red for complex orders. This helps us see if more complex orders tend to be later than simpler ones.
4. Performance Evaluation and Results
This section presents a comprehensive evaluation of the proposed LOF-enhanced Q-learning approach using the Festo Didactic CP Lab configured with eight manufacturing processes and an integrated MES.
The evaluation employs multiple key metrics, including makespan (total production time), and average outlier score for bottleneck detection accuracy. Our method achieved significant reductions in makespan in all scenarios tested (12, 15, and 18 orders).
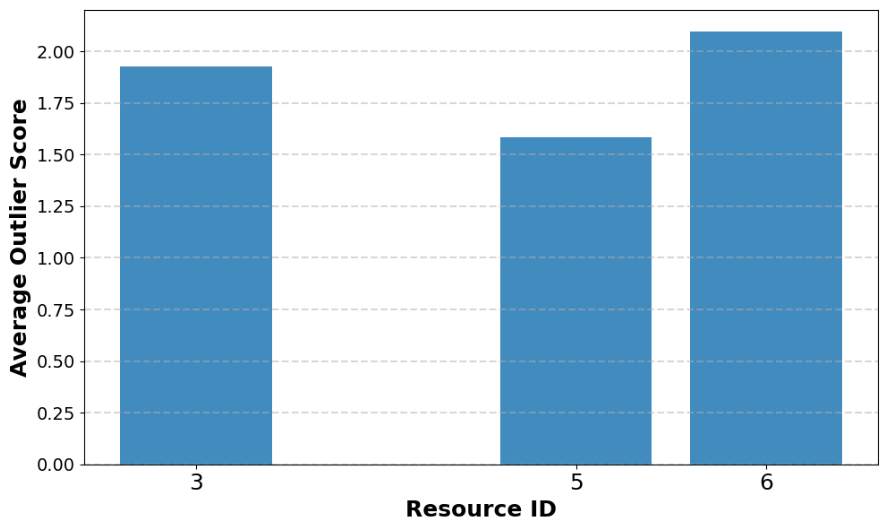
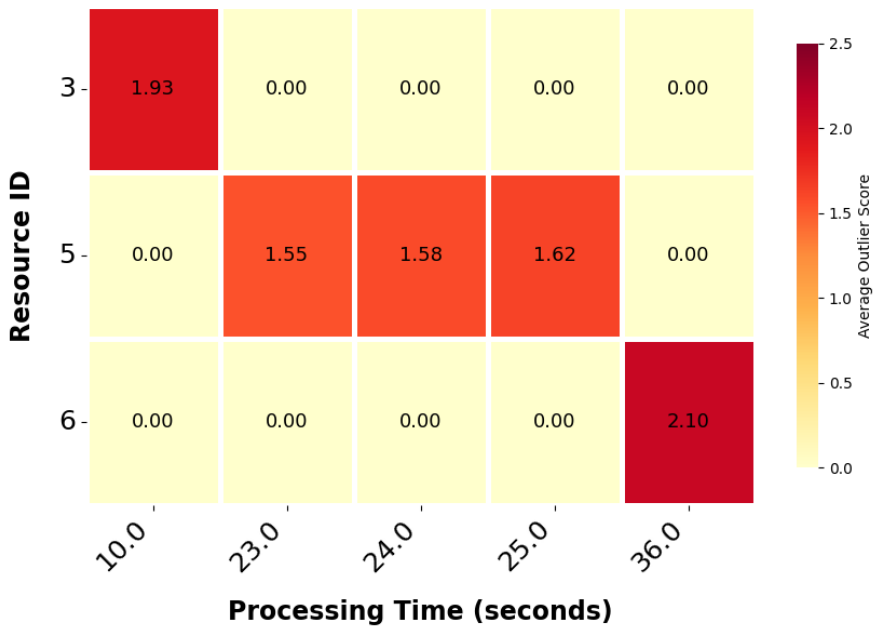
Table 2 presents the bottlenecks detected in the production process, showing Resource ID, Processing Time, and Outlier Score for each instance. Higher Outlier Scores indicate more significant deviations from expected processing times, potentially identifying critical bottlenecks in the system. Three specific workstations are identified as operational bottlenecks: Resource 3 (custom drilling), Resource 5 (force-regulated pressing), and Resource 6 (thermal processing). Specifically, Resource 3 accounts for five anomaly occurrences with a consistent outlier score of 1.926181 at 10.0 s processing time, Resource 5 accounts for four occurrences with an average outlier score of 1.585011 across longer processing durations (23.0–25.0 s), and Resource 6 exhibits the highest peak outlier score of 2.095971 corresponding to a 36.0 s cycle time.
The heatmap
Figure 12 visualizes the relationship between Resource ID, Processing Time, and Outlier Score for detected bottlenecks in a JSS scenario of 15 job orders. Each cell in the heatmap represents a specific combination of Resource ID and Processing Time, with the color intensity indicating the Outlier Score. Darker colors (red) suggest higher Outlier Scores, pointing to more severe bottlenecks, while lighter colors (yellow) indicate less critical issues. The number of each cell represents the average Outlier Score for the corresponding Resource ID and Processing Time.
Figure 13 illustrates the average Outlier Score for each Resource ID as a bar plot. This visualization helps identify which resources consistently contribute to bottlenecks, with higher bars indicating resources that may require closer attention or optimization in the production process.
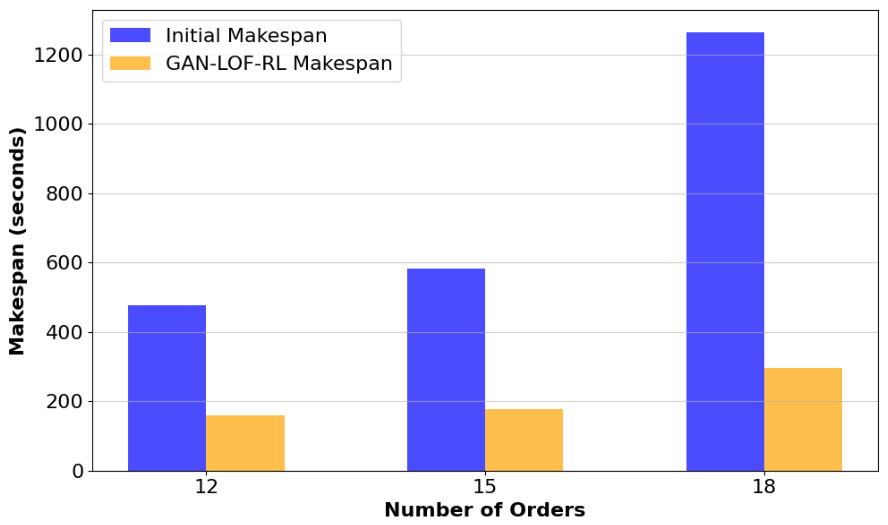
Figure 14 illustrates the comparative performance of our proposed GAN-LOF-RL method against both the initial production schedule and the LOF-RL approach for different order quantities.
The graph demonstrates progressively increasing initial makespan as order volume grows, from 477 s for 12 orders to 1265 s for 18 orders. While the LOF-RL method achieves substantial reductions (to 185, 205, and 341 s for 12, 15, and 18 orders, respectively), the GAN-LOF-RL approach further improves these results, achieving makespans of 160, 177, and 295 s for the same order volumes. This represents an additional improvement of 13.4%, 13.3%, and 13.4% over LOF-RL, and total reductions of 66.4%, 69.5%, and 76.6% compared to the initial makespan. These results demonstrate that the generative AI component significantly enhances scheduling optimization, particularly as production complexity increases with higher order volumes.
Table 3 compares the optimized makespan of the proposed GAN-LOF-QRL algorithm with three other algorithms across three order sets (12, 15, and 18 orders).
The proposed GAN-LOF-QRL algorithm consistently outperforms the other methods across all order sets. The Cuckoo Search Algorithm [
28] and Two-Stage Genetic Algorithm [
29] show competitive performance. The multi-agent RL approach [
12,
30], without the LOF component, shows the least optimal performance among the compared methods. The synthetic data generation capability of the GAN enables the RL agent to better anticipate and mitigate bottlenecks across various manufacturing scenarios, yielding more efficient resource utilization and improved throughput potential in industrial CPS.
4.1. Synthetic Data Validation
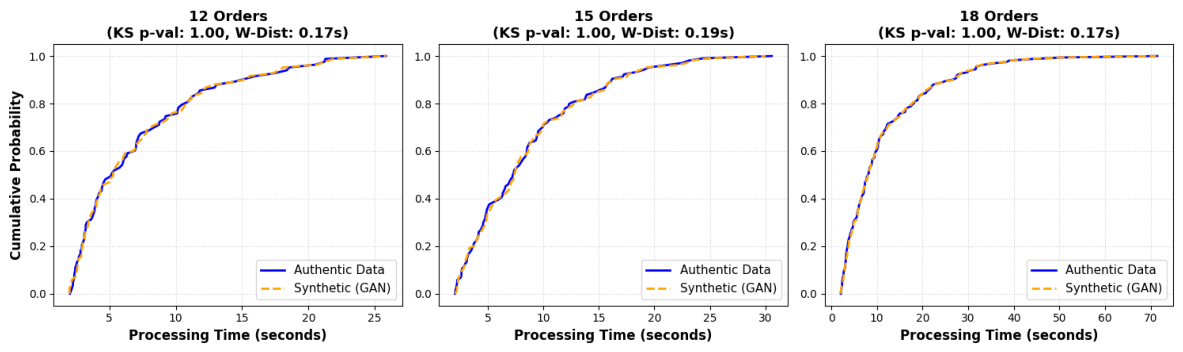
To quantitatively validate that the GAN generates realistic scheduling scenarios and avoids distribution collapse, the statistical similarity between empirical and synthetic processing times was assessed for all order sets (12, 15, and 18 orders).
Figure 15 presents the Empirical Cumulative Distribution Functions (ECDF) comparing original shop-floor data with GAN-generated data. The synthetic data closely match the authentic cumulative probability distributions for both short-duration operations and long-tail processing events. Statistical evaluation produced Kolmogorov–Smirnov test
p-values of
p = 1.00 (
p > 0.05) and low Wasserstein distances of 0.17 s, 0.19 s, and 0.17 s for 12, 15, and 18 orders, respectively. These findings confirm that the generative model preserves the empirical distribution characteristics required for effective reinforcement learning policy training.
4.2. Ablation Study
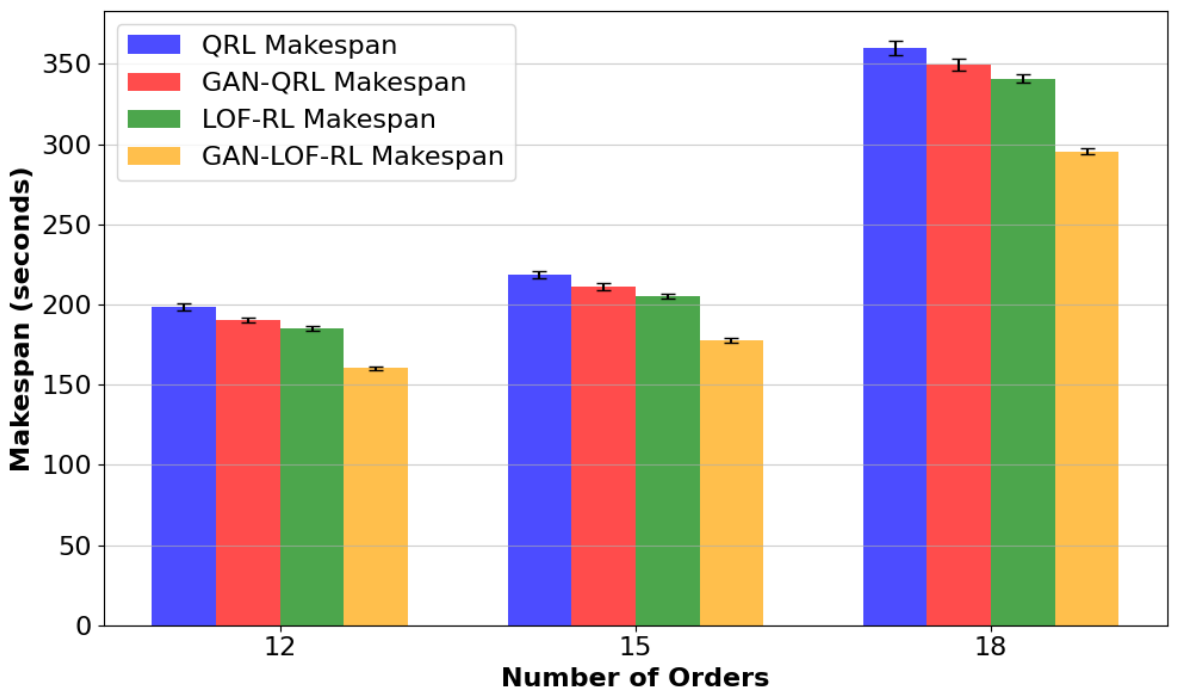
An ablation analysis was performed across four progressive configurations: QRL, GAN-QRL, LOF-RL, and the proposed GAN-LOF-RL. This approach isolates the contributions of generative data augmentation and bottleneck detection. As shown in the multi-configuration comparison in
Figure 16, baseline Q-learning achieves substantial schedule compression. The addition of GAN augmentation (GAN-QRL) and LOF bottleneck identification (LOF-RL) independently reduces makespans across all order quantities. The integration of both components in the GAN-LOF-RL framework results in the highest scheduling efficiency, with makespans reduced to 160.21 s, 177.71 s, and 295.41 s for 12, 15, and 18 orders, respectively. Compared to the initial unoptimized schedule in
Figure 16, these results correspond to makespan reductions of 66.4%, 69.5%, and 76.6% (averaging 70.8%), indicating that the combination of generative synthetic scenarios and targeted bottleneck reward signals consistently provides the greatest optimization performance.
4.3. Statistical Validation of Proposed Model
Across the eight testbed resources, makespan optimization reduced peak station load from initial unoptimized runtimes (e.g., 477 s, 583 s, and 1265 s) down to balanced schedules of 160.21 s, 177.71 s, and 295.41 s. Model training (1000 GAN epochs and 10,000 Q-learning episodes) completed within 2–3 min on a standard compute instance. Once trained, action selection is performed via direct Q-table lookup (argmax), requiring sub-millisecond inference per operation step and enabling real-time dispatching.
To evaluate algorithmic stability and reduce potential bias, all configurations were assessed over 10 independent experimental runs with distinct random seeds. As summarized in
Table 4, the GAN-LOF-RL model consistently produced the lowest mean makespans, the smallest standard deviations, and the narrowest 95% confidence intervals across all order volumes. We conducted two-tailed paired
t-tests and Wilcoxon signed-rank tests at a significance level of
= 0.05. The makespan improvements achieved by GAN-LOF-QRL over all comparative baselines are statistically significant (
< 0.001), confirming that the combination of GAN scenario generation and LOF-guided reward-shaping provides superior optimization performance and robustness to run-to-run variability.