Article

SAR Ship Detection in Complex Marine Environments

1
School of Physics and Optoelectronics, South China University of Technology, Guangzhou 037009, China
2
School of Electronics and Communication Engineering, Sun Yat-sen University, Shenzhen 518107, China
3
Department of Analytical Instruments, Hymson Laser Technology Group Co., Ltd., Shenzhen 518000, China
*
Authors to whom correspondence should be addressed.
Computers 2026, 15(7), 437; https://doi.org/10.3390/computers15070437
Submission received: 26 May 2026 / Revised: 3 July 2026 / Accepted: 5 July 2026 / Published: 10 July 2026
(This article belongs to the Section AI-Driven Innovations)

Abstract

Synthetic aperture radar (SAR) ship detection is critical for maritime surveillance; however, accurately identifying targets in complex marine environments remains a persistent challenge due to severe sea clutter and coastal interference. To address the prevalent issues of missed detections and false alarms, this paper proposes a novel deep learning framework named AFN-YOLO (Adaptive Frequency Network–You Only Look Once). Specifically, we propose a C2f_FF (C2f Frequency Fusion) module that dynamically extracts and fuses frequency-domain and spatial-domain information, effectively suppressing background interference and artifacts from nearby buildings. Additionally, a TAS-FPN (Triplet Attention-based Spatial FPN) architecture is integrated to capture multiscale features, significantly improving the detection capability for small and overlapping ship targets. Furthermore, the loss function is optimized to compel the model to focus on salient target features while disregarding irrelevant background data. Extensive experiments on the SAR Ship Detection Dataset (SSDD) and the High-Resolution SAR Images Dataset (HRSID) validate the effectiveness of our approach.

1. Introduction

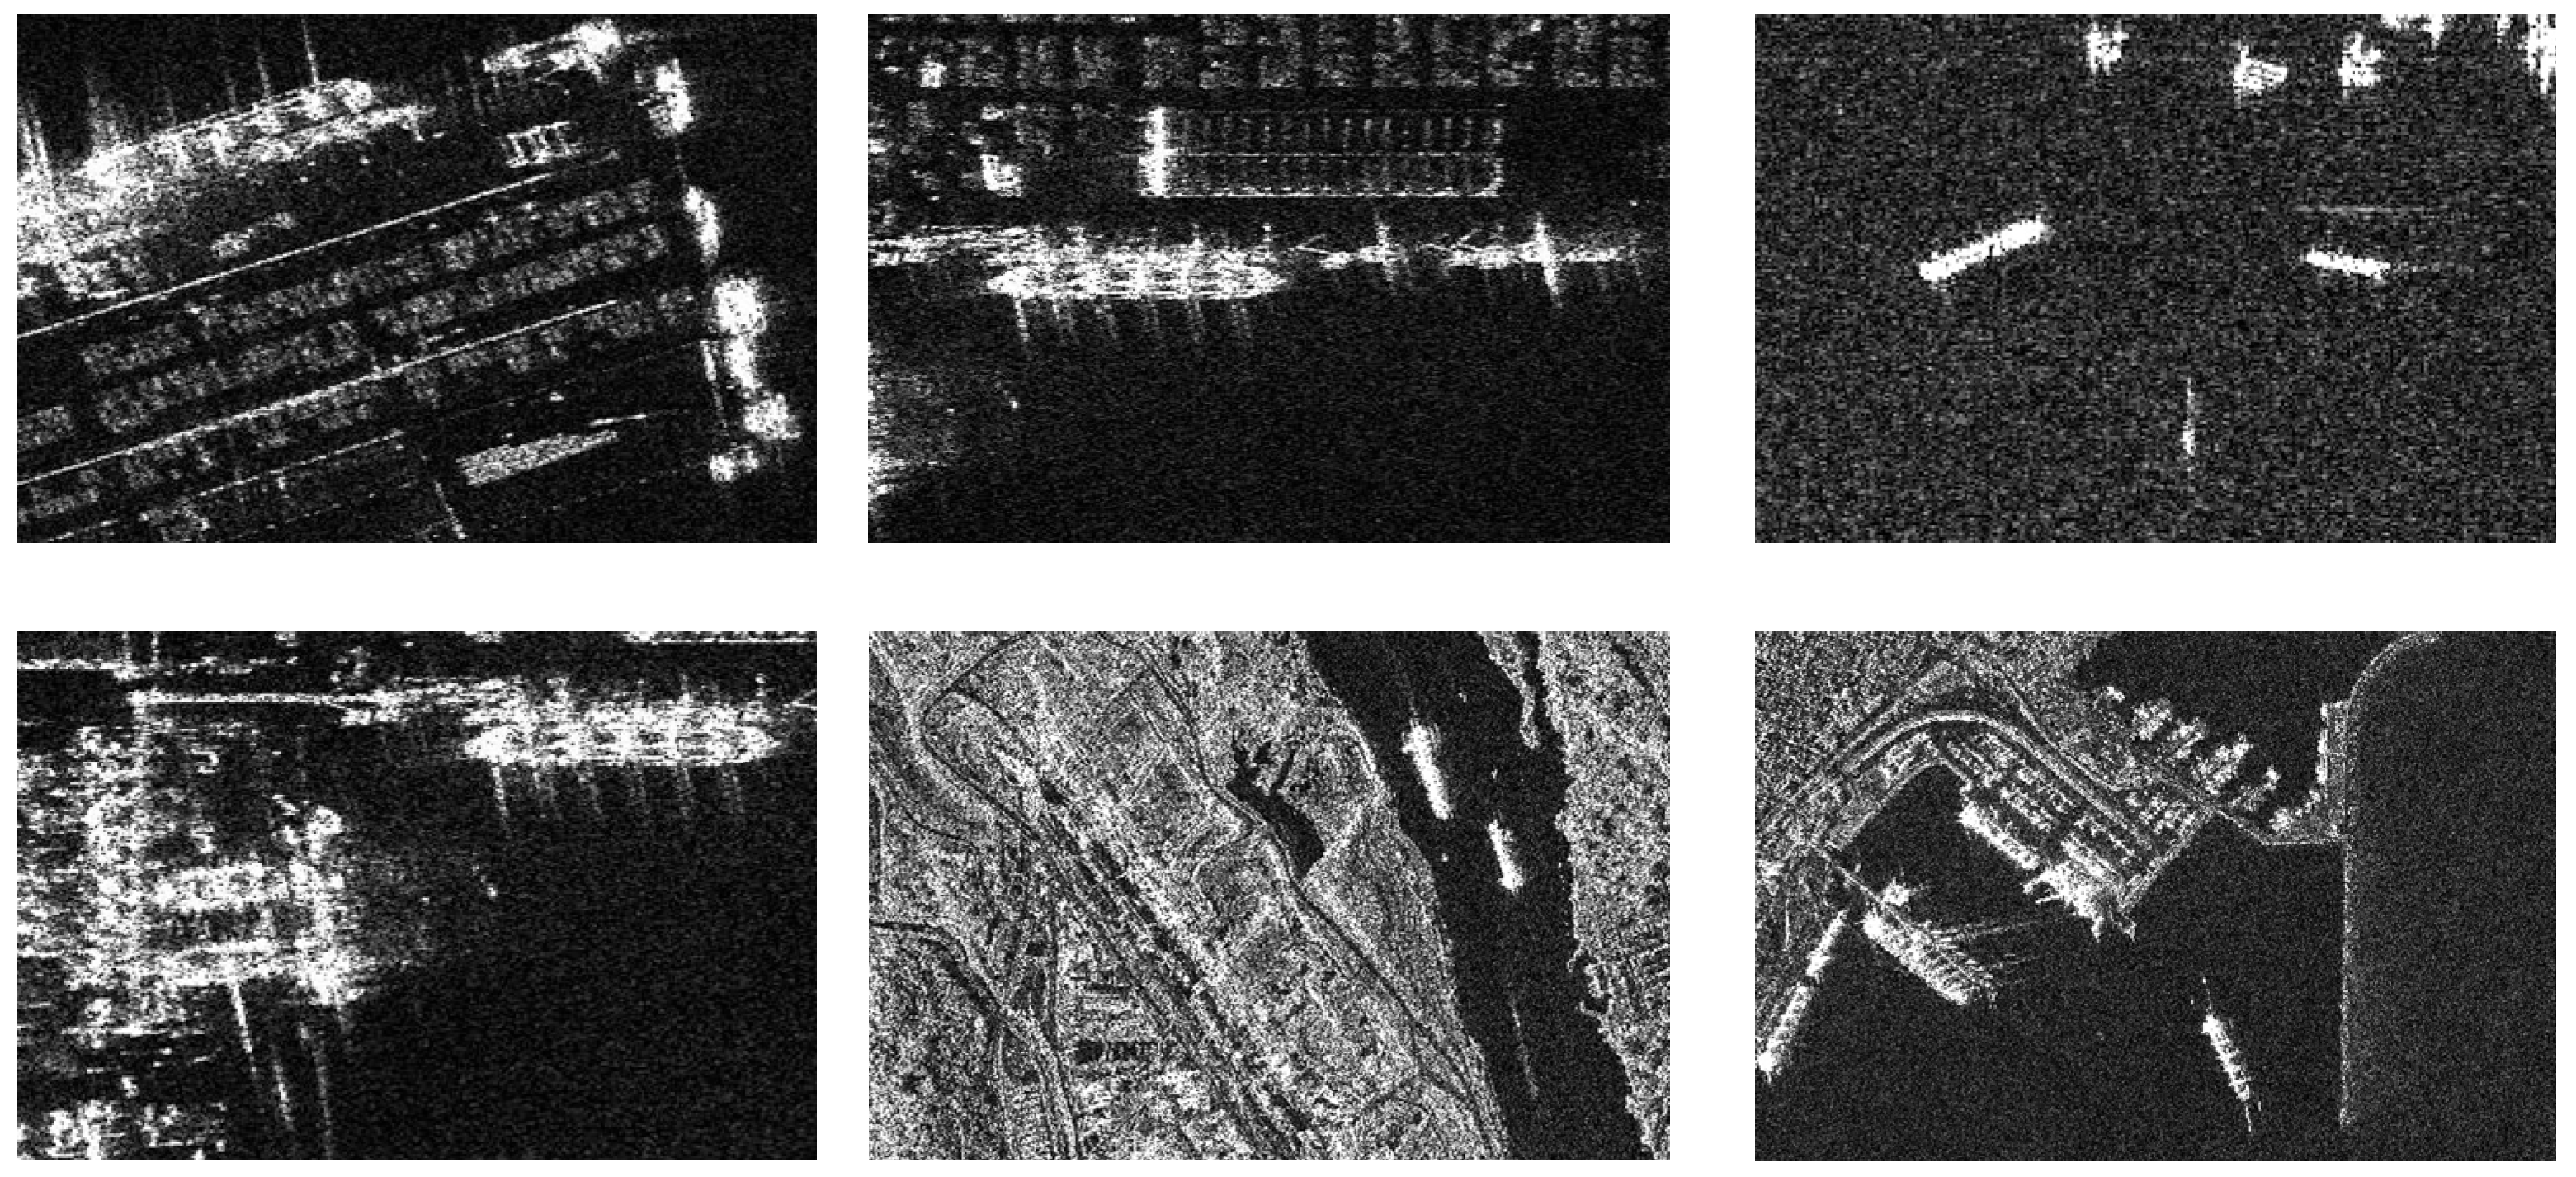
Synthetic Aperture Radar (SAR) exhibits all-weather monitoring capabilities, remaining unaffected by adverse weather conditions, time of day, or environmental factors [1,2,3,4]. Consequently, it has become an indispensable tool for accurate and timely ship detection [5,6,7]. However, SAR-based ship detection faces several inherent challenges. For instance, backscattering from the ocean surface, commonly known as sea clutter, often obscures the signatures of ship targets, significantly complicating their detection. Furthermore, in nearshore environments and other complex backgrounds (as depicted in Figure 1), the low contrast between ships and their surroundings renders accurate detection and recognition highly demanding. Collectively, these forms of interference degrade the performance of SAR ship detection systems, leading to missed detections and false alarms.
To date, numerous methods have been proposed for SAR ship detection. Initially, detection relied primarily on the manual interpretation of SAR imagery [8,9,10,11,12,13,14,15,16,17,18]. Because this approach was time-consuming and susceptible to subjective bias, the field transitioned toward automated machine learning techniques in the early 21st century. By training on extensive datasets, these models learned to identify the geometric features of ships, thereby improving both accuracy and efficiency. More recently, driven by the rapid development of artificial intelligence and SAR imaging technology, deep learning-based methods have emerged, demonstrating state-of-the-art performance on high-resolution SAR imagery. By leveraging high-level semantic features, these methods not only improve detection accuracy but also avoid the inherent complexities of traditional algorithms.
Deep learning-based object detection is generally classified into two main categories: two-stage and single-stage methods. The two-stage detection process, which divides the task into region proposal generation and object classification, includes models such as Faster R-CNN [19] and Mask R-CNN [20]. With the evolution of deep learning techniques, single-stage detectors were developed to integrate the entire pipeline into a single stage, represented by models such as YOLO [21,22,23], SSD [24], and RetinaNet [25]. Two-stage detection typically yields higher accuracy due to its capability to generate numerous candidate regions for detailed classification and localization. However, it incurs significant computational complexity. The processing of many region proposals requires substantial computational resources, such as high-performance GPUs, making two-stage methods less suitable for real-time applications or resource-constrained devices. In contrast, single-stage detection streamlines the process by predicting object categories and locations in a single forward pass. This provides faster detection speeds and reduced computational loads, making it more suitable for real-time tasks. Nevertheless, single-stage methods often compromise on detection accuracy, given their inability to generate a large number of proposals for fine-grained classification and localization.
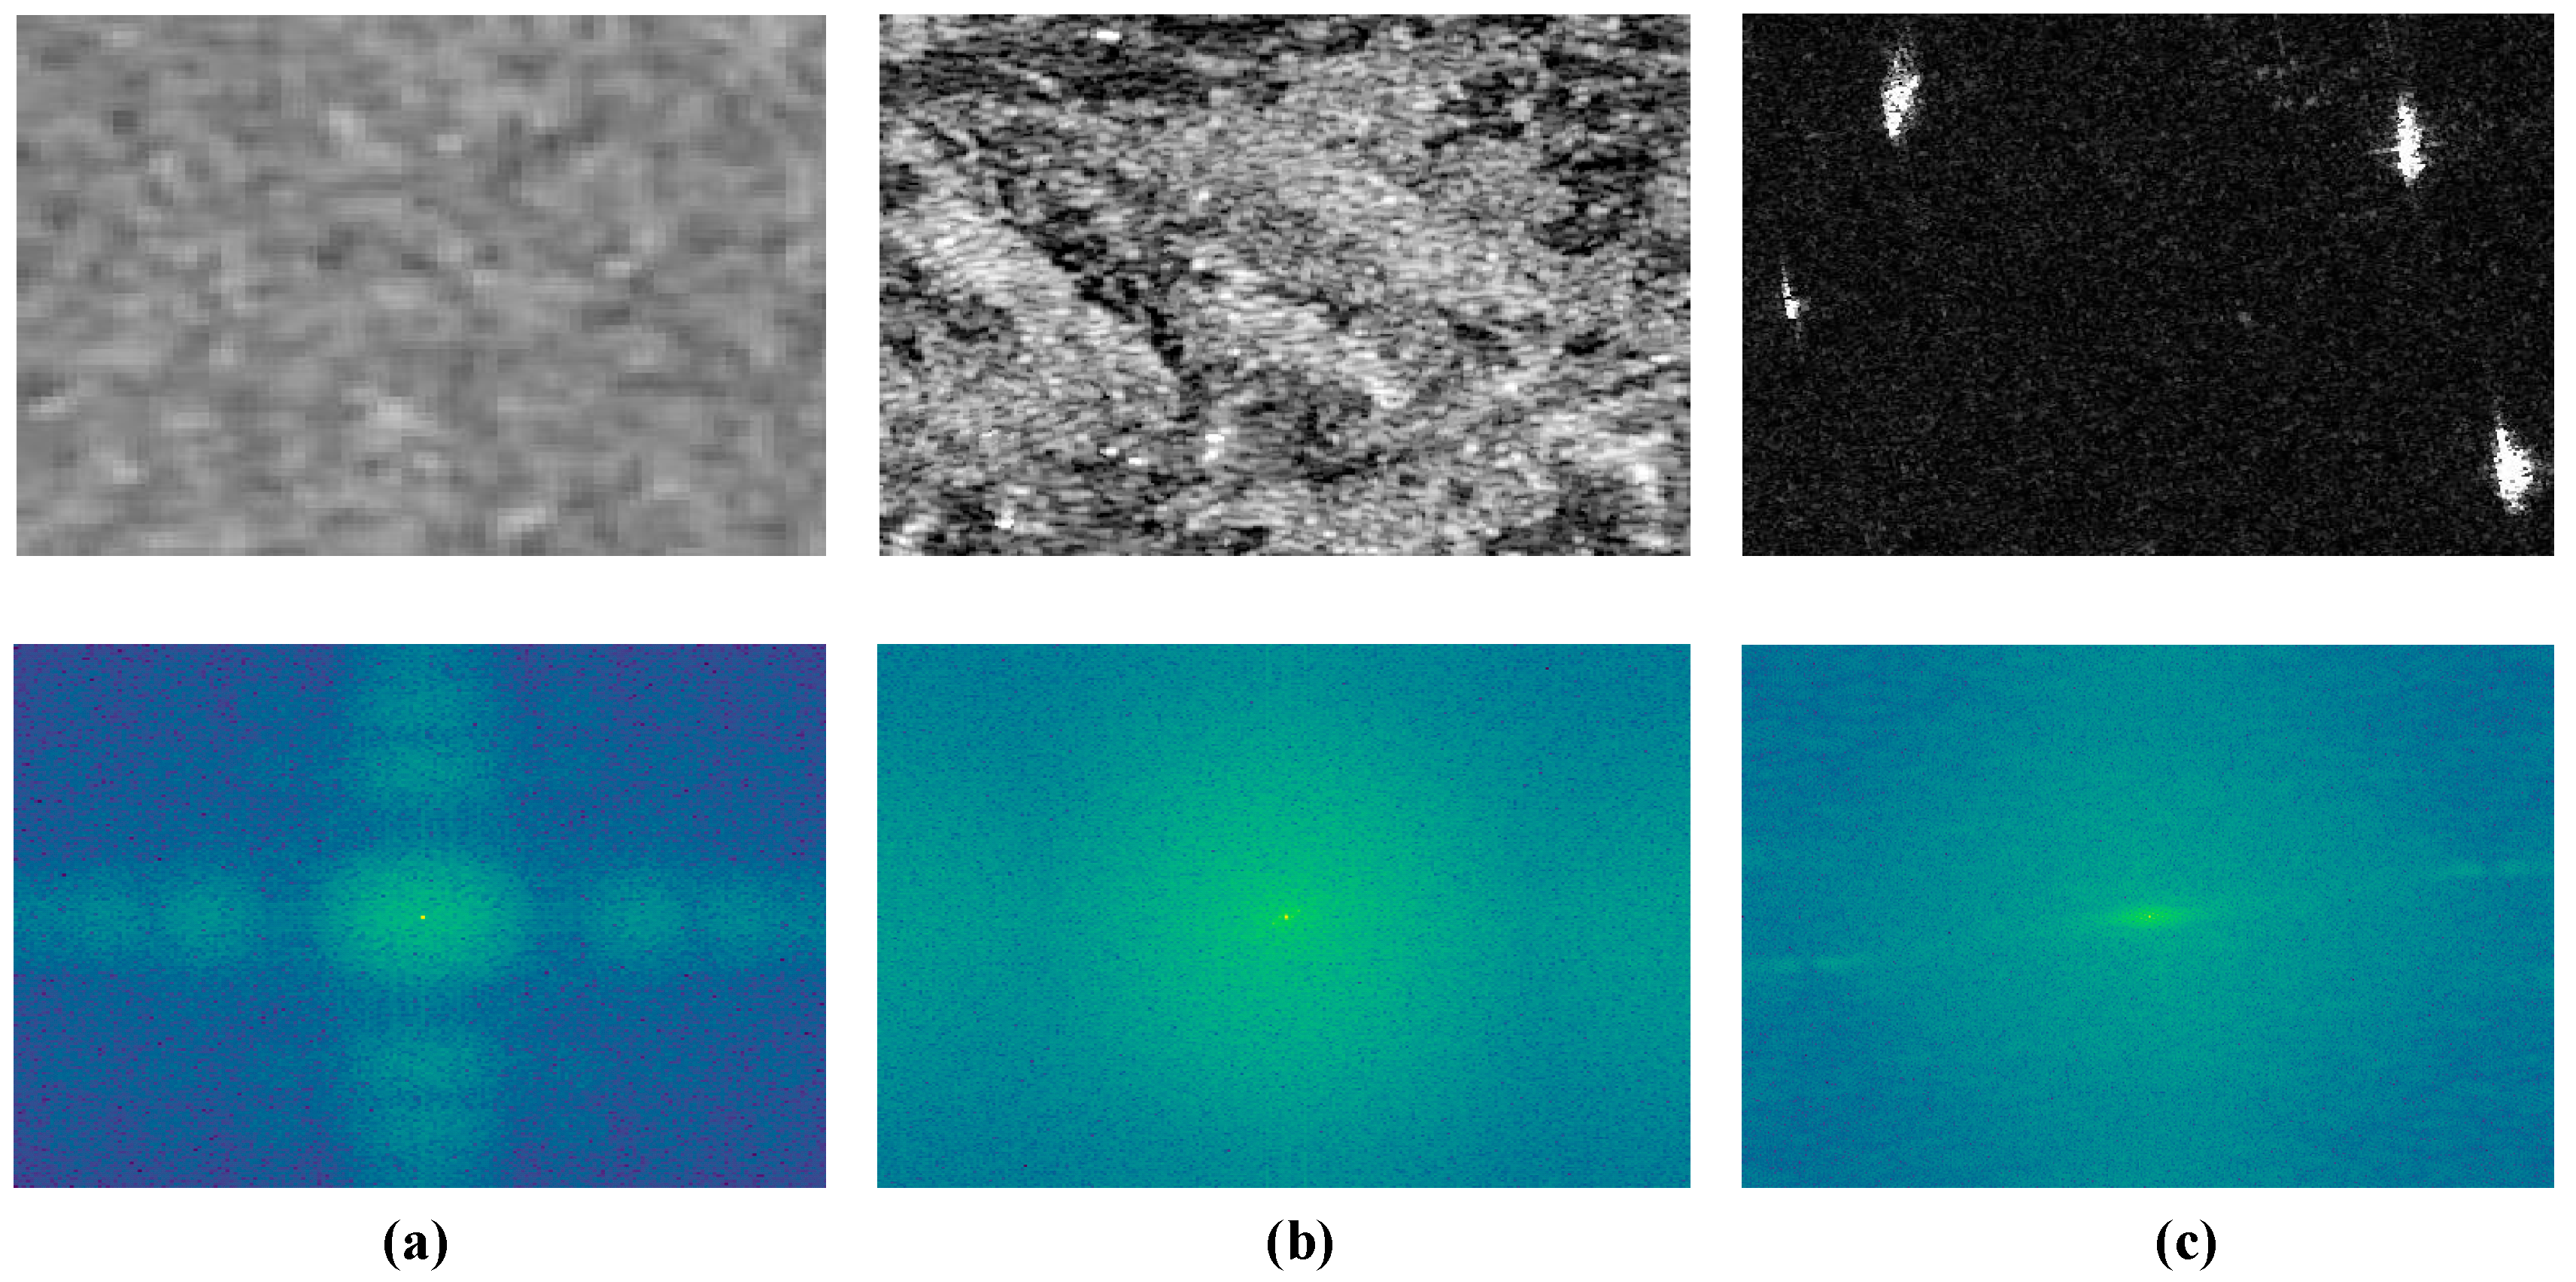
In the context of deep learning-based SAR ship detection, Qin et al. [26] introduced a novel semi-soft label-guided network based on self-distillation. This approach leverages adaptive weights of centroid deviation and aspect ratio differences to enhance detection performance. He et al. [27] proposed D3S-Net to improve dense SAR ship detection in complex nearshore scenarios by combining frequency-domain denoising, Mamba-based interference suppression, and IoU-aware localization. Wen et al. [28] further introduced YMCNet, which applies Mamba to range-compressed-domain SAR ship detection and enhances the modeling of long-range dependencies, ambiguous boundaries, and complex background interference. Furthermore, Zhang et al. [29] designed an Imbalance Discriminative Alignment (IDA) technique to improve the network’s discriminative power and prevent negative transfer, thereby boosting feature extraction capabilities in noisy conditions. While the aforementioned methods have achieved satisfactory results in certain scenarios, they face limitations that constrain their performance in complex marine environments. A substantial limitation is that most deep learning-based techniques solely utilize the spatial-domain information of SAR images, namely the target shape, texture, position, and scattering-intensity distribution directly represented in image pixels or CNN feature maps, while overlooking the complementary information contained in the frequency domain. In this study, frequency-domain features refer to the Fourier-domain representations of SAR images or intermediate feature maps, which describe the energy distribution and response characteristics of different frequency components. Such features can provide additional cues for distinguishing ship targets from sea clutter and nearshore interference. However, some studies have recognized the importance of incorporating frequency-domain information. For instance, Li et al. [30] employed a network that integrates frequency- and spatial-domain features, utilizing manually constructed rotation-invariant features to improve detection in complex rotational scenarios. In a separate study, Rao et al. [31] proposed the Global Filter Network (GFNet), which is capable of learning frequency-domain weights. Yet, these weights are static and cannot adapt dynamically to varying input images. Existing methods that utilize both spatial and frequency domains typically treat frequency attributes in a fixed manner. This static treatment results in the inadequate processing of frequency features, leading to false alarms, missed detections, and a general decline in performance. As shown in Figure 2, the Fourier amplitude spectra of different SAR images exhibit obvious variations, indicating that the frequency responses of ships, sea clutter, and nearshore interference are highly scene-dependent. Consequently, suppressing interference from nearshore constructions and sea clutter using fixed frequency bands or static frequency-domain filters is impractical. Therefore, rather than extracting predefined frequency components, adaptive frequency-domain feature extraction is essential for robust SAR ship detection. Therefore, rather than extracting fixed frequency values, the adaptive extraction of frequency-domain information is essential.
The above analysis indicates that existing SAR ship detection methods incorporating frequency-domain information still face two major bottlenecks. First, static frequency-domain filtering schemes apply the same frequency response to all inputs during inference and cannot adaptively adjust according to the spectral characteristics of each input image. As shown in Figure 2, the spectral distributions of different scenarios vary significantly, making it difficult for fixed frequency weights to simultaneously achieve clutter suppression and target enhancement under all conditions. Second, existing methods usually process frequency-domain and spatial-domain features independently in separate branches and then simply concatenate them, thereby neglecting the intrinsic relationship between spatial structures, such as ship edges, and their spectral representations.
To address these issues, this paper proposes AFN-YOLO, an adjustable frequency-domain feature fusion network for SAR ship detection under complex sea conditions. Its core module, C2f_FF, introduces a learnable weight tensor after the Fourier transform. Through end-to-end training and joint optimization with the detection objective, this tensor performs element-wise multiplication with the spectrum of each input image during inference, allowing the frequency response to vary dynamically with the input spectral characteristics. For example, it can automatically attenuate interference frequencies in strong clutter environments while largely preserving the original spectral information under weak clutter conditions, which fundamentally distinguishes it from static filters that impose fixed attenuation.
Specifically, C2f_FF, namely the C2f module with Frequency Fusion, transforms input feature maps into the frequency domain through the Fourier transform, adaptively enhances informative frequency components, and then fuses the processed frequency-domain representation with spatial features for subsequent detection. On this basis, the C2R module enriches spatial feature learning through multi-gradient-flow residual branches, while TAS-FPN enhances multi-scale target discrimination through cross-dimensional interactions based on triplet attention. Experimental results on the SSDD and HRSID demonstrate that AFN-YOLO achieves improved detection performance on the evaluation benchmarks, showing its potential for further development toward practical maritime monitoring applications. The primary contributions of this paper are summarized as follows:
  • We propose a novel SAR ship detection network that integrates tunable frequency features with spatial features, effectively addressing challenges such as sea clutter, wind–wave disturbances, and nearshore interference. Unlike static frequency filters that apply fixed weights regardless of input, our learnable frequency parameters enable instance-level spectral adaptation optimized end-to-end with the detection objective.
  • We design the TAS-FPN module to address the multi-scale nature of SAR ship targets. This module effectively tackles scale variations by integrating multi-scale features and leveraging the Triplet attention mechanism to enhance the discrimination between ship targets and background clutter. Unlike standard FPNs that treat spatial and channel dimensions independently, TAS-FPN employs cross-dimensional Triplet Attention to jointly model “what” (channel) and “where” (spatial) at each pyramid scale.
  • We demonstrate the competitive performance of AFN-YOLO on the SSDD [32] and HRSID [33] datasets. The experimental results underscore its high detection accuracy and robustness in complex marine scenarios. Compared to the baseline YOLOv8, AFN-YOLO achieves consistent improvements on both SSDD and HRSID, with the most pronounced gains observed in high-clutter nearshore scenarios.
The remainder of this paper is organized as follows: Section 2 describes the proposed SAR ship detection methodology; Section 3 presents the experiments and the corresponding results analysis; and Section 4 concludes the paper, outlining potential future research directions.

2. Methodology

2.1. Processing Flow of AFN-YOLO

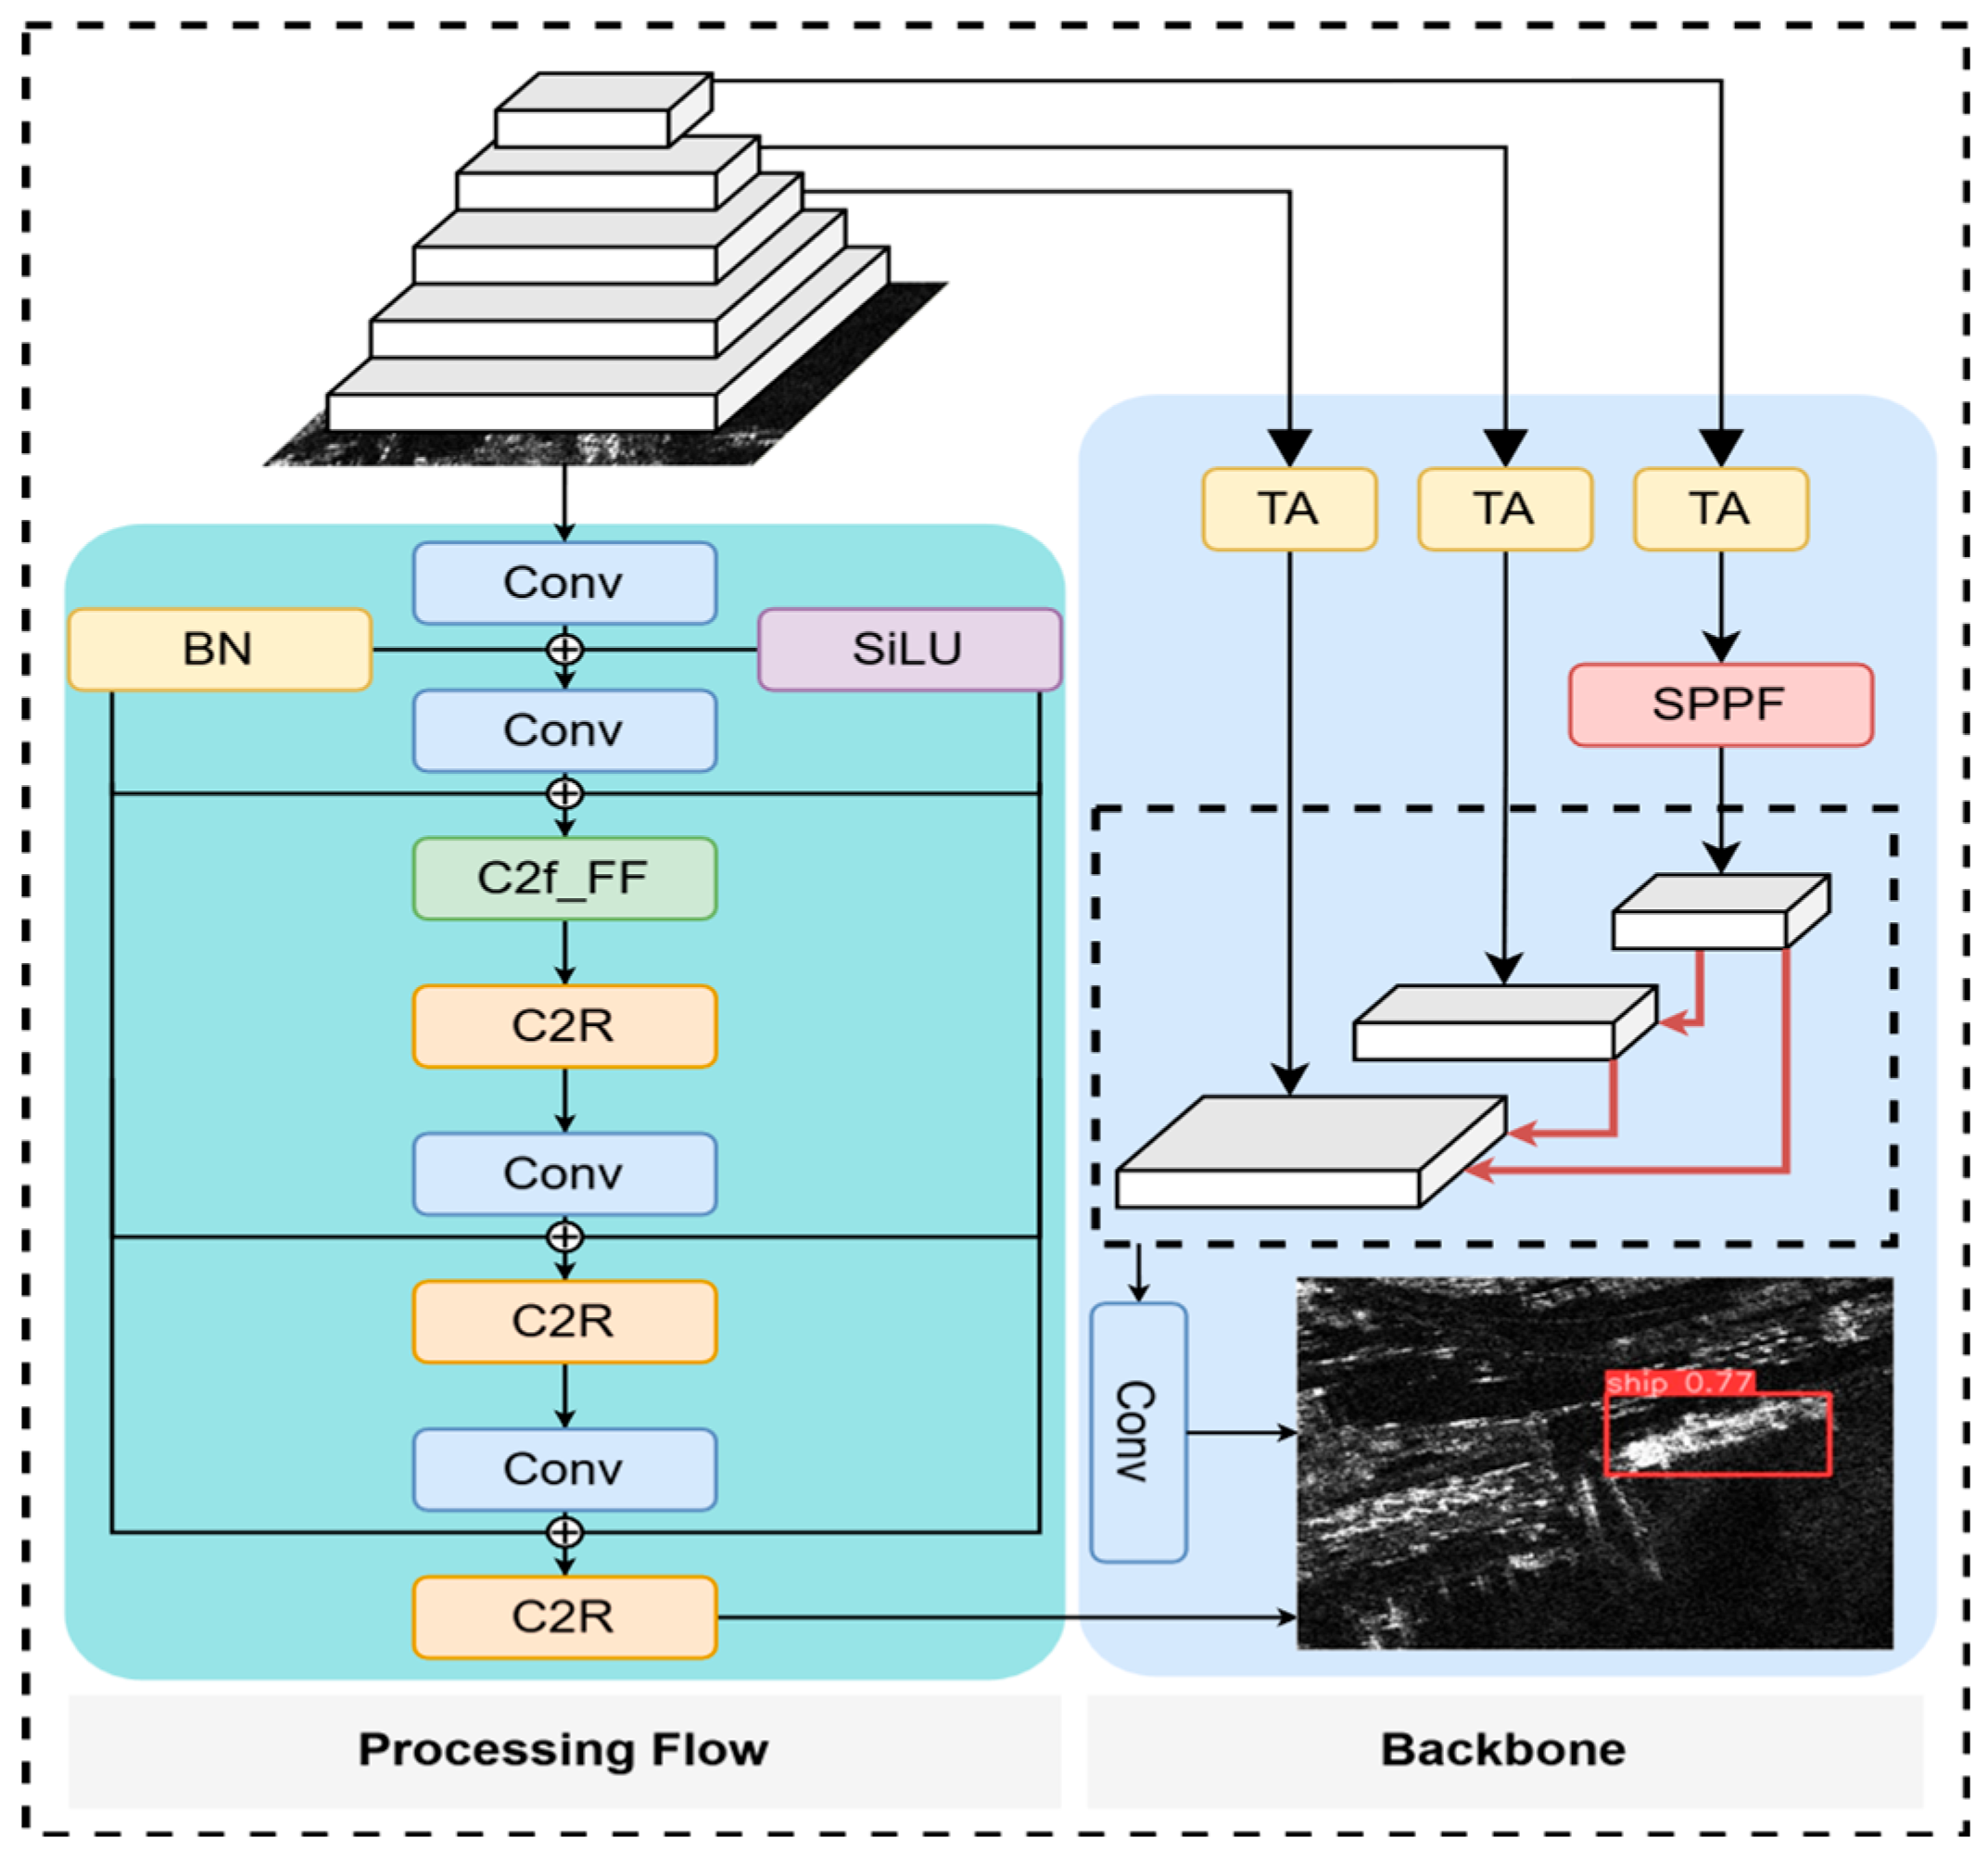
In this study, we aim to enhance the detection capability for SAR ship targets in complex maritime environments. To this end, we developed the AFN-YOLO algorithm, which is optimized specifically for complex scenarios. The proposed algorithm effectively suppresses environmental interference, such as sea clutter and nearshore backgrounds. Additionally, it addresses the multi-scale nature of SAR ship targets, ensuring consistent detection performance. The overall workflow of the proposed algorithm is illustrated in Figure 3. Initially, the input SAR images are processed through a feature extraction network consisting of C2f_FF and C2R blocks. Subsequently, the features extracted from different layers are fed into our proposed TAS-FPN for feature fusion. Finally, the fused features are passed to the detection head to generate the final detection results. In the following subsections, we describe the implementation details of each component.

2.2. Feature Extraction Network

For feature extraction, our methodology primarily employs the C2f_FF and C2R modules. Specifically, the C2f_FF module extracts tunable frequency-domain features and subsequently integrates them with spatial-domain information. Furthermore, the C2R module, utilizing its multi-gradient stream branches, ensures robust performance during spatial feature extraction. Figure 4 illustrates the overall workflow of the feature extraction network within the AFN-YOLO framework. Detailed descriptions of the C2f_FF and C2R modules are provided in Section 2.2.1 and Section 2.2.2, respectively.

2.2.1. C2f_FF Module

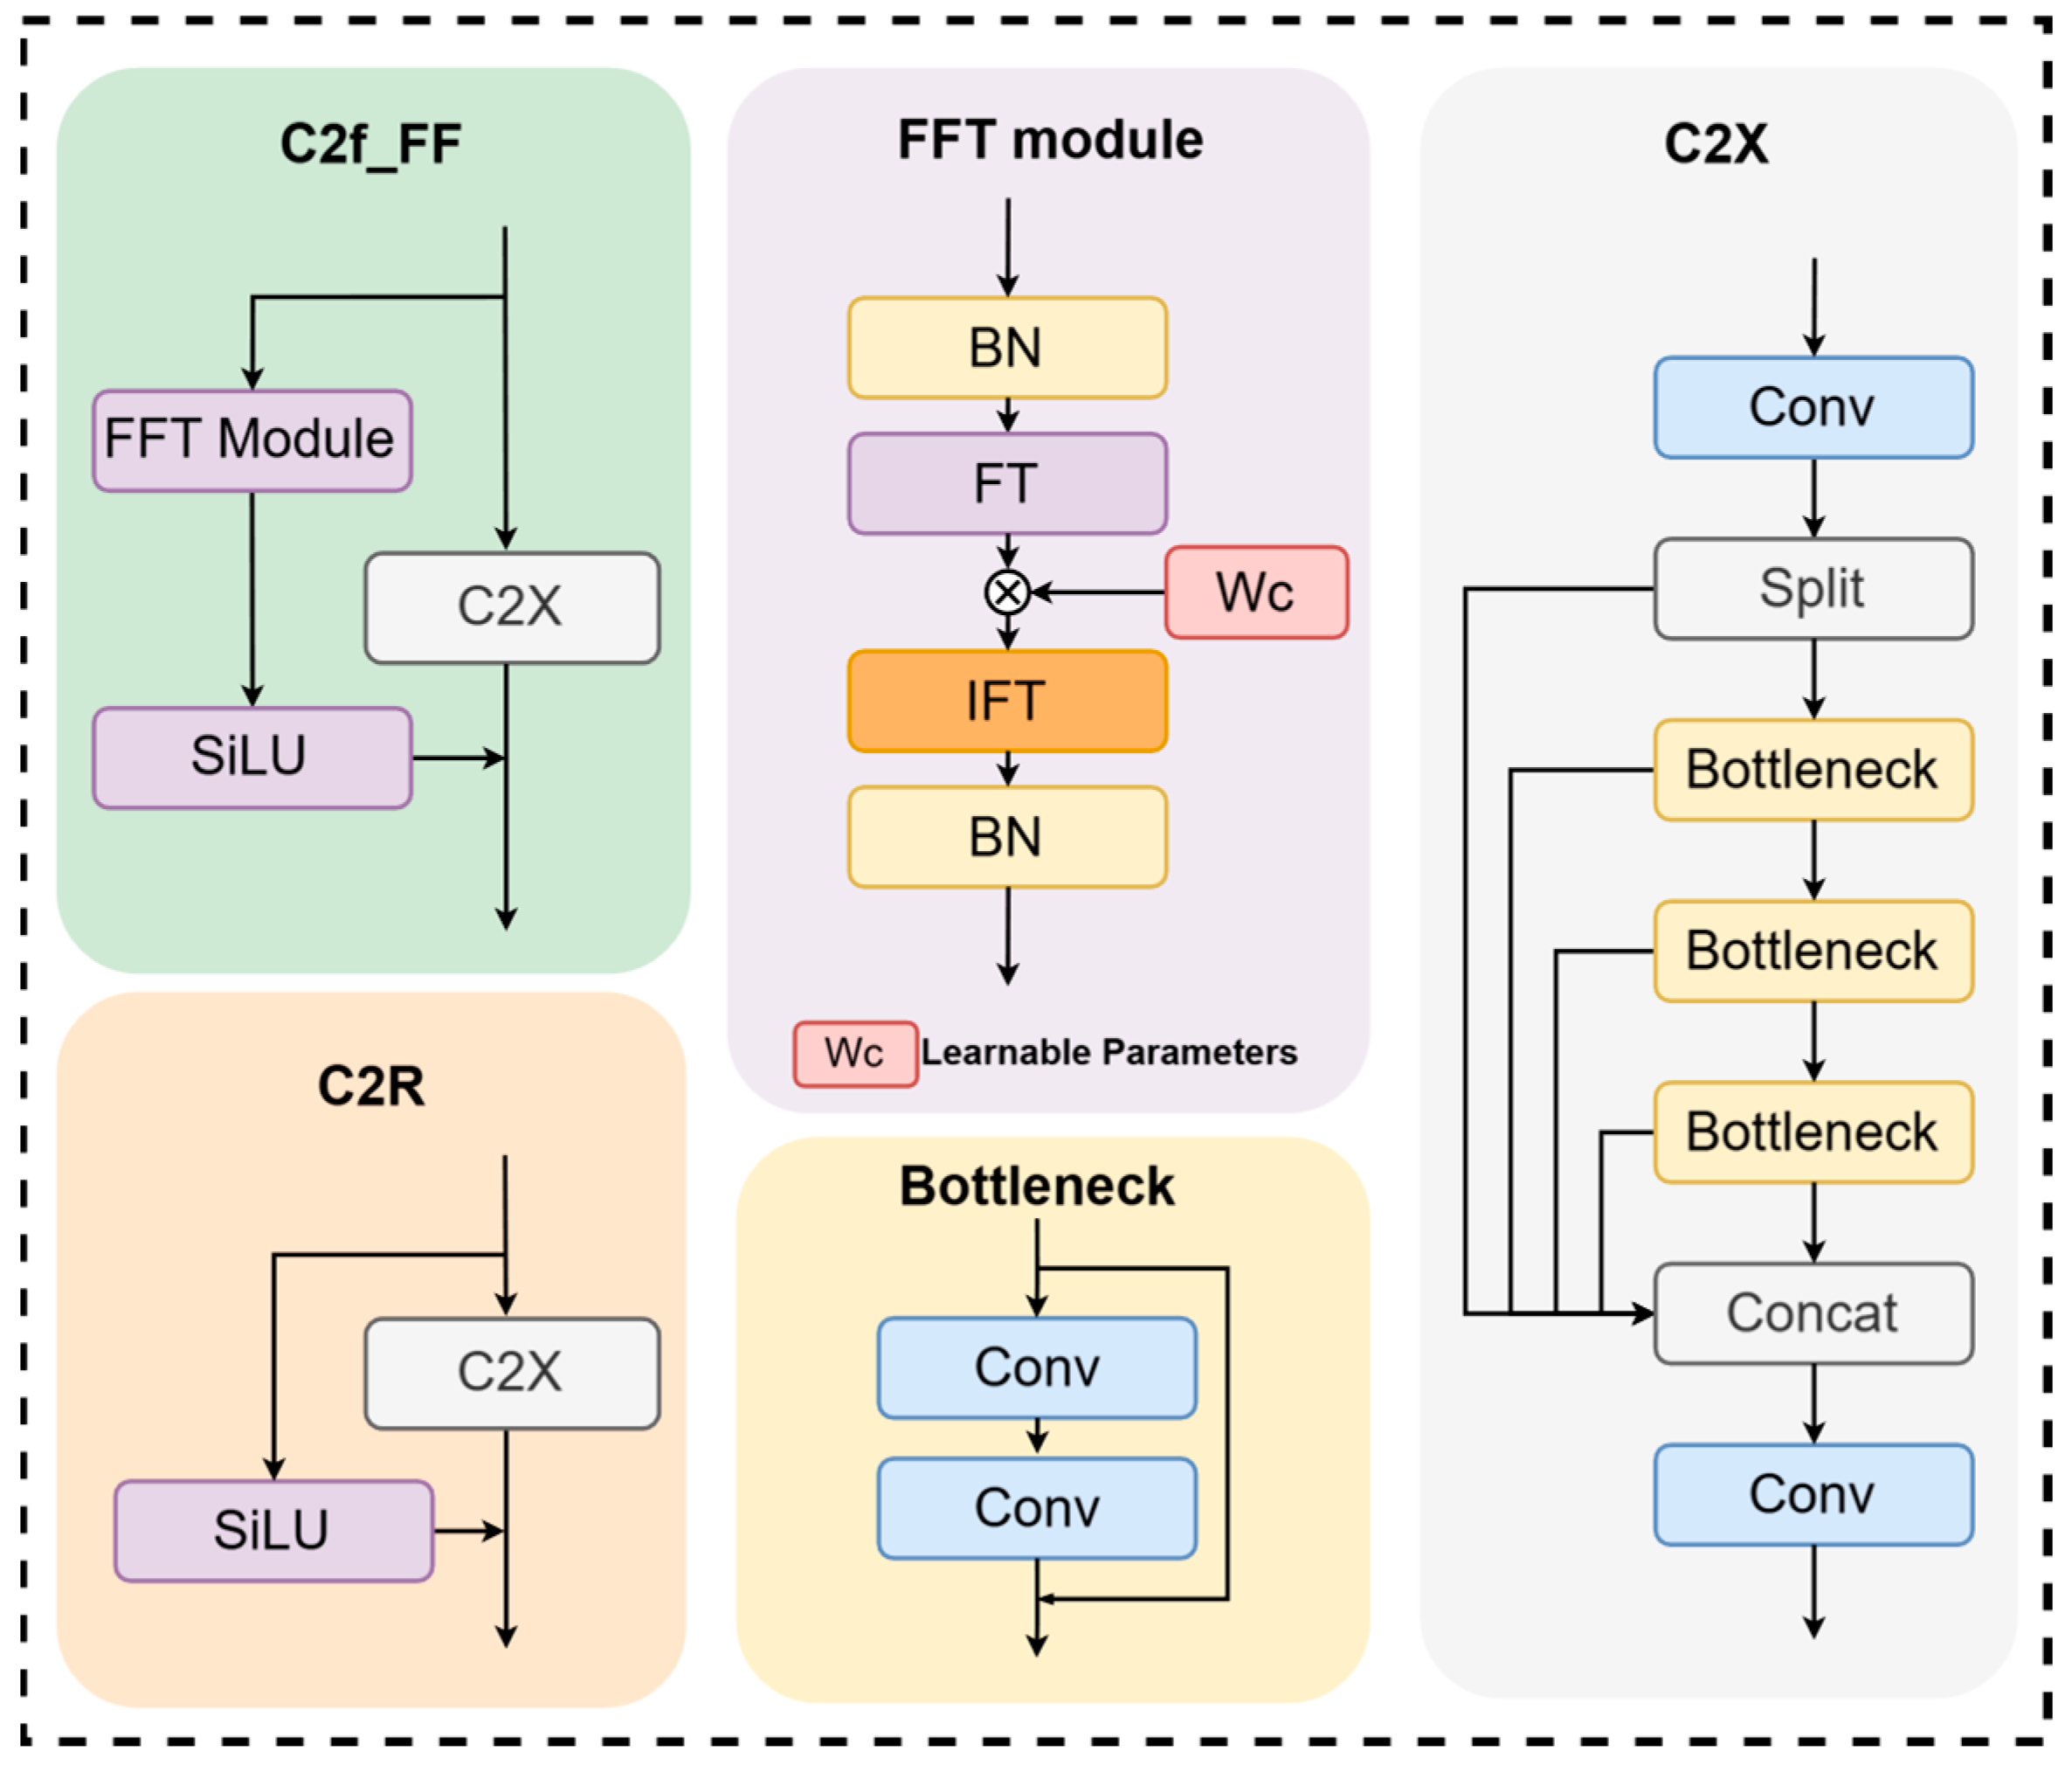
Figure 5 illustrates the detailed architecture of the C2f_FF module. For SAR images fed into the C2f_FF module, a portion is channeled through the FFT_Module to extract frequency-domain features. Within the FFT_Module, the FT (Fourier Transform) module is initially employed to conduct a Fourier transformation, thereby obtaining the frequency-domain characteristics of the image. The Fourier transformation [34,35,36,37] is represented by:
F ( u , v ) = x = 0 H 1 y = 0 W 1 I ( x , y ) e j 2 π ( u x / H + v y / W )
where I ( x , y ) denotes the input SAR image, H and W denote the height and width of the input image, respectively. x and y specify the pixel positions within the input image. F ( u , v ) denotes the frequency-domain feature map derived from the SAR image after the Fourier transformation, and u , v represent pixel positions within this frequency-domain feature map.
After the Fourier transform, a learnable weight tensor α is introduced, with a dimension of C × H × ( W 2 + 1 ) , where C denotes the number of channels, and H and W denote the spatial dimensions. The term W / 2 + 1 accounts for the conjugate symmetry of the FFT for real-valued inputs. This tensor is initialized to all ones, i.e., α = 1 , allowing frequency-domain information to pass through unchanged at the beginning of training and ensuring that C2f_FF initially behaves equivalently to a standard spatial-domain convolution. For the complex-valued frequency-domain feature map F ( u , v ) C × H × ( W 2 + 1 ) obtained by FFT, adaptive frequency adjustment is achieved through element-wise modulation:
F ˜ ( u , v ) = α ( u , v ) F ( u , v )
where F ˜ ( u , v ) represents the frequency-domain feature after learnable weight modulation, and α ( u , v ) denotes the learnable weight coefficient. Since F ( u , v ) is complex-valued, α acts on both the real and imaginary parts, which is equivalent to scaling the magnitude spectrum while preserving the phase: | F ˜ ( u , v ) | = α ( u , v ) | F ( u , v ) | , F ˜ ( u , v ) = F ( u , v ) . The learnable tensor α is jointly optimized with all other network parameters using the same SGD optimizer, and its gradient is given by L α = L F ˜ F . This equation indicates that the update of α ( u , v ) is proportional to the product of the loss gradient at the corresponding frequency and the magnitude of the current spectral component. Therefore, frequency components that are highly correlated with detection errors receive larger weight adjustments, naturally guiding the network to suppress clutter-related frequencies and enhance target-related frequencies. The L2 weight decay encourages α to remain close to 1, preventing excessive frequency suppression that may lead to the loss of useful information. Empirical observations show that α converges to a stable distribution after approximately 150–200 epochs: mid- and low-frequency components are assigned higher weights to preserve structural features of ships, while high-frequency components receive lower weights to attenuate speckle noise and fragmented sea clutter.
After incorporating the learnable frequency-domain information, the frequency-domain features are transformed back to the spatial domain using the IFT (Inverse Fourier Transform) block [38]. This process yields the filtered SAR image. The functionality of the IFT module is described by:
I ˜ s p a t i a l ( x , y ) = 1 H W u = 0 H 1 v = 0 W 1 F ˜ ( u , v ) e j 2 π ( u x / H + v y / W )
where I ˜ s p a t i a l ( x , y ) denotes the spatial-domain features augmented with learnable parameters following the inverse Fourier transformation.
The core advantage of this adaptive frequency adjustment mechanism lies in its input-dependent nature. Although α is fixed during inference, its element-wise multiplication with the spectrum of each input image allows the final filtering effect to vary dynamically according to the spectral characteristics of the input. Specifically, the high-frequency components of images with strong clutter are significantly attenuated, whereas images with weak clutter can pass through almost unaffected. This capability cannot be achieved by static frequency filters.
Through the IFT module, the frequency-domain representations are converted back into spatial-domain features. These are subsequently activated via the SiLU [39] activation function. Following this activation, these attributes are integrated with other spatial features. The resulting merged features represent the output of the C2f_FF module. Within this context, compared to the conventional ReLU activation function, the utilization of the SiLU activation function achieves a richer gradient distribution. During the backpropagation process, this facilitates the transmission of more detailed gradient information, ensuring a smoother training trajectory. The formula for SiLU is as follows:
SiLU ( x ) = x σ ( x )
σ x = 1 1 + e x
where σ ( x ) is the standard sigmoid function. After activation by the SiLU function, the output of the C2f_FF module is obtained by adding the original spatial features to the transformed features:
X o u t = I ˜ s p a t i a l + Conv ( X i n )
This transformation to spatial-domain features is then combined with the features initially extracted from the spatial domain.

2.2.2. C2R Module

To further refine feature extraction and enhance the performance of the model, we introduce the C2R module, as depicted in Figure 5.
Equipped with multi-gradient flow branches, the C2R module aims to enhance the network’s representational capacity while circumventing issues related to gradient vanishing or explosion. By fusing raw features with residual information, the C2R module ensures that critical information is neither overlooked nor diluted during feature propagation. This design effectively preserves structural details and elevates detection accuracy. C2R explicitly creates multiple parallel gradient branches with diverse transformation paths. This design is motivated by the observation that SAR ship targets exhibit heterogeneous appearance characteristics—some are better characterized by edge features, others by texture or intensity patterns—and thus benefit from multi-path feature extraction. The parallel branches learn complementary representations that are fused via concatenation and a 1 × 1 convolution.

2.3. The Architecture of the TAS-FPN Model

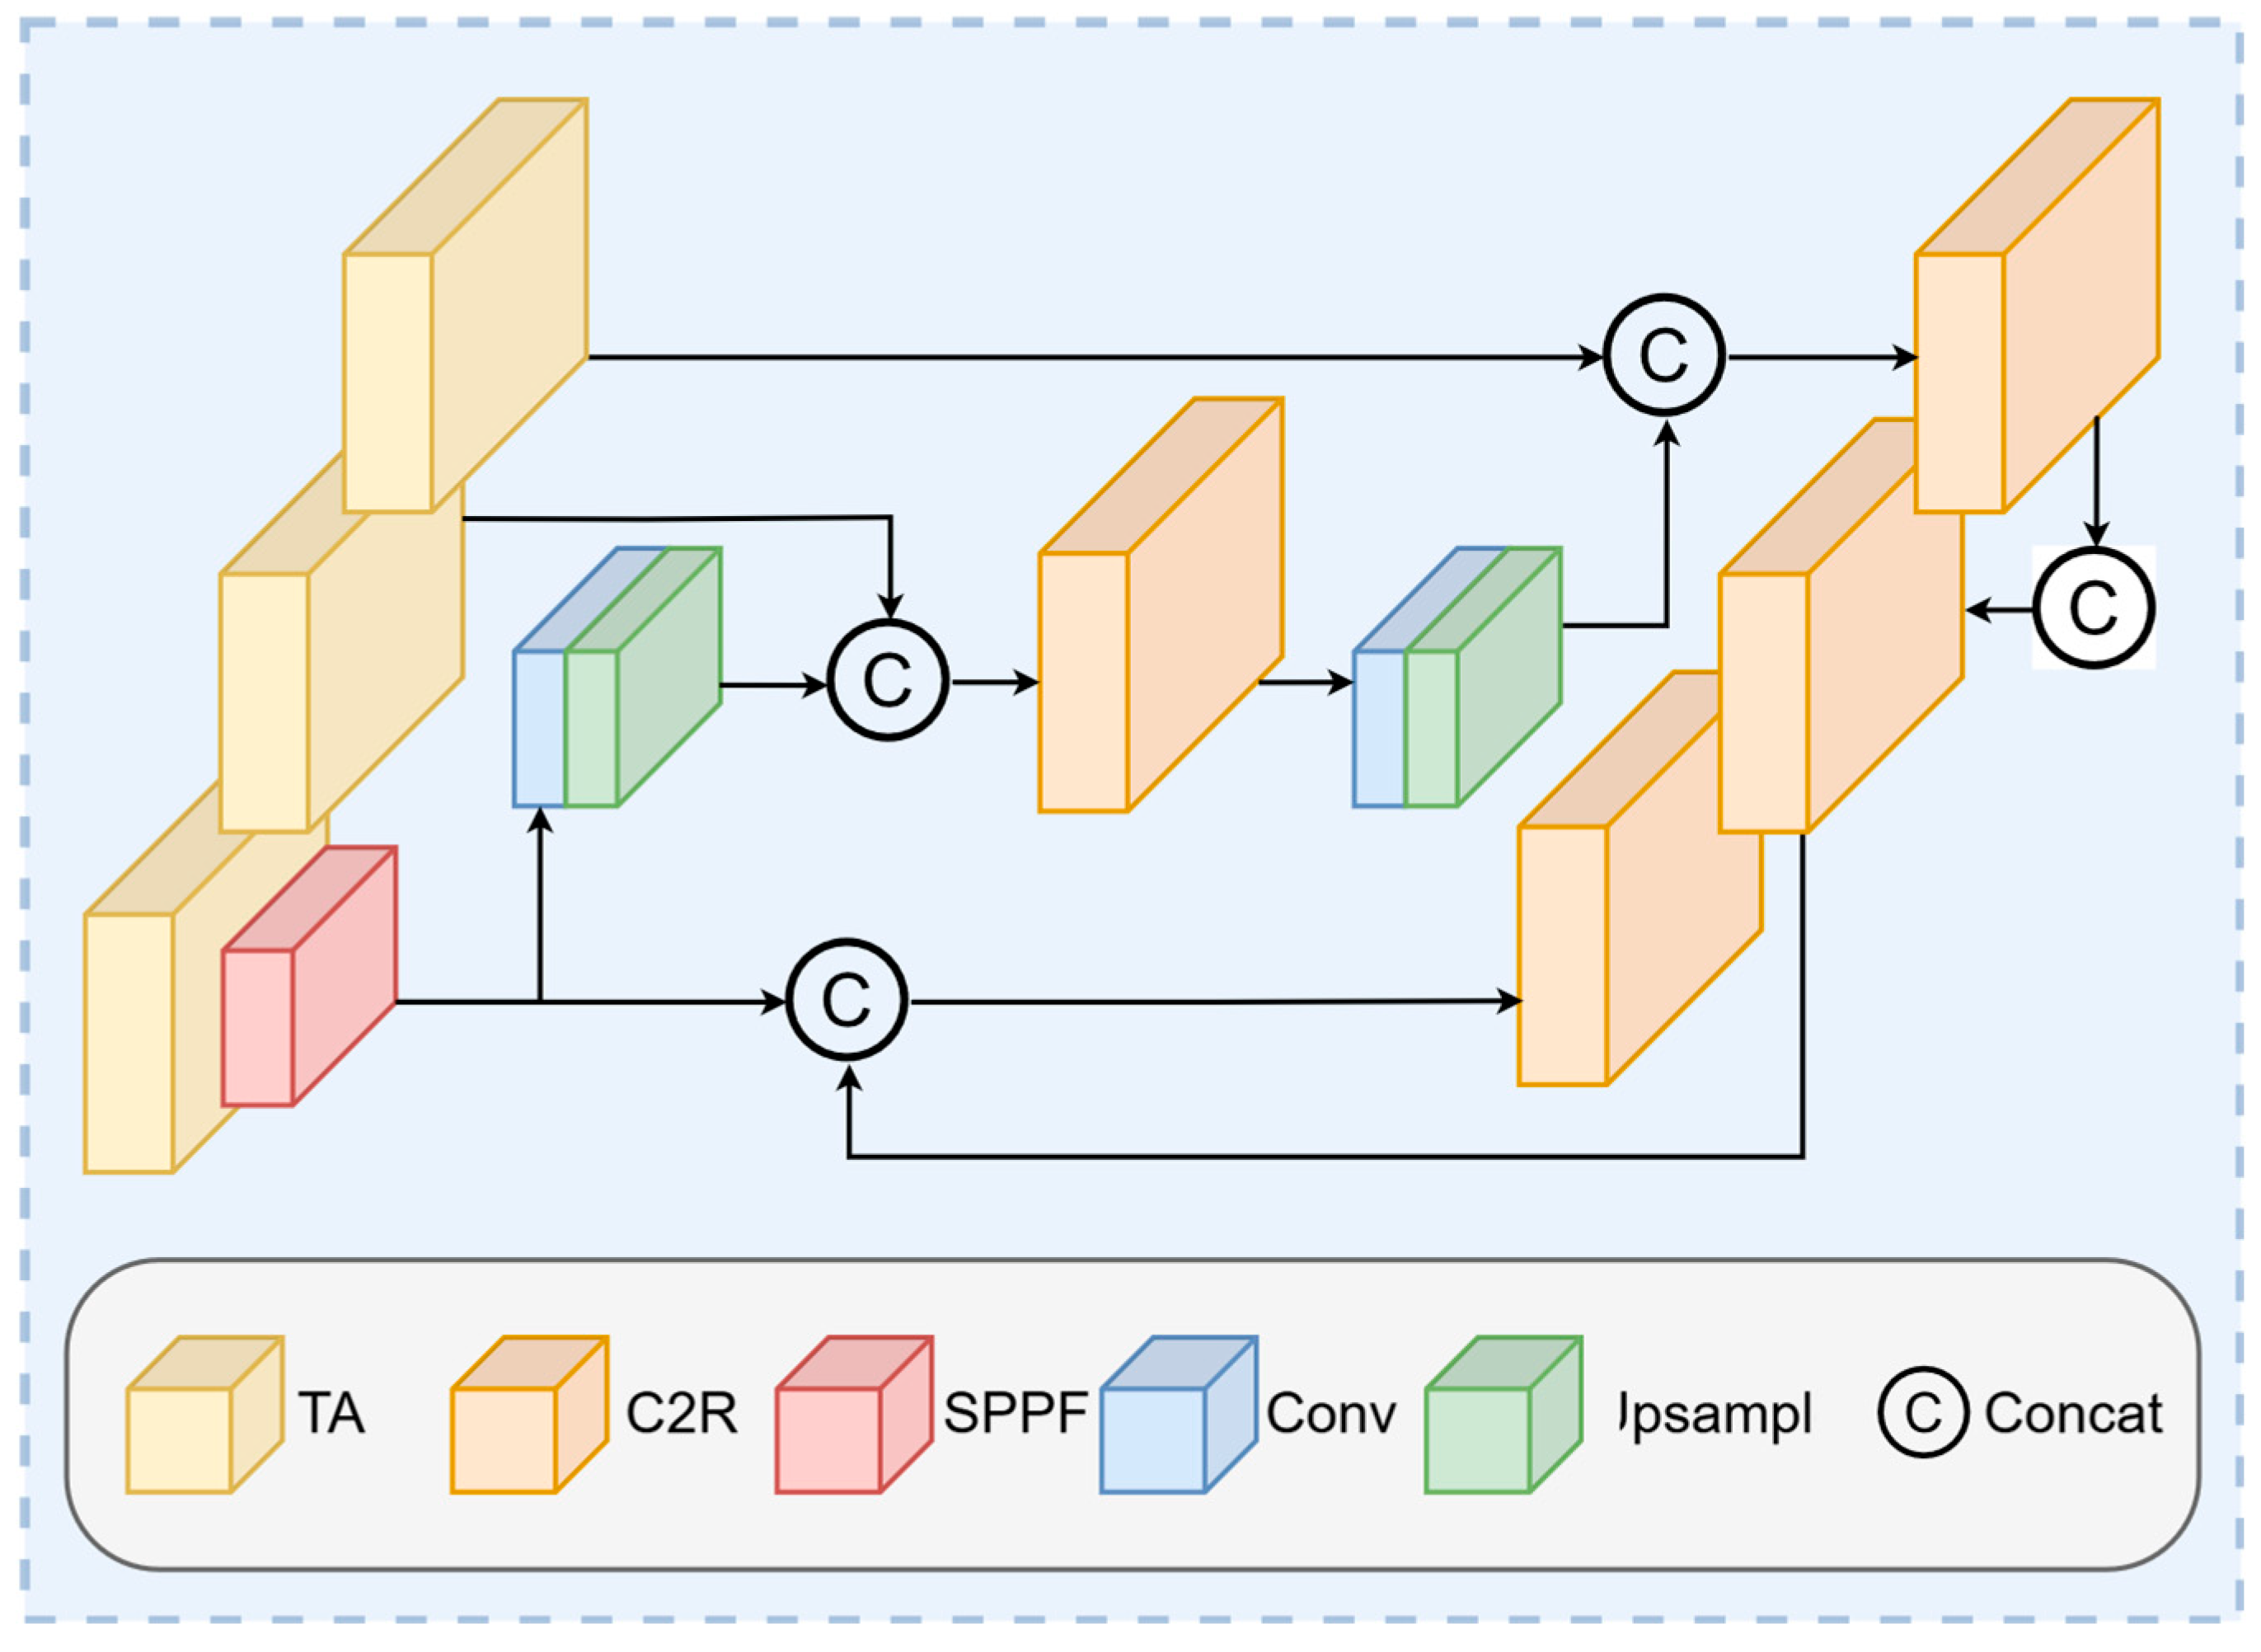
In the specialized field of SAR ship detection, the complex marine environments pose significant challenges. SAR-detected ships, when situated within these complex backgrounds, inherently exhibit significant scale and orientation variations. Further complicating matters are the background disturbances, including sea clutter and obstructions from other vessels. Given this scenario, there arises an essential requirement for a model that can proficiently extract features spanning various scales, while simultaneously mitigating the interference from complex marine backgrounds on SAR ship observations. Within the paradigm of convolutional neural networks, features from deeper layers, credited to their extensive receptive fields, inherently encompass a richer semantic depth. In contrast, shallow features, despite their restricted receptive field, excel in capturing the elementary structure of images and emphasizing texture boundaries. The Feature Pyramid Network (FPN) has demonstrated its efficacy by effectively fusing features across different scales, thereby bolstering detection accuracy and enhancing robustness. Nevertheless, a particular challenge emerges in the realm of SAR ship detection. Compared to conventional optical imagery, ships in SAR settings display a more pronounced variance in their scales. This variance, combined with the dynamic sea conditions, poses significant interference, often rendering traditional FPNs inadequate for effective SAR ship target detection. Addressing this gap, we have designed the TAS-FPN module, specifically engineered to navigate the challenges of SAR ship detection amidst the complex backgrounds. The detailed architecture of TAS-FPN is illustrated in Figure 6.
In our approach, features from stages 3 to 5 serve as inputs to the TAS-FPN. Notably, within stage 5, we incorporate the SPPF module, which preserves rich semantic information. This inclusion not only mitigates the risk of overfitting but also enhances the stability during gradient descent. Furthermore, we have integrated the Triplet Attention module into our architecture. Triplet Attention [40] is an effective attention mechanism designed to capture multi-scale information within deep neural networks. While traditional attention mechanisms predominantly focus on either the spatial or channel dimensions of feature maps, Triplet Attention computes attention weights across rows, columns, and channels. This holistic approach facilitates a more comprehensive capture of contextual information. Moreover, by synergizing information from these three dimensions, the Triplet Attention amplifies the expressive power of the network. This, in turn, suppresses environmental noise and bolsters the model’s capability in detecting smaller targets, a crucial aspect in SAR ship target detection.

2.4. Loss Function

Similar to other single-stage object detection networks, AFN-YOLO employs a multi-task loss. The loss function is defined as:
L   = α 1 L c l s + α 2 L r e g
where L c l s denotes the classification loss, and L r e g represents the bounding box regression loss. α 1 and α 2 are the respective weight coefficients, modulating the importance of these two types of losses within the overall loss function.
For the classification loss, we employ Focal Loss [41,42]. In SAR ship target detection, the majority of samples are negative, leading to a pronounced imbalance between positive and negative samples. The Focal Loss, by introducing modulating factors, shifts the model’s attention from easily classified negative samples towards the challenging positive samples or those negative samples that are prone to be overlooked. This strategy effectively addresses the issue of class imbalance, reducing false positives and enhancing detection accuracy. The formulation for the classification loss is defined as:
L c l s =   α t 1 p t γ log p t
where p t denotes the model’s probability prediction for the genuine class of the current sample. Specifically, p t represents the predicted probability for the target class. γ serves as a modulation factor, diminishing the contribution to the loss from easily classified samples. α t acts as a weighting coefficient. This can either be a constant or associated with individual sample values. Its purpose lies in balancing the weight of positive and negative samples within the loss. The regression loss component consists of GIoU [43] Loss and DFL Loss. In the realm of object detection, the IoU (Intersection over Union) metric is widely used employed. However, its limitations arise as it solely emphasizes the intersection and union between predicted and actual bounding boxes, neglecting the spatial relationship and size disparities between them. This often results in a marked degradation in detection performance when multiple minor targets congregate. Given that SAR ship detection samples frequently exhibit overlaps of smaller vessels, to address this challenge, we adopt the GIoU loss function in our work. It not only considers the intersection and union between the predicted and ground-truth boxes but also contemplates their relative positioning and size dynamics. This proves particularly effective when handling overlapping minor ship targets. The calculation formula for GIoU is as follows:
L G I o U   =   I o U     C U C
I o U = I U
where I and U respectively represent the intersection and union of the predicted and ground-truth bounding boxes, while C denotes the area of the smallest enclosing rectangle encompassing both the predicted and actual boxes.
Furthermore, we incorporate DFL (Discrete Feature Learning) Loss. DFL Loss diverges from conventional regression losses. Traditional regression losses often result in numerous predicted boxes that exhibit significant overlap. In contrast, DFL Loss, with its discrete regression mechanism, is effective in distinguishing targets that are in close proximity or overlapping. This capability is crucial for SAR ship detection, given the prevalence of dense scenes.
The DFL Loss is formulated as:
L D F L   =   i   ω l log p t l ω r log p t r
where p t l and p t r respectively denote the distribution probabilities to the left and right of the target distribution p predicted by the model. ω l and ω r represent the corresponding left and right weights, given by   ω l = t r y and ω r = y t l , where y is the quantized value of the actual distance, and t l and t r are the adjacent distributions to this value on the left and right, respectively.

3. Experiments and Results

3.1. Experimental Setup

All experiments in this study were conducted within the PyTorch framework, specifically using PyTorch version 1.11. Computation was accelerated by CUDA 11.3, and an RTX 3080 10 G graphics card was utilized. Regarding training, the learning rate was set to 0.005, weight decay was set at 0.005, and momentum was configured at 0.937. All comparison models used the same data splits for SSDD (8:2) and HRSID (official split: 3642/454). The YOLO-based models were trained for 300 epochs using the SGD optimizer, with an input size of 640 × 640 and a batch size of 16. The learning rate of AFN-YOLO was set to 0.005, while those of YOLOv5, YOLOv7, and YOLOv8 were set to 0.01. Faster R-CNN and FCOS were trained for 36 epochs with learning rates of 0.02 and 0.01, respectively. All baseline results were reproduced by the authors under the same experimental environment, rather than directly cited from the literature.

3.2. Datasets

(1) SSDD: The SSDD comprises 1160 SAR images obtained from RadarSat-2, TerraSAR-X, and Sentinel-1 satellites. These data encompass four polarization modes: HH, HV, VV, and VH, with resolutions ranging from 1 to 15 m. It includes ship targets across multiple scales and under various environmental conditions. Within this dataset, small, medium, and large ship targets account for 60.2%, 36.8%, and 3% of all ship targets, respectively. The training and test sets were divided based on configuration files provided by the original authors, split in an 8:2 ratio.
(2) HRSID: The HRSID consists of SAR images captured by the Sentinel-1 and TerraSAR-X satellites. It contains a total of 5604 SAR images, all uniformly sized at 800 × 800 pixels, with resolutions spanning from 0.5 to 3 m. Imaging scenarios encompass complex scenes such as ports, docks, and nearshore environments, as well as simpler scenarios like open seas. Each SAR image incorporates ship targets of varying counts, sizes, and types. The dataset contains 16,951 ships in total, where small, medium, and large ships constitute 54.5%, 43.5%, and 2% respectively. The division between training and testing sets was guided by configuration files from the authors, with 3642 images for training and 454 images set aside for testing.

3.3. Evaluation Criteria

To evaluate the efficacy of AFN-YOLO, we employ mAP50, precision, and recall as our performance metrics.
Precision gauges the proportion of correctly identified positive samples among those predicted as positive. Within this context, T P stands for the number of true positive detections, whereas F P denotes the count of samples falsely identified as positive.
The definition of Precision is defined as:
P = T P T P + F P
Recall, commonly termed as the true positive rate, quantifies the proportion of actual positive samples that have been correctly identified out of the entire set of positive samples.
The definition of Recall is articulated as:
R = T P T P + F N
AP, or Average Precision, represents the area under the Precision–Recall curve, offering a comprehensive measure of a model’s performance across varying thresholds. Specifically, mAP50 denotes the mean AP calculated across all categories at an Intersection over Union (IoU) threshold of 0.5. This metric provides a comprehensive evaluation of detection efficacy, especially pertinent in the domain of SAR ship target detection.
m A P 50 = 1 C i = 1 C A P i I o U = 0.5
where C represents the number of categories, and A P i I o U = 0.5 denotes the computed result for the Average Precision (AP) of the i-th category at an Intersection over Union (IoU) threshold of 0.5.

3.4. Results and Discussion

(1)
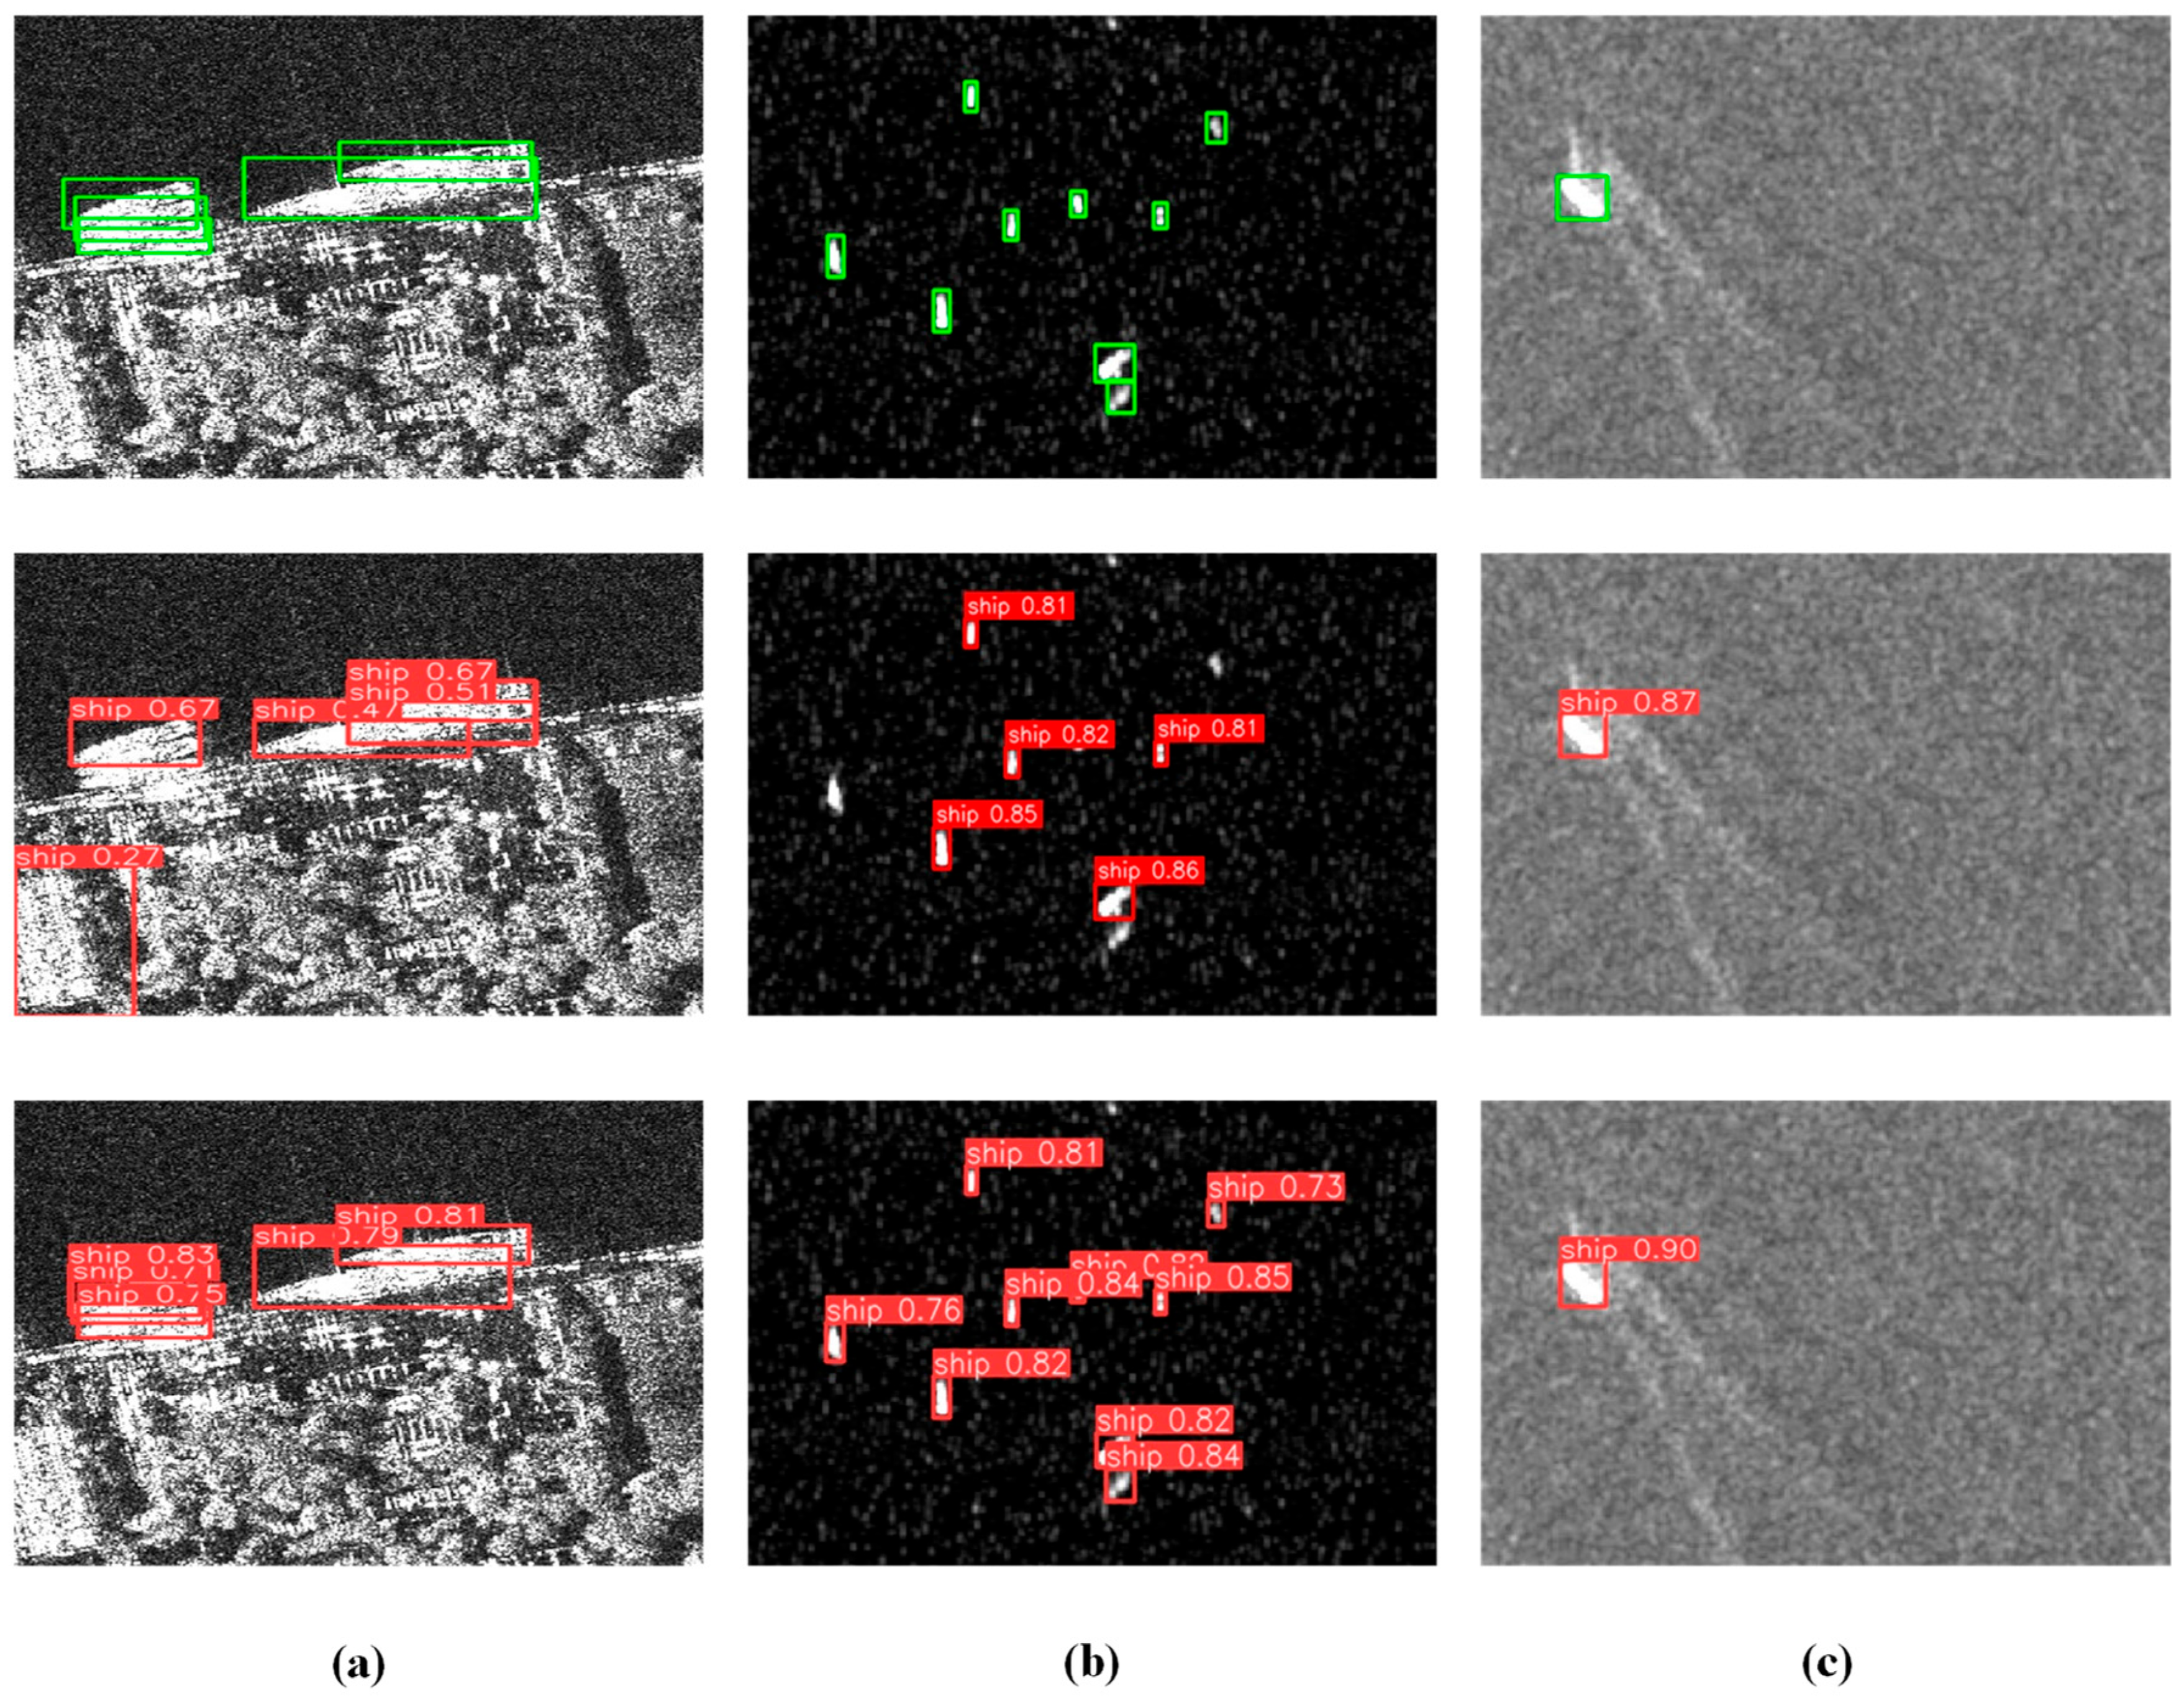
Comparison with Other Methods: To further verify the effectiveness of the proposed AFN-YOLO method, comparative experiments were conducted on two SAR ship detection datasets, namely SSDD and HRSID, against several mainstream object detection algorithms. The comparison methods include the two-stage detector Faster R-CNN, as well as the one-stage detectors FCOS, YOLOv5, YOLOv7, and YOLOv8. Since the proposed method belongs to the one-stage detection framework, one-stage detectors were mainly selected for comparison, while Faster R-CNN was introduced as a representative two-stage detector to provide a more comprehensive evaluation of the performance differences among different detection frameworks in SAR ship detection tasks. The experimental results are shown in Table 1. From the experimental results on the SSDD, it can be observed that the proposed AFN-YOLO achieves the best results in terms of Precision, Recall, and mAP@0.5, reaching 97.69%, 97.35%, and 98.75%, respectively. Compared with the YOLOv8 baseline model, AFN-YOLO improves Precision by 2.65 percentage points, Recall by 6.15 percentage points, and mAP@0.5 by 2.70 percentage points. Among these improvements, the increase in Recall is particularly significant, indicating that the proposed method can detect more true ship targets and effectively reduce the missed detection rate. Compared with YOLOv5, AFN-YOLO improves mAP@0.5 by 2.47 percentage points; compared with YOLOv7, it improves mAP@0.5 by 5.07 percentage points. These results demonstrate that the proposed method further enhances the recall capability for ship targets while maintaining high detection accuracy, making it particularly suitable for SAR image detection scenarios involving small targets and strong background interference. On the HRSID, AFN-YOLO also achieves the best overall performance, with Precision, Recall, and mAP@0.5 reaching 91.11%, 83.32%, and 91.65%, respectively. Compared with YOLOv8, AFN-YOLO also demonstrates superior performance. This indicates that on the HRSID, which has higher resolution and more complex scenes, the main advantages of the proposed method lie in effectively compensating for missed targets and improving overall detection performance. Compared with Faster R-CNN, FCOS, YOLOv5, and YOLOv7, AFN-YOLO improves mAP@0.5 by 13.67, 13.70, 8.31, and 8.01 percentage points, respectively, demonstrating its stronger feature representation capability and generalization ability in complex SAR ship detection tasks. The main reason for the above performance improvements is that the proposed method effectively combines frequency-domain information modeling with spatial-domain feature fusion. On the one hand, the C2f_FF module can supplement frequency-domain feature information that is often overlooked by traditional convolutional networks, thereby enhancing the separability between ship targets and background interference such as sea clutter and nearshore buildings. On the other hand, TAS-FPN adaptively fuses features from different levels, improving the model’s perception capability for multi-scale ship targets and enabling it to better detect densely distributed small targets and ship targets with significant scale variations. In addition, the improved feature representation and detection framework help the model maintain stable detection performance under complex sea conditions, nearshore areas, and strong background interference. Combining the quantitative results in Table 1 with the visual detection results in Figure 7, it can be seen that traditional detection methods are prone to false detections or missed detections under complex nearshore backgrounds and sea clutter interference. For example, YOLOv8 tends to misclassify background regions such as nearshore buildings, port facilities, or strong clutter areas as ship targets, while also missing some densely arranged small-scale ship targets. In contrast, AFN-YOLO can more accurately localize ship target regions and maintain higher detection completeness and stability under complex backgrounds. In summary, the proposed method outperforms existing mainstream detection algorithms on both the SSDD and HRSID, verifying its effectiveness and robustness in complex SAR ship detection tasks.
(2)
Ablation Study: To verify the effectiveness of the proposed modules, we conducted systematic ablation experiments on the SSDD. Starting from the YOLOv8n baseline, C2f_FF, C2R, TAS-FPN, triplet attention (TA), and the optimized loss function were progressively introduced to construct six model variants. For each variant, Precision (P), Recall (R), mAP@50, and mAP@50:95 were reported. The experimental results are summarized in Table 2.
Effect of the C2f_FF module (Exp. 1→2). Replacing the standard C2f module with C2f_FF brings a clear performance improvement. Compared with the YOLOv8n baseline, Precision increases from 95.04% to 97.07% (+2.03 percentage points), Recall increases from 91.20% to 95.10% (+3.90 percentage points), and mAP@50 improves from 96.05% to 97.59% (+1.54 percentage points). More notably, mAP@50:95 increases from 67.38% to 72.51% (+5.13 percentage points), indicating that C2f_FF not only improves detection accuracy at the IoU threshold of 0.5, but also enhances localization quality under stricter IoU thresholds. This improvement suggests that the adaptive frequency-domain fusion mechanism can supplement the spatial-domain representation with useful spectral information. By applying learnable frequency weights to the Fourier spectrum of each input feature map, C2f_FF helps suppress frequency components related to sea clutter and coastal interference while preserving target-related structural information, thereby improving the separability between ship targets and complex backgrounds.
Effect of the C2R module (Exp. 2→3). After introducing the C2R module, all evaluation metrics are further improved. Precision increases from 97.07% to 97.31% (+0.24 percentage points), Recall increases from 95.10% to 95.92% (+0.82 percentage points), mAP@50 increases from 97.59% to 97.88% (+0.29 percentage points), and mAP@50:95 increases from 72.51% to 73.64% (+1.13 percentage points). These results show that C2R further enhances the feature representation capability of the network. The multi-gradient residual structure enables the model to capture complementary spatial cues, such as edge, texture, and intensity information, which are important for distinguishing SAR ship targets from complex background structures. The relatively moderate but consistent improvements indicate that C2R acts as an effective refinement module on the basis of the frequency-domain enhancement introduced by C2f_FF.
Effect of TAS-FPN (Exp. 3→4). Introducing TAS-FPN without triplet attention further improves the detection performance. Precision increases from 97.31% to 97.52% (+0.21 percentage points), Recall increases from 95.92% to 96.61% (+0.69 percentage points), mAP@50 increases from 97.88% to 98.31% (+0.43 percentage points), and mAP@50:95 increases from 73.64% to 74.95% (+1.31 percentage points). This demonstrates the effectiveness of the proposed multi-scale feature fusion structure. Since SAR ship targets often vary significantly in scale, ranging from small fishing boats to large cargo ships, the top-down feature aggregation in TAS-FPN helps combine high-level semantic information with fine-grained spatial details, thereby improving the detection of multi-scale ship targets.
Effect of the triplet attention module (Exp. 4→5). After embedding the triplet attention module into TAS-FPN, the model achieves further performance gains. Precision increases from 97.52% to 97.63% (+0.11 percentage points), Recall increases from 96.61% to 97.08% (+0.47 percentage points), mAP@50 increases from 98.31% to 98.56% (+0.25 percentage points), and mAP@50:95 increases from 74.95% to 75.62% (+0.67 percentage points). These results indicate that triplet attention can further improve feature discrimination by modeling cross-dimensional interactions among channel, height, and width dimensions. This is beneficial for suppressing background interference in nearshore scenes, where buildings, docks, and other man-made structures may exhibit visual responses similar to ship targets.
Effect of the optimized loss function (Exp. 5→6). Finally, replacing the original loss function with the optimized loss combination further improves the model performance. Precision increases from 97.63% to 97.69% (+0.06 percentage points), Recall increases from 97.08% to 97.35% (+0.27 percentage points), mAP@50 increases from 98.56% to 98.75% (+0.19 percentage points), and mAP@50:95 increases from 75.62% to 76.20% (+0.58 percentage points). Although the improvement is relatively smaller than that brought by the structural modules, it remains consistent across all metrics. This suggests that the optimized loss function contributes to more accurate classification and localization, especially for difficult samples and densely distributed ship targets.
Overall, the complete AFN-YOLO model achieves the best performance among all variants, with Precision, Recall, mAP@50, and mAP@50:95 reaching 97.69%, 97.35%, 98.75%, and 76.20%, respectively. Compared with the YOLOv8n baseline, the complete model improves these four metrics by 2.65, 6.15, 2.70, and 8.82 percentage points, respectively. The continuous improvement from Exp. 1 to Exp. 6 demonstrates that each proposed component contributes positively to the final detection performance. In particular, C2f_FF provides the most significant improvement in mAP@50:95, while TAS-FPN and TA further enhance multi-scale representation and feature discrimination. These results verify the effectiveness of the proposed frequency-domain fusion, spatial feature enhancement, multi-scale feature aggregation, attention mechanism, and optimized loss design.
(3)
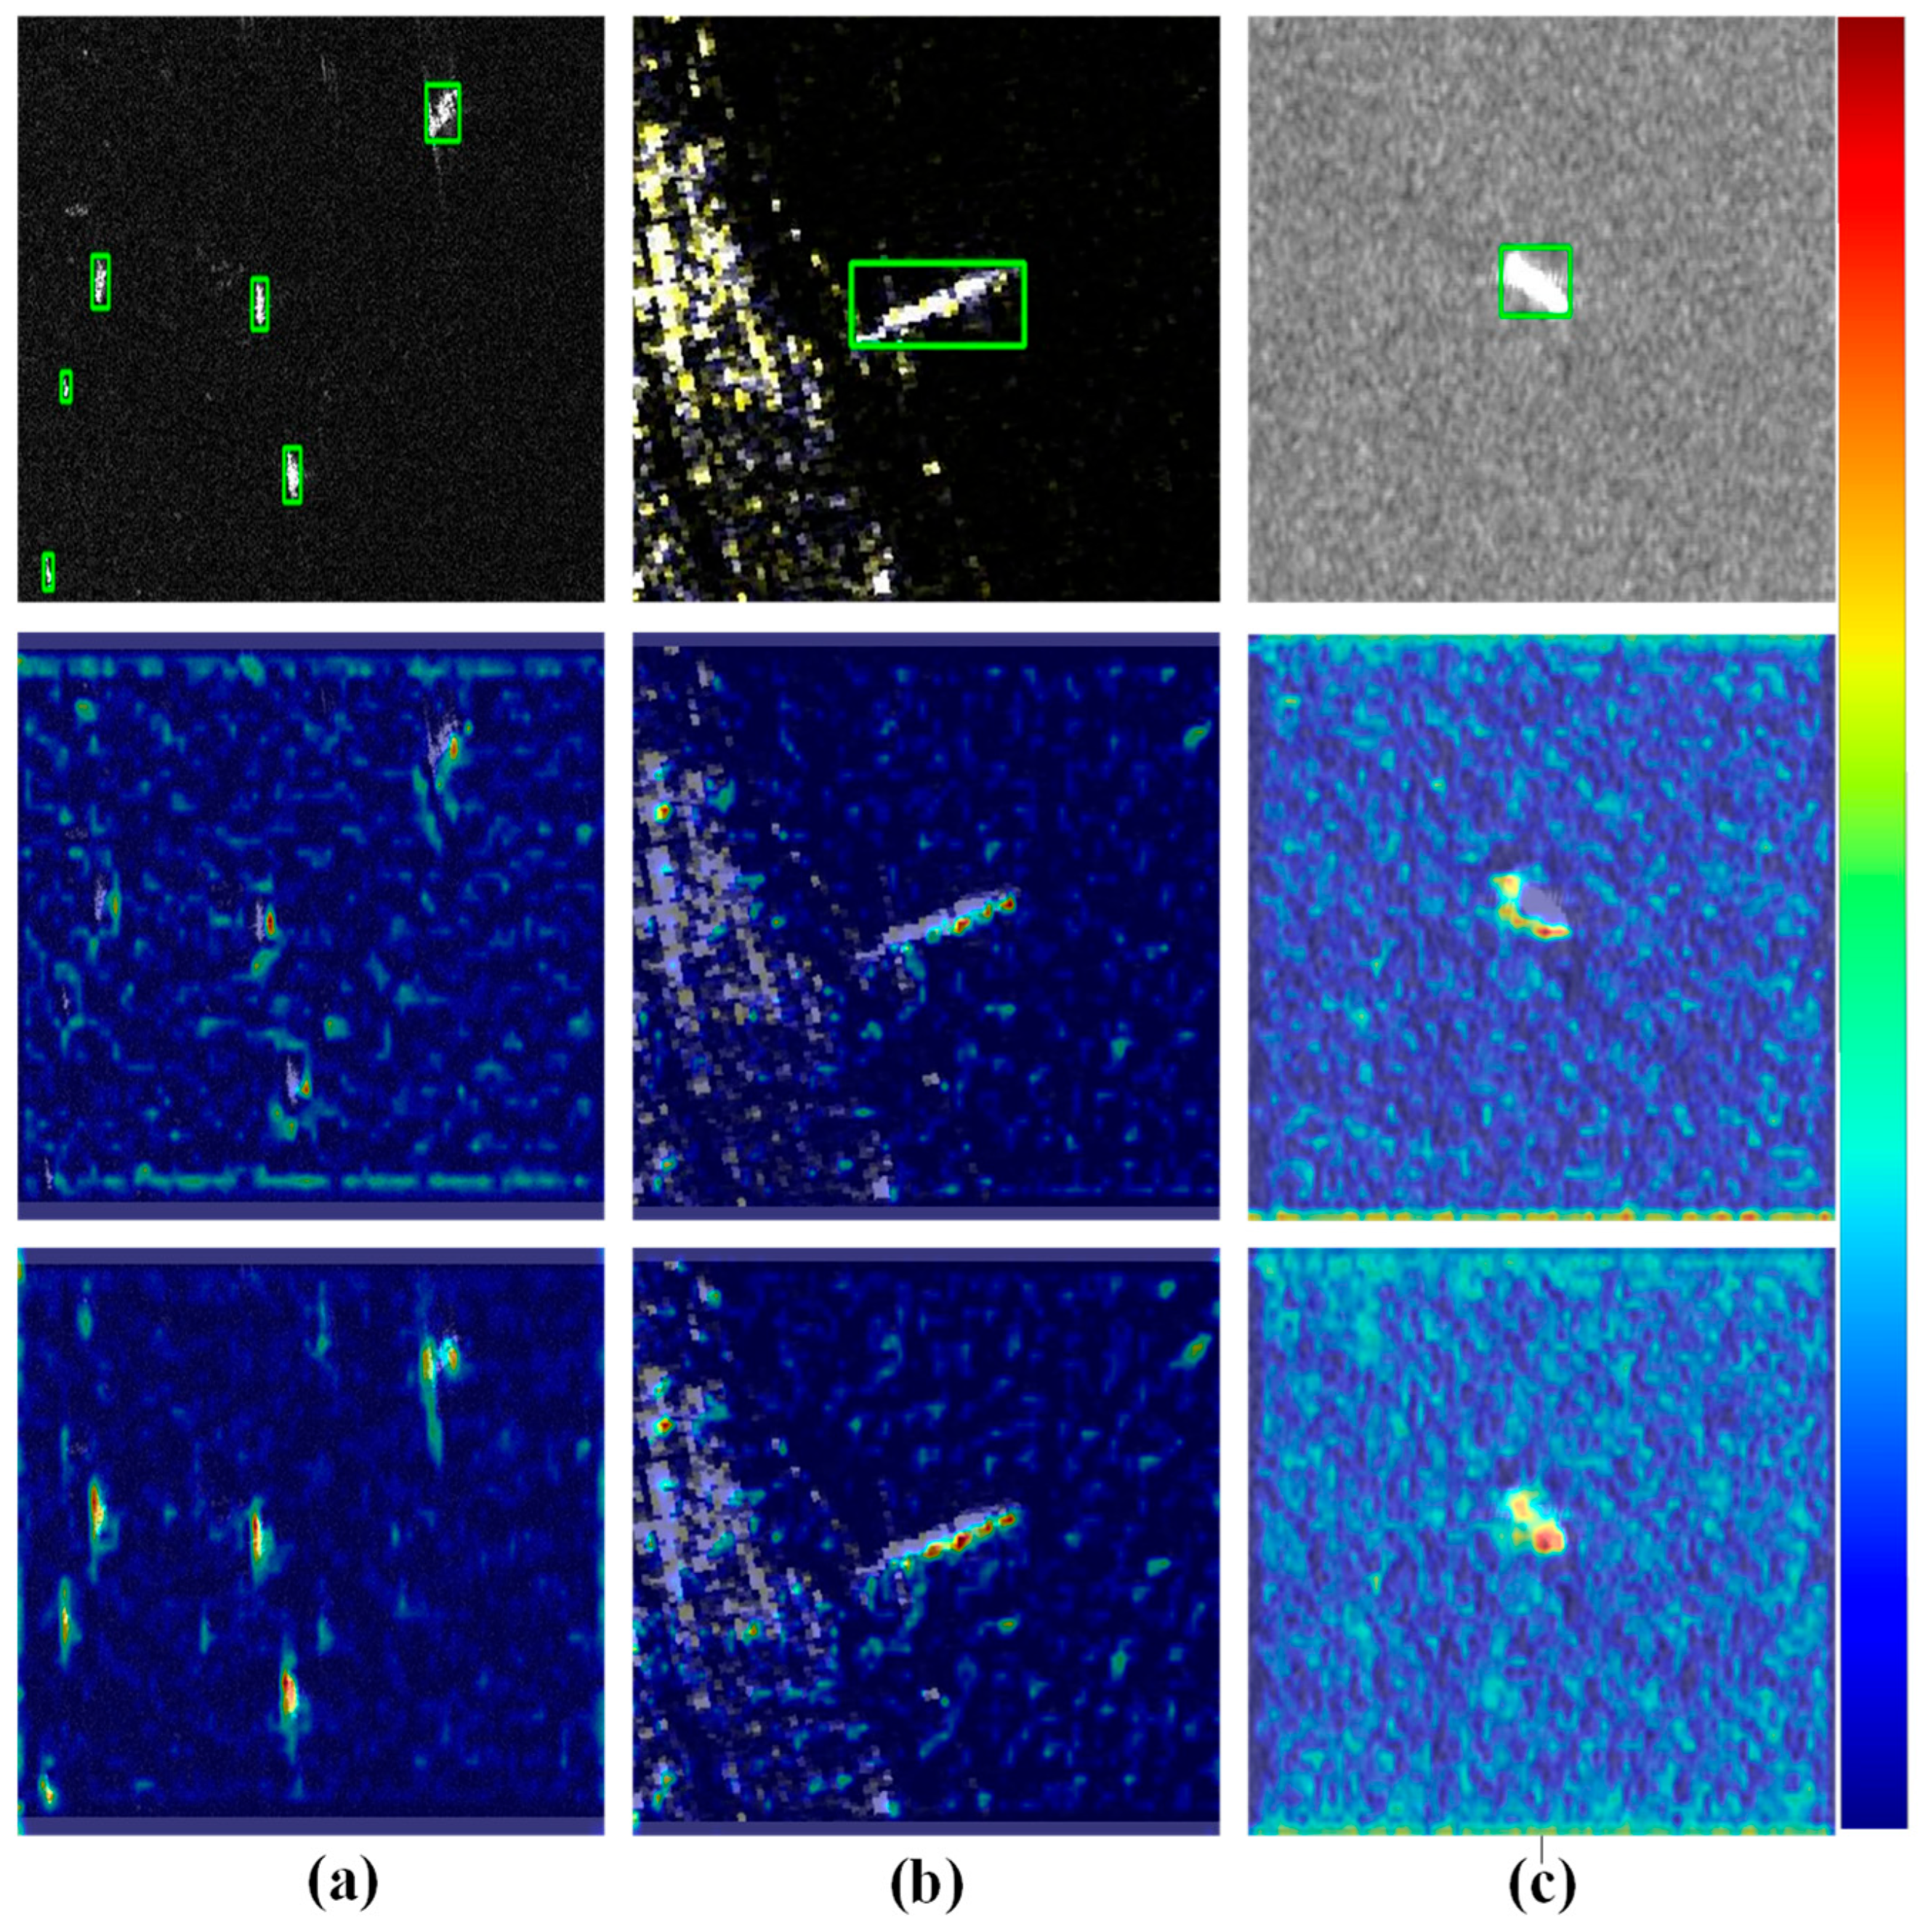
Grad-CAM Visualization Analysis: To complement the quantitative ablation results, we generated Grad-CAM [35] attention heatmaps for different model variants on representative SAR images with complex nearshore backgrounds, as shown in Figure 8. In the heatmaps, reddish regions indicate areas that receive higher attention during detection. The baseline YOLOv8n model (Exp. 1) shows a relatively dispersed attention distribution, with activation regions appearing not only on ship targets but also on background structures such as docks, buildings, and coastal areas. This phenomenon is consistent with its limited recall performance and its tendency to confuse ship targets with complex background interference.
As the proposed modules are progressively introduced, the attention maps gradually become more concentrated on ship targets. After introducing C2f_FF (Exp. 2), the model shows reduced attention to cluttered background regions, indicating that adaptive frequency-domain fusion helps suppress sea clutter and nearshore interference. With the further integration of C2R, TAS-FPN, and triplet attention, the attention responses become more compact and better localized, especially when ship targets are adjacent to visually similar coastal structures. The complete AFN-YOLO model (Exp. 6) produces the most focused attention maps, where the high-response regions accurately cover ship targets while background activation is effectively reduced. These visualization results are consistent with the quantitative improvements in Table 2, especially the 8.82 percentage-point increase in mAP@50:95 over the YOLOv8n baseline, further demonstrating the effectiveness of the proposed modules in enhancing feature discrimination under complex SAR scenes.
(4)
Error Analysis: Figure 8a shows a complex nearshore background scenario. The main difficulty of this scene lies in the fact that docks, breakwaters, coastal buildings, and ship targets exhibit similar radar backscattering intensities in SAR images. As a result, YOLOv8 tends to misclassify building edges as ships, leading to false alarms, or miss ships whose grayscale intensity is close to that of shore-based structures. As shown in the detection results in the second row, YOLOv8 produces obvious false detection boxes in the port area, incorrectly labeling rectangular buildings on land as ships. Meanwhile, it misses a berthed ship close to the dock on the left side. This target has extremely low grayscale contrast with the background, making it difficult for purely spatial-domain features to effectively distinguish it from shore-based structures. In contrast, the proposed AFN-YOLO employs adaptive frequency-domain processing through the C2f_FF module, exploiting the differences in spectral distributions between ship targets and buildings. The sharp edges of ships appear as specific high-frequency patterns in the frequency domain, whereas the smooth rooftops and roads of buildings are mainly concentrated in low-frequency components. Therefore, AFN-YOLO effectively suppresses shore-based background interference and focuses attention on real ship target regions. In the figure, AFN-YOLO provides correct detection boxes for all nearshore ships, with no false alarms or missed detections.
Figure 8b shows a dense small-target scenario. This scene contains nine closely arranged small ships, most of which are smaller than 20 × 20 pixels, with very small spacing between adjacent targets. YOLOv8 exposes two typical problems in this scenario. First, its recall for extremely small targets is insufficient. Several small fishing boats in the lower-left corner are completely missed, because after 32× downsampling in the YOLOv8 backbone, these small targets occupy less than one feature unit on the deep feature map, making it difficult to generate effective activation responses. Second, its bounding box regression accuracy is insufficient for densely adjacent targets, causing several neighboring ships to be merged into a single detection box. AFN-YOLO addresses these issues through two improvements. The top–down multi-scale fusion pathway of TAS-FPN effectively aggregates shallow high-resolution features, which contain fine-grained spatial location information for small targets, with deep semantic features, which contain category-discriminative information, thereby significantly improving the recall of small targets. Meanwhile, the optimized DFL loss enhances the discrimination of bounding boxes for closely adjacent targets by modeling discrete bounding box distributions, allowing the NMS post-processing stage to correctly retain each independent target. In the figure, AFN-YOLO provides independent and accurate detection boxes for all ships in the scene. In particular, the small target group in the lower-left corner is completely detected, without target merging or missed detections.
Figure 8c shows a sea clutter interference scenario. This scene is affected by wind and waves, resulting in significantly enhanced sea-surface backscattering and large areas of bright sea clutter patches, which highly overlap with small ship targets in the grayscale histogram. From the detection results, both YOLOv8 and AFN-YOLO successfully detect the ship targets in the scene. However, YOLOv8 produces relatively low confidence scores for ships located in clutter-dense regions, reflecting the uncertainty of purely spatial-domain features in distinguishing targets under sea clutter interference. When ships and surrounding bright clutter patches exhibit highly similar texture and grayscale characteristics, YOLOv8 struggles to make high-confidence predictions. In contrast, AFN-YOLO achieves significantly higher confidence for the same targets. This is because the learnable frequency-domain weights in the C2f_FF module learn to distinguish the spectral characteristics of ships and clutter through end-to-end training. Sea clutter usually appears as broadband high-frequency noise covering a wide frequency range, whereas ship targets, due to their regular geometric structures and clear edge contours, have spectral energy concentrated in specific frequency bands. By adaptively attenuating clutter-related frequency components and selectively enhancing ship-related frequency components in the frequency domain, AFN-YOLO effectively filters out sea clutter interference, enabling the detection head to produce more stable and reliable predictions for targets surrounded by clutter.
(5)
Efficiency Experiment: Table 3 presents the efficiency comparison between AFN-YOLO and YOLOv8n on the SSDD. Compared with YOLOv8n, AFN-YOLO improves Precision, Recall, and mAP@50 by 2.65%, 6.15%, and 2.70%, respectively, indicating that the proposed method can effectively enhance SAR ship detection performance. In terms of model complexity, the number of parameters of AFN-YOLO only increases from 3.01 M to 3.39 M, and the model file size increases from 6.2 MB to 7.0 MB, showing a relatively small overall increase. Although the inference speed decreases from 66.9 FPS to 54.3 FPS, corresponding to a reduction of approximately 18.8%, this overhead mainly comes from the Fourier transform and inverse Fourier transform operations in the C2f_FF module, as well as the cross-dimensional attention computation in TAS-FPN. Overall, AFN-YOLO achieves better detection accuracy while maintaining high inference efficiency and lightweight characteristics, demonstrating that its performance improvement mainly comes from frequency-domain feature fusion and attention mechanism design rather than a simple increase in model parameters.

4. Conclusions

This paper introduced a single-stage SAR ship detection model, AFN-YOLO, which effectively fuses semantic features extracted from the spatial domain with texture and detail features extracted from the frequency domain. We designed the TAS-FPN to capture multi-scale features of ship targets using a top–down pyramid structure, enabling multi-scale detection of SAR ship targets. Our approach has demonstrated its superiority on both the SSDD and HRSID. Notably, it exhibits robustness against complex marine environments, including sea clutter and complex nearshore backgrounds. Nevertheless, the proposed method still has several limitations that deserve further attention. First, the current evaluation is only conducted on the SSDD and HRSID, which are mainly derived from RadarSat-2, TerraSAR-X, and Sentinel-1 sensors. Therefore, the generalization performance of AFN-YOLO on other SAR platforms, frequency bands, and polarization modes remains to be further verified. To address these limitations, future research can be carried out from the following aspects. First, the cross-sensor generalization capability of the model can be evaluated on multi-source SAR datasets, and domain adaptation techniques can be explored to alleviate spectral distribution shifts. Second, knowledge distillation, model pruning, or alternative spectral transforms, such as DCT or wavelet transform, can be introduced to further reduce computational overhead. Third, the model can be extended to oriented bounding box detection to better adapt to dense berthing scenarios. Fourth, temporal consistency from multi-temporal SAR images can be incorporated to suppress false alarms caused by transient clutter. In addition, inspired by recent related studies, AFN-YOLO can be further extended in terms of model compression, visual attention mechanisms, speckle-aware modeling, density-aware detection, and post-processing optimization, thereby improving its practicality and robustness in complex SAR ship detection scenarios such as extreme sea conditions.

Author Contributions

Conceptualization, W.H., S.D. and Z.F.; methodology, W.H. and S.D.; software, W.H.; validation, W.H., S.D. and Z.F.; formal analysis, W.H. and S.D.; investigation, W.H.; resources, S.D., Z.F. and X.Z.; data curation, W.H.; writing—original draft preparation, W.H. and S.D.; writing—review and editing, S.D., Z.F. and X.Z.; visualization, W.H.; supervision, S.D., Z.F. and X.Z.; project administration, Z.F. and X.Z.; funding acquisition, X.Z. All authors have read and agreed to the published version of the manuscript.

Funding

This work is supported by the Key Industry R&D Program of Shenzhen, with the project number ZDCY20250901104001002.

Data Availability Statement

The data supporting the findings of this study are available from the corresponding author upon reasonable request. The data are not publicly archived at this stage but may be provided for academic and research purposes by contacting the corresponding author via email.

Conflicts of Interest

The authors declare that Mr. Zhiheng Fan and Dr. Xiaohu Zhang are employees of Hymson Laser Technology Group Co., Ltd. The remaining authors declare no conflicts of interest.

References

  1. Xie, F.; Lin, B.; Liu, Y. Research on the coordinate attention mechanism fuse in a YOLOv5 deep learning detector for the SAR ship detection task. Sensors 2022, 22, 3370. [Google Scholar] [CrossRef] [Scilit] [PubMed]
  2. Li, S.; Fu, X.; Dong, J. Improved ship detection algorithm based on YOLOX for SAR outline enhancement image. Remote Sens. 2022, 14, 4070. [Google Scholar] [CrossRef] [Scilit]
  3. Yang, R.; Hu, Z.; Liu, Y.; Xu, Z. A Novel Polarimetric SAR Classification Method Integrating Pixel-Based and Patch-Based Classification. IEEE Geosci. Remote Sens. Lett. 2020, 17, 431–435. [Google Scholar] [CrossRef] [Scilit]
  4. Wang, N.; Li, B.; Wei, X.; Wang, Y.; Yan, H. Ship detection in spaceborne infrared image based on lightweight CNN and multisource feature cascade decision. IEEE Trans. Geosci. Remote Sens. 2021, 59, 4324–4339. [Google Scholar] [CrossRef] [Scilit]
  5. Li, X.; Li, D.; Liu, H.; Wan, J.; Chen, Z.; Liu, Q. A-BFPN: An Attention-Guided Balanced Feature Pyramid Network for SAR Ship Detection. Remote Sens. 2022, 14, 3829. [Google Scholar] [CrossRef] [Scilit]
  6. Feng, Y.; Chen, J.; Huang, Z.; Wan, H.; Xia, R.; Wu, B.; Sun, L.; Xing, M. A lightweight position-enhanced anchor-free algorithm for SAR ship detection. Remote Sens. 2022, 14, 1908. [Google Scholar] [CrossRef] [Scilit]
  7. Shao, Z.; Zhang, X.; Zhang, T.; Xu, X.; Zeng, T. RBFA-net: A rotated balanced feature-aligned network for rotated SAR ship detection and classification. Remote Sens. 2022, 14, 3345. [Google Scholar] [CrossRef] [Scilit]
  8. Atteia, G.; Collins, M.J. On the use of compact polarimetry sar for ship detection. ISPRS J. Photogramm. Remote Sens. 2013, 80, 1–9. [Google Scholar] [CrossRef] [Scilit]
  9. Wang, C.; Wang, Z.; Zhang, H.; Zhang, B.; Wu, F. A polsar ship detector based on a multi-polarimetric-feature combination using visual attention. Int. J. Remote Sens. 2014, 35, 7763–7774. [Google Scholar] [CrossRef] [Scilit]
  10. Wang, C.; Bi, F.; Chen, L.; Chen, J. A novel threshold template algorithm for ship detection in high-resolution SAR images. In Proceedings of the 2016 IEEE International Geoscience and Remote Sensing Symposium (IGARSS), Beijing, China, 10–15 July 2016; pp. 100–103. [Google Scholar]
  11. Levanon, N. Detection loss due to interfering targets in ordered statistics CFAR. IEEE Trans. Aerosp. Electron. Syst. 1988, 24, 678–681. [Google Scholar] [CrossRef] [Scilit]
  12. Touzi, R.; Lopes, A.; Bousquet, P. A statistical and geometrical edge detector for SAR images. IEEE Trans. Geosci. Remote Sens. 1988, 26, 764–773. [Google Scholar] [CrossRef] [Scilit]
  13. Barkat, M.; Varshney, P. Adaptive cell-averaging CFAR detection in distributed sensor networks. IEEE Trans. Aerosp. Electron. Syst. 1991, 27, 424–429. [Google Scholar] [CrossRef]
  14. Robey, F.; Fuhrmann, D.; Kelly, E.; Nitzberg, R. A CFAR adaptive matched filter detector. IEEE Trans. Aerosp. Electron. Syst. 1992, 28, 208–216. [Google Scholar] [CrossRef] [Scilit]
  15. Frery, A.; Muller, H.-J.; Yanasse, C.; Sant’Anna, S. A model for extremely heterogeneous clutter. IEEE Trans. Geosci. Remote Sens. 1997, 35, 648–659. [Google Scholar] [CrossRef] [Scilit]
  16. Qin, X.; Zhou, S.; Zou, H.; Gao, G. A CFAR detection algorithm for generalized gamma distributed background in high-resolution sar images. IEEE Geosci. Remote Sens. Lett. 2013, 10, 806–810. [Google Scholar] [CrossRef] [Scilit]
  17. Schwegmann, C.P.; Kleynhans, W.; Salmon, B.P. Manifold adaptation for constant false alarm rate ship detection in south african oceans. IEEE J. Sel. Top. Appl. Earth Obs. Remote Sens. 2015, 8, 3329–3337. [Google Scholar] [CrossRef] [Scilit]
  18. Wang, C.; Bi, F.; Zhang, W.; Chen, L. An intensity-space domain CFAR method for ship detection in HR SAR images. IEEE Geosci. Remote Sens. Lett. 2017, 14, 529–533. [Google Scholar] [CrossRef] [Scilit]
  19. Ren, S.; He, K.; Girshick, R.; Sun, J. Faster R-CNN: Towards Real-Time Object Detection with Region Proposal Networks. IEEE Trans. Pattern Anal. Mach. Intell. 2017, 39, 1137–1149. [Google Scholar] [CrossRef] [Scilit] [PubMed]
  20. Nie, X.; Duan, M.; Ding, H.; Hu, B.; Wong, E.K. Attention Mask R-CNN for Ship Detection and Segmentation From Remote Sensing Images. IEEE Access 2020, 8, 9325–9334. [Google Scholar] [CrossRef] [Scilit]
  21. Ge, Z.; Liu, S.; Wang, F.; Li, Z.; Sun, J. YOLOX: Exceeding YOLO Series in 2021. arXiv 2021, arXiv:2107.08430. [Google Scholar]
  22. Redmon, J.; Farhadi, A. YOLOv3: An Incremental Improvement. arXiv 2018, arXiv:1804.02767. [Google Scholar]
  23. Bochkovskiy, A.; Wang, C.Y.; Liao, H. YOLOv4: Optimal Speed and Accuracy of Object Detection. arXiv 2020, arXiv:2004.10934. [Google Scholar]
  24. Berg, A.C.; Fu, C.Y.; Szegedy, C.; Anguelov, D.; Erhan, D.; Reed, S.; Liu, W. SSD: Single Shot MultiBox Detector. arXiv 2015, arXiv:1512.02325. [Google Scholar]
  25. Lin, T.-Y.; Goyal, P.; Girshick, R.; He, K.; Dollár, P. Focal loss for dense object detection. IEEE Trans. Pattern Anal. Mach. Intell. 2020, 42, 318–327. [Google Scholar] [CrossRef] [Scilit] [PubMed]
  26. Qin, C.; Wang, X.; Li, G.; He, Y. A Semi-Soft Label-Guided Network With Self-Distillation for SAR Inshore Ship Detection. IEEE Trans. Geosci. Remote Sens. 2023, 61, 5211814. [Google Scholar] [CrossRef] [Scilit]
  27. He, S.; Yuan, R.; Yang, Z.; Liu, J. D3S-Net: A Dense SAR Ship Detection Network for Dynamic Denoising and Structural Sparsity Deinterference. Digit. Signal Process. 2026, 182, 106295. [Google Scholar] [CrossRef] [Scilit]
  28. Wen, Z.; Ma, K.; Wan, H.; Chen, J.; Yang, W.; Huang, Z. YMCNet: Enhanced SAR Ship Detection in a Range-Compressed Domain Based on Structured State-Space. In IGARSS 2025-2025 IEEE International Geoscience and Remote Sensing Symposium; IEEE: New York, NY, USA, 2025. [Google Scholar]
  29. Zhang, J.; Li, S.; Dong, Y.; Pan, B.; Shi, Z. Hierarchical Similarity Alignment for Domain Adaptive Ship Detection in SAR Images. IEEE Trans. Geosci. Remote Sens. 2022, 60, 5240611. [Google Scholar] [CrossRef] [Scilit]
  30. Li, D.; Liang, Q.; Liu, H.; Liu, Q.; Liu, H.; Liao, G. A novel multidimensional domain deep learning network for sar ship detection. IEEE Trans. Geosci. Remote Sens. 2022, 60, 5203213. [Google Scholar] [CrossRef] [Scilit]
  31. Rao, Y.; Zhao, W.; Zhu, Z.; Lu, J.; Zhou, J. Global filter networks for image classification. In Advances in Neural Information Processing Systems; Ranzato, M., Beygelzimer, A., Dauphin, Y., Liang, P., Vaughan, J.W., Eds.; Curran Associates, Inc.: Red Hook, NY, USA, 2021; Volume 34, pp. 980–993. [Google Scholar]
  32. Zhang, T.; Zhang, X.; Li, J.; Xu, X.; Wang, B.; Zhan, X.; Xu, Y.; Ke, X.; Zeng, T.; Su, H.; et al. SAR Ship Detection Dataset (SSDD): Official Release and Comprehensive Data Analysis. Remote Sens. 2021, 13, 3690. [Google Scholar] [CrossRef] [Scilit]
  33. Wei, S.; Zeng, X.; Qu, Q.; Wang, M.; Su, H.; Shi, J. HRSID: A High-Resolution SAR Images Dataset for Ship Detection and Instance Segmentation. IEEE Access 2020, 8, 120234–120254. [Google Scholar] [CrossRef] [Scilit]
  34. Patro, B.N.; Namboodiri, V.P.; Agneeswaran, V.S. SpectFormer: Frequency and Attention is what you need in a Vision Transformer. arXiv 2023, arXiv:2304.06446. [Google Scholar]
  35. Cochran, W.T.; Cooley, J.W.; Favin, D.L.; Helms, H.D.; Kaenel, R.A.; Lang, W.W.; Maling, G.C.; Nelson, D.E.; Rader, C.M.; Welch, P.D. What is the fast Fourier transform? Proc. IEEE 1967, 55, 1664–1674. [Google Scholar] [CrossRef] [Scilit]
  36. Brigham, E.O. The Fast Fourier Transform and Its Applications; Prentice-Hall, Inc.: Hoboken, NJ, USA, 1988. [Google Scholar]
  37. Bracewell, R.N. The fourier transform. Sci. Am. 1989, 260, 86–95. [Google Scholar] [CrossRef] [Scilit] [PubMed]
  38. Cooley, J.W.; Lewis, P.A.; Welch, P.D. The fast Fourier transform and its applications. IEEE Trans. Educ. 1969, 12, 27–34. [Google Scholar] [CrossRef] [Scilit]
  39. Gevorgyan, Z. SIoU loss: More powerful learning for bounding box regression. arXiv 2022, arXiv:2205.12740. [Google Scholar]
  40. Misra, D.; Nalamada, T.; Arasanipalai, A.U.; Hou, Q. Rotate to attend: Convolutional triplet attention module. In Proceedings of the IEEE/CVF Winter Conference on Applications of Computer Vision, Waikoloa, HI, USA, 3–8 January 2021. [Google Scholar]
  41. Lin, T.-Y.; Goyal, P.; Girshick, R.; He, K.; Dollár, P. Focal loss for dense object detection. In Proceedings of the IEEE International Conference on Computer Vision, Venice, Italy, 22–29 October 2017. [Google Scholar]
  42. Li, X.; Wang, W.; Wu, L.; Chen, S.; Hu, X.; Li, J.; Tang, J.; Yang, J. Generalized focal loss: Learning qualified and distributed bounding boxes for dense object detection. Adv. Neural Inf. Process. Syst. 2020, 33, 21002–21012. [Google Scholar]
  43. Rezatofighi, H.; Tsoi, N.; Gwak, J.; Sadeghian, A.; Reid, I.; Savarese, S. Generalized Intersection over Union: A Metric and A Loss for Bounding Box Regression. arXiv 2019, arXiv:1902.09630. [Google Scholar]
Figure 1. Typical SAR imagery in nearshore scenarios, including various scenes such as ports and islands.
Computers 15 00437 g001
Figure 2. (a) represents sea clutter, (b) represents land, and (c) represents ships. The first row shows SAR images of ships with different distributions, and the second row shows their corresponding spectrum graphs.
Computers 15 00437 g002
Figure 3. Processing flow of AFN-YOLO. The network extracts SAR ship features through successive convolutional operations, C2f_FF, and C2R modules. C2f_FF performs adaptive frequency-domain feature fusion to enhance discriminative spectral information, while C2R strengthens spatial feature representation. Triplet attention (TA) and SPPF are further introduced into the backbone to improve cross-dimensional interaction and multi-scale feature extraction, thereby supporting robust ship detection in complex SAR scenes.
Computers 15 00437 g003
Figure 4. Backbone of AFN-YOLO. The SAR image is processed by Conv–BN–SiLU blocks, followed by the C2f_FF module for frequency–spatial feature fusion and the C2R module for multi-gradient spatial enhancement. The final detection result is shown on the right, with the red box marking the detected ship.
Computers 15 00437 g004
Figure 5. The figure illustrates the specific module architecture utilized by AFN-YOLO for feature extraction within the realm of ship detection in SAR imagery via remote sensing.
Computers 15 00437 g005
Figure 6. The detailed architecture of TAS-FPN is depicted. Here, TA represents the Triplet Attention module, and the C2R module is consistent in structure with the C2R module employed in the main network.
Computers 15 00437 g006
Figure 7. Visual comparison of detection results in representative SAR ship detection scenarios. The green boxes indicate the ground-truth bounding boxes, while the red boxes represent the detection results. The first row (a) shows the ground-truth annotations, the second row (b) shows the results of YOLOv8, and the third row (c) shows the results of the proposed AFN-YOLO.
Computers 15 00437 g007
Figure 8. The first row presents the ground truth for SAR image detection in complex marine environments. Image (a) showcases small ship targets, image (b) depicts SAR ship targets in nearshore scenarios, and image (c) illustrates SAR ship targets influenced by sea clutter. The green boxes indicate the ground-truth bounding boxes. The second row displays the attention heatmaps derived from the baseline YOLOv8 model, while the third row reveals the attention heatmaps produced by our proposed model, AFN-YOLO.
Computers 15 00437 g008
Table 1. Experimental results of different methods.
ModelDatasetPrecisionRecallMap 0.5
Faster R-CNNSSDD81.6385.3189.63
HRSID88.8172.5777.98
FCOSSSDD84.1592.5290.61
HRSID75.5373.7977.95
YOLOv5SSDD95.1490.0196.28
HRSID84.6975.1183.34
YOLOv7SSDD91.0584.9293.68
HRSID85.5274.5883.64
YOLOv8SSDD95.0491.2096.05
HRSID90.0783.1590.40
AFN-YOLOSSDD97.6997.3598.75
HRSID91.1183.3291.65
Table 2. Ablation experiment.
C2f_FFC2RTAS-FPNTALossP (%)R (%)mAP@50 (%)mAP@50:95 (%)
1 95.0491.2096.0567.38
2 97.0795.1097.5972.51
3 97.3195.9297.8873.64
4 97.5296.6198.3174.95
5 97.6397.0898.5675.62
697.6997.3598.7576.20
Table 3. Efficiency comparison between YOLOv8n and AFN-YOLO on the SSDD.
P (%)R (%)mAP@50 (%)Parameters (M)FPSModel Size (MB)
YOLOv8n95.0491.2096.053.0166.96.2
AFN-YOLO97.6997.3598.753.3954.37.0
Disclaimer/Publisher’s Note: The statements, opinions and data contained in all publications are solely those of the individual author(s) and contributor(s) and not of MDPI and/or the editor(s). MDPI and/or the editor(s) disclaim responsibility for any injury to people or property resulting from any ideas, methods, instructions or products referred to in the content.