Article

Deep Learning-Based Automated Industrial Surface Defect Classification

1
Department of Computer Information Systems, College of Computer Science and Information Technology, Imam Abdulrahman Bin Faisal University, P.O. Box 1982, Dammam 31441, Saudi Arabia
2
Department of Computer Science (CS), College of Computer Science and Information Technology (CCSIT), Imam Abdulrahman Bin Faisal University, P.O. Box 1982, Dammam 31441, Saudi Arabia
*
Author to whom correspondence should be addressed.
Computers 2026, 15(7), 417; https://doi.org/10.3390/computers15070417
Submission received: 17 May 2026 / Revised: 19 June 2026 / Accepted: 26 June 2026 / Published: 29 June 2026

Abstract

Materials such as steel, concrete, and various alloys are used to build infrastructure and machinery across all industries. Due to their long service life, some of these materials will eventually develop surface damage (such as crazing, corrosion, and pitting) that will negatively affect both the structural integrity and the reliability of the machinery/infrastructure. Thus, the rapid and accurate classification of defects on material surfaces is crucial for ensuring high-quality materials and a continuous process without machinery breakdowns. In this work, we compare the effectiveness of two types of deep learning models (a VGG16 convolutional neural network with transfer learning and the state-of-the-art YOLOv8) for automatic defect classification on surfaces. The dataset used in our experiment included data from the Phase 5 Capstone Corrosion and the NEU Surface Defects Databases, resulting in eight distinct classes of surface defects. The effectiveness of both models was determined using stratified 10-fold cross-validation. The results of the experiment revealed that YOLOv8 achieved 98.5% accuracy, whereas VGG16 achieved only 92.5%. Moreover, YOLOv8 exhibited greater consistency under noise perturbations, demonstrating superior robustness compared with VGG16. Beyond model comparison, this study introduces a unified benchmark constructed from heterogeneous industrial defect datasets. It systematically evaluates classification performance, generalization capability, and robustness using stratified cross-validation and noise-based testing. The results indicate that YOLOv8 is a practical solution for automated industrial surface defect classification.

1. Introduction

Modern infrastructure relies on materials like steel, concrete, and industrial alloys, which can develop surface defects, such as crazing, scratches, corrosion, and pitting. Even minor defects can compromise structural integrity, safety, and production efficiency. Automated classification of surface defects is essential for maintaining quality, extending equipment life, and supporting predictive maintenance.
Deep learning has become the dominant approach for surface defect classification due to its ability to extract discriminative features from raw images automatically. Most existing methods rely on CNN-based architecture and YOLO-based detectors, with performance strongly dependent on dataset characteristics and evaluation protocols. Overall, existing work demonstrates strong domain-specific performance but lacks comprehensive evaluation across heterogeneous datasets and consistent benchmarking of different architectures.
Deep learning has advanced automated industrial inspection, with CNNs excelling at recognizing fine surface patterns [1] and YOLO-based models, notably YOLOv5 and YOLOv8, showing high accuracy in defect detection [2].
Moreover, there is accelerated deterioration of the surfaces of Saudi Arabia’s industries owing to the harsh environmental conditions, including high salinity levels due to the coastal climate, high humidity and temperatures during most quarters, sandstorms, and industrial pollution from petrochemical zones, such as Jubail and Yanbu. These factors result in surface defects, corrosion (pitting and crevice), stress corrosion cracking, degradation of pipeline and tank walls, and coating degradation. Conventional approaches are slow and not reliable. Therefore, there is a need for AI-based corrosion and surface defect detection mechanisms.
In this regard, two datasets are targeted that closely represent the Saudi Arabian industrial environment. Firstly, Phase5_Capstone Corrosion is mainly suitable for analyzing coating performance, modeling the corrosion rate, conducting electrochemical testing, predicting corrosion, and analyzing surface degradation using AI. It is highly aligned with real Saudi industrial needs [3]. Secondly, the NEU Surface Defect Database is rich in images of hot-rolled steel strip surfaces with various defect classes, including crazing, inclusion, patches, pitted surface, rolled-in scale, and scratches. It greatly supports surface defect detection, real-time quality control, training YOLO and transformer-based models, and benchmarking industrial inspection systems [4].
The current study compares YOLOv8 and VGG16 deep learning models for classifying metal surface defects, using an integrated dataset from the Phase5_Capstone Corrosion and NEU Surface Defect Databases to ensure a diverse representation of defects. Both models have been most widely used for classification tasks of a similar nature in the literature. Yet, different characteristics and, hence, different outcomes are observed, suited to different industrial environments and requirements. It is noteworthy that both datasets are comprehensive and widely used for surface defect detection, with large numbers of images from diverse industrial settings.
Most studies in the literature focus on unified datasets related to a single industrial setup, with identical environmental factors. Consequently, the models lack generalizability when evaluating diverse environmental factors.
Additional challenges remain in industrial deployment, including real-time accuracy, inference speed, and limited datasets, all of which hinder generalization. There is also a lack of comparative studies between traditional CNNs, such as VGG16, and modern models, such as YOLOv8, for predictive maintenance. This study addresses these gaps by evaluating accuracy, precision, recall, F1-score, inference speed, and robustness to noise.
The scope focuses on classifying metallic surface defects using deep learning. While the dataset is comprehensive, it is limited to public sources and controlled imaging conditions. Evaluation is restricted to VGG16 and YOLOv8, not full-scale deployment. The findings guide defect workflows in similar industrial environments.
This paper is structured as follows: Section 2 reviews the literature on surface defect classification; Section 3 details the materials and methods; Section 4 presents the results and discussion; Section 5 concludes and offers recommendations.

2. Background and Literature Review

2.1. Surface Defect Detection and Classification

Surface defects, such as crazing, corrosion, pits, scratches, and inclusions, are common in industrial materials. Their classification is crucial to ensuring product quality, operational safety, and structural integrity across sectors, such as manufacturing, civil infrastructure, aerospace, and oil and gas. Manual inspection relies on human expertise, making it time consuming, subjective, and error prone. Conventional image processing methods (thresholding, edge detection, texture analysis) have limited success, especially for small or complex defects. Recent advances in artificial intelligence (AI) and deep learning (DL) have transformed defect inspection by enabling automatic feature learning from images. Convolutional neural networks (CNNs) and YOLO models show strong performance in image classification. CNNs have demonstrated strong capability in learning hierarchical spatial, and texture features directly from data, eliminating the need for manual feature extraction. At the same time, YOLO-based architecture has been widely adopted for real-time vision tasks due to its efficient end-to-end learning and high inference speed, especially in industrial inspection applications [5,6]. This section reviews state-of-the-art deep learning approaches for surface defect classification, with a focus on multi-class tasks. Special attention is given to corrosion detection. The review covers architecture, datasets, and training strategies; highlights achievements, limitations, and challenges; and provides a basis for developing a framework to classify seven types of surface defects.

2.2. Corrosion Detection Using Deep Learning

Corrosion is a critical surface defect in civil, aerospace, and oil and gas industries, affecting structural integrity. Detection is challenging due to variations in color, texture, and reflectivity. For civil infrastructure inspection, bounding-box-based object detection methods are often insufficient for detailed structural analysis, as they provide only coarse defect localization without precise boundary information. This limitation has been highlighted in several studies, where pixel-level understanding is required for accurate assessment of structural damage in complex environments [7]. Automated approaches include color tracking and deep learning: CNN-based binary classification with transfer learning and SSD object detection successfully detected corrosion on ship hulls, outperforming color tracking [8]. In aerospace, deep neural networks with transfer learning on DAIS images achieved over 93% accuracy, comparable to that of human inspectors, thereby supporting automated maintenance [9]. CorrDetector, an ensemble CNN framework, extracted corrosion features from drone images of telecom towers, exceeding current methods [10]. A modified deep hierarchical CNN with 16 convolution layers and a Cycle GAN improved pixel-wise segmentation on civil infrastructure images, outperforming PSPNet, DeepLab, and SegNet [11]. RustSEG enables automated per-pixel corrosion segmentation without labeled datasets, overcoming a major inspection limitation [12]. Authors in [13] investigated a broad spectrum of YOLO family models from v5 to v9 and achieved the highest mAP score of 96.4% on the CORROD dataset with a 4 ms detection time. YOLOv3-tiny with DSConv layers, CBAM, three-scale detection, and focal loss detected four corrosion types, with a mAP of 84.96%, 20.18 FPS on an NVIDIA Jetson TX2, and a 6.1 MB model size [14]. UAV-based Mask R-CNN detected corrosion in industrial roofs from 8k annotated images, handling complex backgrounds and poor lighting [15]. YOLOv3 with transfer learning effectively detected corrosion in concrete structures in real-time [16]. Drone-captured images analyzed with a CNN (MobileNet V1 SSD) achieved 84.66% accuracy across 200 images [17]. Pipeline defect classification using decision tree, random forest, SVM, and logistic regression achieved 99.9% accuracy with the decision tree [18]. CNN, YOLOv8, and EfficientNetB0 improved corrosion detection: CNN and EfficientNetB0 reached 100% accuracy, precision, recall, and F1-score, while YOLOv8 achieved 95%, 100%, 90%, and 94.74%, outperforming prior methods [19].
Table 1 summarizes the literature review on deep learning based corrosion detection.

2.3. Deep Learning for Surface Defect Classification

Surface defect classification assigns images to categories based on visual features, such as texture, color, and shape. CNNs and YOLO dominate due to automatic feature extraction. An unsupervised ML classifier using VGG16 on the NEU Steel Surface Defect Database achieved 99.4 ± 0.16% accuracy with PCA and k-means clustering [20]. Drone-captured corrosion images, analyzed using MobileNet V1 SSD, achieved 84.66% accuracy [17]. DL models on GC10 DET improved recall and mAP to 95%; YOLOv5 outperformed multi-template matching [21]. Authors in [22] investigated several transformers and transfer learning for surface defect detection on the NEU dataset. ViT and DenseNet201 achieved the highest accuracy of 100%, with training delays of 270.49 s and 178.02 s, respectively, while VGG16 and VGG19 with kNN achieved 79.6% and 83.3% accuracy, with significantly reduced training time. The improved CFE-YOLOv8, combining CNNs and transformers with feature fusion, achieved mAP@0.5 scores of 77.8% and 69.5% on the NEU-DET and GC10-DET datasets, respectively, outperforming YOLOv8 [23,24]. ML models using synthetic 3D point clouds detected additive manufacturing defects, with bagging and random forest performing best [25]. VGG16 and Xception with transfer learning classified SLS powder bed defects, with VGG16 achieving an accuracy of 0.958, a precision of 0.939, a recall of 0.980, an F1-score of 0.959, and an AUC of 0.982 [26]. GANs generated synthetic images for data augmentation, improving CNN sensitivity to 95.33% and specificity to 99.16% on NEU-CLS [27]. Pre-trained ResNet-101 with multi-class SVM classified tapered roller defects effectively with minimal datasets [28]. An improved ResNet50 with an enhanced Faster R-CNN achieved 98.2% accuracy in steel surface defect detection while reducing runtime [29]. YOLOv5s with CBAM and a small-scale detection layer improved detection of ceramic tile defects, efficiently handling small flaws [30]. Ensemble deep learning with RetinaNet models using ResNet and VGG backbones enhanced SEM image defect detection in aggressive pitches and thin resists, denoised images, and improved mean average precision for challenging defect categories [31].
Table 2 summarizes the review of literature on deep leaning based surface defect classification.

2.4. Summary and Research Gaps

Research studies indicate that deep learning techniques, including CNNs and YOLO-based models, have proven highly accurate, robust, and efficient for surface defect identification, especially for multi-class classification. Studies that focus solely on corrosion reveal extensive knowledge of the specific visual characteristics associated with this defect type. In contrast, studies investigating a broader range of defects across multiple industries and materials demonstrate the adaptability and scalability of deep learning-based systems. Despite the successes of deep learning techniques in classifying a wide variety of surface defects (including corrosion) in industrial environments, several areas remain where additional research would be beneficial: most datasets used to train CNN models are small and/or contain a limited diversity of defects. Most works focus either on single defect types or on localization/segmentation rather than image-level classification. Limited studies integrate eight or more defect types in a single classification framework without relying on bounding boxes or segmentation. This research will address the identified research gaps by developing a deep learning-based approach to identify eight distinct types of surface defects using the VGG16 model with transfer learning, as well as YOLOv8. Including corrosion as one of the eight defect types enables the model to detect both chemical and mechanical anomalies, thereby improving its generalization when inspecting surfaces in the field.

3. Materials and Methods

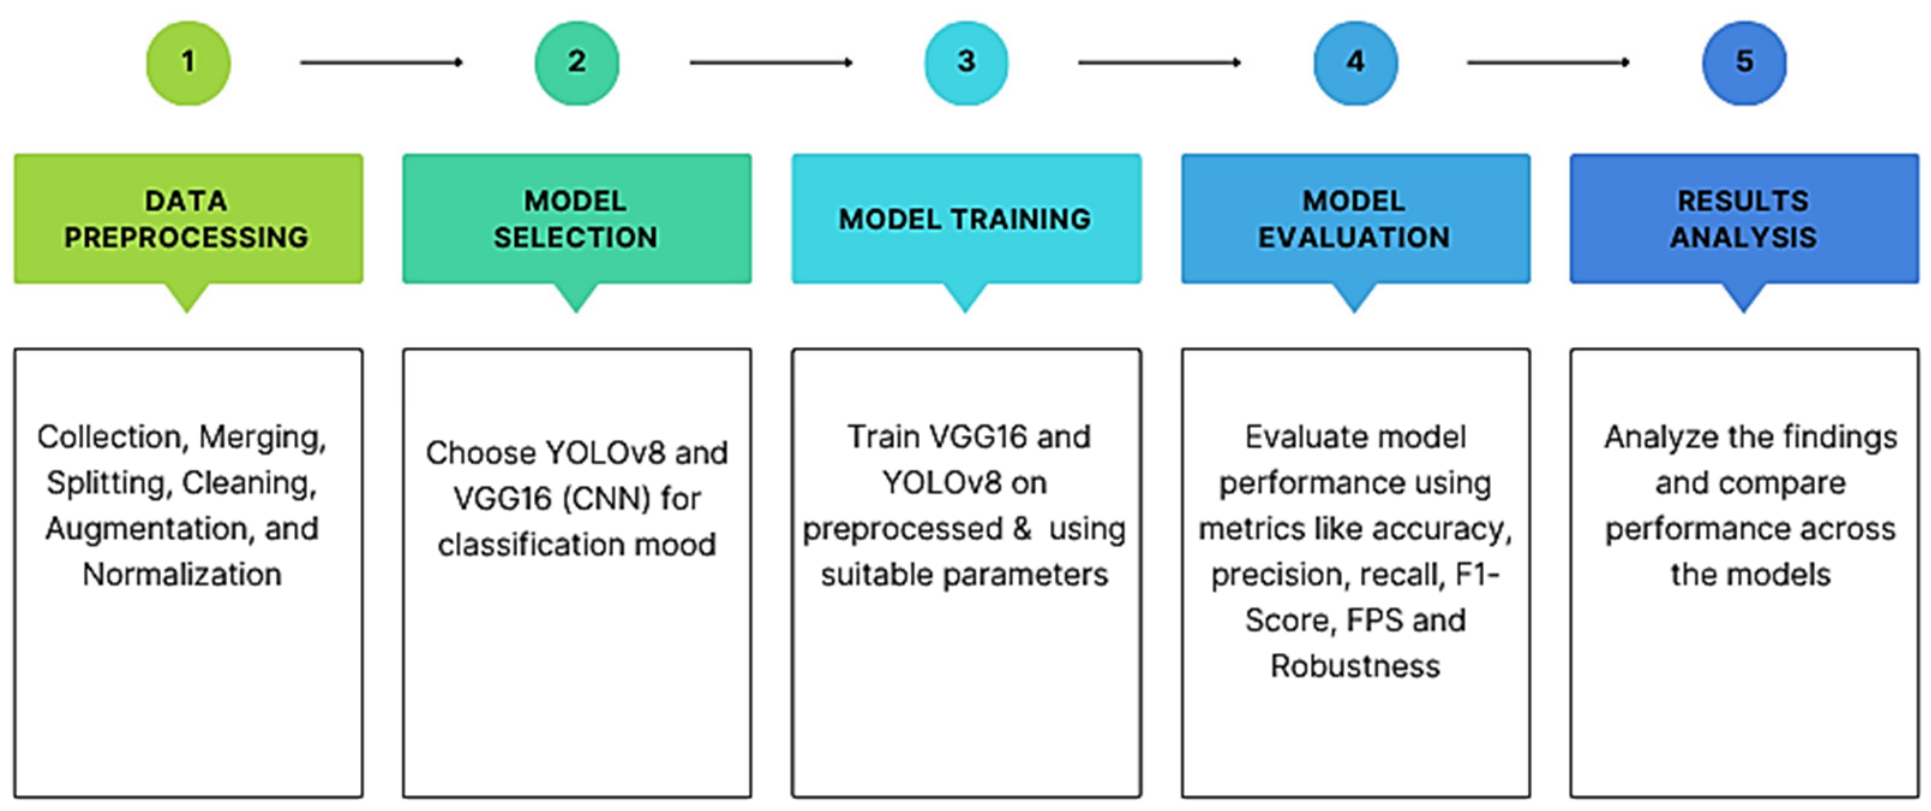
The diagram in Figure 1 illustrates the methodological steps used in the proposed study, beginning with data preprocessing, which includes data collection, cleaning, augmentation, and normalization. Subsequently, suitable models (VGG16 and YOLOv8) were selected for training on the processed dataset. The evaluation of model performance used standard metrics, including accuracy, precision, recall, F1-score, FPS, and robustness, followed by an analysis and comparison of the results.

3.1. Dataset Description

This study employs two complementary datasets to train and evaluate deep learning models aimed at automated classification of surface defects in industrial materials. A merged dataset was created by combining two sources, the Phase5_Capstone Corrosion Dataset and the NEU Surface Defect Database, to enhance model generalization, enabling the models to detect both corrosion and surface defects on industrial surfaces.

3.1.1. Phase5_Capstone Corrosion Dataset

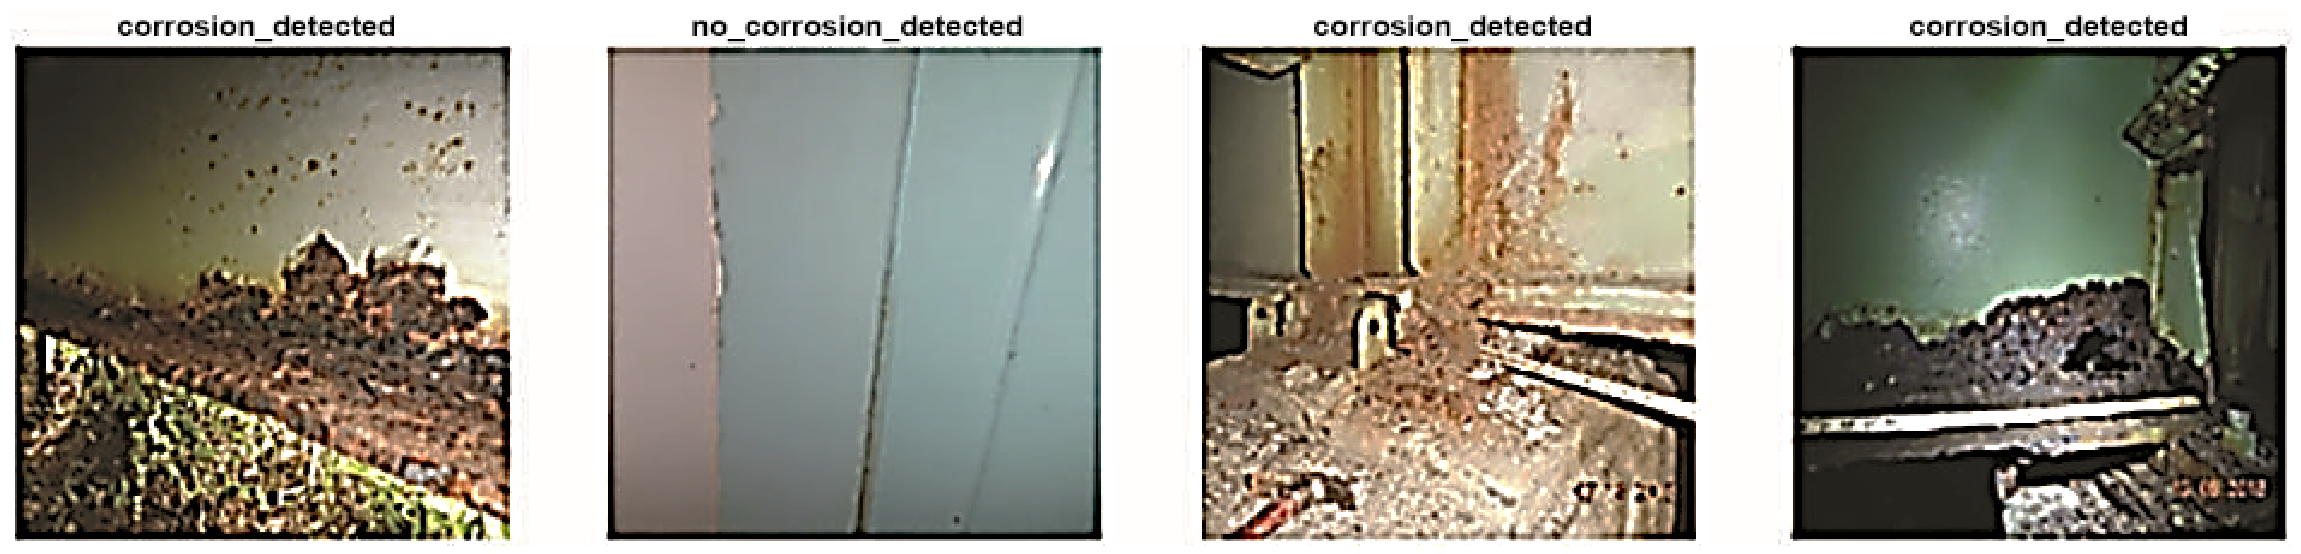
The Phase5_Capstone dataset is a collection of images that display various types of corrosion on metal and concrete surfaces. This project was initially created for a university capstone and is available for free on GitHub. The collection includes 1819 images, sourced through automated search tools from Google Images and meticulously labeled by a corrosion engineer. Every image is classified into one of two groups: corrosion (990 images) or no corrosion (829 images). This dataset showcases a range of surface defects, illustrating different real-world corrosion situations. The images differ in quality, lighting, and background conditions, making the dataset a true reflection of real-world scenarios. The variety present is crucial for developing deep learning models that can effectively carry out reliable classification in real-world industrial settings [3]. Figure 2 shows sample images from the Phase5_Capstone dataset.

3.1.2. NEU Surface Defect Database

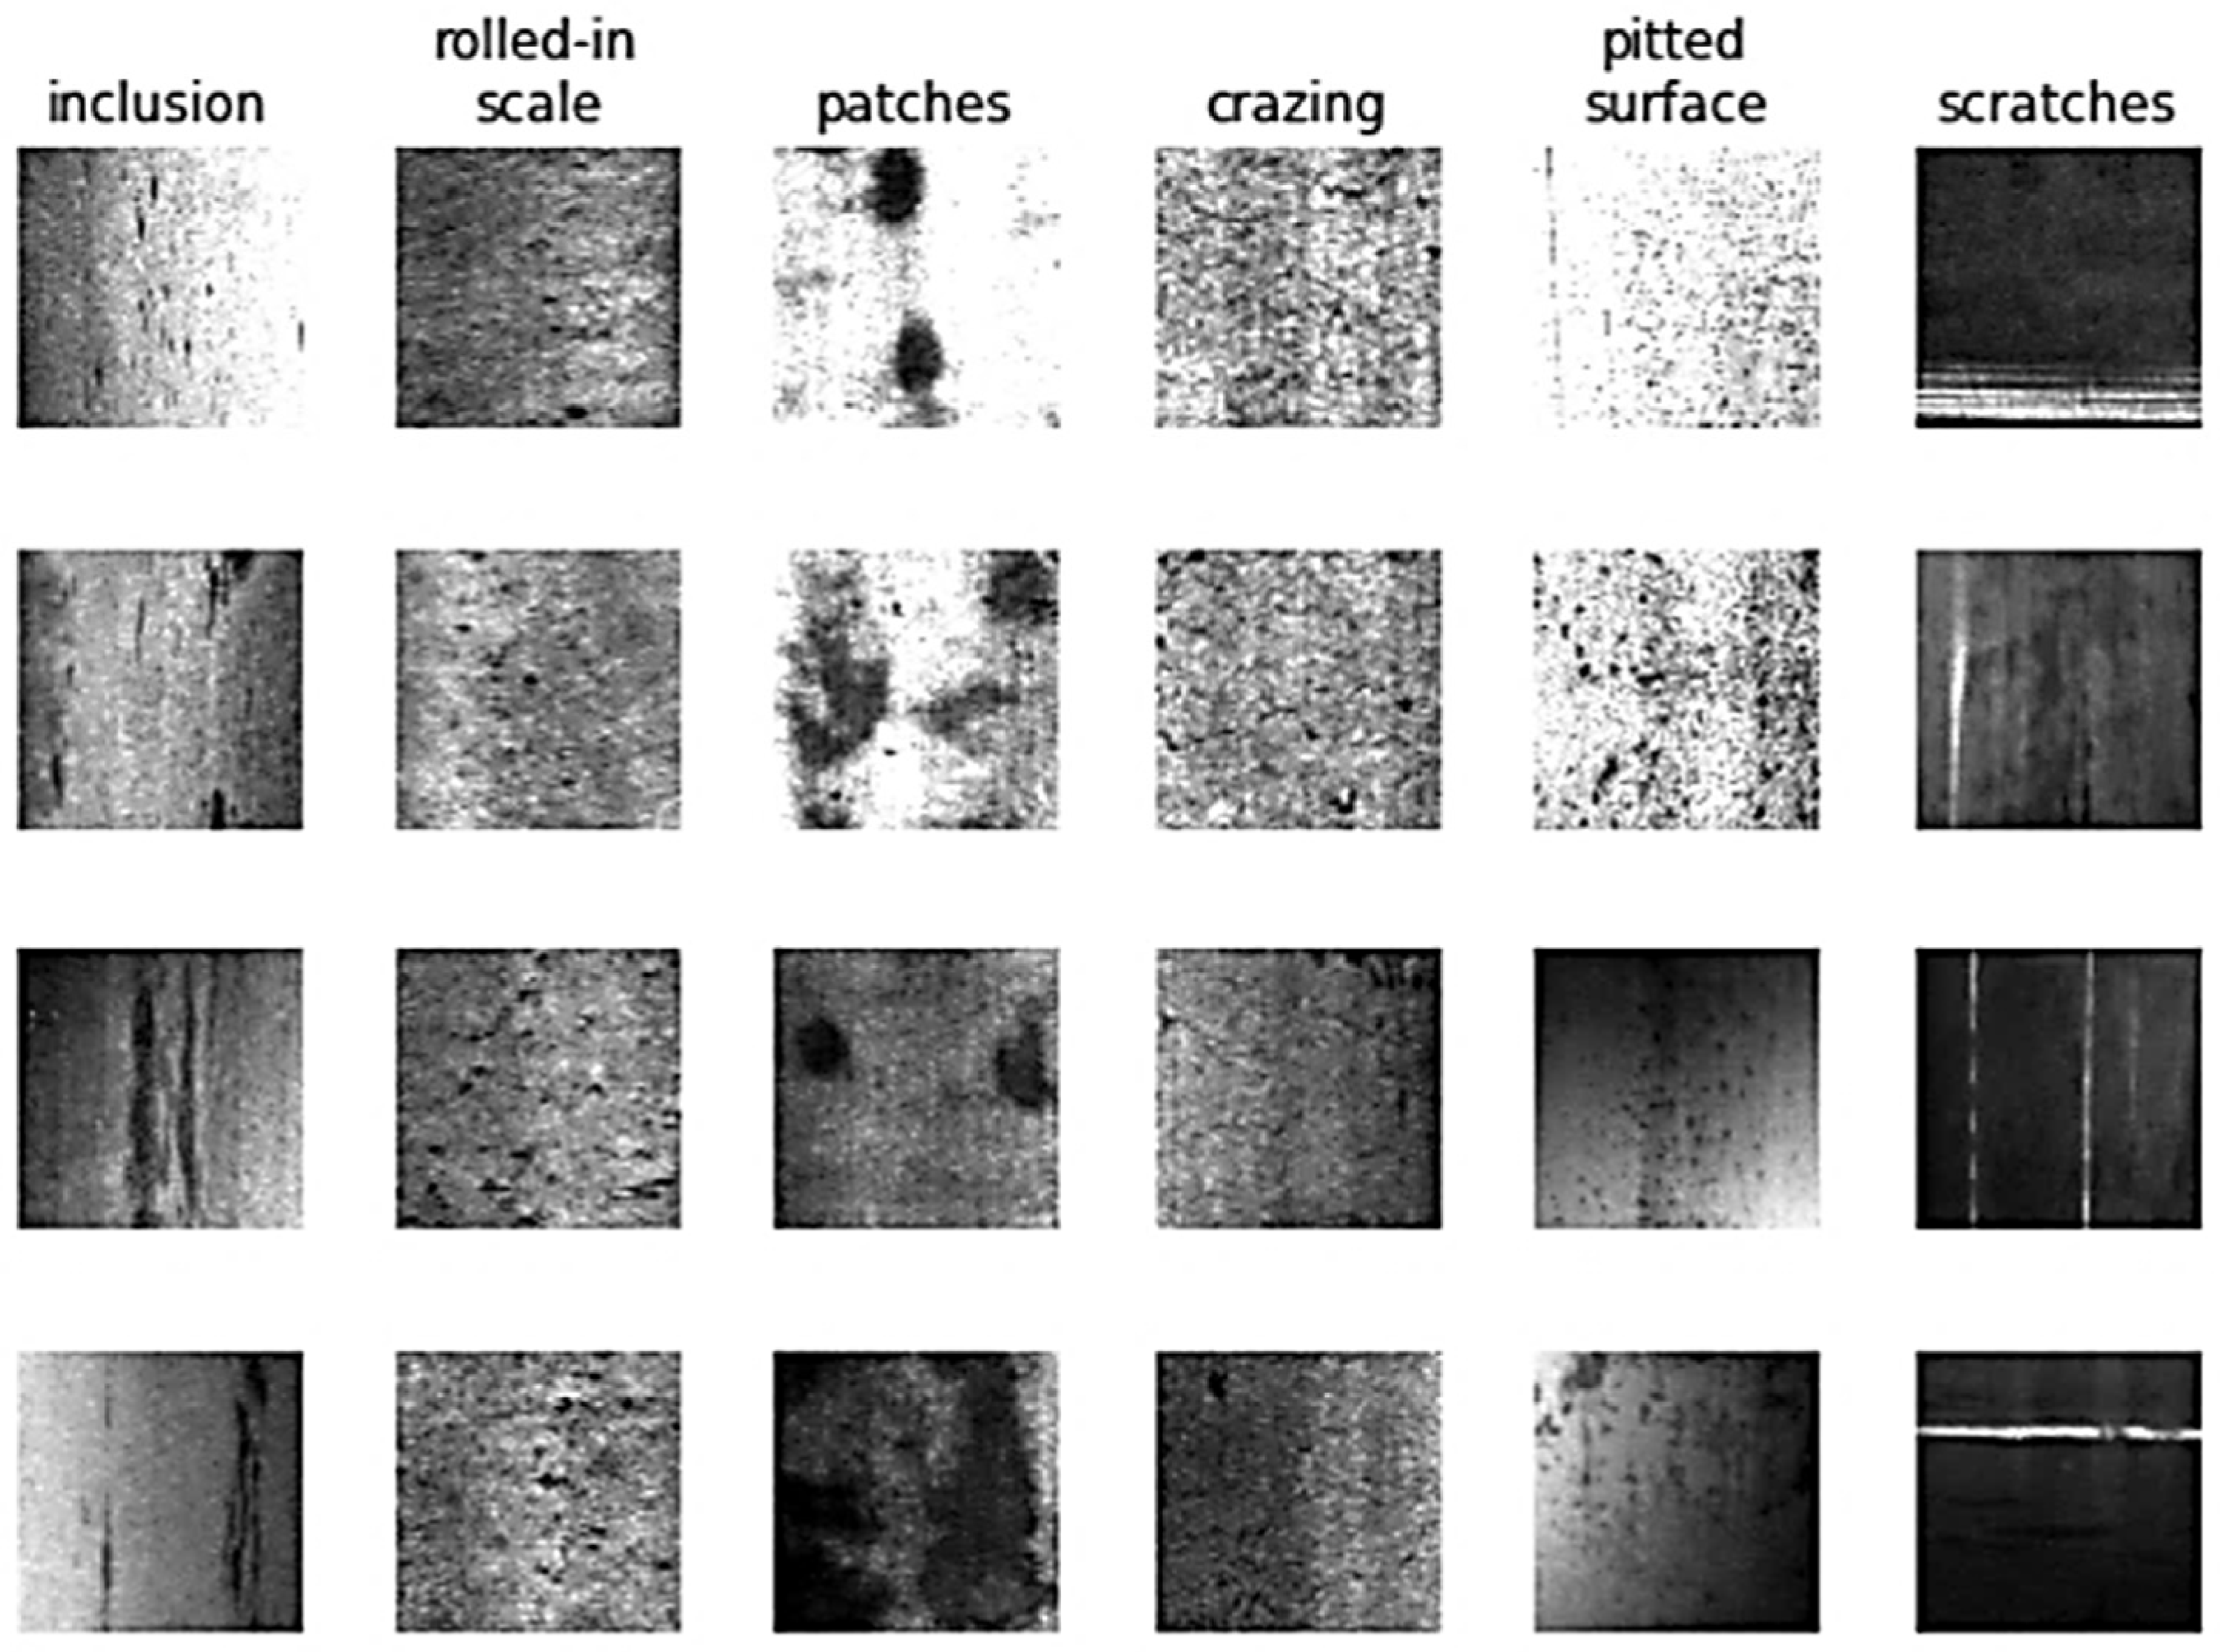
The NEU Surface Defect Database is a publicly accessible dataset that is designed to identify surface defects on hot-rolled steel strips. The dataset consists of 1800 grayscale photographs, each with a resolution of 200 × 200 pixels, which are uniformly distributed among six defect categories: crazing, inclusion, patches, pitted surface, rolled-in scale, and scratches. Each type contains 300 images, providing a set of balanced data suitable for multi-layer classification tasks. These defects are common in the treatment of industrial steel and are related to the components of oil and gas infrastructure, such as pipes, tanks and pressure vessels [4]. Figure 3 shows sample images for each of the six defect types in the NEU dataset.

3.1.3. Merged Dataset Preparation and Preprocessing

The integrated dataset combines the Phase5 Capstone Corrosion Dataset [3] and the NEU Surface Defect Database [4], enabling classification of both corrosion and surface defects. The unified dataset has eight categories: six surface defects from NEU (patches, crazing, inclusion, pitted surface, rolled-in scale, scratches) and two corrosion categories from Phase5 (no corrosion, corrosion).
The following careful considerations were made: both datasets were processed to the same size and channels and merged, classes were balanced, augmentations were applied, a baseline model was trained on defects and finetuned on corrosion images, and finally, the models were evaluated and optimized.
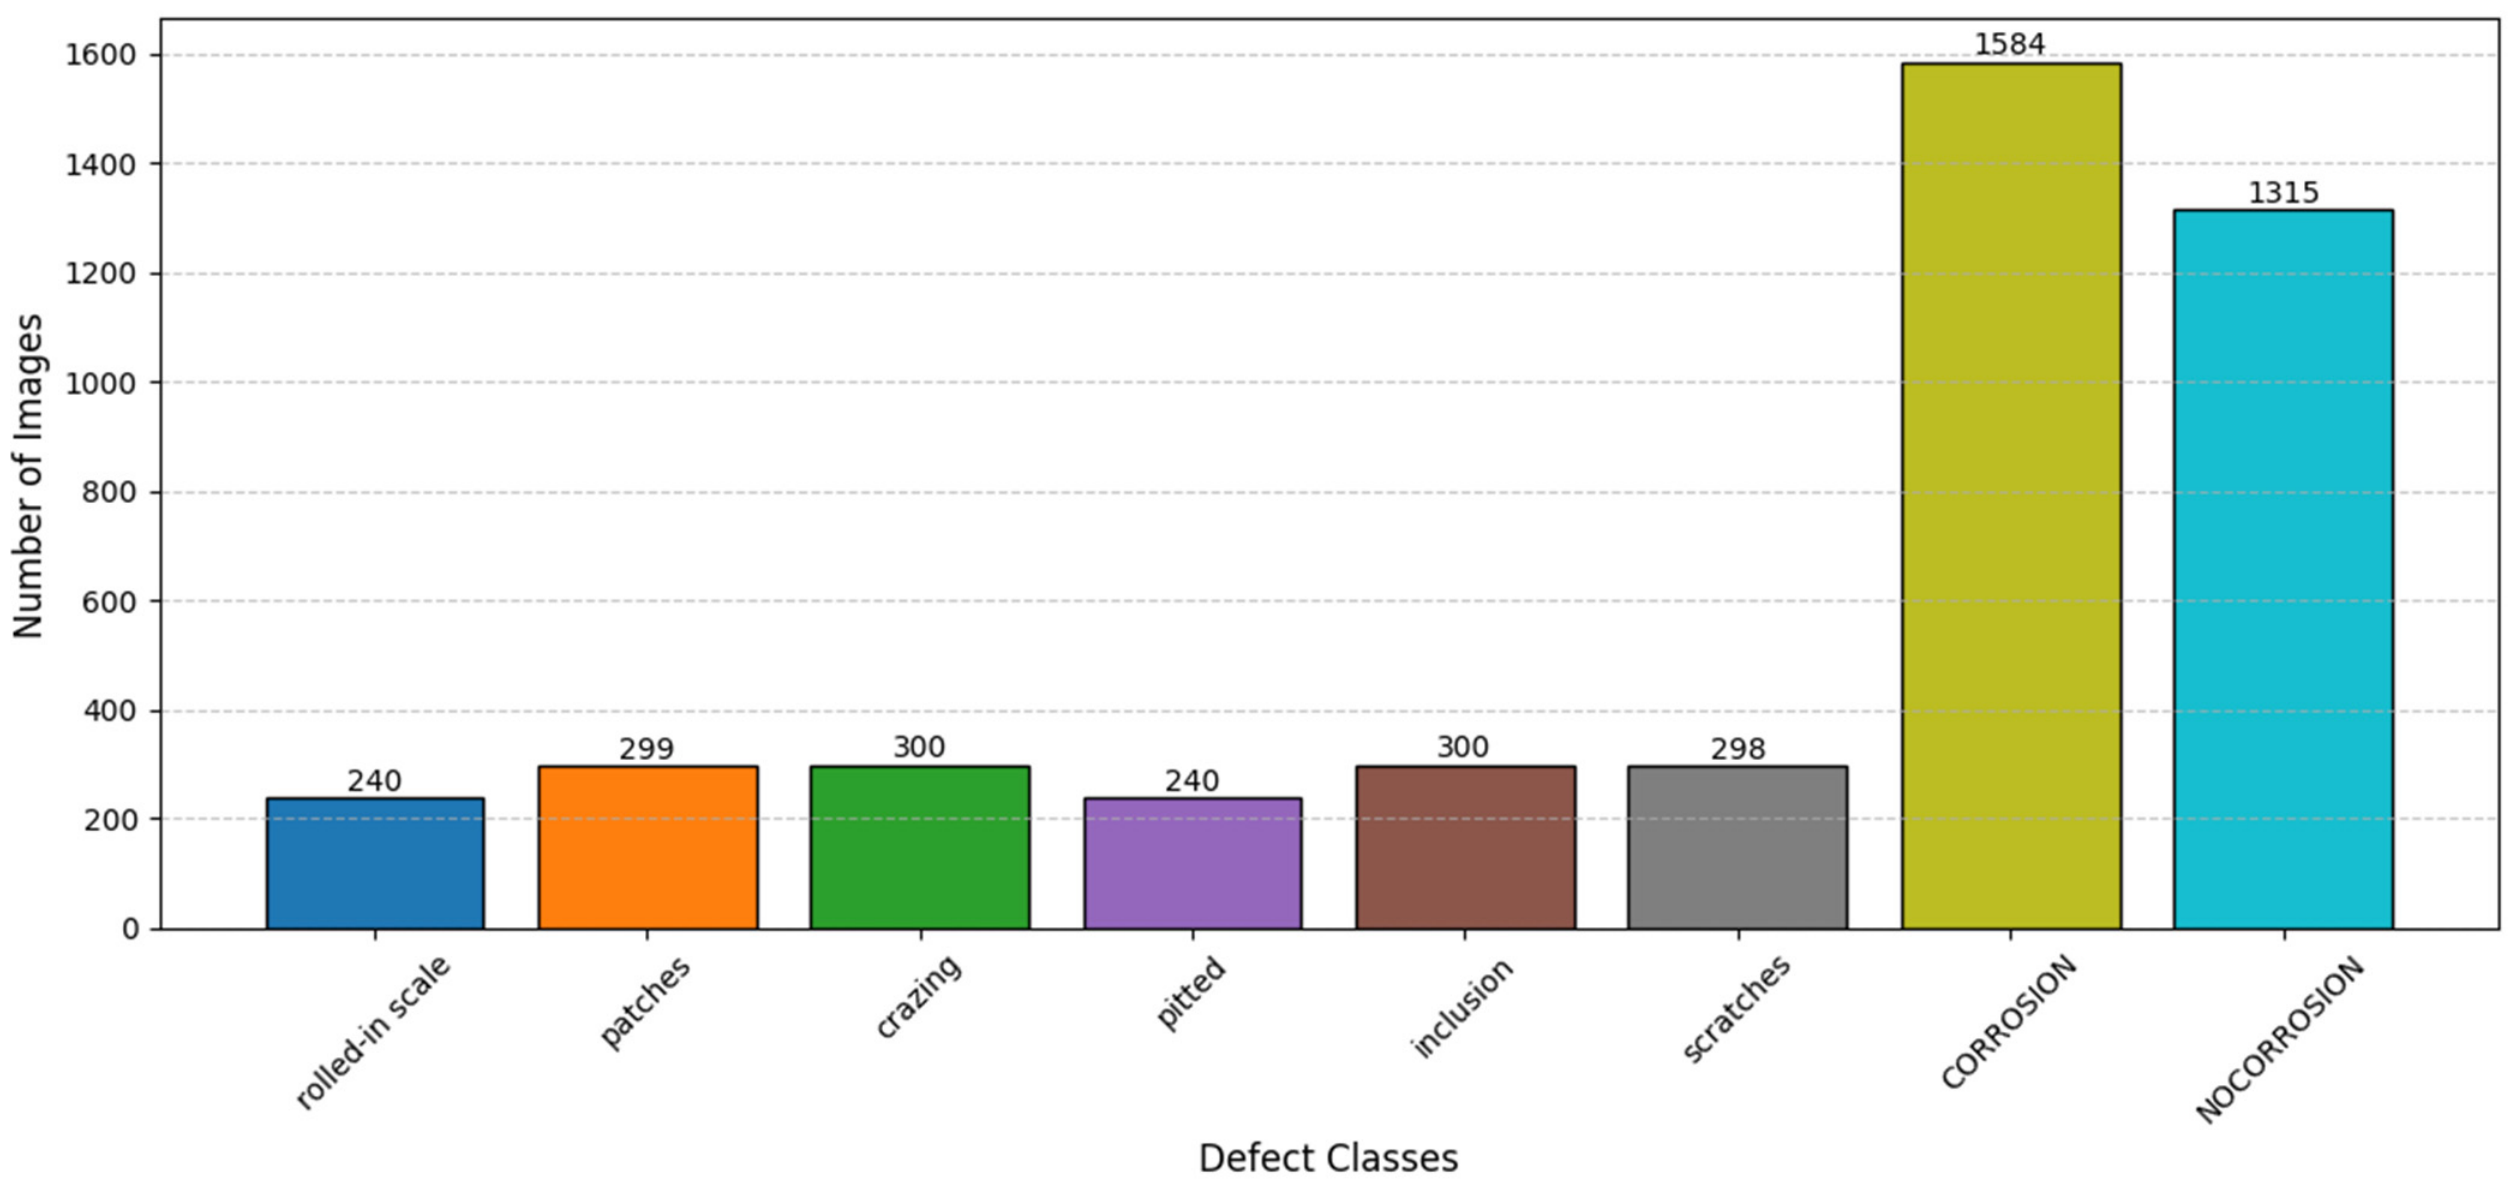
After preprocessing and dataset fusion, the data were divided into training (80%), validation (10%), and test (10%) subsets using stratified sampling to maintain class balance across all categories. The independent test set was reserved exclusively for final model evaluation and was not used during model development. To obtain a robust estimate of model performance, both stratified 10-fold cross-validation and standard 10-fold cross-validation were conducted on the training subset only. The validation subset was used for model selection and hyperparameter monitoring, while the test subset was used exclusively for final performance assessment. Although the Phase5 Capstone Corrosion Dataset and the NEU Surface Defect Database originate from different industrial domains and acquisition environments, they share a common objective: the identification of visually observable surface degradation patterns. The merged dataset was designed to represent a broader industrial defect classification benchmark rather than a single domain dataset. To improve consistency, all images underwent a unified preprocessing pipeline, including data cleaning, resizing to 224 × 224 pixels, normalization, and stratified dataset partitioning, while preserving their original image format. This unified framework allows the evaluation of model generalization across heterogeneous defect sources while preserving clearly defined defect categories. Figure 4 shows the number of images per defect class in the training dataset: rolled-in scale, patches, crazing, pitted, inclusion, scratches, corrosion, and no corrosion. No class labels were modified during the fusion process; instead, each defect category was retained as an independent class in the final benchmark dataset.

3.2. Data Preprocessing and Data Augmentation

3.2.1. Data Preprocessing

Before inputting the images into the deep learning models, several preprocessing steps were performed:
  • Resizing: All images were resized to 224 × 224 pixels to align with the input requirements of the VGG16 model and to ensure consistency across both datasets.
  • Normalization: Each pixel value was adjusted to fit within the [0, 1] range by dividing it by 255. This normalization speeds up convergence during training and ensures a more stable learning process.
  • Data Cleaning: An automated Python 3.11 script was used to remove corrupted, incomplete, or hidden image files, ensuring that the dataset remains consistent and minimizing the risk of training errors.
  • Split: The dataset was split into training (80%), validation (10%), and test (10%) sets to guarantee a balanced representation of all eight categories in each subset.
  • Stratified k-fold cross-validation: To ensure the fairness of the model, stratified k-fold cross-validation was used to preserve class balance.

3.2.2. Data Augmentation

The augmentation enables the model to adapt to changes in the type of variation, specifically rotation, scale, and orientation. It is important for industrial inspections because defects often occur at various locations on an object or in different environments. Augmentation techniques used included: random rotations (±20°), width and height shifts (up to 20%), zooming, shearing and horizontal flips. It is worth mentioning that the validation and test sets received no augmentation, ensuring unbiased performance. This approach ensures that the reported metrics accurately reflect the models’ ability to generalize to previously unseen, unaltered images.

3.3. Deep Learning Models

3.3.1. YOLOv8 Model

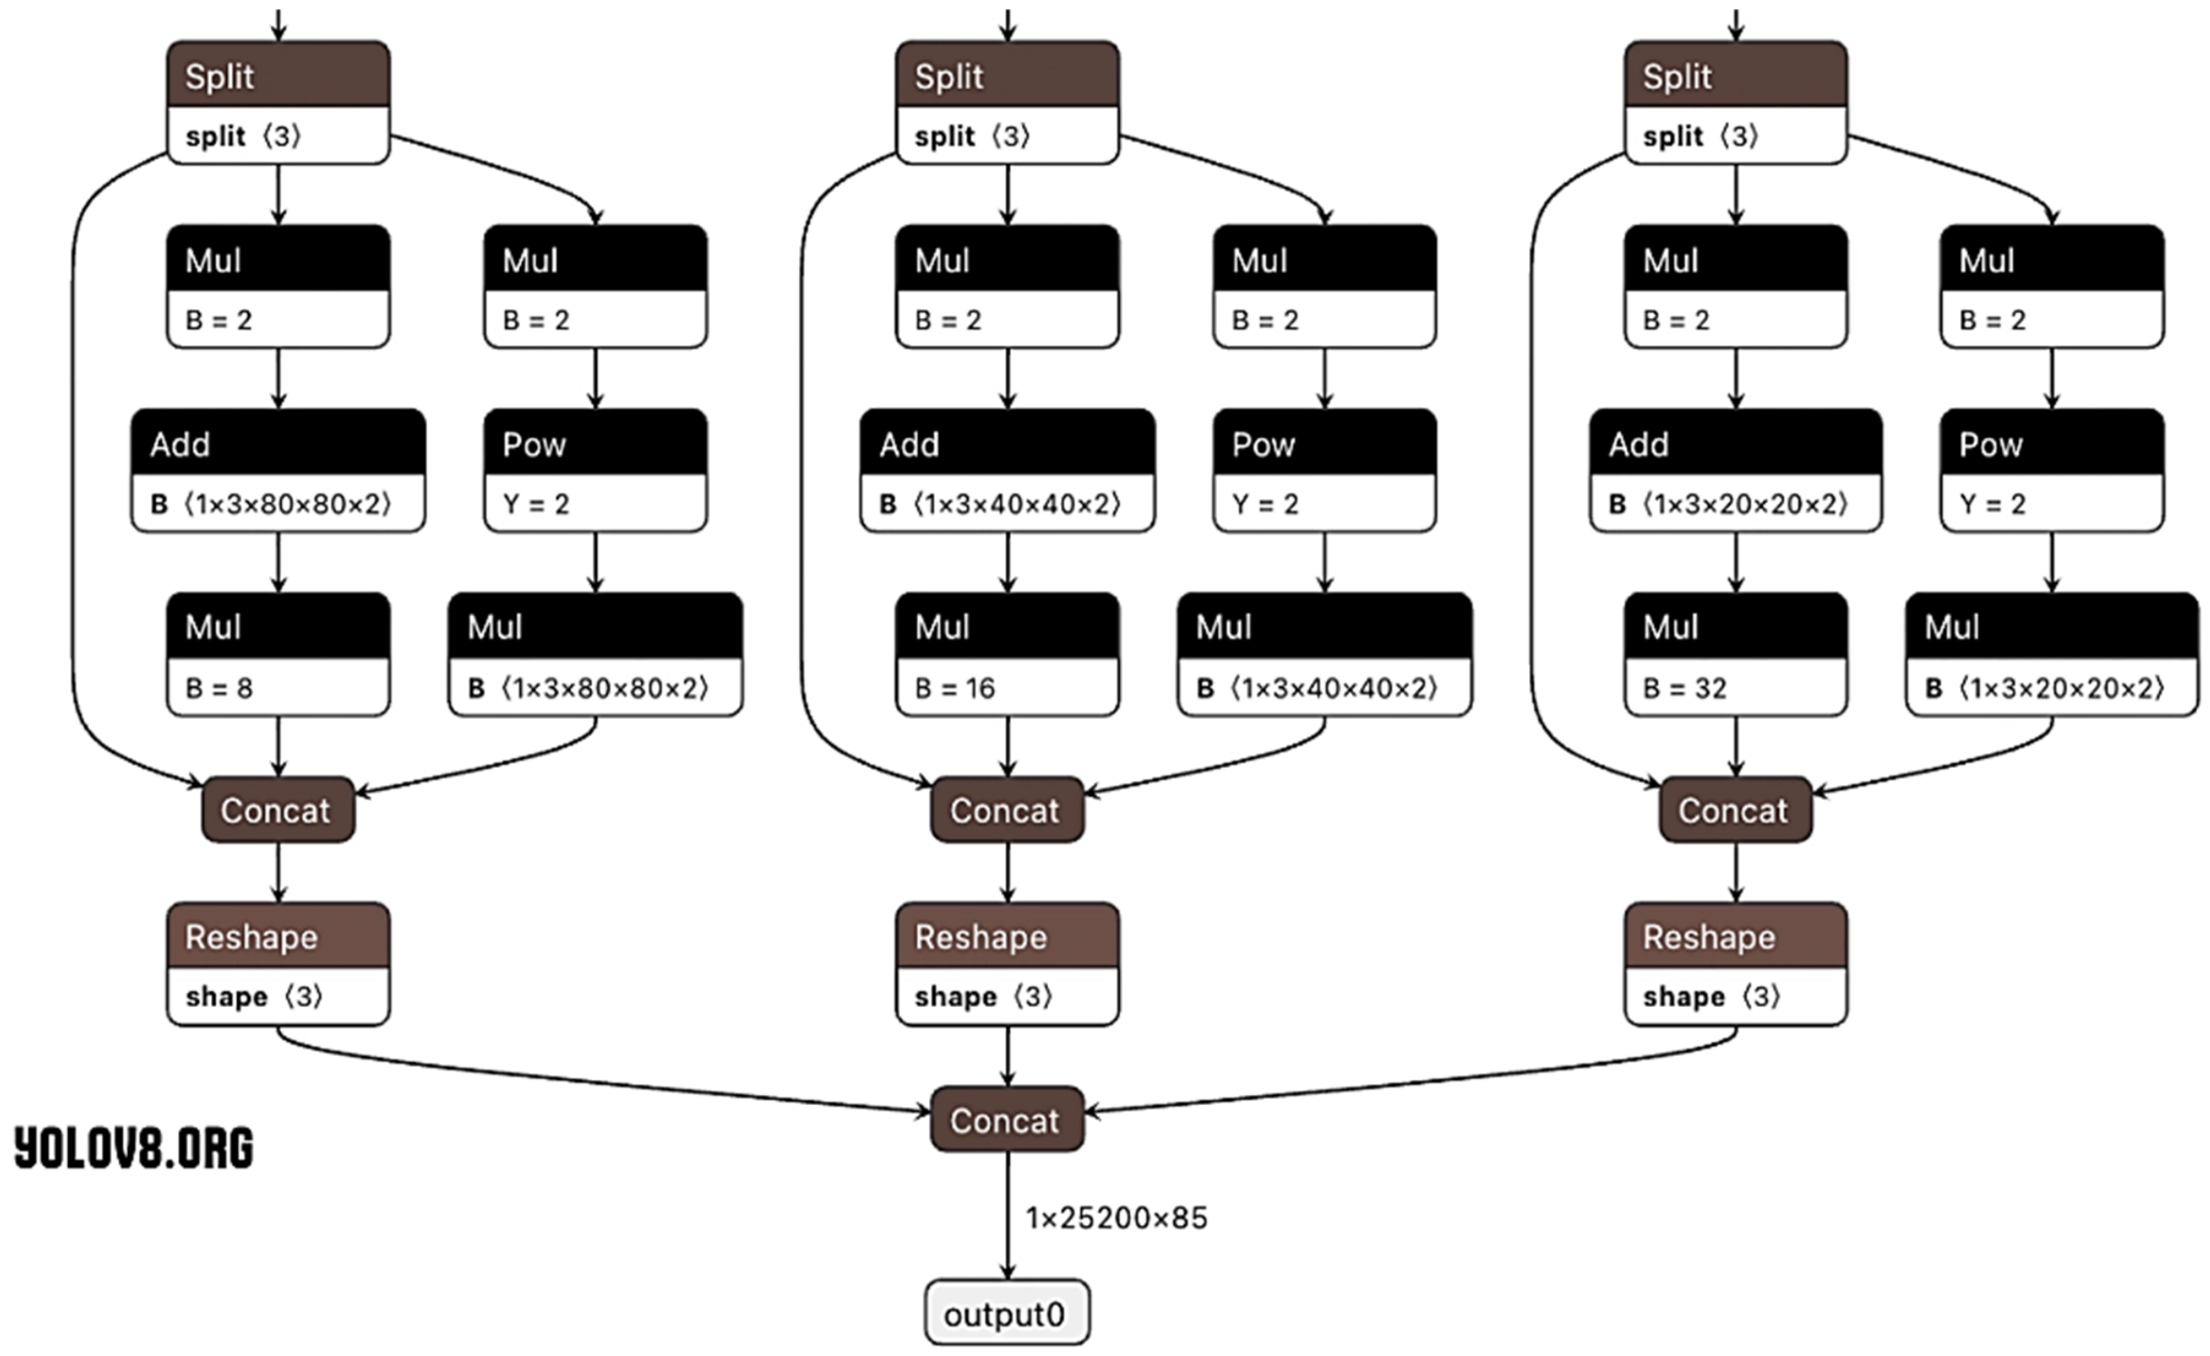
YOLOv8 is a modern variant of the You Only Look Once (YOLO) family, known for its speed and accuracy. Developed by Ultralytics [32,33], YOLOv8 improves on YOLOv5 with architectural and usability enhancements, maintaining high accuracy while allowing single-GPU training. YOLO is widely used for object detection, classification, and segmentation. YOLOv8 has five variants (YOLOv8n, s, m, l, x), balancing speed and accuracy. Its backbone is a modified CSPDarknet with cross-stage partial connections to improve gradient flow and reduce computational redundancy. The neck uses the C2f module for fusing low-level spatial and high-level semantic features. The head outputs class probabilities for target categories [34].
Figure 5 illustrates the backbone, neck, and head components. In this study, YOLOv8 was selected due to its balance between computational efficiency and classification performance. Compared to larger variants, YOLOv8 offers lower model complexity and faster inference while maintaining competitive accuracy, making it suitable for industrial inspection scenarios that require both accuracy and real-time processing. The architecture has four main components: input, backbone, neck, and head. The input adjusts image dimensions and applies augmentations, including mosaic; the backbone extracts hierarchical features; the neck fuses multi-scale features; and the head performs task-specific predictions, which are applied here to image classification [33].

3.3.2. VGG16 Convolutional Neural Network

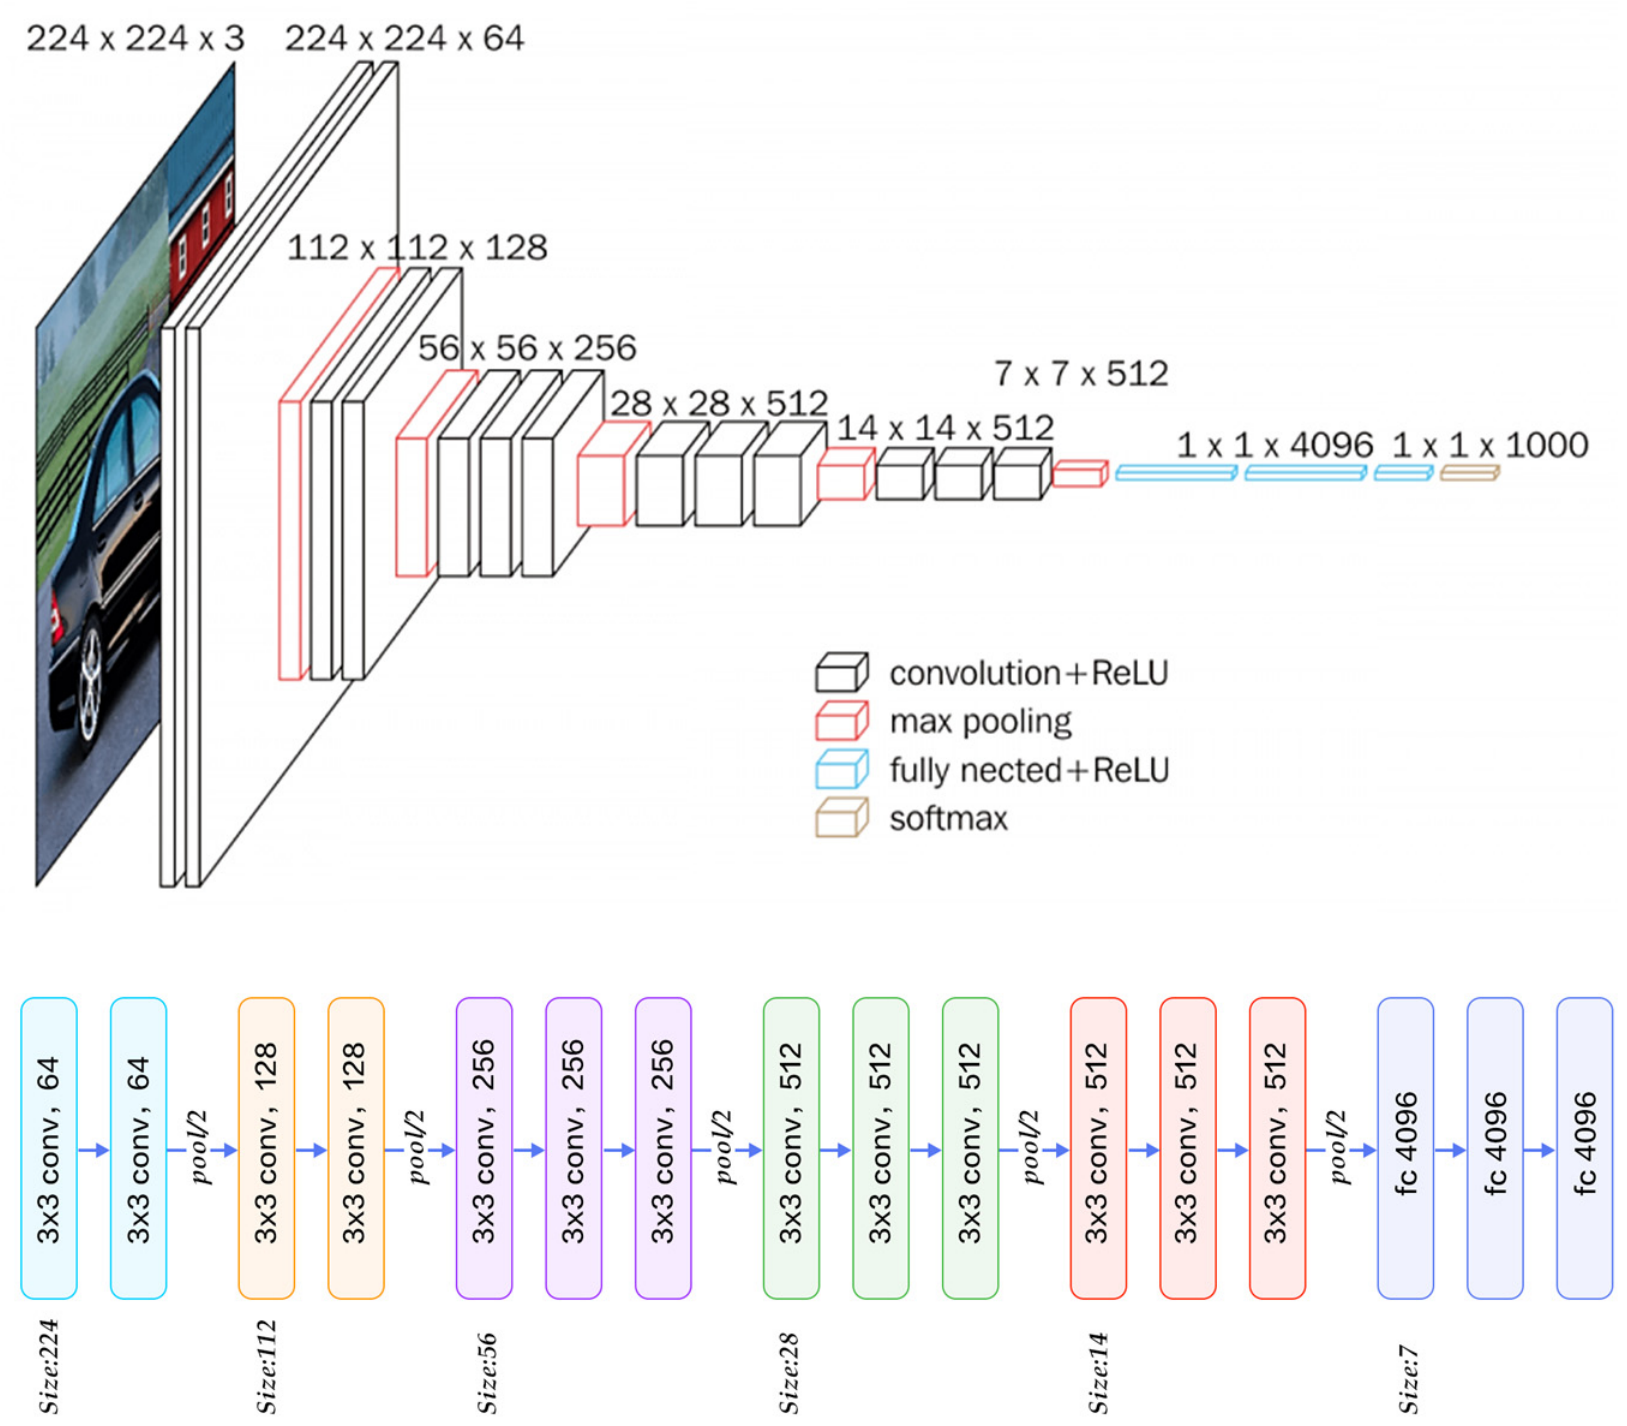
Convolutional neural networks (CNNs) are deep learning models for analyzing visual data via automatic spatial feature extraction [5]. CNNs use convolutional layers for pattern recognition, pooling layers for dimensionality reduction, and fully connected layers for classification. Non-linear activations like Rectified Linear Unit (ReLU) capture complex correlations, while backpropagation and optimizers such as stochastic gradient descent (SGD) support training [35]. This study used VGG16 for surface defect classification. VGG16 has 13 convolutional layers and three fully connected layers with small 3 × 3 filters. The convolutional and pooling layers were kept as feature extractors; the fully connected layers were replaced with a custom classifier consisting of a flattening layer, a dense layer with ReLU, dropout for regularization, and a SoftMax output layer for eight fault categories.
Pre-trained ImageNet weights improved convergence and performance [36]. Figure 6 shows the VGG architecture with 16 layers. Input images are RGB, 224 × 224, with the training set average RGB subtracted. VGG uses 3 × 3 or 1 × 1 convolution filters with a stride of 1; pooling kernels are 2 × 2 with a stride of 2. Five sequential convolutional blocks are followed by MaxPooling, with increasing numbers of convolutional layers in deeper blocks. Compared to AlexNet (which uses a single 7 × 7 convolution per layer), VGG uses 2–4 operations per layer with smaller kernels. VGG19 has 19 layers; VGG16 has 16 layers. The main enhancement of VGGNet is relatively smaller convolution kernels and more layers [37].

3.4. Model Training and Experimental Setup

Both models were trained using the same hardware to help ensure they could be compared correctly. Important training parameters included:
  • Dimensions: 224 × 224 pixels;
  • Batch size: 32;
  • Optimizer: Adam;
  • Epochs: 30 for YOLOv8; 50 for VGG16 experiments;
  • Early stop: to prevent overfitting and learning rate scheduling.

3.5. Performance Evaluation

The model’s predictive accuracy was rigorously measured using standard performance metrics. Accuracy measures the overall correctness of defect classification, including both true positives (TP) and true negatives (TN). Recall measures how many of the actual defects are detected, thereby minimizing false negative errors. Precision measures the proportion of true positive defects the model correctly identifies, thereby reducing false positives. The F1-score metric considers both metrics into one metric that reflects both precision and recall. The inference speed measure as frame per second (FPS) is an indicator of how fast the model works on image processing when testing or applying it in practice. To evaluate model robustness under noisy conditions, a Gaussian noise model was applied to the test dataset. The noise was generated with zero mean and a standard deviation of σ = 25 and was added directly to the pixel values of each image prior to evaluation. The noisy images were clipped to maintain valid pixel intensity ranges [0, 255]. The robustness evaluation was conducted by comparing model performance on both clean and noise-corrupted test sets using accuracy and weighted F1-score metrics. Formulas (1)–(6) use the conventional definitions of true positive (TP), true negative (TN), false positive (FP), and false negative (FN). Alongside these definitions, the symbols T and N stand for the overall inference time in seconds and the quantity of images utilized in FPS calculation, respectively.
A c c u r a c y = N u m b e r   o f   C o r r e c t   P r e d i c t i o n T o t a l   N u m b e r   o f   P r e d i c t i o n
P r e c i s i o n = T P T P + F P
R e c a l l = T P T P + F N
F 1 - S c o r e = P r e c i s i o n R e c a l l P r e c i s i o n + R e c a l l
F P S = N T
Robustness = A c c u r a c y   n o i s y A c c u r a c y   c l e a n
where
  • Accuracy noisy = performance under noisy input;
  • Accuracy clean = baseline performance under clean conditions.
These metrics provide a comprehensive evaluation of model performance, including classification reliability, processing speed, and resilience to noise.

4. Results and Discussion

4.1. Hyperparameter Tuning (VGG16)

This study conducted three experiments using VGG16 to assess hyperparameter optimization on surface defect classification:
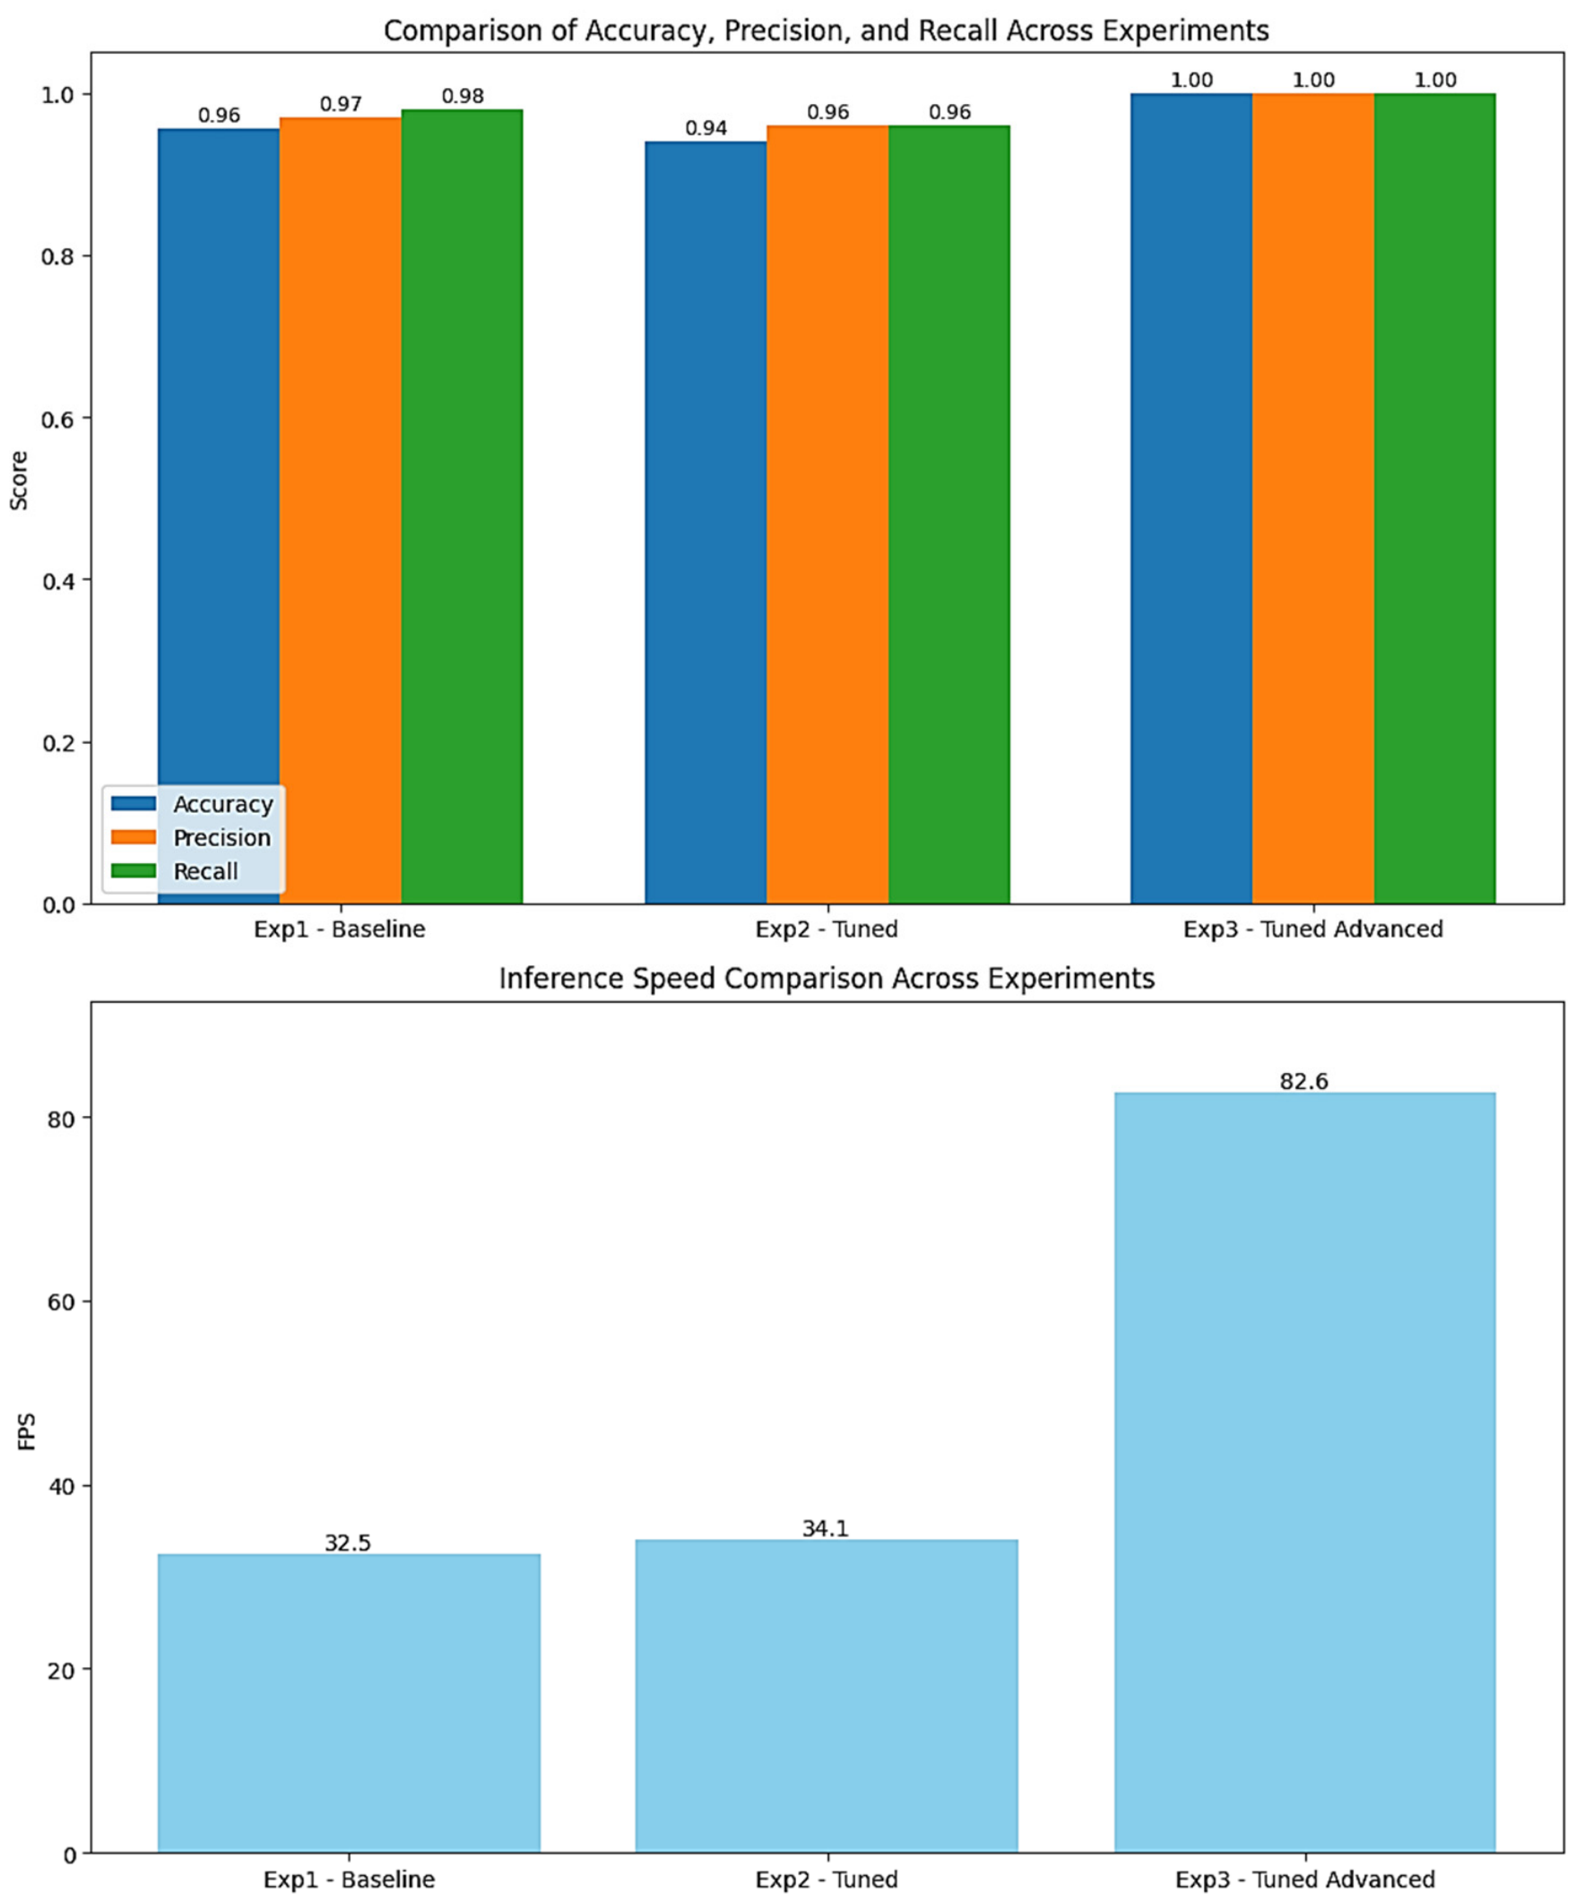
Exp1 (Baseline): Learning rate 0.001, dropout 0.5, only fully connected layers trained; convolutional layers frozen. Serves as the reference for comparison.
Exp2 (Tuned): Learning rate 0.0005, dropout 0.4, last four convolutional layers unfrozen. Tests sensitivity to smaller learning steps and slightly less regularization.
Exp3 (Tuned Advanced): Learning rate 0.0001, dropout 0.5, last four convolutional layers fine-tuned for improved stability and performance.
Figure 7 shows the experimental results: the top subplot displays accuracy, precision, and recall. Exp3 outperforms all metrics, demonstrating the cumulative benefits of optimized learning rate, dropout, and fine-tuning. Exp2 shows a modest drop in some measures compared to Exp1, highlighting model sensitivity to hyperparameter changes. The bottom subplot shows FPS: Exp3 achieves higher accuracy and faster inference (82.6 FPS). These results emphasize that careful hyperparameter selection in transfer learning enhances generalization capability of the model and maintains inference speed for surface defect classification.

4.2. YOLOv8 Model Performance

This subsection evaluates the performance of the YOLOv8s model regarding its dynamics, accuracy metrics, and processing efficiency.
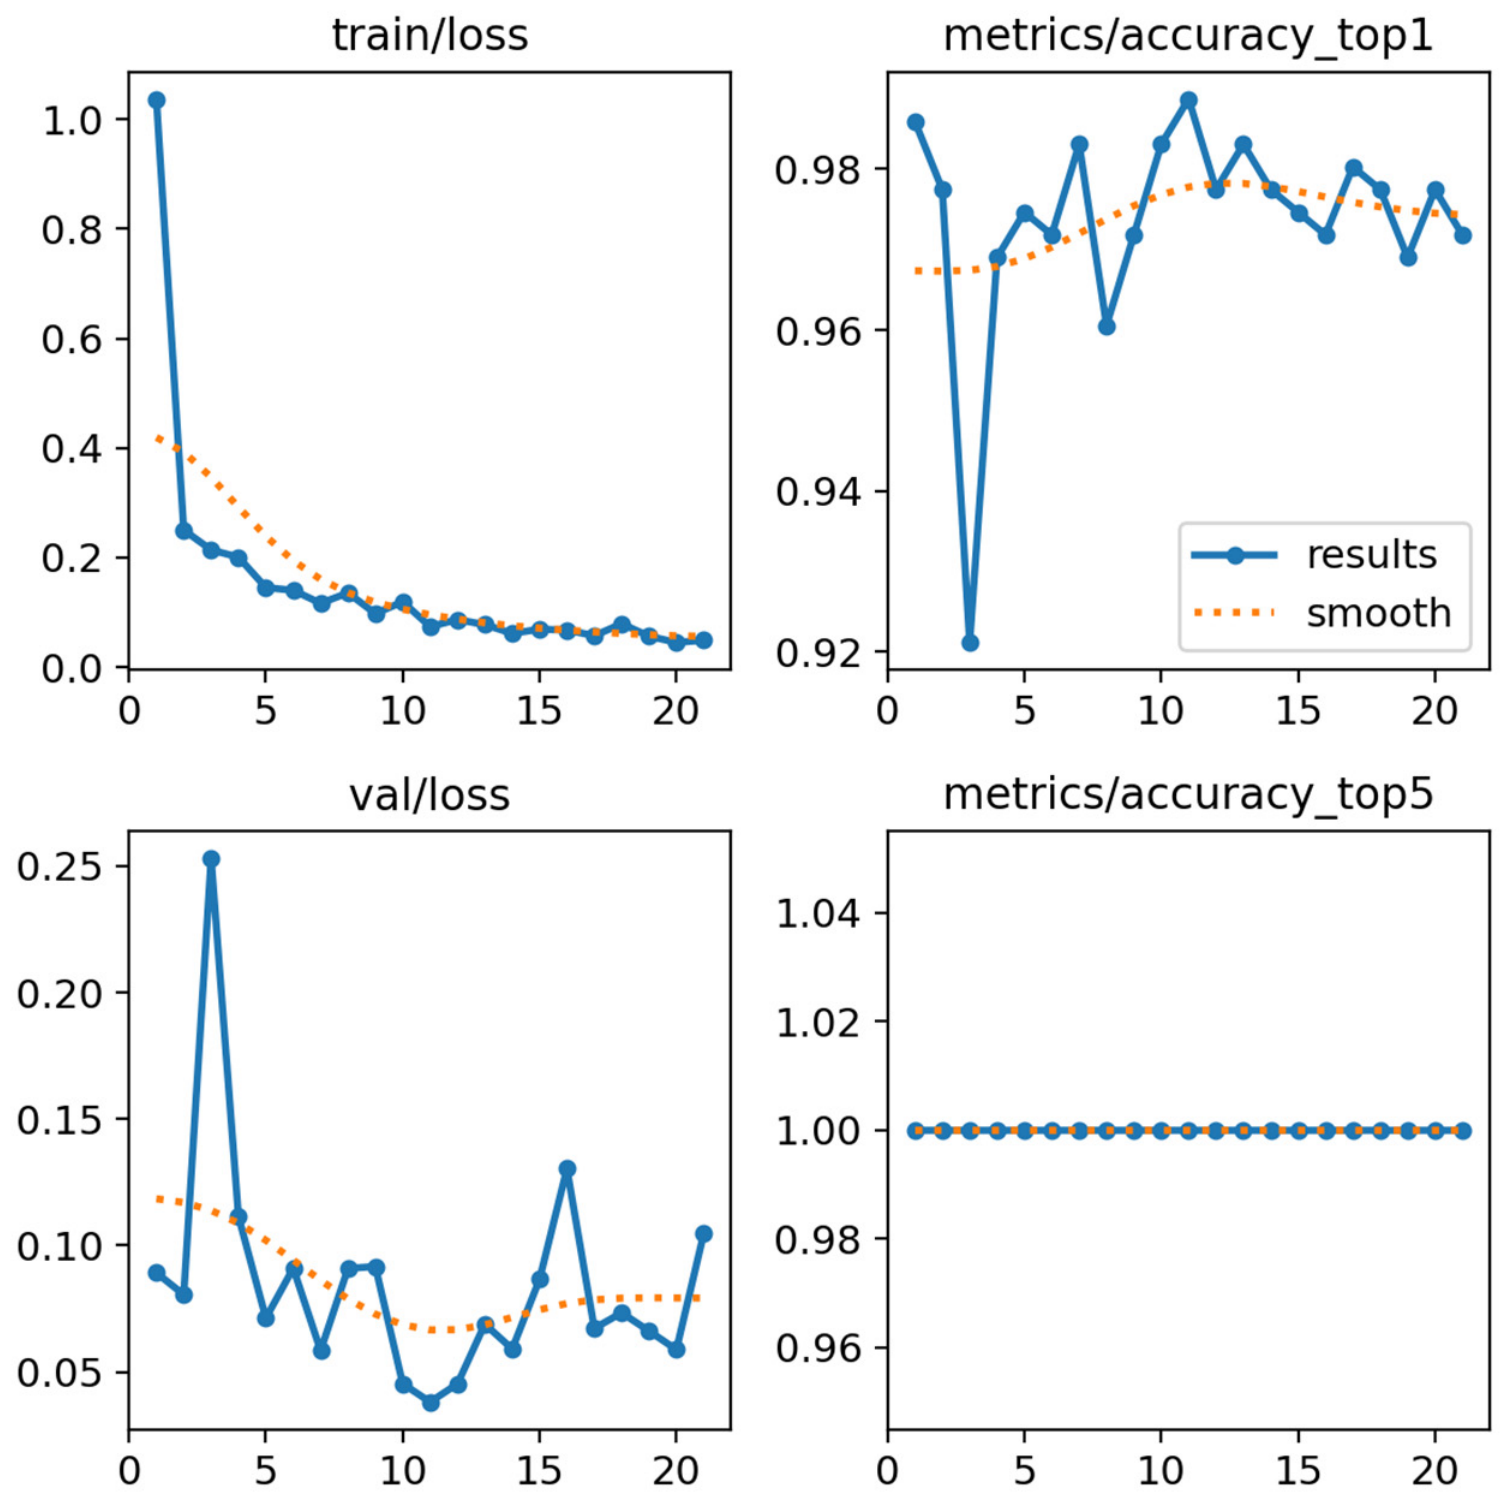
Figure 8 displays the Top-1 and Top-5 accuracy curves (right panels). The Top-1 accuracy curve (upper right) indicates that the model demonstrates near-perfect performance on the training data, consistently achieving accuracy levels between 98% and 100%, with a stable upward trend. The Top-5 accuracy curve (lower right) remains approximately constant at 100%, signifying that the accurate class is consistently among the top five predictions. These findings indicate that YOLOv8 efficiently captures the visual features within the dataset and exhibits strong performance during both training and testing stages. The left panels of Figure 7 show the training and validation loss curves. The training loss (upper left) decreases rapidly during the initial epochs and then gradually converges, indicating that the model quickly learned to distinguish between defect types and achieved convergence effectively. The validation loss (lower left) exhibits an overall downward trend, albeit with occasional spikes, which is characteristic of variance in the validation process and does not suggest pronounced overfitting, as it does not diverge from the training loss. This result suggests that YOLOv8 is robust to noise, which may be attributed to its modern architecture. To further improve generalization across diverse real-world scenarios, techniques such as advanced data augmentation, multi-domain training, and adaptive fine-tuning can be explored.
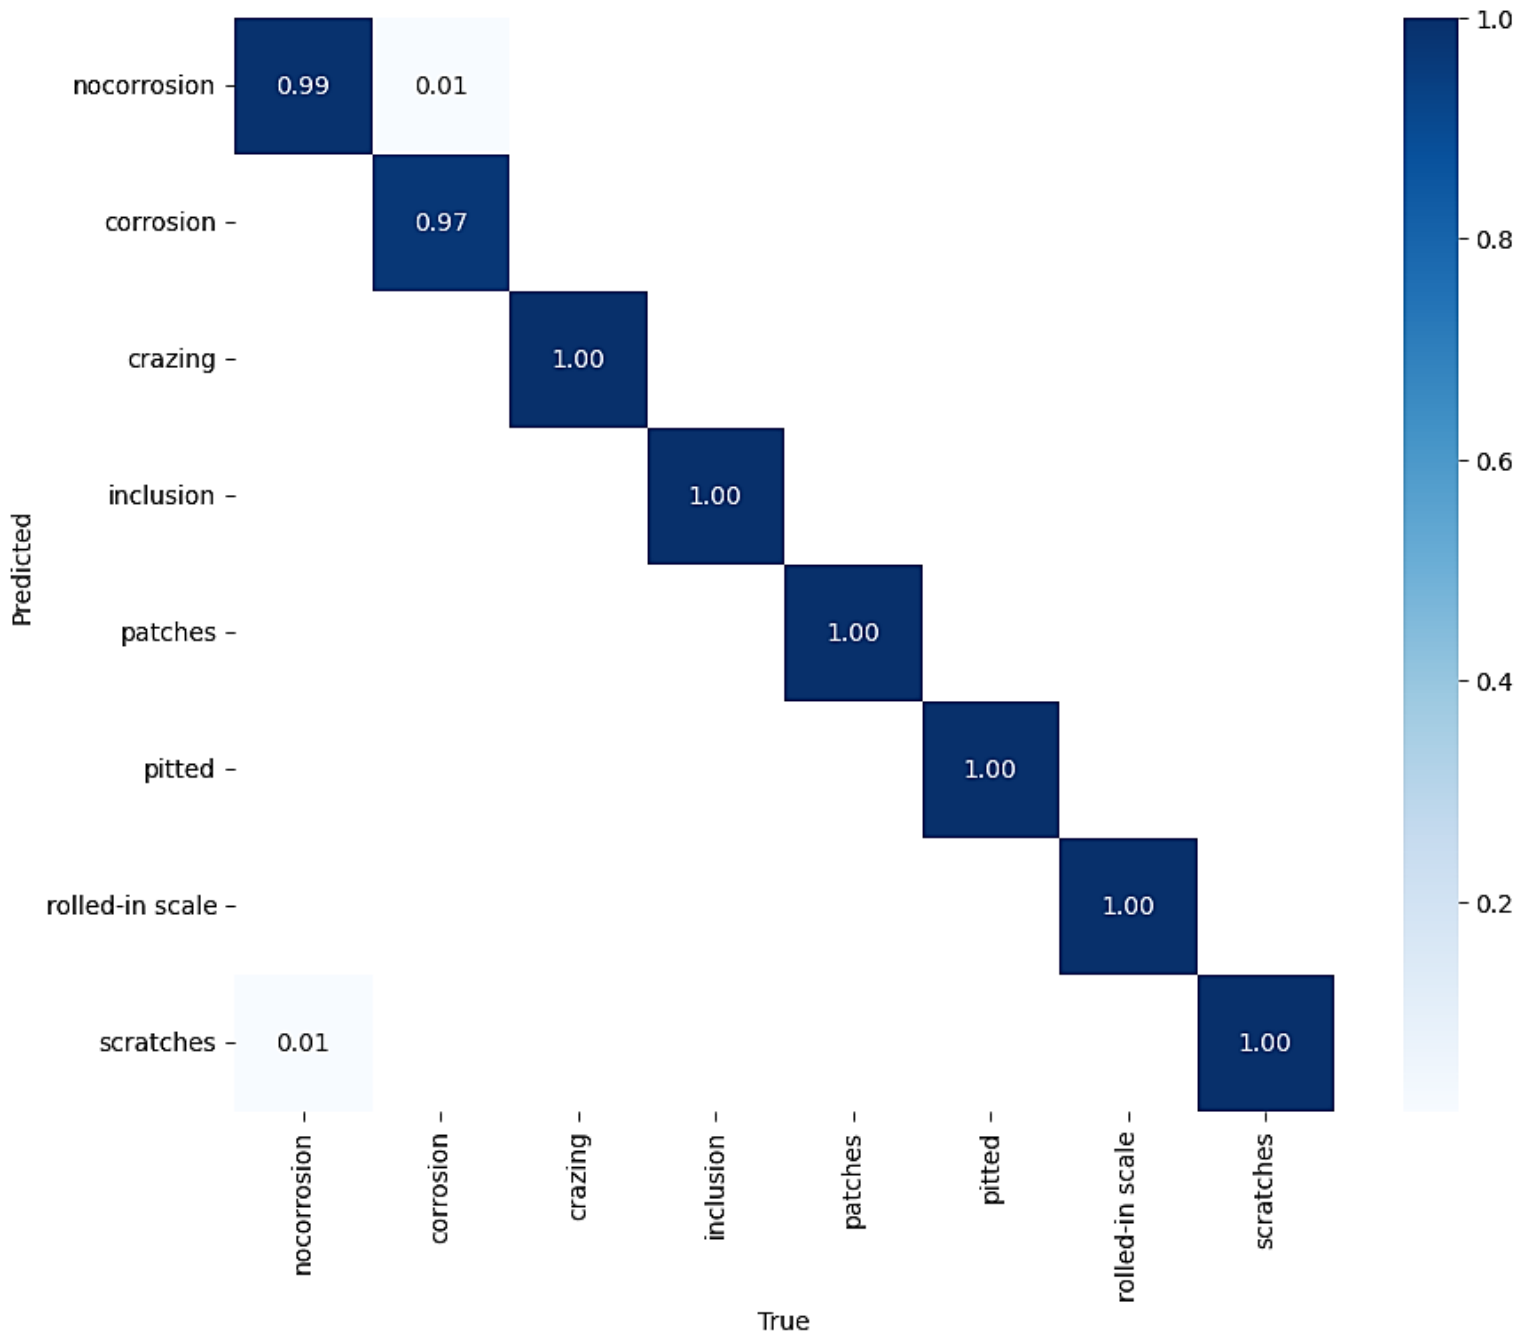
Figure 9 shows the normalized confusion matrix, which demonstrates the performance of a YOLOv8 model across defect classes. The values contained within the matrix denote the proportion of correct and incorrect predictions. Notably, the diagonal elements demonstrate high accuracy for most classes, with values approaching 1.0, indicating that the model effectively recognizes categories such as “no corrosion,” “corrosion,” “crazing,” and “inclusion.” Nevertheless, certain misclassifications are apparent, especially within the “scratches” category, where 1% of instances designated as “no corrosion” were incorrectly classified. Overall, this analysis underscores the model’s proficiency in detecting true positives while also identifying opportunities for enhancing its accuracy by minimizing misclassifications.
In Table 3, YOLOv8 shows robust overall performance, attaining an average accuracy of 96%, with precision, recall, and F1-score all reaching 98%. The strong concordance among these metrics indicates a robust, well-calibrated model that efficiently reduces both false positive and false negative rates. In terms of computational efficiency, YOLOv8 reaches an inference speed of 2143.2 frames per second (FPS), underscoring the model’s appropriateness for real-time applications. This blend of high precision and swift processing makes YOLOv8 particularly well-suited for large-scale industrial inspection and predictive maintenance applications, where prompt and dependable decision-making is essential. The robustness-to-noise evaluation demonstrates YOLOv8’s performance advantage under noisy conditions. When subjected to noise perturbations, YOLOv8 achieves 75.2% accuracy.
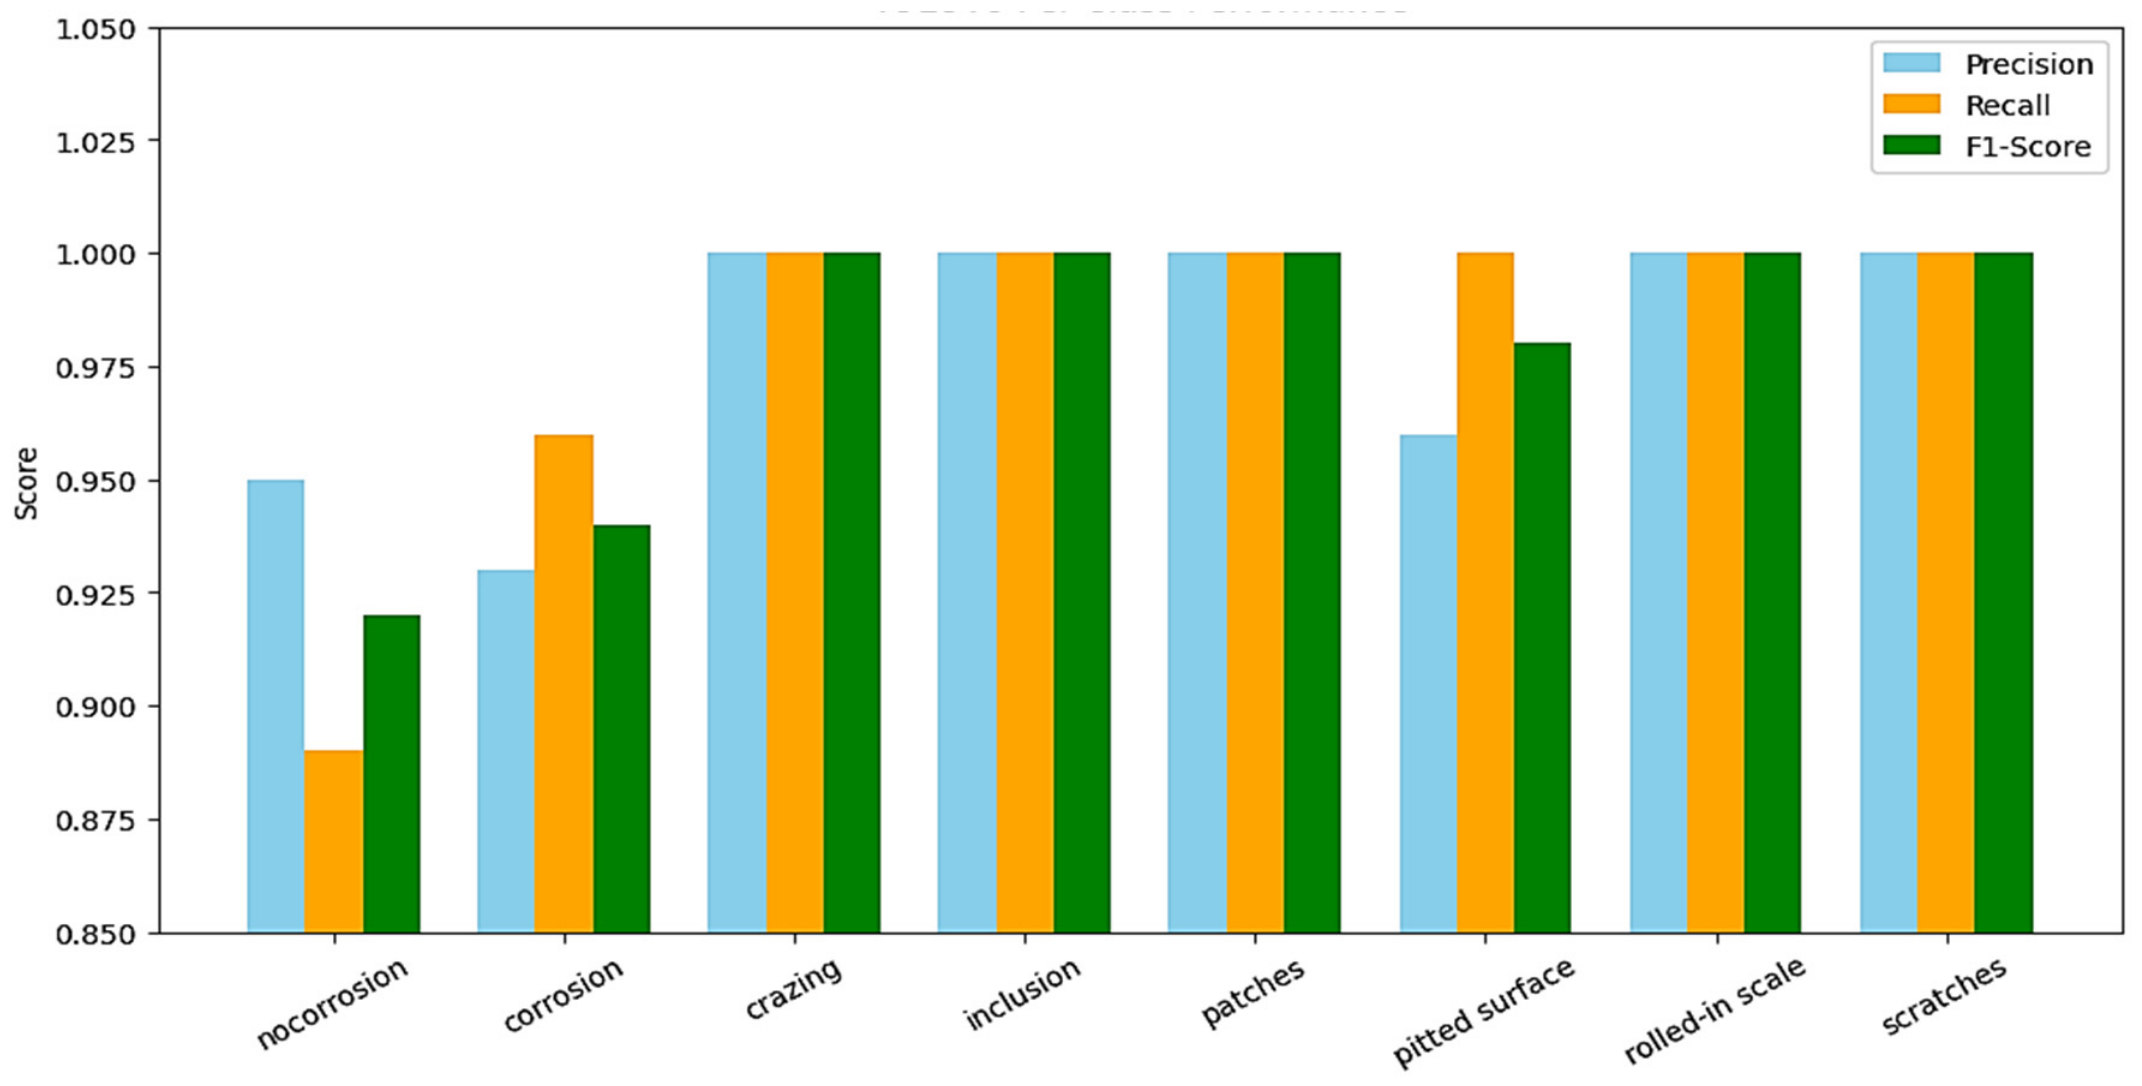
Figure 10 displays the per-class performance metrics of the YOLOv8 model on the dataset, including precision, recall, F1-score, and support (number of samples per class). The model demonstrates exceptional performance across all defect categories, achieving F1-scores of 1.00 for “Crazing,” “Inclusion,” “Patches,” “Rolled-in Scale,” and “Scratches,” reflecting an ideal balance between precision and recall for these classes. The “No Corrosion” and “Corrosion” classes show slightly lower F1-score values of 0.92 and 0.94, respectively, mainly attributable to slight variations between precision and recall. The “Pitted” class also demonstrates robust performance, achieving an F1-score of 0.98. Overall, the model achieves an accuracy of 0.96 across all 358 samples, with macro-averaged metrics of 0.98 and weighted metrics of 0.96, indicating that YOLOv8 is highly proficient in detecting and classifying all defect categories in the dataset.
In summary, based on these findings, YOLOv8 represents a good combination of speed, efficiency, and accuracy. Although it is slightly less robust, it works effectively under stable, predictable conditions to classify objects in real time.

4.3. VGG16 (CNN) Model Performance

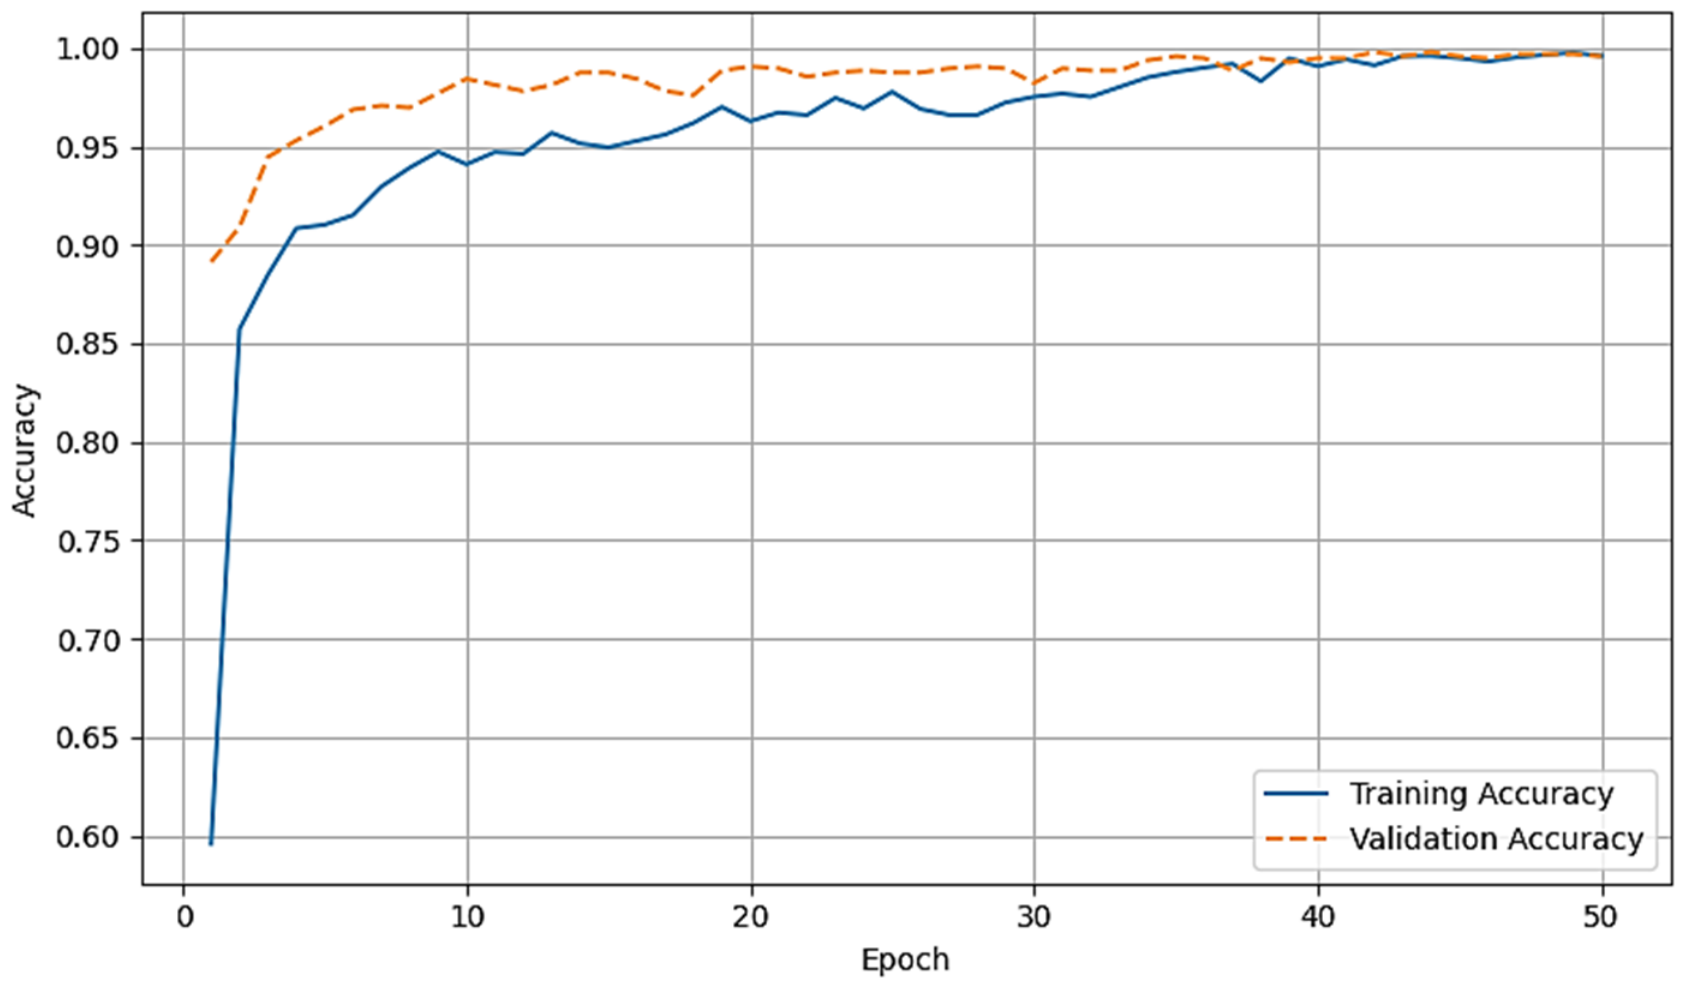
The performance of the optimized VGG16 convolutional neural network (CNN) is evaluated in this subsection, based on its dynamics, performance metrics, and computational efficiency. The model was initially trained on the ImageNet database and then fine-tuned via transfer learning to perform steel surface defect classification. The use of a pre-trained hierarchical representation from VGG16 resulted in improved convergence rates and classification accuracy in the target domain. Figure 11 illustrates the accuracy curve: a steep rise in early epochs, followed by stabilization at approximately 100% for the remainder of the epochs. Therefore, the model quickly learns discriminative representations and maintains stable performance throughout the remaining epochs.
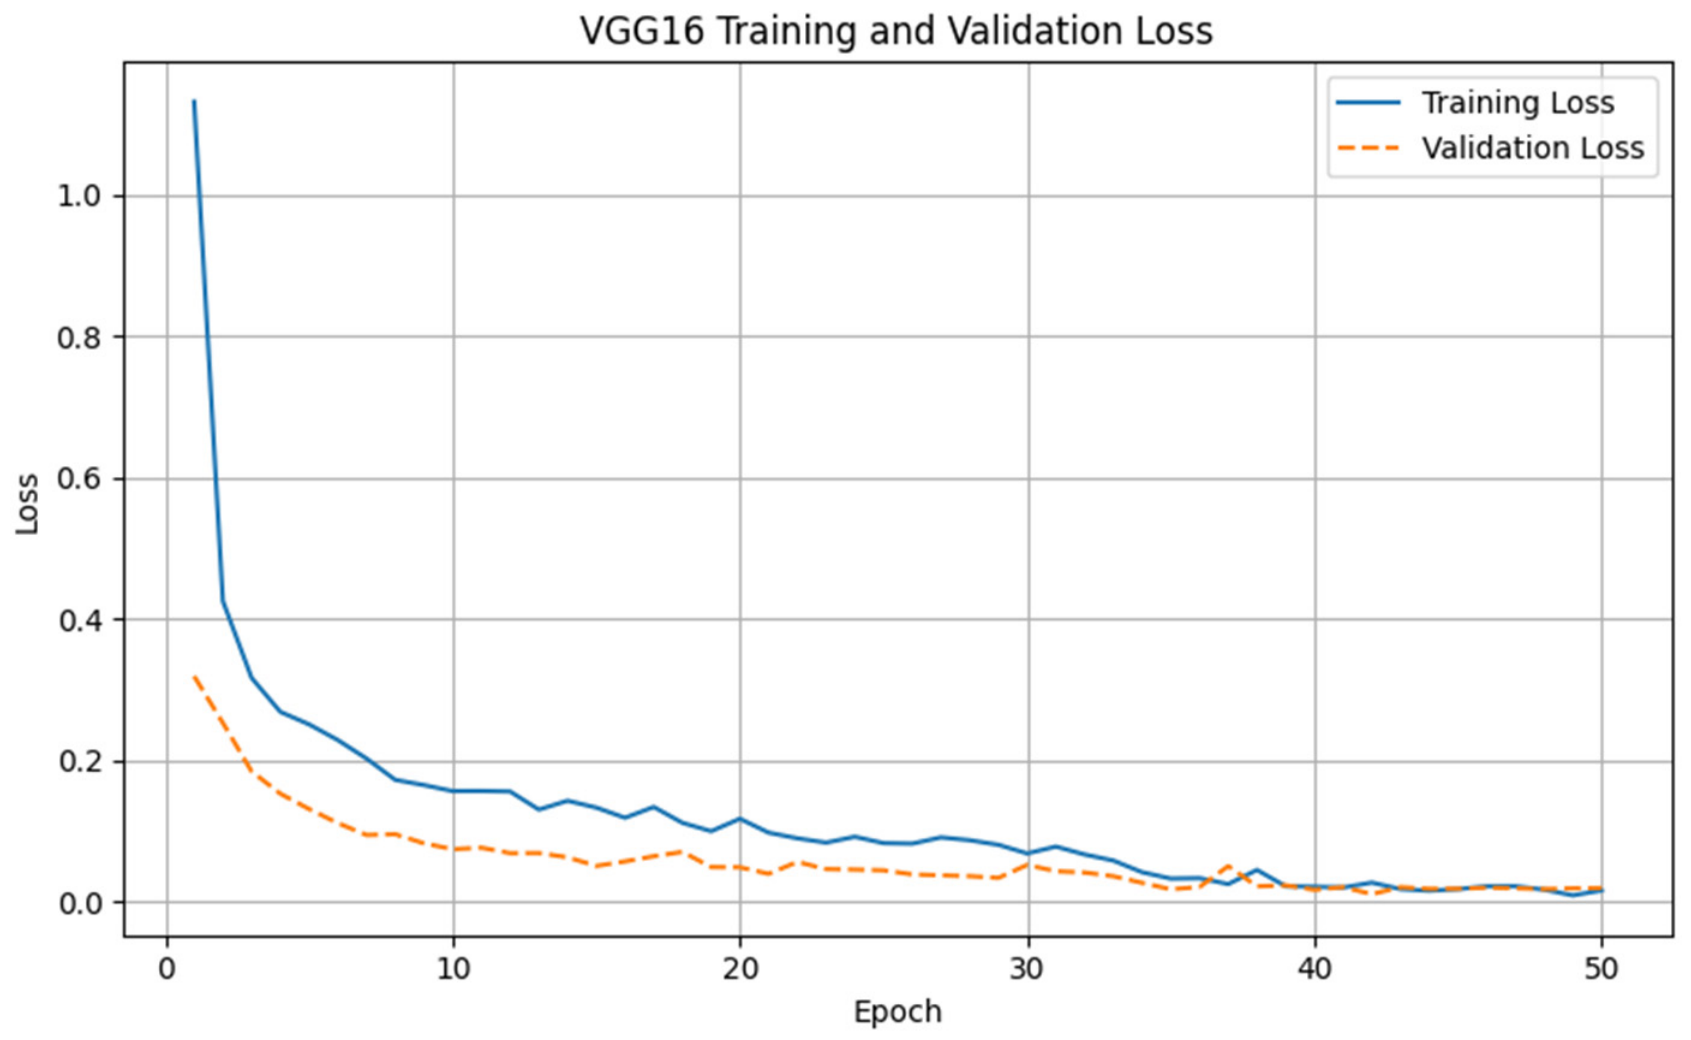
Figure 12 shows the loss curve, with a dramatic decrease in loss at the beginning of the training process that then begins to stabilize near zero. The stabilization of the loss curve near zero verifies convergence and minimizes the likelihood of overfitting.
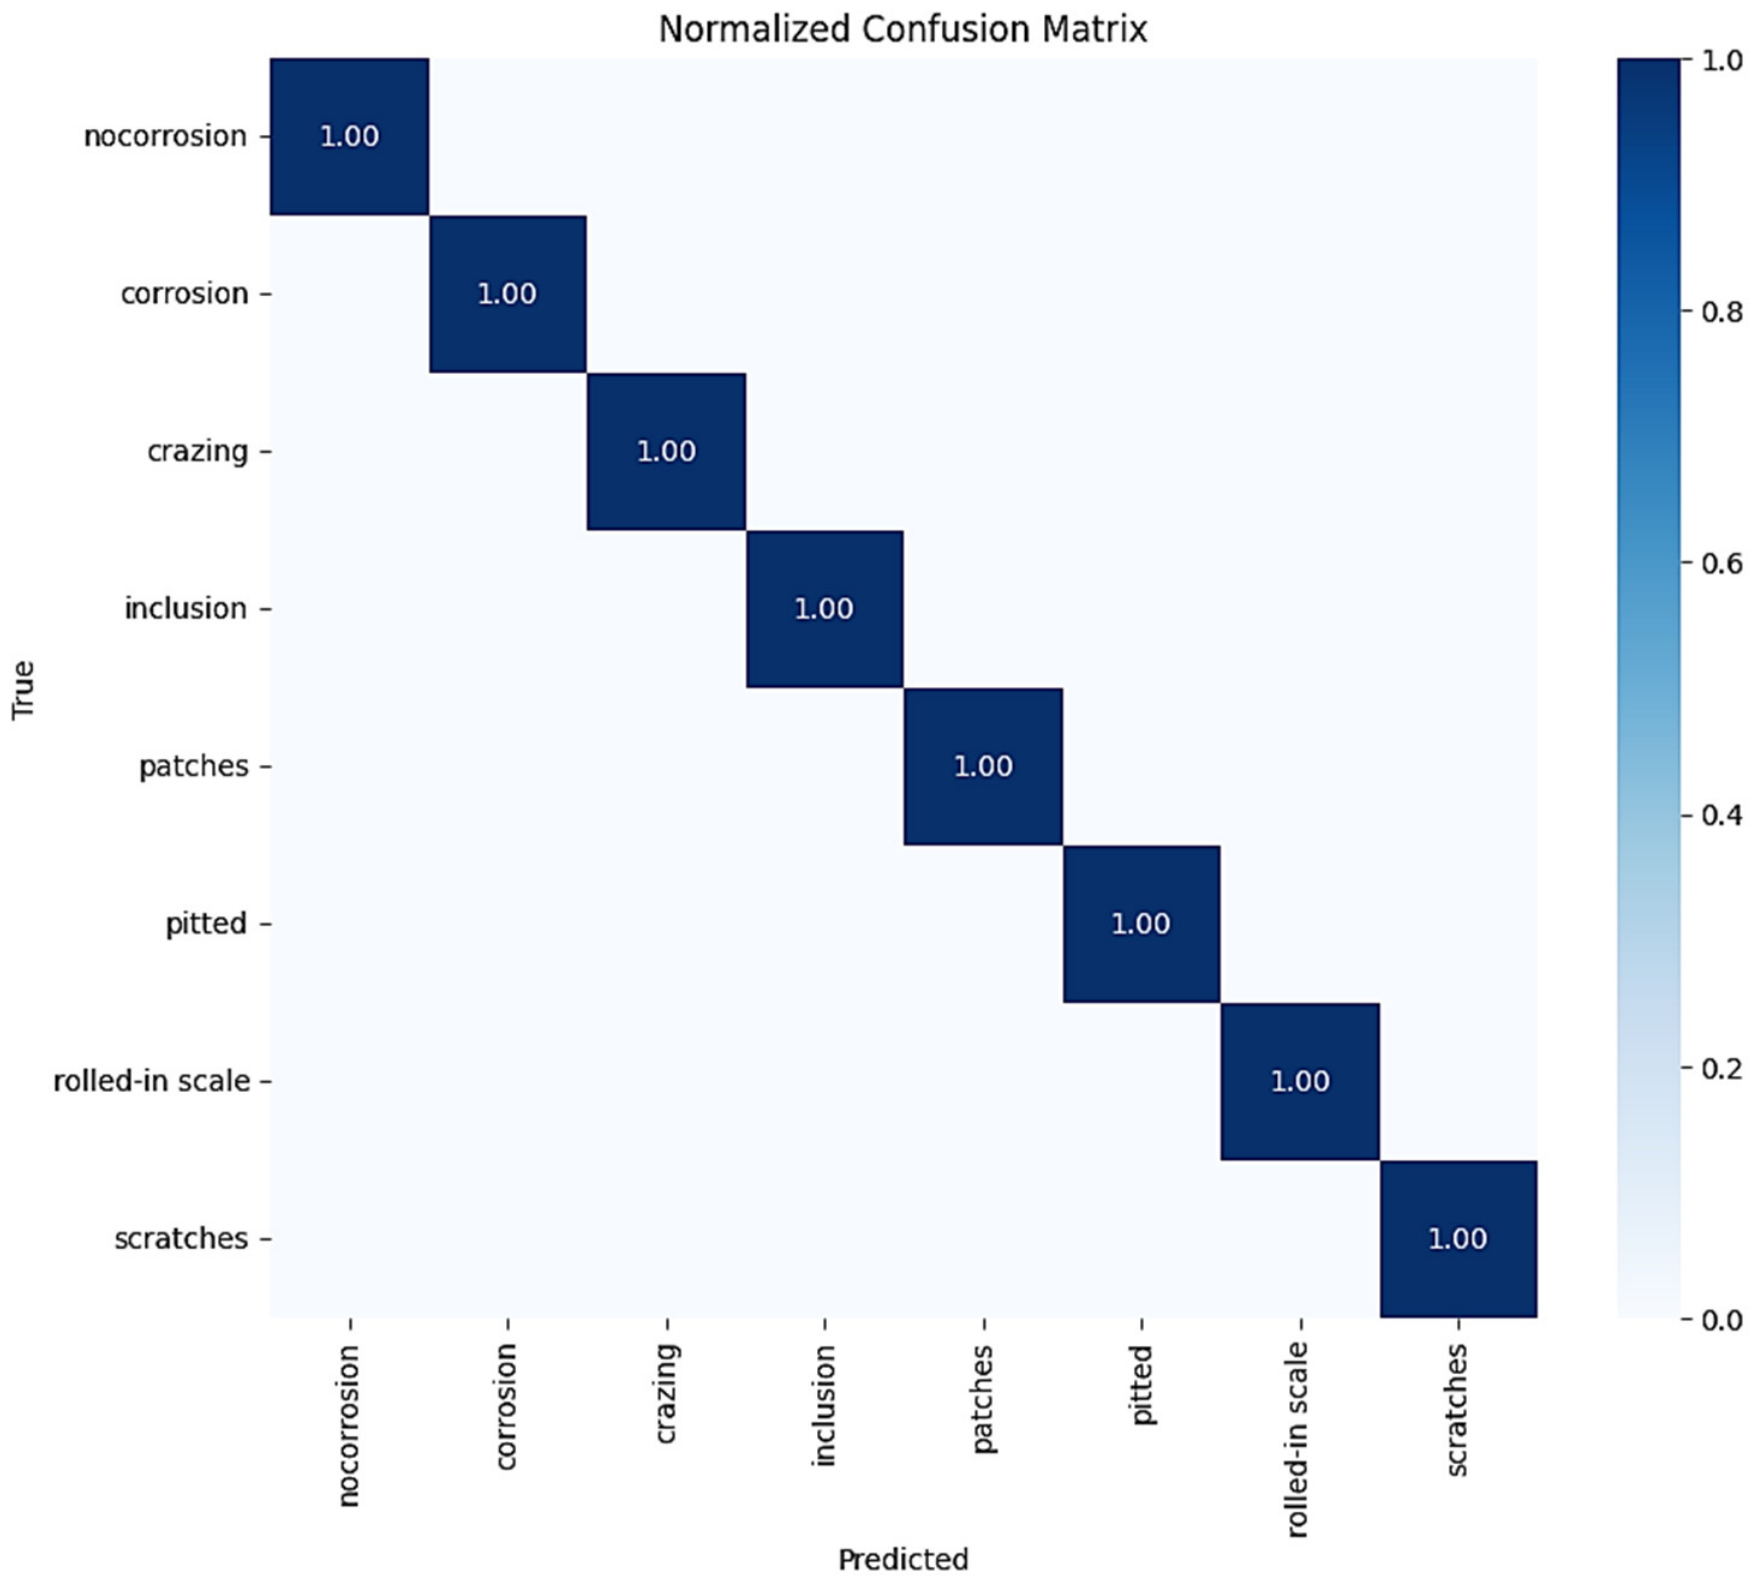
Figure 13 shows the normalized confusion matrix for the VGG16 model, illustrating how well the network distinguishes between the different surface defect categories. Each diagonal cell is valued at 1.00, meaning that every class was correctly identified without any misclassification. This includes all categories, such as no-corrosion, corrosion, crazing, inclusion, patches, pitted, rolled-in scale, and scratches. Since no errors appear off the diagonal, the model demonstrates perfect performance on the test set. These results highlight the strong capability of VGG16 to extract features and accurately classify defects across all categories.
Table 4 demonstrates the highly effective discriminative capabilities of the proposed VGG16 model, achieving an overall test accuracy of 100%. Furthermore, the model achieves top scores across all key evaluation metrics, including precision, recall, and F1-score, demonstrating an ideal balance between sensitivity and specificity. These results emphasize the model’s robust capability to accurately differentiate among multiple defect classes while reducing both false positive and false negative rates. The considerable consistency observed across these metrics demonstrates the ability of the VGG16 architecture in multi-class defect classification, leading to minimal classification errors. Furthermore, the model processes images at a rate of 82.6 frames per second (FPS), illustrating its appropriateness for near real-time deployment in industrial inspection settings. The robustness score of 61.2% further indicates the model’s moderate resilience to fluctuations in operating conditions. Although the model efficiently manages moderate challenges such as minor variations in illumination, slight occlusions, and moderate levels of image noise, there remains the possibility of enhancement under more severe or unpredictable conditions.
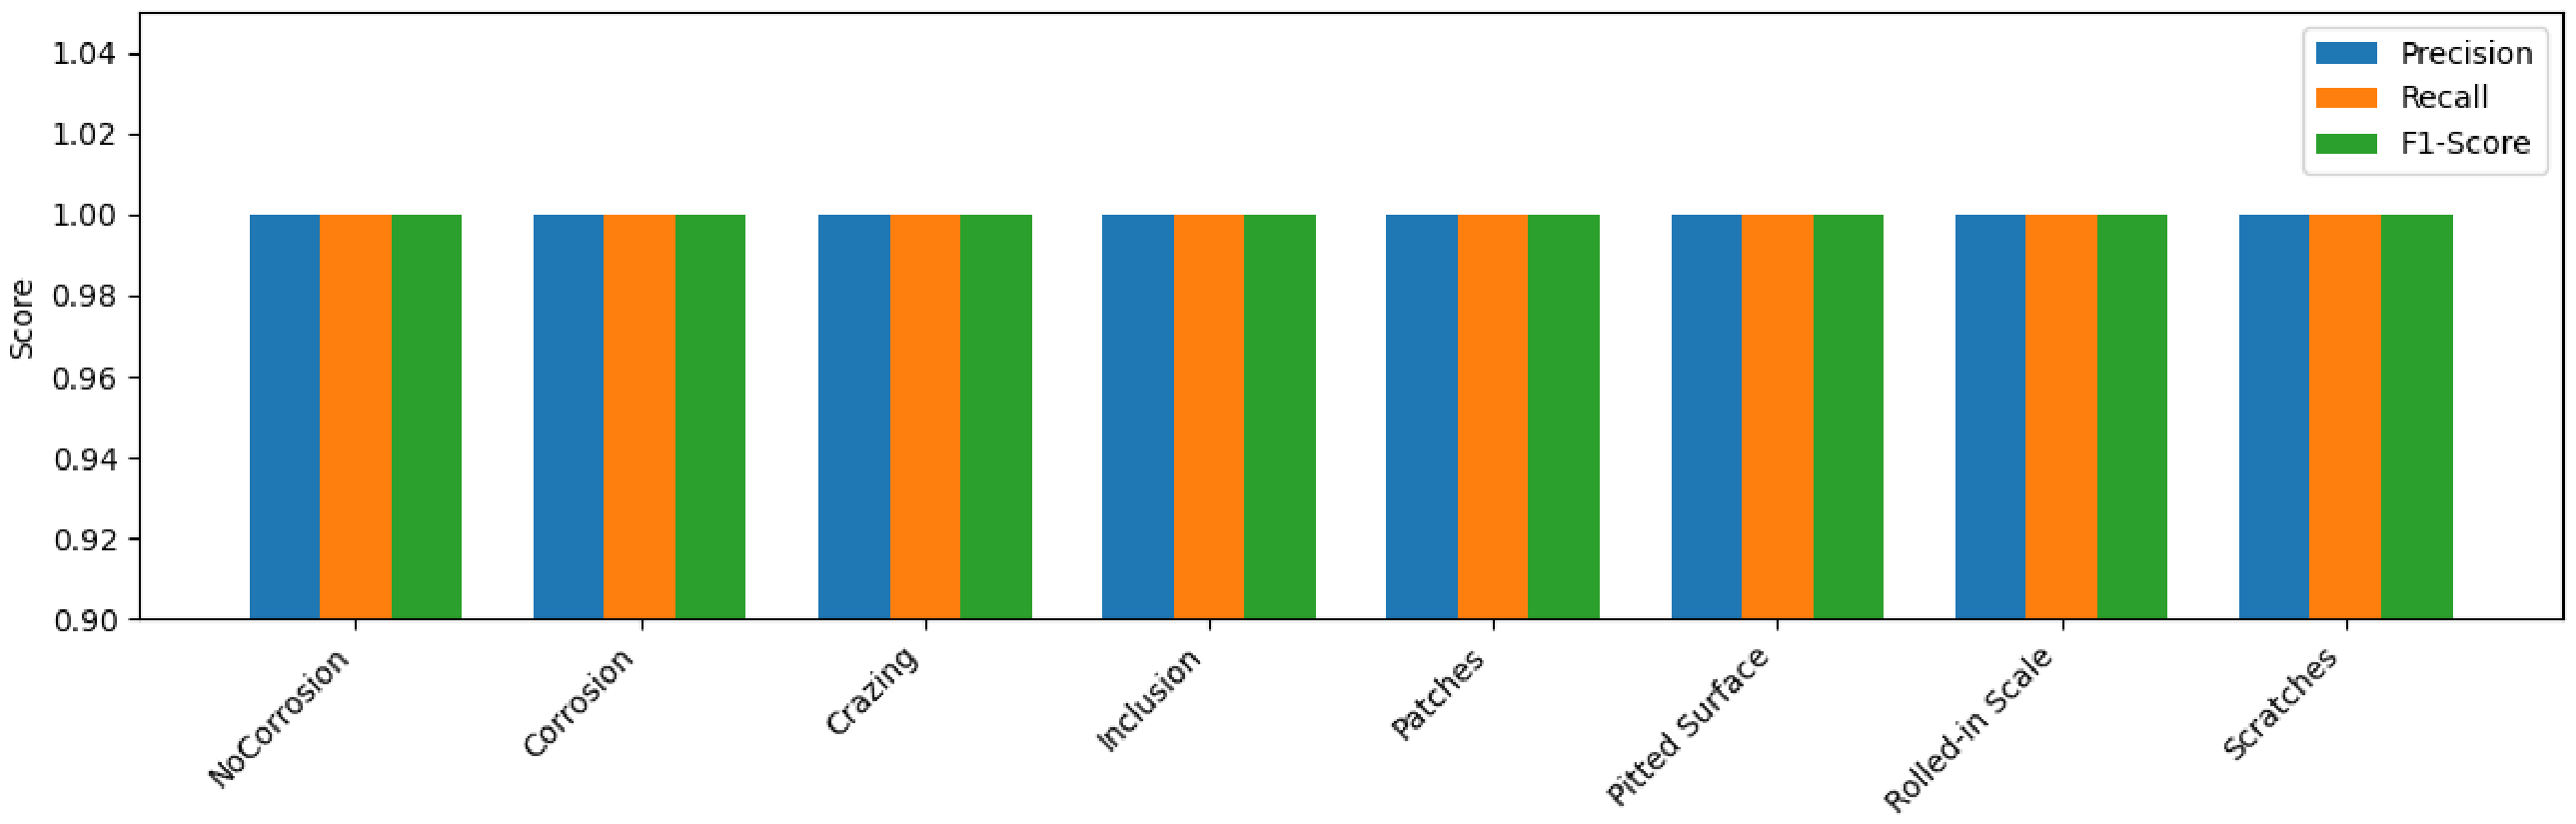
Figure 14 demonstrates the model’s ability to recognize the different textures and structures associated with each of these categories of defects. The overall accuracy of 100% across all 971 test samples reflects the model’s ability to correctly classify nearly all instances in the dataset. Additionally, both the weighted-average and the macro-averaged metrics in precision, recall, and F1-score are all 100%. These results prove that VGG16 demonstrates robust generalization abilities and reliable classification for various surface defects. In summary, the VGG16 model that uses transfer learning shows significant generalization and stability. The model can achieve high discriminative hierarchical representations while minimizing overfitting. This makes it a great candidate for use in automated inspection applications in industrial environments.

4.4. 10-Fold Cross-Validation

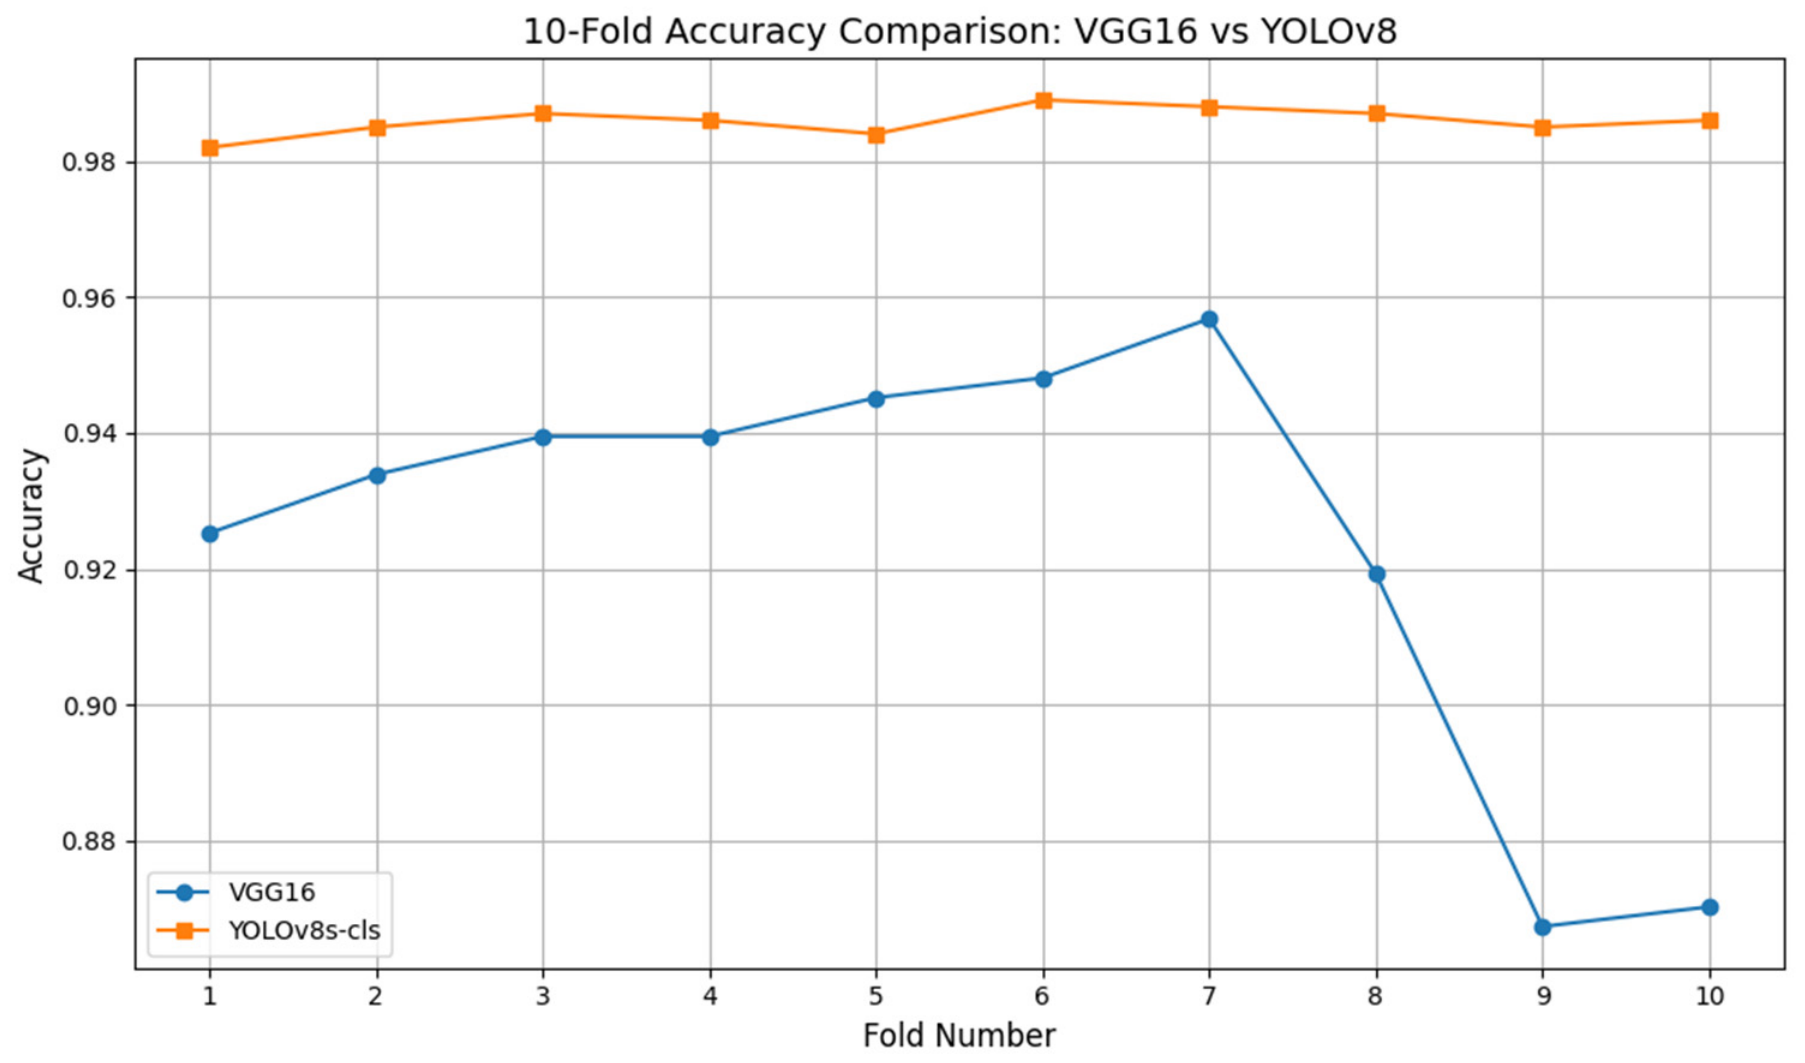
To offer a supplementary evaluation, 10-fold cross-validation was used. The dataset was shuffled to remove ordering bias and divided into ten equal folds (10% each). Each model was trained in nine folds and tested on the remaining fold, repeated 10 times, with metrics averaged to obtain a consolidated accuracy score. Stratified sampling ensured that each fold preserved the class distributions, which is essential for imbalanced datasets. Although not the primary evaluation, the 10-fold CV provides insights for comparing VGG16 and YOLOv8, which differ in architecture: VGG16 uses a deep convolutional network, while YOLOv8 emphasizes efficiency and contextual understanding. CV evaluates the mean performance and the consistency of predictions across folds. As shown in Table 5, VGG16 accuracy ranged from 0.8674 to 0.9568, with a mean of 0.92453. YOLOv8 maintained 0.984–0.989 accuracy, with a mean of 0.98590, demonstrating superior overall accuracy, stability, and generalization. Figure 15 visualizes fold-wise performance: VGG16 is stable, whereas YOLOv8 shows slightly greater variability but a higher average accuracy. These results confirm the effectiveness, robustness, and reliability of both models, with YOLOv8 outperforming VGG16.
The results of the split ratio method usually look better because of its lack of rigor, consistency, and potential for an optimistic bias. K-fold cross-validation produces more reliable and scientific results, although with relatively poor scores on average.

4.5. Stratified K-Fold Cross Validation

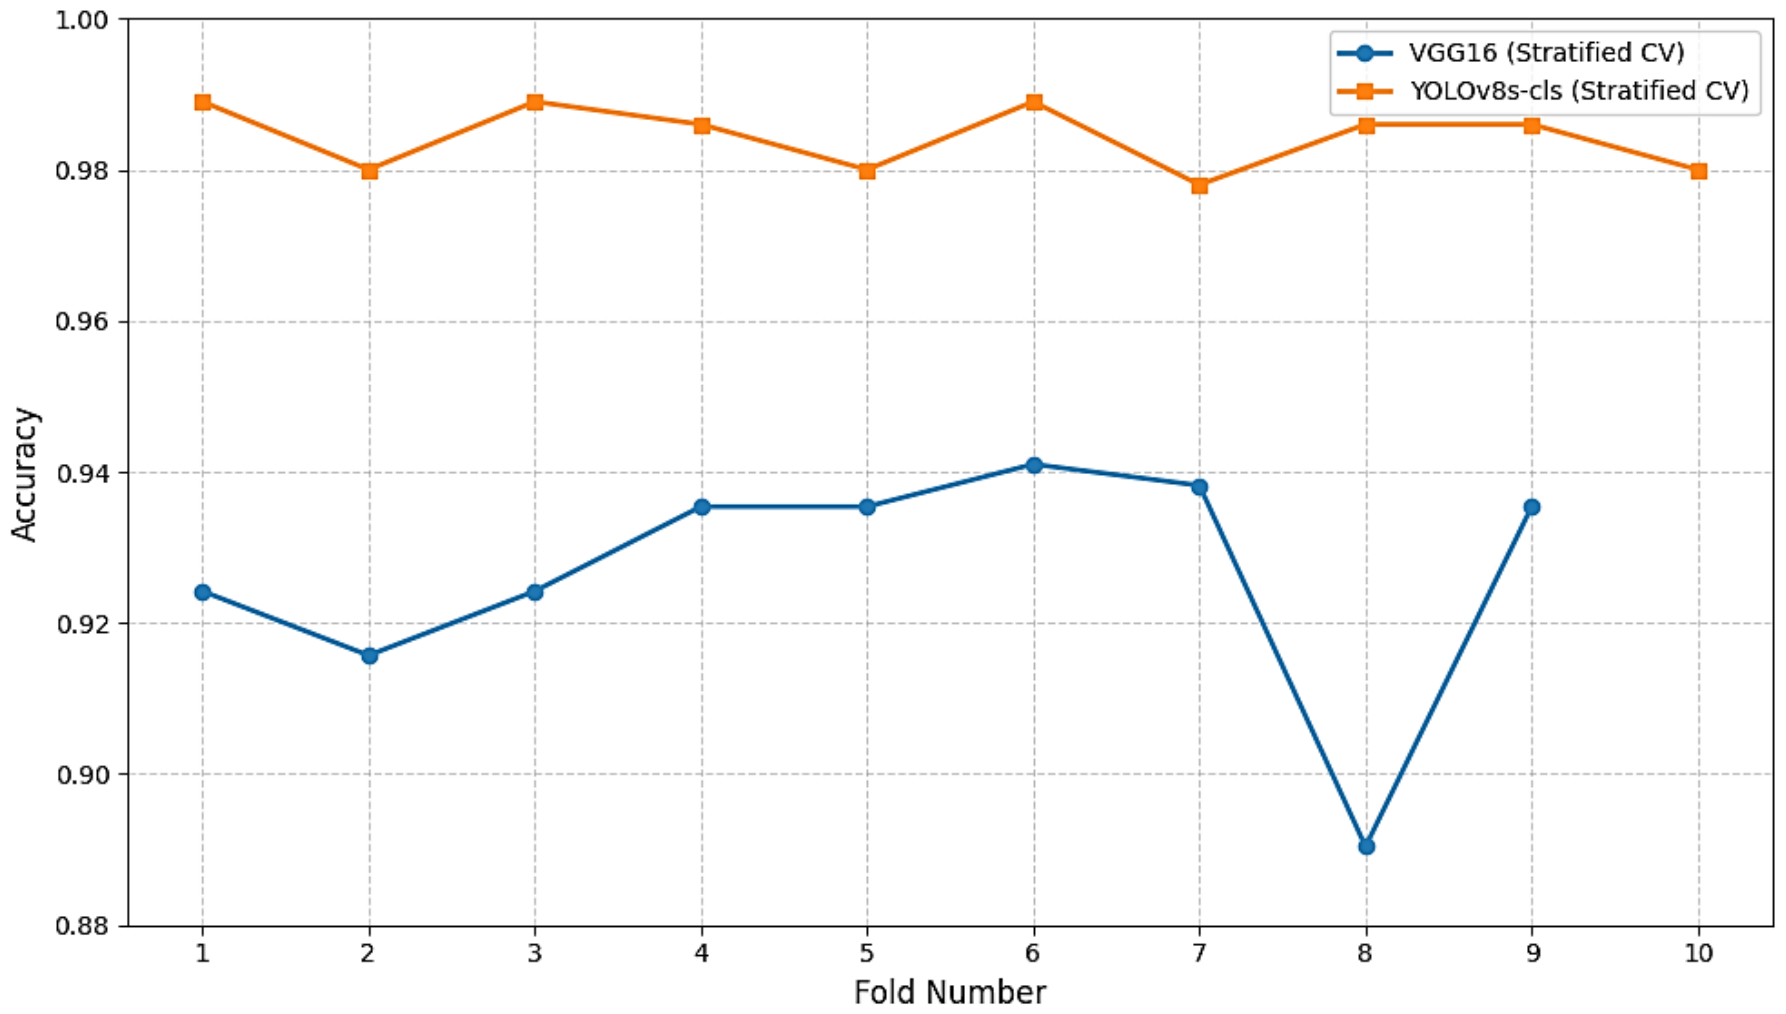
For performance evaluation, 10-fold stratified k-fold cross-validation was applied. The dataset was shuffled and divided into ten equal folds (10% each) using stratified sampling to preserve class distribution and avoid bias. Each model was trained in nine folds and tested in one fold, repeating the process ten times. Performance metrics were averaged to obtain mean and standard deviation, reducing the impact of any single split. The results (Table 6) show that VGG16 achieved 0.9267 ± 0.0150 accuracy and 0.9266 ± 0.0151 F1-score, with noticeable variability across folds. YOLOv8 achieved a higher accuracy of 0.9843 ± 0.0042, with lower variability, indicating greater robustness and consistency. Figure 16 shows that YOLOv8 maintains stable accuracy across folds, while VGG16 exhibits larger fluctuations. Overall, YOLOv8 outperforms VGG16 in both accuracy and stability, making it more suitable for consistent performance under varying data conditions.

4.6. Comparative Analysis with State-of-the-Art

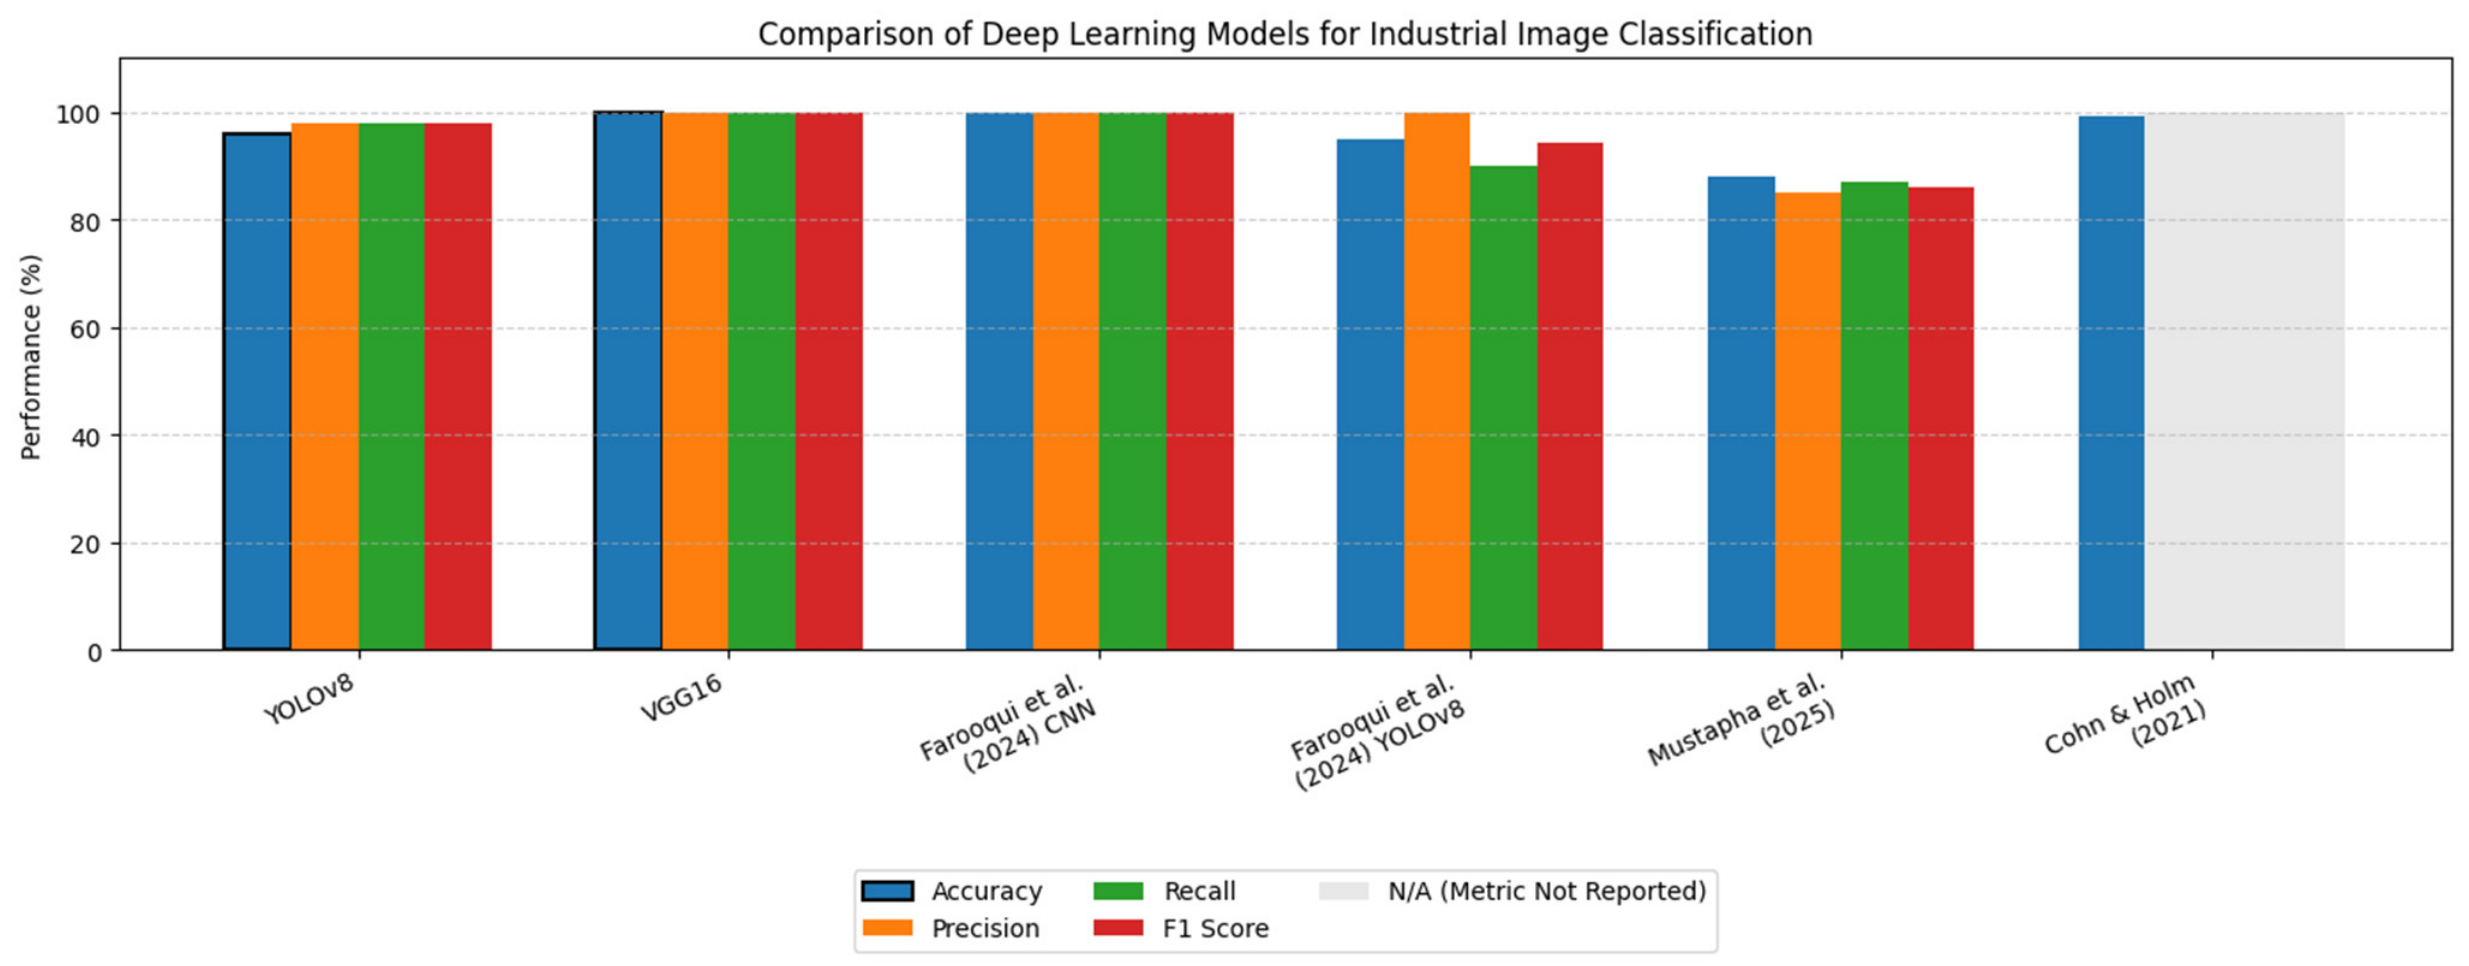
Figure 17 illustrates a comparative evaluation of the proposed YOLOv8 and VGG16 models against existing state-of-the-art approaches reported in the literature. For the comparison, the schemes were selected based on the algorithms used, dataset, and target industrial images. Four key performance metrics, accuracy, precision, recall, and F1-score, are presented for each study.
To compare with existing work, the proposed YOLOv8 and VGG16 models were evaluated against studies [3,20,38]. These previous works differ in architecture, training, and data augmentation but report comparable metrics. The unsupervised clustering in [20], combining transfer learning with VGG16 and k-means, achieved 99.4% accuracy (precision, recall, F1 not reported). In [20], a YOLOv8 corrosion detection model reached 95.0% accuracy, with precision 100%, recall 90%, and F1 94.7%; the CNN model achieved 100% across all metrics. The hybrid CNN–YOLOv8 in [3] had lower performance: 88% accuracy, precision 85%, recall 87%, and F1 86%.
As shown in Table 7, the proposed VGG16 achieved 100% accuracy, precision, recall, and F1-score, outperforming [20] and matching the top CNN in [38]. The proposed YOLOv8 achieved 96% accuracy and 98% for precision, recall, and F1, surpassing [38] in recall and F1 while maintaining high precision. In contrast to the study in [22], which employed the NEU dataset, the vision transformer (ViT) and ResNet201 achieved the same accuracy as the proposed model but incurred significant training delays of 270.49s and 178.02s, respectively. VGG16 and VGG19 underperformed at 79.6% and 83.3%, respectively. Overall, both models outperform current state-of-the-art methods. VGG16 offers superior accuracy and reliability, while YOLOv8 balances accuracy with real-time performance, confirming their efficacy for surface defect classification despite dataset and evaluation differences across studies.

4.7. Discussion and Implications for Industry

4.7.1. Evaluation of Model Performance

Table 8 presents the classification accuracy of the proposed VGG16 and YOLOv8 models across stratified k-fold cross-validation and a standard train/validation/test split-based validation. The stratified k-fold cross-validation methods represent a strong strategy for estimating model performance because they allow the models to be trained and tested multiple times separately on randomly selected sub-datasets, thus allowing a reduction in the bias associated with the use of a single partition of the data and providing a more accurate indicator of a model’s generalization ability. So, every split gets a fair chance to be included in the evaluation, which was conducted only on the training subset, using the stratified k-fold cross-validation method and a standard train/validation/test split-based validation, resulting in the observed variation in the results. The reason for such variation in standard train/validation/test split-based validation is the independent test set, which represents a single hold-out split (10% of the dataset), which may not fully capture the overall variability of the data distribution. Additionally, the relatively small size of the test set can lead to greater variance in performance estimates. It may yield optimistic outcomes when the samples are less challenging or more separable.
Moreover, YOLOv8’s innovative architecture employs multi-scale feature extraction and spatial representations, enabling it to learn invariant and discriminative defect features even when the data distribution varies. Not only does YOLOv8 exhibit superiority during stratified k-fold cross-validation, but it further proves that YOLOv8 is robust even if the class ratio is not maintained in each fold. That is a crucial problem for most industry datasets with a class-imbalance problem. On the contrary, VGG16 achieves a perfect score with the train/validation/test split technique, whereas in cross-validation evaluations, its results are far inferior to those of YOLOv8. Therefore, VGG16 benefits from the favorable fixed data partitioning and may at least partially fit the training–testing configurations used in the dataset. Although transfer learning allows VGG16 to utilize pre-trained features successfully, it is limited in adapting its features to a relatively shallow representation and in utilizing global representations for performance. As such, cross-validation represents a more realistic assessment of its true generalization capability. Therefore, the evaluation clearly demonstrates that VGG16 can achieve high performance under carefully controlled conditions. YOLOv8 demonstrates greater consistency and robustness across all validation sets. These properties of YOLOv8 are critical for any industrial inspection system, as operational data distributions can change over time and across deployment locations. Finally, cross-validation inherently introduces greater variability in the training and validation splits than a single fixed test partition, making it a more reliable indicator of generalization performance.

4.7.2. Inference Efficiency and Deployment Considerations

The results clearly demonstrate the trade-off between precision and efficiency. VGG16, with more parameters, offers higher accuracy but requires additional computational resources. Implementing it on peripheral devices or embedded inspection systems may be challenging without appropriate optimization or model compression. YOLOv8, by comparison, delivers real-time performance with considerably fewer parameters, making it suitable for integrated quality control scenarios where minimizing latency is essential. This speed advantage enables production lines to evaluate thousands of items per minute while maintaining operational efficiency.

4.7.3. Robustness and Sensitivity to Environmental Factors

The robustness-to-noise assessment reveals a clear performance advantage of YOLOv8 over VGG16 in noisy environments. Upon exposure to noise perturbations, YOLOv8 achieves 75% accuracy, whereas VGG16 reaches only 61%, indicating a far more pronounced decline in performance for the latter. This outcome indicates that YOLOv8 exhibits greater robustness to noise, likely due to its contemporary design, multi-scale feature representation, and enhanced feature extraction techniques, which allow it to preserve discriminative information despite diminished input quality. The lower robustness of VGG16 underscores its susceptibility to noise, revealing shortcomings of older convolutional designs in handling corrupt or low-quality inputs. These findings highlight the appropriateness of YOLOv8 for use in real-world environments, where noise and input disturbances are inevitable.
To prevent learning dataset-specific features rather than defect-specific ones, we used stratified k-fold cross-validation and substantial data augmentation. With stratified k-fold cross-validation, the algorithm learns from folds containing balanced samples of both NEU and corrosion images, thus ensuring that the model generalizes well for different domain distributions rather than learning dataset-specific patterns. Since the model is tested using a different dataset composition in each fold, learning from cues related to the whole dataset (e.g., lighting, texture, background) leads to poor cross-validation performance and therefore encourages learning defect-level characteristics.
Data augmentation mitigates domain bias by randomizing color, illumination, texture and geometric transformations of the images. Thus, it weakens the correlation between the dataset and its visual appearance, preventing the model from identifying defects based on dataset-related characteristics.

4.7.4. Evaluation of Model Generalization and Robustness

The 10-fold cross-validation confirms YOLOv8 outperforms VGG16 in generalization, with a mean accuracy of 98.59% versus 92.45%. VGG16 exhibits greater variability across folds, indicating sensitivity to data variation, whereas YOLOv8 maintains consistent performance. These results reinforce YOLOv8’s reliability for real-world industrial deployment and validate the robustness of both models.
Combining datasets from different sources, there is a potential risk that the model may learn dataset-specific patterns, such as differences in lighting, imaging conditions, or background textures, rather than focusing on the actual defect characteristics. To reduce this risk, a consistent preprocessing pipeline was applied to all images, including resizing, normalization, and data augmentation. In addition, stratified sampling was used to maintain the class distribution across the training and evaluation sets. Furthermore, the experimental setup is designed for defect-level classification rather than identifying the dataset origin. This encourages the model to focus on learning meaningful features related to surface defects. As a result, the evaluation is intended to assess the model’s ability to generalize across different and heterogeneous data sources, which is important for real-world industrial inspection applications.

5. Conclusions and Recommendations

This research investigates VGG16 and YOLOv8 for automatic classification of steel surface defects. Both models showed strong performance, confirming the effectiveness of deep learning over traditional inspection methods. Three validation strategies (standard k-fold, stratified k-fold, and train/validation/test split) were used for fair evaluation. Stratified k-fold was especially important for handling class imbalance. YOLOv8 consistently outperformed VGG16 in accuracy, robustness, and generalization across cross-validation methods, demonstrating stable performance regardless of the data partition. VGG16 performed very well under a single train/validation/test split but showed reduced performance in cross-validation, indicating overfitting and sensitivity to data variations. Its older architecture and reliance on global features make it more vulnerable to noise and dataset changes. For industrial applications, YOLOv8 is better suited for real-time inspection due to its efficiency, robustness, and strong generalization. VGG16 is more appropriate for controlled or offline environments but is limited by higher computational cost and lower robustness. Although experiments were conducted in controlled settings with synthetic noise, real industrial environments present additional challenges, including lighting variability, contamination, and sensor issues. Therefore, the results should be validated with real-world data. This study contributes by providing a rigorous comparison across multiple validation strategies, focusing on generalization and robustness rather than solely on accuracy. It helps guide the selection of deep learning models for industrial defect inspection. Overall, the models strike a balance between accuracy, robustness, and efficiency, with future work recommended to improve real-world robustness through domain adaptation and expanded industrial testing. Based on the results of this study, the following recommendations are proposed:
  • Deployment in Real Industrial Settings: The advanced capabilities of YOLOv8 inference speed and accuracy make it feasible for real-time utilization in industrial manufacturing applications. The model is applicable in camera surveillance systems that offer surface inspection and real-time defect detection [39].
  • Hybrid Model Techniques: Further investigations might include incorporating the benefits of both approaches, using YOLOv8 for quick detection and VGG16 (or other CNN models) for further verification. Such approaches are likely to provide enhanced performance in highly complex industrial settings.
  • Improvement of Model Robustness: To improve model performance under difficult conditions (such as dim light, occlusions, or surface contamination), further procedures should include data augmentation, domain adaptation, and noise injection during training.
  • Adoption of Transformer-Based Architectures: It would also be interesting to investigate recent vision transformer (ViT)-based CNN approaches that could enhance global feature extraction and improve robustness, particularly for detecting corrosion under varying conditions [40].
  • Optimization of Edge: Creating a more efficient version of YOLO, such as YOLOv8n or YOLOv8s-tiny, enables deployment on embedded systems and provides energy-efficient, prompt responses for field-based monitoring tasks.
  • Dataset Expansion and Diversity: Using more practical images from industries with diverse surface types and environmental conditions would help the model better handle new defect patterns.
  • Integration into Predictive Maintenance Frameworks: The output of the classification system can be effectively integrated into maintenance planning systems and digital twin technology, enabling an informed, data-driven maintenance approach for vital infrastructure in the oil and gas industry in the Kingdom. Graphical user interfaces can significantly increase system utilization across various smartphone platforms [41].

Author Contributions

Conceptualization, A.R.; methodology, A.R. and R.A.; software, R.A.; validation, A.R.; formal analysis, A.R.; investigation, R.A.; resources, R.A.; data curation, R.A.; writing—original draft preparation, R.A.; writing—review and editing, R.A.; visualization, R.A.; supervision, A.R.; project administration, A.R.; funding acquisition, R.A. All authors have read and agreed to the published version of the manuscript.

Funding

This research received no external funding.

Data Availability Statement

The data of this study is obtained from open source repositories including GitHub and Kaggle.

Acknowledgments

The authors would like to acknowledge the College of Computer Science and Information Technology (CCSIT) at Imam Abdulrahman Bin Faisal University, Dammam, Saudi Arabia, for providing research resources.

Conflicts of Interest

The authors declare no conflicts of interest.

References

  1. Malashin, I.; Tynchenko, V.; Nelyub, V.; Borodulin, A.; Gantimurov, A.; Krysko, N.V.; Shchipakov, N.A.; Kozlov, D.M.; Kusyy, A.G.; Martysyuk, D.; et al. Deep Learning Approach for Pitting Corrosion Detection in Gas Pipelines. Sensors 2024, 24, 3563. [Google Scholar] [CrossRef] [PubMed]
  2. Casas, E.; Liu, H.; Kim, S. A comparative study of YOLOv5 and YOLOv8 for corrosion segmentation in industrial applications. Array 2024, 22, 100351. [Google Scholar] [CrossRef]
  3. Sun, P. Deep Learning for Automated Corrosion Detection. 2012. Available online: https://github.com/pjsun2012/Phase5_Capstone-Project (accessed on 30 January 2024).
  4. Cohn, K.S. NEU-Cluster: A Dataset for Surface Defect Classification. GitHub Repository. 2025. Available online: https://github.com/rccohn/NEU-Cluster (accessed on 29 October 2025).
  5. LeCun, Y.; Bengio, Y.; Hinton, G. Deep learning. Nature 2015, 521, 436–444. [Google Scholar] [CrossRef] [PubMed]
  6. Redmon, J.; Divvala, S.; Girshick, R.; Farhadi, A. You only look once: Unified, real-time object detection. In Proceedings of the IEEE Conference on Computer Vision and Pattern Recognition (CVPR), Las Vegas, Nevada, 27–30 June 2016; pp. 779–788. [Google Scholar]
  7. Katsamenis, I.; Protopapadakis, E.; Doulamis, A.; Doulamis, N.; Voulodimos, A. Pixel-level corrosion detection on metal constructions by fusion of deep learning semantic and contour segmentation. In Lecture Notes in Computer Science; Springer: San Diego, CA, USA, 2020; Volume 12509, pp. 160–169. [Google Scholar]
  8. Matthaiou, A.; Papalambrou, G.; Samuelides, M.S. Corrosion detection with computer vision and deep learning. In Developments in the Analysis and Design of Marine Structures, 1st ed.; CRC Press: Boca Raton, FL, USA, 2021; pp. 289–296. [Google Scholar]
  9. Brandoli, B.; de Geus, A.R.; Souza, J.R.; Spadon, G.; Soares, A.; Rodrigues, J.F.; Komorowski, J.; Matwin, S. Aircraft fuselage corrosion detection using Artificial Intelligence. Sensors 2021, 21, 4026. [Google Scholar] [CrossRef] [PubMed]
  10. Forkan, A.R.M.; Kang, Y.-B.; Jayaraman, P.P.; Liao, K.; Kaul, R.; Morgan, G.; Ranjan, R.; Sinha, S. CorrDetector: A framework for structural corrosion detection from drone images using ensemble deep learning. Expert. Syst. Appl. 2021, 193, 116461. [Google Scholar] [CrossRef]
  11. Munawar, H.; Ullah, F.; Shahzad, D.; Heravi, A.; Qayyum, S.; Akram, J. Civil infrastructure damage and corrosion detection: An application of machine learning. Buildings 2022, 12, 156. [Google Scholar] [CrossRef]
  12. Burton, B.; Nash, W.T.; Birbilis, N. RustSEG-Automated segmentation of corrosion using deep learning. arXiv 2022. [Google Scholar] [CrossRef]
  13. Tasnim, Z.; Saha, S.; Wazih, A.T.; Mahmud, S.N.; Paul, S.; Aonty, S.S. A Comprehensive Deep Learning based Approach for Corrosion Detection of Industrial Machinery and Tools. In 2025 International Conference on Electrical, Computer and Communication Engineering (ECCE); IEEE: Chittagong, Bangladesh, 2025; pp. 1–6. [Google Scholar] [CrossRef]
  14. Yu, L.; Yang, E.; Luo, C.; Ren, P. AMCD: An accurate deep learning-based metallic corrosion detector for MAV-based real-time visual inspection. J. Ambient. Intell. Humaniz. Comput. 2023, 14, 8087–8098. [Google Scholar] [CrossRef]
  15. Lemos, R.; Cabral, R.; Ribeiro, D.; Santos, R.; Alves, V.; Dias, A. Automatic detection of corrosion in large-scale industrial buildings based on artificial intelligence and unmanned aerial vehicles. Appl. Sci. 2023, 13, 1386. [Google Scholar] [CrossRef]
  16. Guzmán-Torres, J.J.A.; Domínguez-Mota, F.J.; Martínez-Molina, W.; Naser, M.Z.; Tinoco-Guerrero, G.; Tinoco-Ruíz, J.G. Damage detection on steel-reinforced concrete produced by corrosion via YOLOv3: A detailed guide. Front. Built Environ. 2023, 9, 1144606. [Google Scholar] [CrossRef]
  17. Effendi, M.K.; Atmaja, B.; Wahjudi, A.; Purwanto, D.B. Automated corrosion detection on steel structures using convolutional neural network. Int. J. Mech. Eng. Sci. 2023, 7, 36. [Google Scholar] [CrossRef]
  18. Rosati, R.; Romeo, L.; Cecchini, G.; Tonetto, F.; Viti, P.; Mancini, A.; Frontoni, E. From knowledge-based to big data analytic model: A novel IoT and machine learning based decision support system for predictive maintenance in Industry 4.0. J. Intell. Manuf. 2023, 34, 107–121. [Google Scholar]
  19. Farooqui, M.; Rahman, A.; Alsuliman, L.; Alsaif, Z.; Albaik, F.; Alshammari, C.; Sharaf, R.; Olatunji, S.; Althubaiti, S.W.; Gull, H. A Deep Learning Approach to Industrial Corrosion Detection. Comput. Mater. Contin. 2024, 81, 2587–2605. [Google Scholar] [CrossRef]
  20. Cohn, R.; Holm, E. Unsupervised machine learning via transfer learning and k-means clustering to classify materials image data. Integr. Mater. Manuf. Innov. 2021, 10, 231–244. [Google Scholar] [CrossRef]
  21. Dubey, P. Deep Learning-Powered Visual Inspection for Metal Surfaces: A Systemic Image-Centric Approach for Small Size Defect Detection. Ph.D. Dissertation, Iowa State University, Ames, IA, USA, 2023. [Google Scholar]
  22. Yang, J.; Majeed, A.P.P.A.; Ateeq, M.; Omar, Z.; Jailani, R.; Musa, R.M.; Luo, Y.; Yahya, N.M. Surface defect classification: Leveraging transformer and transfer learning models for enhanced precision in industrial applications. Int. J. Adv. Manuf. Technol. 2025, 139, 4141–4152. [Google Scholar] [CrossRef]
  23. Yang, S.; Xie, Y.; Wu, J.; Huang, W.; Yan, H.; Wang, J.; Wang, B.; Yu, X.; Wu, Q.; Xie, F. CFE-YOLOv8s: Improved YOLOv8s for Steel Surface Defect Detection. Electronics 2024, 13, 2771. [Google Scholar] [CrossRef]
  24. Lema, D.G.; Sánchez-González, L.; Usamentiaga, R.; Delacalle, F.J. Benchmarking deep learning models for surface defect detection: A reproducible and statistically-rigorous approach. J. Intell. Manuf. 2025, 37, 3001–3018. [Google Scholar] [CrossRef]
  25. Li, R.; Jin, M.; Paquit, V.C. Geometrical defect detection for additive manufacturing with machine learning models. Mater. Des. 2021, 206, 109726. [Google Scholar] [CrossRef]
  26. Westphal, E.; Seitz, H. A machine learning method for defect detection and visualization in selective laser sintering based on convolutional neural networks. Addit. Manuf. 2021, 41, 101965. [Google Scholar] [CrossRef]
  27. Jain, S.; Seth, G.; Paruthi, A.; Soni, U.; Kumar, G. Synthetic data augmentation for surface defect detection and classification using deep learning. J. Intell. Manuf. 2022, 33, 1007–1020. [Google Scholar]
  28. Singh, S.A.; Desai, K.A. Automated surface defect detection framework using machine vision and convolutional neural networks. J. Intell. Manuf. 2023, 34, 1995–2011. [Google Scholar]
  29. Zheng, X.; Zheng, S.; Kong, Y.; Chen, J. Recent advances in surface defect inspection of industrial products using deep learning techniques. Int. J. Adv. Manuf. Technol. 2021, 113, 35–58. [Google Scholar] [CrossRef]
  30. Wan, G.; Fang, H.; Wang, D.; Yan, J.; Xie, B. Ceramic tile surface defect detection based on deep learning. Ceram. Int. 2022, 48, 11085–11093. [Google Scholar] [CrossRef]
  31. Dey, B.; Goswami, D.; Halder, S.; Khalil, K.; Leray, P.; Bayoumi, M.A. Deep learning-based defect classification and detection in SEM images. In Metrology, Inspection, and Process Control XXXVI; SPIE: Washington, DA, USA, 2022; p. PC120530Y. [Google Scholar]
  32. Souza, R.M.; Nascimento, E.G.; Miranda, U.A.; Silva, W.J.; Lepikson, H.A. Deep learning for diagnosis and classification of faults in industrial rotating machinery. Comput. Ind. Eng. 2021, 153, 107060. [Google Scholar] [CrossRef]
  33. Stephen, O.; Madanian, S.; Nguyen, M. A hard voting policy-driven deep learning architectural ensemble strategy for industrial products defect recognition and classification. Sensors 2022, 22, 7846. [Google Scholar] [CrossRef] [PubMed]
  34. Torres, J. YOLOv8 Architecture: A Deep Dive into Its Architecture. YOLOv8. Available online: https://yolov8.org/yolov8-architecture/ (accessed on 8 December 2025).
  35. Goodfellow, I.; Bengio, Y.; Courville, A. Deep Learning; MIT Press: Cambridge, MA, USA, 2016. [Google Scholar]
  36. Simonyan, K.; Zisserman, A. Very deep convolutional networks for large-scale image recognition. arXiv 2015, arXiv:1409.1556. [Google Scholar]
  37. VGGNet-16 Architecture: A Complete Guide. Kaggle. Available online: https://www.kaggle.com/code/blurredmachine/vggnet-16-architecture-a-complete-guide (accessed on 8 December 2025).
  38. Kunkel, N. Deep learning-based automated defect classification for steel surface defects. Int. J. Adv. Manuf. Technol. 2024, 4, 2427401. [Google Scholar] [CrossRef]
  39. Rahman, A. Solar Panel Surface Defect and Dust Detection: Deep Learning Approach. J. Imaging 2025, 11, 287. [Google Scholar] [CrossRef] [PubMed]
  40. Rahman, A.; Ahmed, M.S.; AlBugami, K.N.; Alabbad, A.Y.; AlFantoukh, A.A.; Alshaikhahmed, Y.H.; Alzahrani, Z.S.; Khan, M.A.A.; Youldash, M.; Alshahrani, S.M. PPE-EYE: A Deep Learning Approach to Personal Protective Equipment Compliance Detection. Computers 2026, 15, 45. [Google Scholar] [CrossRef]
  41. Imran, M.H.; Jamaludin, S.; Khan, M.I.; Rahman, A.-U.; Ayob, A.F.M.; Bin Daud, M.Z.; Bin Ahmad, M.F.; Alqahtani, A.; Ahmad, S.Z.A.B.S.; Afrizal, N.B. Ship structure corrosion detection using advanced image processing, active contour algorithm, and parallel processing. Ocean. Eng. 2025, 341, 122351. [Google Scholar] [CrossRef]
Figure 1. Methodological steps of the proposed surface defect classification.
Computers 15 00417 g001
Figure 2. Sample images from the Phase5_Capstone dataset with class labels: corrosion_detected, no_corrorsion_detected.
Computers 15 00417 g002
Figure 3. Sample images of the six defect types in the NEU dataset: inclusion, rolled-in scale, patches, crazing, pitted surface and scratches.
Computers 15 00417 g003
Figure 4. Class distribution of merged dataset.
Computers 15 00417 g004
Figure 5. YOLOv8 architecture comprising backbone, neck, and head components [34].
Computers 15 00417 g005
Figure 6. Architecture diagram of VGGNet-16 [37].
Computers 15 00417 g006
Figure 7. Comparison of accuracy, precision, recall, and inference speed (FPS) across the three experiments.
Computers 15 00417 g007
Figure 8. YOLOv8 accuracy and loss curves.
Computers 15 00417 g008
Figure 9. Normalized confusion matrix of YOLOv8.
Computers 15 00417 g009
Figure 10. YOLOv8 per-class performance.
Computers 15 00417 g010
Figure 11. VGG16 accuracy curve.
Computers 15 00417 g011
Figure 12. VGG16 loss curve.
Computers 15 00417 g012
Figure 13. Normalized confusion matrix of VGG16.
Computers 15 00417 g013
Figure 14. VGG16 per-class performance.
Computers 15 00417 g014
Figure 15. 10-fold cross validation for YOLOv8 and VGG16.
Computers 15 00417 g015
Figure 16. Stratified 10-fold cross-validation for YOLOv8 and VGG16.
Computers 15 00417 g016
Figure 17. Comparison with state-of-the-art [3,20,38].
Computers 15 00417 g017
Table 1. Summary of the literature review of corrosion detection using deep learning.
Ref.YearMethodologyDatasetKey Findings
[7]2020FCN, U-Net, Mask R-CNN116 imagesHigher accuracy and efficiency than traditional methods
[8]2021CNN (texture), color-based, SSD (TL)Real imagesSSD performed best for real applications
[9]2021DenseNet (pre-trained)210 imagesAccuracy 92.2%
[10]2021CNN573 imagesAccuracy 92.5%, F1 98%
[11]2022Deep CNN + CycleGAN + U-Net1300 imagesAcc 98.9%, mIoU 87.8%, Prec 84.9%, Rec 81.8%, F1 83.3%
[12]2022CNN (RustSEG)1200 + 1600 imagesAcc 86.81%, AUC 94.82%,
Prec 89.38%, Rec 83.86%, F1 86.53%
[13]2025Yolov5 up to Yolov9CORROD dataset(mAP) of 96.4% with 4 ms inference time
[14]2023AMCD vs. YOLO/SSD/RetinaNet5625 imagesmAP 84.96%, best performance
[15]2023Mask R-CNN8400 imagesPrec 85.8%, Rec 84.0%
[16]2023YOLOv3 (Darknet-53)159 → 790 imagesPrecision 82.12%
[17]2023CNN (MobileNetV1 SSD)200 imagesLoss 1.673, Acc 84.66%
[18]2023ML (DT, RF, SVM, LR)1848 instancesDT accuracy 99.9%
[19]2024CNN, YOLOv8, EfficientNetB01000 imagesCNN and EfficientNetB0: 100%;
YOLOv8: 95%, 100%, 90%, 94.47%
Table 2. Summary of the literature review of deep learning for surface defect classification.
Ref.YearMethodologyDatasetKey Findings
[20]2021VGG16 (pre-trained CNN)NEU-DET, 1800 images99.4 ± 0.16% accuracy
[17]2023CNN (MobileNetV1 SSD)200 imagesLoss 1.673, accuracy 84.66%
[21]2023YOLOv5 + bootstrappingGC10-DET, 2300 images~95% recall and mAP; +10–30% improvement
[22]2025Transfer learning modelsNEU-DET, 1800 imagesDenseNet201 and ViT 100% accuracy, VGG16 and VGG19 79.6% and 83.3% accuracy
[23]2024CFE-YOLOv8NEU-DET (1800), GC10-DET (2300)mAP@0.5: 77.8%/69.5%
[25]2021ML (Bagging, RF, GB, KNN, SVM) + 3D patches50 synthetic point clouds (100k points)F-measure > 90%; Bagging and RF best; patch = 20; SVM fastest
[26]2021CNN + TL (VGG16, Xception)Small datasetsVGG16 best: Acc 95.8%, Prec 93.9%, Rec 98%, F1 95.9%, AUC 0.982
[27]2022GAN + CNN augmentationNEU, 1800 imagesSensitivity 90.28→95.33%, Specificity 98.06→99.16%
[28]2022ResNet-101 + SVMRoller defect images100% precision (Good class); low data and compute
[29]2023ResNet50 + Faster R-CNNProduction data98.2% accuracy; reduced runtime
[30]2022Improved YOLOv5sTianchi datasetAcc 94.27%, F1 89.95%, mAP 92.8%, FPS 83.3
[31]2023Ensemble DL (RetinaNet + ResNet/VGG)SEM imagesImproved mAP; robust classification
Table 3. Performance metrics of the YOLOv8 model.
YOLOv8AccuracyPrecisionRecallF1-ScoreFPSRobustness
96%98%98%98%2143.275.20%
Table 4. Performance metrics of the CNN (VGG16) model.
CNN (VGG16)AccuracyPrecisionRecallF1-ScoreFPSRobustness
100%100%100%100%82.661.2%
Table 5. Fold-by-fold accuracy and model averages.
FoldVGG16 AccuracyYOLOv8 Accuracy
10.92530.982
20.93390.985
30.93950.987
40.93950.986
50.94520.984
60.94810.989
70.95680.988
80.91930.987
90.86740.985
100.87030.986
Mean Accuracy0.92450.9859
Table 6. Average stratified 10-fold cross-validation performance summary.
ModelAvg AccuracyAvg F1-Score
YOLOv80.9857 ± 0.00370.9857 ± 0.0037
VGG160.9255 ± 0.01460.9254 ± 0.0147
Table 7. Comparative evaluation of proposed models and state-of-the-art approaches.
MethodAccuracy (%)Precision (%)Recall (%)F1-Score (%)
Proposed VGG16100100100100
Proposed YOLOv896989898
[22] ViT and ResNet201100N/AN/AN/A
[22] VGG16 and VGG1979.6% and 83.3%N/AN/AN/A
[38] YOLOv895.01009094.7
[38] CNN100100100100
[3] CNN + YOLOv888.0858786
[20] CNN (VGG16)99.4N/AN/AN/A
Table 8. Summary of key performance metrics of both models.
ModelA Stratified 10-Fold Cross-ValidationTrain/Validation/Test Split
VGG1692.5%100%
YOLOv898.5%96%
Disclaimer/Publisher’s Note: The statements, opinions and data contained in all publications are solely those of the individual author(s) and contributor(s) and not of MDPI and/or the editor(s). MDPI and/or the editor(s) disclaim responsibility for any injury to people or property resulting from any ideas, methods, instructions or products referred to in the content.