1. Introduction
In the academic environment of universities, students, researchers, professors, and faculty frequently encounter mental health issues that can significantly impact their daily performance and behavior. These issues range from stress symptoms to anxiety and depression and are often exacerbated by sedentary lifestyles and social isolation [
1,
2]. These conditions are strongly associated with academic workload, performance pressure, and environmental stressors [
3,
4]. Earlier research identified academic overload and deadline clustering as structural contributors to stress accumulation [
5,
6], while more recent work confirms their impact on academic engagement, dropout intention, and long-term wellbeing [
3]. Despite growing awareness of these effects, course calendar design remains largely a static administrative process that does not explicitly incorporate stress modeling or workload distribution analytics.
Similar patterns have been observed across diverse international higher education systems, indicating that academic stress is not confined to a specific institutional or cultural context. Large-scale observational studies using mobile sensing and behavioural data, such as the StudentLife project [
7], have demonstrated consistent associations between academic workload, behavioural patterns, and stress dynamics in university populations.
From a measurement perspective, stress has traditionally been assessed through validated psychometric instruments such as the Perceived Stress Scale [
8], alongside established methodological guidelines for psychological stress research [
9]. While self-reported measures provide essential subjective insight, physiological indicators, particularly heart rate (HR) and heart rate variability (HRV), have emerged as reliable biomarkers of autonomic stress response [
10,
11]. Experimental and field studies have demonstrated HRV sensitivity during examination periods and academic simulations [
12,
13], and wearable technologies enable continuous stress-related data acquisition in educational settings [
14,
15]. More recently, wearable systems incorporating artificial intelligence techniques have been evaluated for stress detection among student populations [
16]. In addition, recent methodological syntheses examined the validity of HRV within educational research contexts [
17].
Most existing studies focus on detecting or predicting stress at the individual level. Although these approaches provide valuable insight, they remain descriptive and reactive. They do not extend toward system-level decision-making capable of restructuring academic environments. Research has also identified contextual contributors to stress, including deadline density [
18], chronotype misalignment and sleep disruption [
19], and their association with academic performance [
20]. However, these contextual factors are rarely incorporated into computational scheduling frameworks.
A clear gap therefore exists between stress measurement research and institutional academic planning. While multimodal data streams that include physiological signals, self-reports, and academic metadata are increasingly available, these data sources are not typically exploited to construct computational representations capable of simulating course-level dynamics and evaluating alternative scheduling strategies. As a result, stress analytics remain largely observational rather than operational within academic decision-making processes.
Recent advances in Digital Twin technologies provide a promising paradigm for bridging this gap. Originally developed for cyber-physical systems and industrial environments, Digital Twins enable the creation of computational representations that mirror real-world systems and support simulation-based optimization and decision support [
21,
22]. More recently, this paradigm has begun to extend toward human-centered systems in which behavioral, physiological, and contextual variables interact dynamically [
23,
24]. In such settings, Digital Twins function as semantic computational environments capable of evaluating hypothetical interventions before they are applied in real-world contexts.
Building on this perspective, this work introduces a Course Digital Twin designed specifically for academic environments. The proposed system integrates multimodal biosignals, validated stress measurement principles [
9,
11], contextual workload parameters [
4,
18], and chronotype-related behavioral constraints [
19,
20]. Instead of treating academic calendars as static administrative artifacts, the Course Digital Twin models the temporal distribution of lectures, laboratories, assignments, and examinations as dynamic variables whose stress impact can be simulated and optimized.
Within this framework, overall student stress is estimated through a weighted fusion of physiological indicators, self-reported measures, and Academic Load and Context components derived from course configuration. The course planning task is formulated as the minimization of population-level stress under institutional and pedagogical constraints. Rather than relying on opaque optimization algorithms, the proposed framework employs transparent rule-based transformations such as deadline redistribution, recovery insertion. Machine learning components are primarily used for physiological stress estimation from wearable data [
16], while the scheduling adaptation process remains transparent and interpretable within the Course Digital Twin framework.
Through the integration of multimodal sensing, validated stress indicators, and Digital Twin simulation, the proposed framework enables student wellbeing analytics to inform course-level academic planning. This approach enables universities to move beyond retrospective stress measurement toward proactive, data-informed course design. A preliminary version of this platform was introduced in [
25], where the initial architecture for wearable-based stress monitoring in higher education was presented. The present study substantially extends that work by introducing the Course Digital Twin concept, integrating course-level scheduling simulation, multimodal stress modelling, and decision-support tools for instructors and institutional stakeholders. The proposed framework is evaluated through a pilot deployment and should be interpreted as a feasibility-level approach demonstrating the integration of multimodal stress modelling and simulation-based academic planning, rather than as a fully validated optimization system.
The contributions of this work are as follows:
A semantic Digital Twin model integrating multimodal physiological, behavioral, and contextual academic data.
A formal objective formulation defining course planning as the minimization of mean student stress.
A rule-based adaptive scheduling mechanism enabling explainable calendar simulation and refinement.
A deployable privacy-preserving system architecture for multimodal academic decision support.
By framing course planning as a computational simulation and optimization problem grounded in validated stress measurement research, this study connects multimodal sensing with institutional scheduling processes. The proposed framework demonstrates how Digital Twin methodologies can support adaptive and personalized academic planning in higher education environments.
2. Related Work
Research on student mental health consistently reports a high prevalence of stress, anxiety, and depression among university students. These conditions are strongly associated with academic workload, performance pressure, and environmental demands [
1,
2,
3,
4,
5,
6]. Psychometric instruments such as the Perceived Stress Scale (PSS) [
8] remain widely used for assessing perceived stress, while methodological reviews provide best-practice guidelines for measuring psychological stress in health research [
9]. Although such instruments provide valuable insight into subjective stress perception, they are typically episodic and rely on retrospective reporting, which limits their ability to capture continuous stress dynamics in academic environments.
Physiological sensing has therefore emerged as an important complementary modality for stress assessment. In particular, heart rate (HR) and heart rate variability (HRV) are widely recognized indicators of autonomic nervous system activity and emotional regulation [
10,
11]. Standardized HRV measurement guidelines established by the European Society of Cardiology [
26] and subsequent methodological reviews [
27] have confirmed HRV as a reliable biomarker of stress-related physiological responses. The neurovisceral integration model further explains how HRV dynamics reflect emotional and cognitive regulation processes [
28]. Empirical studies conducted in educational environments have demonstrated measurable HRV changes during examination periods and academic simulations [
12,
13,
29]. These findings support the use of wearable-derived physiological signals for monitoring stress responses within student populations.
Recent advances in wearable technologies and ubiquitous computing have enabled large-scale monitoring of behavioural and physiological signals. Early work in affective computing introduced computational systems capable of detecting and responding to human emotional states [
30]. Building on this paradigm, mobile sensing platforms such as the StudentLife project demonstrated how smartphone-based behavioural data can reveal patterns associated with academic performance and mental well-being [
7]. Public datasets including WESAD and SWELL subsequently provided standardized benchmarks for stress recognition research using multimodal physiological signals [
31,
32]. Continuous stress detection pipelines have also been proposed for real-world monitoring using wearable sensors and context-aware machine learning techniques [
33,
34]. Earlier work further demonstrated the feasibility of detecting stress during everyday activities such as driving using physiological sensors [
35]. More recent research in affective computing continues to explore large-scale emotion recognition using physiological and behavioral data [
36,
37].
Beyond physiological sensing, several studies have investigated contextual contributors to academic stress, including deadline clustering, workload distribution, chronotype misalignment, and sleep disruption [
4,
18,
19,
20]. Learning analytics research has also examined how course workload structure and assignment timing influence student engagement and academic performance outcomes [
38,
39]. However, most existing research focuses primarily on stress measurement or prediction rather than providing mechanisms for actively redesigning course schedules based on stress indicators.
Parallel work in operations research has explored algorithmic approaches for university timetabling and course scheduling optimization. Surveys of automated timetabling methods highlight the use of constraint programming, metaheuristics, and hybrid optimization techniques for constructing feasible academic schedules under institutional constraints [
40,
41,
42]. While these approaches address logistical feasibility and fairness in resource allocation, they rarely incorporate physiological or psychological indicators of student well-being.
The Digital Twin paradigm offers a promising framework for integrating these domains. Originally developed for cyber-physical and manufacturing systems [
43,
44,
45], the concept has recently expanded toward human-centred environments in which behavioural and physiological signals can be integrated into dynamic computational models [
23,
24]. Recent research has also begun exploring the use of Digital Twin methodologies in educational and training environments [
46,
47]. Within this context, a Course Digital Twin can serve as a semantic model of the academic environment, enabling simulation of workload distribution and stress dynamics before scheduling decisions are implemented.
Table 1 summarizes representative related work across stress monitoring, learning analytics, academic timetabling, and Digital Twin research, highlighting the absence of integrated stress-aware scheduling support in existing approaches.
Despite extensive research on physiological stress monitoring, learning analytics, and academic scheduling optimization, existing studies typically address these domains independently. To the best of our knowledge, no prior work integrates multimodal physiological sensing, contextual academic workload modelling, and simulation-based scheduling within a unified Digital Twin framework designed to support stress-aware academic planning.
3. Materials and Methods
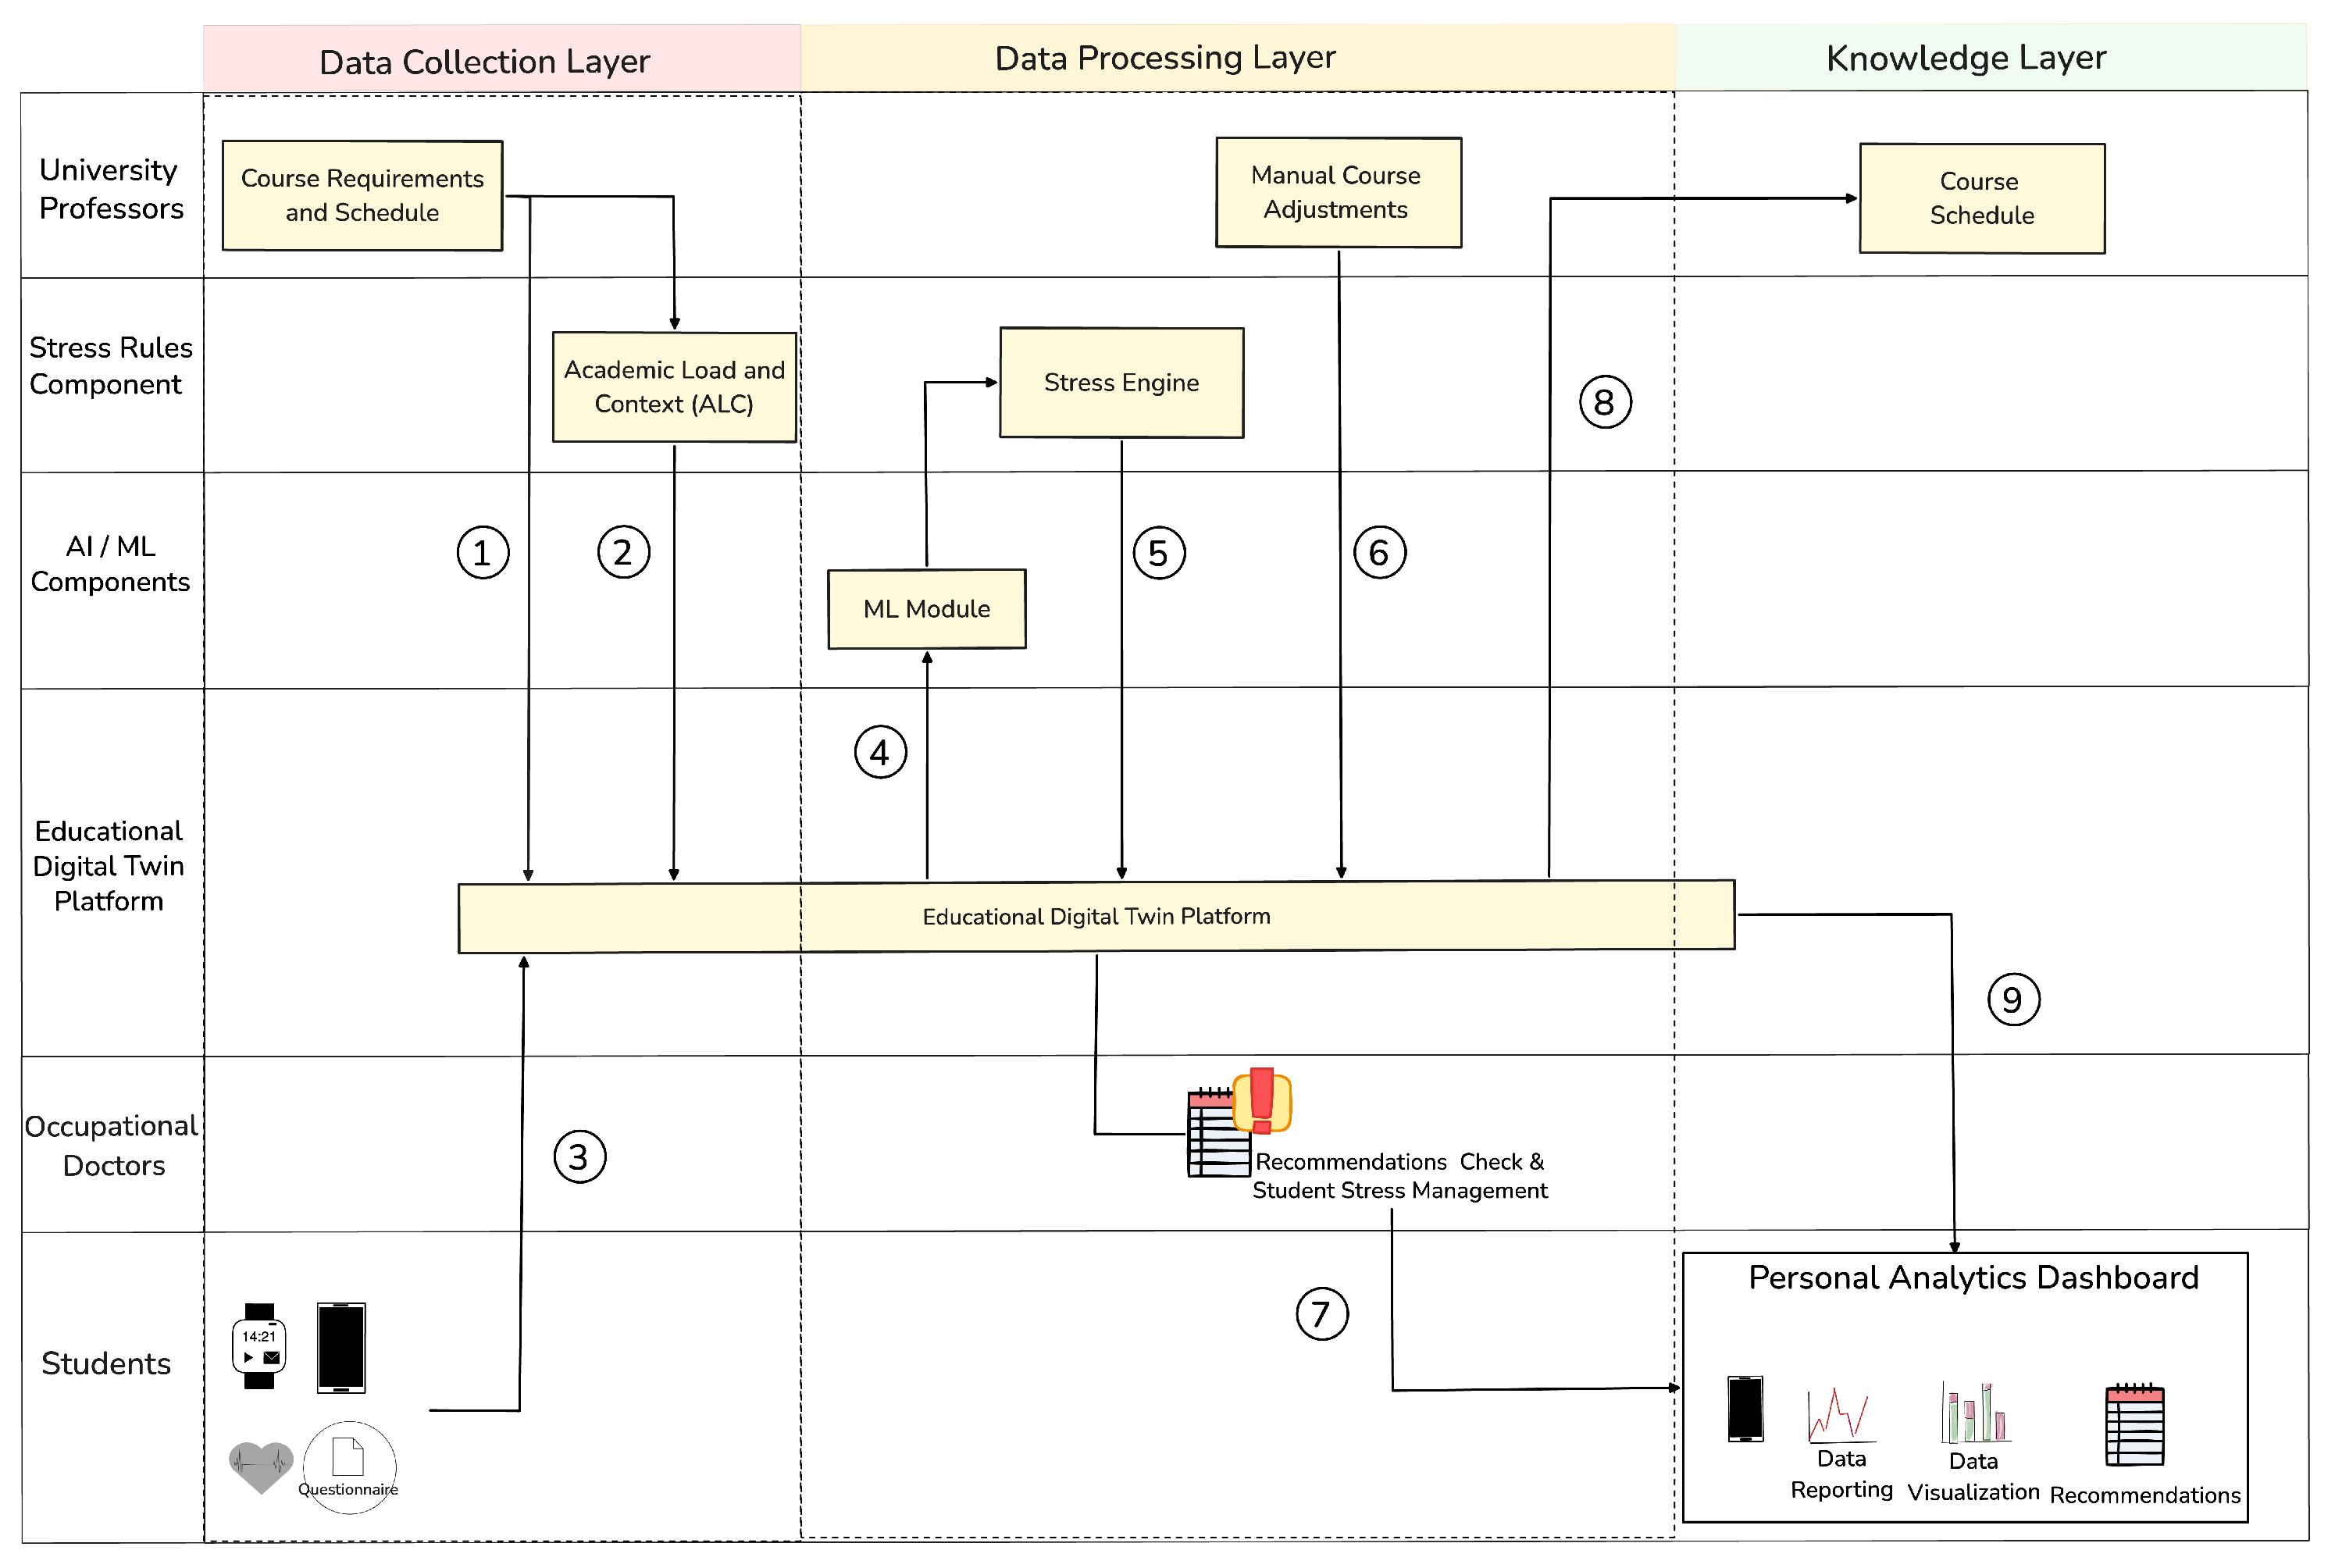
Figure 1 illustrates the overall architecture of the proposed solution, implemented within the AI4Work platform and structured as a three-layer system. The architecture integrates multimodal inputs including wearable-derived physiological signals, self-reported assessments, and contextual academic metadata collected through mobile and web interfaces. These inputs are normalized and processed through a modelling pipeline that combines rule-based workload logic with machine learning components for physiological stress estimation. The resulting stress indicators are fused into a unified Stress Index that supports simulation-based course analysis, scheduling adjustments, and decision-support functionalities.
The architecture operationalizes a Course Digital Twin in which academic scheduling decisions are evaluated through multimodal stress modelling. Students provide physiological and self-reported data through a mobile application connected to wearable devices. Professors define course structures, lectures, laboratory sessions, and assignment timelines through a web platform. Occupational doctors access aggregated stress trajectories and review system-generated recommendations in severe cases. These recommendations correspond to platform-generated stress self-management suggestions that, after medical review and approval, can be communicated to students through the mobile application. These heterogeneous inputs are integrated through a hybrid rule-based and learning-supported stress modelling pipeline to compute a unified Stress Index that supports course-level optimization.
3.1. Data Collection Layer
The Data Collection Layer consists of three primary input streams:
Student mobile and wearable monitoring
Academic course configuration by professors
Administrative course metadata
Mobile and Wearable Monitoring Component: A mobile application was developed in order to enable continuous physiological monitoring and structured questionnaire collection. The application connects to commercially available wearable devices and supports secure data transmission to backend services. Each student authenticates using a six digit code, ensuring privacy and pseudonymisation. The wearable integration captures several physiological indicators including heart rate (HR), heart rate variability (HRV; RMSSD), step count, sleep duration (when available). Physiological signals are sampled at device-dependent frequencies and aggregated into session-level measurements before transmission to the backend infrastructure. HRV is treated as a primary biomarker of autonomic stress, supported by extensive evidence linking reduced HRV to stress exposure in general populations [
10,
11] and in academic contexts, including examination periods [
12,
13,
17]. The platform is designed to ensure interoperability across multiple wearable device providers in order to maximize adoption within the student population. Device-level variability introduces differences in the availability and computation of heart rate variability (HRV) metrics. Certain providers compute and expose HRV values directly through proprietary firmware or application programming interfaces. When such values are available, they are ingested and validated within the platform without alteration. For wearable devices that do not provide HRV measurements, raw heart rate time series are transmitted to the backend infrastructure, where HRV (RMSSD) is computed server-side using a standardized processing pipeline. This centralized computation ensures methodological uniformity across devices and reduces variability arising from proprietary or undocumented on-device algorithms.
Furthermore, self-reported data are collected at multiple temporal resolutions, including pre- and post-lecture, pre- and post-laboratory, and monthly assessments. These instruments capture perceived stress and subjective workload across both immediate academic activities and broader course conditions. The monthly assessment is based on the Student Stress Inventory (SSI, Edition 2020) [
48], a structured instrument designed to evaluate multidimensional academic stress over extended periods. Self-reports complement physiological monitoring by capturing cognitive and emotional dimensions not fully reflected in bio-signals. The integration of subjective and physiological modalities follows established stress research recommendations and supports interpretation of stress during cognitively demanding yet physically inactive activities [
9,
17].
Baseline measures are collected during a low-pressure onboarding phase at the beginning of the course and serve as personalized reference values for subsequent normalization procedures. These measures include resting or light-study heart rate statistics, heart rate variability (HRV; RMSSD) central tendency, and typical daily physical activity levels derived from step counts. When supported by the wearable device, baseline sleep duration is also recorded. The establishment of individualized baselines enables longitudinal within-subject comparison and reduces inter-subject variability inherent in physiological metrics. This normalization strategy is essential for reliable interpretation of stress-related autonomic deviations, ensuring that subsequent stress estimates reflect meaningful departures from each student’s typical physiological profile rather than population-level averages.
Academic Configuration Component: The academic configuration process defines the structural foundation of each Course Digital Twin (CDT) and corresponds to the formal course creation procedure within the platform. Professors specify course scheduling parameters including:
Lecture scheduling (day, start time, duration, and recurrence pattern)
Laboratory scheduling and grouping structure
Assignment definition, release dates, and submission deadlines
Examination dates and assessment milestones
These inputs constitute the formal representation of the course timeline and workload distribution within the Course Digital Twin. The defined schedule, assessment structure, and temporal constraints are stored as structured academic metadata and transmitted to the Data Processing Layer. There, they are incorporated into the Academic Load and Context module where factors such as deadline density, examination proximity, and session clustering are computed at course level.
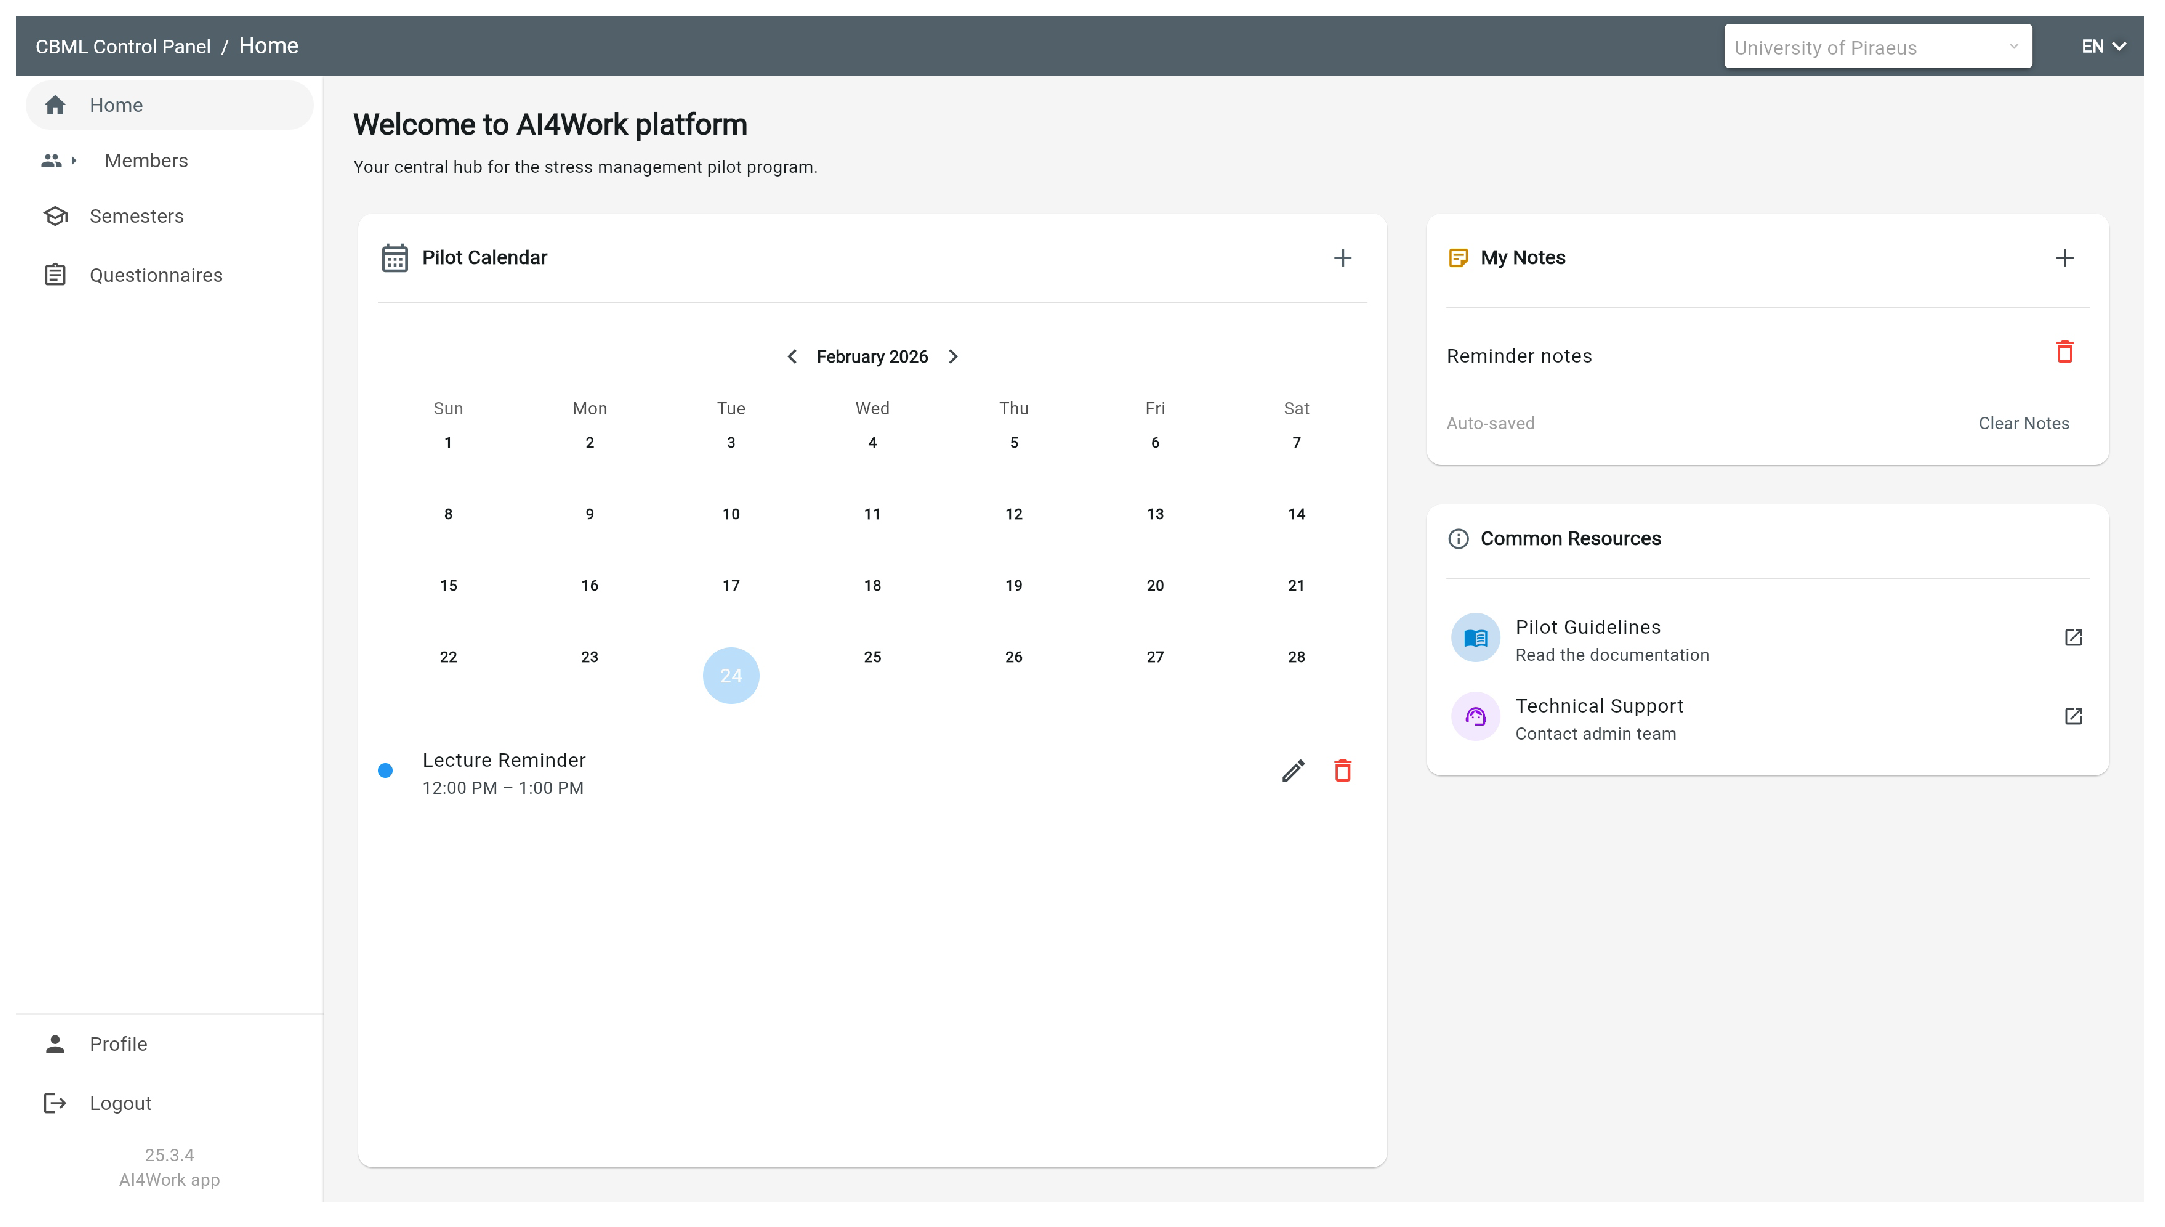
Administrative and Institutional Inputs: The web application provides a dedicated administrative interface responsible for institutional configuration and governance operations. This layer supports academic period definition, questionnaire template configuration, and structured user management across departments. Academic period configuration enables administrators to define institutional calendars, enrolment windows, and temporal boundaries within which Course Digital Twins (CDTs) operate.
The administrative home dashboard functions as the central control interface for institutional coordination. It provides direct access to pilot calendar management, shared documentation resources, and navigation toward configuration modules related to semesters, courses, users, and questionnaires. User management is handled through a role-based authorization framework. Only administrators can register and manage students, professors, occupational doctors, and support personnel under clearly defined access permissions. Students are registered using pseudonymized system identifiers rather than direct personal information in order to protect participant privacy. This structured role separation ensures that physiological data, simulation tools, and institutional configuration capabilities remain appropriately segmented according to operational responsibilities. Semester configuration enables administrators to define academic periods and associate courses within structured temporal boundaries. This configuration establishes the macro-level institutional framework within which individual Course Digital Twins are instantiated. By formalizing start and end dates, course allocation, and academic segmentation, the system ensures consistent longitudinal stress modelling across defined academic intervals.
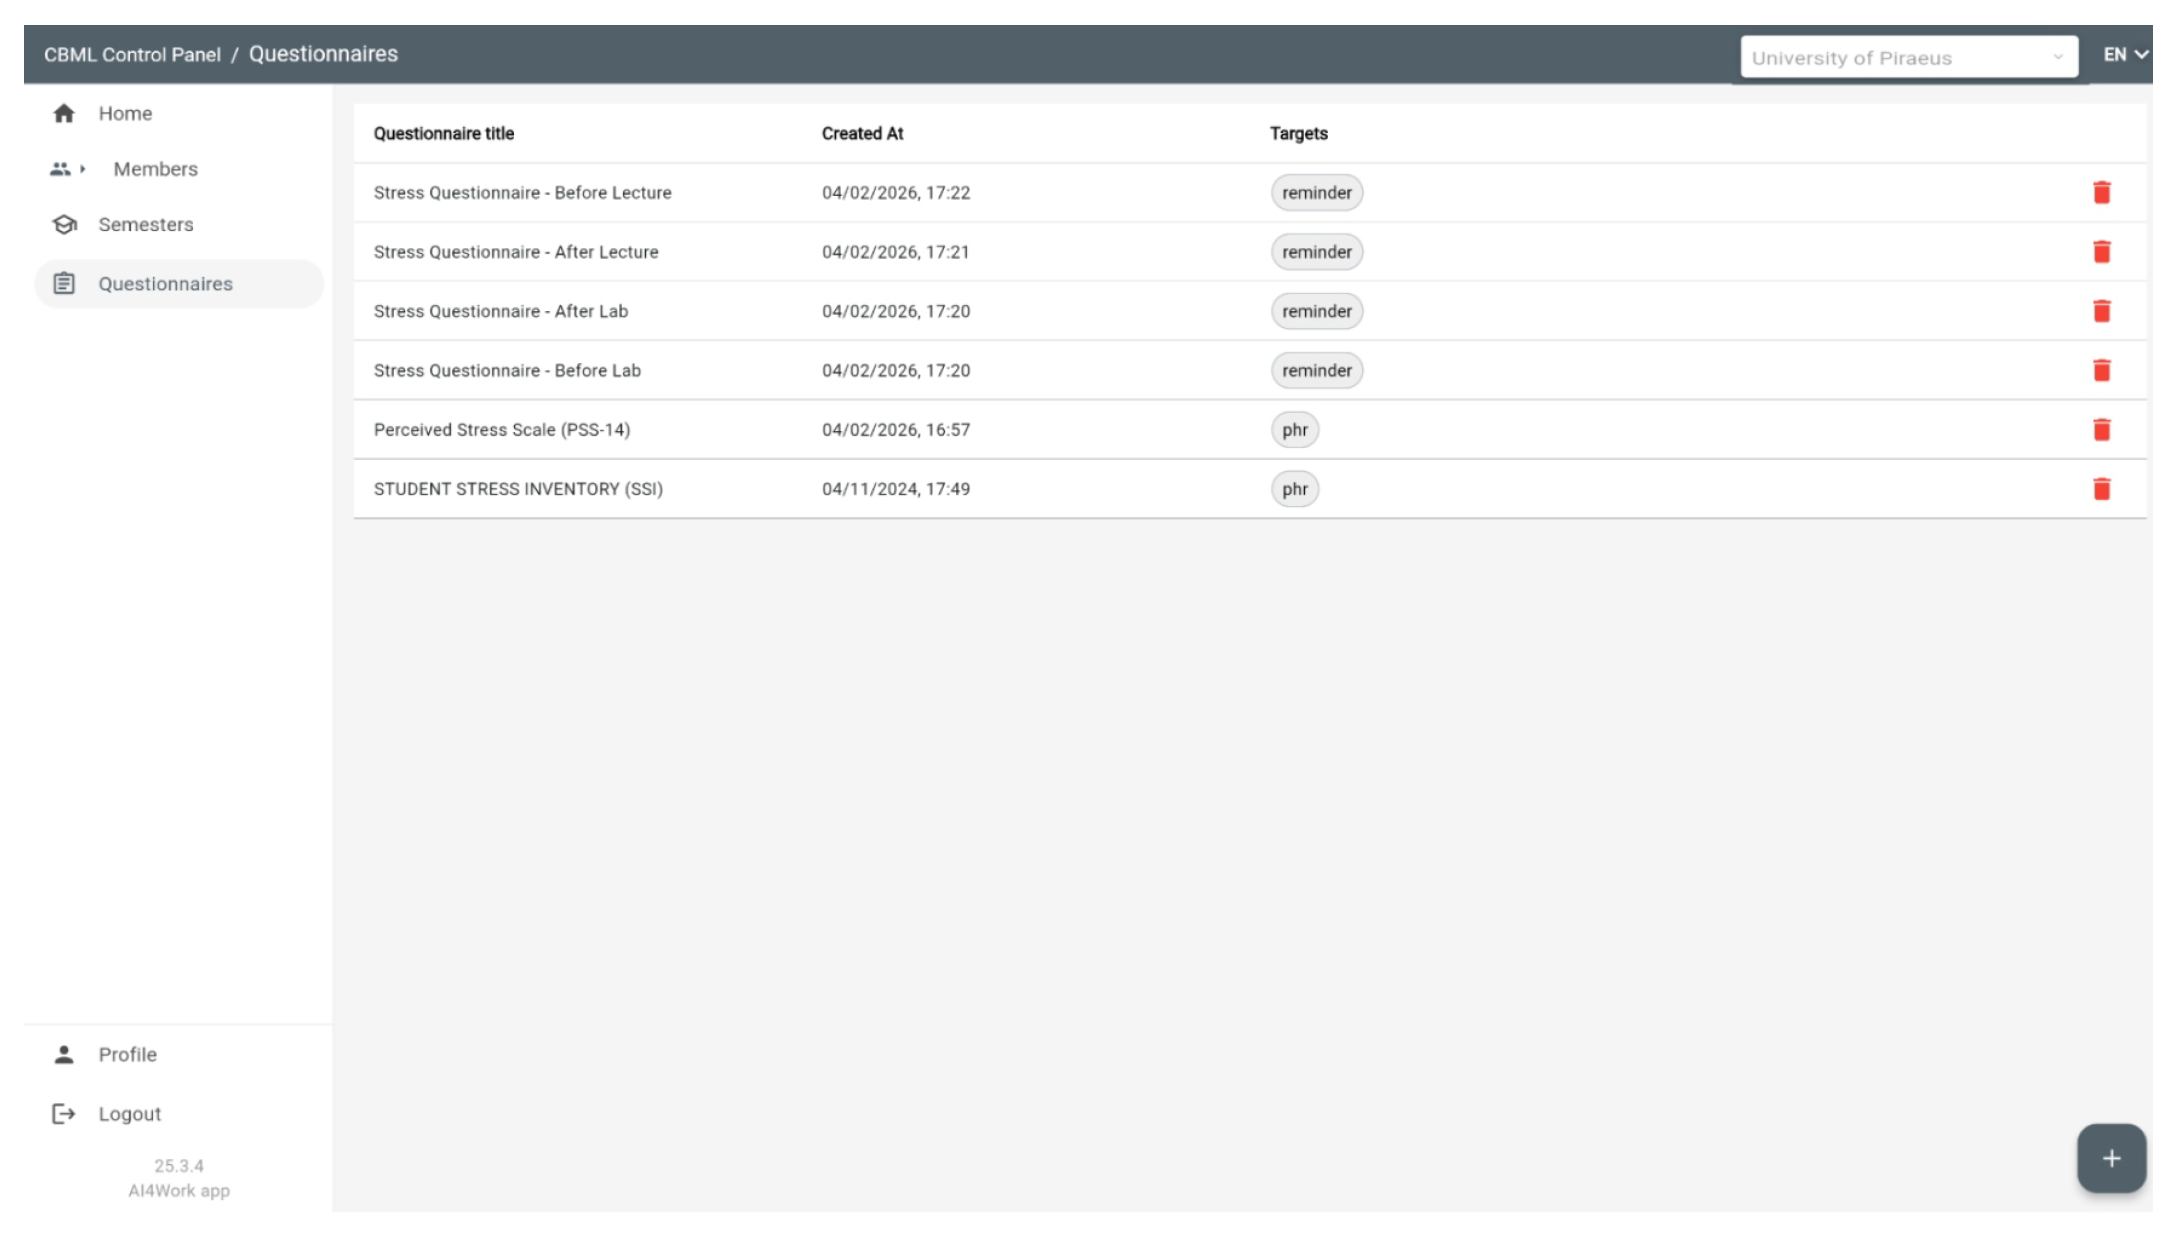
Questionnaire configuration allows authorized personnel to manage and version stress assessment instruments, including baseline, session-level, and monthly evaluations, ensuring methodological consistency across courses. The system supports multilingual questionnaire deployment, enabling students to respond in their native language and facilitating consistent data collection across institutions in different countries. In addition to scheduled reminder-based questionnaires triggered at predefined academic events or time intervals, the platform also supports static questionnaires that can be completed at any time, allowing flexible self-reporting outside structured sessions. By centralizing these institutional parameters, the platform ensures standardized data collection procedures, coherent academic metadata integration, and consistent deployment across departments.
3.2. Data Processing Layer
The Data Processing Layer integrates multimodal inputs through three core components:
Machine Learning Module: The Machine Learning (ML) module estimates physiological stress using supervised learning models trained on features derived from heart rate (HR) and heart rate variability (HRV; RMSSD). HR captures short-term cardiovascular response to workload and stimuli, while HRV reflects autonomic nervous system balance and recovery dynamics. The training data were collected during the pilot deployment through the mobile and wearable sensing infrastructure and stored in a document-oriented database. Data are organized as session-based records, where each session contains time-series physiological measurements and associated self-reported stress labels. Due to this structure, the dataset is composed of variable-length time windows rather than a fixed tabular format, and the total number of usable samples depends on data availability, device usage consistency, and questionnaire completion. Feature construction is performed by extracting statistical descriptors over fixed temporal windows, including mean HR, RMSSD, HR deviation from baseline, HRV deviation from baseline, and activity-adjusted indicators. These features are derived from aggregated physiological signals and aligned with corresponding self-reported stress labels. Stress labels were derived from self-reported questionnaire responses, which were mapped to discrete stress categories and used as ground truth for supervised learning.
Several supervised learning models were evaluated, including Logistic Regression, Support Vector Machines (SVM), Random Forest, and Gradient Boosting classifiers. Model evaluation was conducted using cross-validation to maximize the use of available data while maintaining separation between training and validation samples. To reduce potential data leakage, samples derived from the same session were not distributed across different folds. Performance was assessed using standard classification metrics including accuracy, F1-score, and area under the ROC curve (AUC). The results indicate that HR and HRV-derived features provide meaningful discriminative information for physiological stress estimation within the constraints of the pilot dataset. Due to the nature of real-world data collection, class imbalance may be present across stress categories; however, cross-validation and the use of multiple evaluation metrics mitigate potential bias in model assessment. Across the evaluated models, performance ranged approximately between 0.75–0.85 in F1-score and above 0.80 AUC, indicating moderate discriminative capability for physiological stress estimation within the pilot dataset. Detailed hyperparameter optimization was not the focus of this study, as the ML component is intended to support feasibility-level stress estimation rather than optimized predictive performance.
It should be noted that, due to the pilot-scale deployment and reliance on wearable device usage, the dataset remains limited and partially incomplete, with variability in sampling frequency and session availability across participants. Therefore, the ML component should be interpreted as a feasibility-level stress estimation module rather than a fully validated predictive model.
The selected model outputs a probabilistic stress estimate , which is integrated into the Physiological Stress (PS) component when sufficient data quality is available. In cases of missing HRV measurements, low signal quality, or incomplete sessions, the system falls back to the deterministic rule-based formulation, ensuring robustness and continuous operation.
Academic Load and Context Module (ALC): The ALC module encodes workload-related stressors derived from semester configuration including:
Each factor contributes bounded points to a contextual load score. This score captures externally imposed workload pressure independent of physiological signals [
19,
20,
49].
Rule-Based Stress Engine: The Rule-Based Stress Engine constitutes the core computational mechanism of the Course Digital Twin. It integrates baseline-normalized physiological indicators, self-reported stress assessments, and the contextual load score produced by the ALC module into structured stress components and a final Stress Index. Two types of stress indicators are considered in the system. Observed stress corresponds to stress signals derived from physiological measurements and questionnaire responses collected from students during real course execution. Projected stress refers to simulated stress trajectories generated by the Course Digital Twin when evaluating alternative scheduling configurations before implementation. Projected stress therefore represents a forward-looking estimate produced by the simulation engine, while observed stress reflects the actual measurements collected from wearable devices and self-reported assessments.
Physiological inputs are normalized per student to reduce inter-subject variability. Deviations from baseline are computed as:
Physiological Stress (
) is then estimated as:
HRV is prioritized due to strong empirical evidence linking reduced HRV to autonomic stress responses in both general and academic populations [
10,
11,
12,
13,
29,
50]. An activity-aware buffer mitigates movement-induced HR elevation.
Self-Reported Stress (
) aggregates multiple temporal scales:
The weighting scheme of the Stress Index is informed by findings in stress measurement literature and is designed to balance objective physiological indicators, subjective perception, and contextual academic workload. Physiological Stress (PS) is assigned the highest contribution (50%) due to strong empirical evidence supporting heart rate variability (HRV) and heart rate (HR) as reliable biomarkers of autonomic nervous system activity and stress response [
10,
11,
26,
27]. Reduced HRV has been consistently associated with increased stress levels across both clinical and educational settings, reflecting impaired parasympathetic regulation and reduced recovery capacity [
12,
13,
29,
50]. Self-Reported Stress (SRS) contributes 25% to the final Stress Index. Psychometric instruments such as the Perceived Stress Scale (PSS) are widely validated and provide valuable insights into perceived stress and cognitive-emotional load [
8,
9]. However, self-reported measures are inherently subjective and episodic, and may not fully capture continuous physiological stress dynamics. For this reason, SRS is incorporated as a complementary component rather than a dominant factor. The Academic Load and Context (ALC) component is also assigned a 25% contribution, reflecting the well-documented role of external workload factors in stress generation. Studies in educational research have shown that deadline clustering, workload intensity, and temporal distribution of academic activities significantly influence student stress and performance outcomes [
4,
18,
38,
39]. These contextual factors represent externally imposed stressors that operate independently of physiological and subjective measures and are therefore incorporated as a separate structural component.
Priority overrides handle nonlinear escalation scenarios, including imminent examinations combined with elevated perceived stress, significant HRV suppression, dense deadline clustering, and severe sleep deprivation [
12,
13,
23]. A confidence coefficient quantifies data completeness and signal reliability. Starting from
, penalties are applied for missing HRV data, incomplete questionnaires, or unreliable segments. A minimum confidence floor of
is enforced, and sessions below
are flagged for review. Fallback rules ensure continuous operation under partial modality absence.
The selected weights were chosen to ensure interpretability and stability of the Stress Index while aligning with the relative reliability and temporal characteristics of each modality. Physiological signals provide continuous and objective measurements, self-reports capture subjective perception, and contextual workload reflects structural academic pressure. Although the weighting scheme is not derived from large-scale parameter optimization, it is grounded in established literature and designed to provide a balanced and transparent integration of multimodal stress indicators within the Course Digital Twin framework.
Stress levels are categorized as: 0–24 (Low), 25–50 (Normal), 51–75 (Moderate), and 76–100 (High). This weighting prioritizes physiological validity while preserving subjective perception and structural workload contributions [
4,
11].
3.3. Knowledge and Decision-Support Layer
The Knowledge Layer operationalizes the Course Digital Twin by transforming processed stress indicators and contextual workload information into actionable decision-support tools for instructors, occupational health personnel, and students. This layer integrates course-level stress modelling, simulation capabilities, and personalized feedback mechanisms.
Course Scheduling and Simulation Module: The Course Digital Twin provides an interactive simulation environment that enables instructors to evaluate alternative course configurations before applying them to the academic schedule. Course metadata including lecture hours, laboratory sessions, assignments, and examination dates are used to construct a temporal representation of the course workload across the semester. Using this representation, the system computes the projected Stress Index trajectory for the course timeline. The trajectory integrates physiological stress trends derived from aggregated student signals, self-reported stress assessments, and contextual workload indicators generated by the Academic Load and Context module. The resulting stress profile allows instructors to identify workload peaks associated with assignment clustering, examination proximity, or dense instructional scheduling. The system supports simulation-based adjustments to course parameters including lecture redistribution, laboratory session rescheduling, assignment deadline modification, and attendance format adjustments. Each modification triggers a recalculation of contextual workload variables and a recomputation of the Stress Index trajectory. This simulation capability allows instructors to evaluate the projected impact of scheduling changes before committing modifications to the actual course structure.
Occupational Health Monitoring Module: In addition to instructor-facing decision support, the Knowledge Layer provides an institutional monitoring interface for occupational health personnel. This component enables the analysis of aggregated and anonymized stress trajectories across students within a specific academic organization while preserving privacy-by-design principles. Stress trajectories are evaluated longitudinally across the academic timeline, enabling the identification of persistent high-stress patterns, abrupt stress escalations, or prolonged recovery deficits. When sustained high-risk conditions are detected by the stress engine based on predefined thresholds and confidence indicators, the system generates recommendation candidates. These recommendations are not automatically transmitted to students. Instead, they are routed to the occupational doctor for review. The occupational doctor may either approve and forward the recommendation to the student or reject the recommendation based on clinical judgement. This approval workflow prevents automated over-notification and ensures that interventions remain selective and medically meaningful.
Student Personal Analytics Module: The student-facing component of the Course Digital Twin provides individualized access to physiological indicators, self-reported stress assessments, and computed stress metrics. Students can review historical bio-signal data including heart rate, heart rate variability, activity levels, and sleep duration when available. These indicators are presented alongside self-reported questionnaire responses to support interpretation of perceived and physiological stress patterns. The platform also delivers personalized recommendations derived from the stress modelling framework. In cases of elevated stress risk, recommendations may include workload pacing suggestions, recovery guidance, sleep optimization strategies, or referral to academic or medical support services. When required, these recommendations are validated through the occupational health review workflow before delivery to the student.
3.4. Privacy, Security, and Governance Framework
The proposed platform is designed under strict privacy-by-design and data minimization principles. No directly identifiable personal information is required for system operation. Each student is assigned and authenticated using a randomly generated six-digit code that serves as a pseudonymous system identifier. The platform does not require direct personal identifiers such as names, email addresses, or institutional identifiers for stress modelling or scheduling optimisation.
Data access is governed through a role-based authorization mechanism that restricts visibility according to user roles. Data processing is performed solely for stress-aware academic optimisation and decision support. The Stress Index is used as an internal optimisation signal and does not constitute a clinical diagnosis. The system does not perform automated punitive actions, grading adjustments, or academic penalties based on stress levels. Data retention policies are configurable at institutional level. Historical physiological data may be aggregated or anonymized further for longitudinal research analysis, subject to institutional ethics approval. Students retain the right to opt out of data collection at any time, in which case wearable monitoring and questionnaire collection are discontinued without affecting academic participation.
3.5. Deployment Requirements and Operational Considerations
The deployment of the proposed Course Digital Twin platform requires an integrated ecosystem consisting of a wearable device, a smartphone running a dedicated mobile application, and a supporting backend infrastructure.From a hardware perspective, the system relies on commercially available wearable devices capable of providing heart rate and, when supported, heart rate variability (HRV) measurements. These devices must support continuous or periodic physiological monitoring and provide access to aggregated metrics through application programming interfaces. In addition, students require access to a compatible smartphone device for data synchronization, questionnaire completion, and interaction with the mobile application.
From a software and infrastructure perspective, the system is implemented using a mobile application for data collection and a web-based platform for course configuration, analytics, and decision support. Backend services are responsible for secure data storage, processing, and integration of multimodal inputs. The platform is designed to operate on a cloud-based infrastructure, enabling scalability across multiple courses and institutions. Reliable internet connectivity is required for periodic data transmission, although temporary offline operation is supported through local buffering on mobile devices.
Operational deployment also requires coordination at the institutional level, including course configuration by instructors, user registration, and questionnaire management by administrators. Training requirements for instructors and students are minimal, as the platform is designed to integrate with existing academic workflows.
It should be noted that the current implementation targets higher education environments, particularly postgraduate courses, where students are more likely to comply with wearable usage and structured data collection protocols. Deployment in younger populations, such as secondary education, may introduce additional challenges related to device compliance, ethical approval procedures, and user engagement.
4. Results
4.1. Pilot Deployment Overview
Figure 2 illustrates the main system dashboard of the Course Digital Twin platform. This interface provides an overview of course activity, scheduling status, and system-level information, serving as the central entry point for instructors and administrators.
Through this interface, users can navigate to core administrative functionalities, including participant management and course configuration.
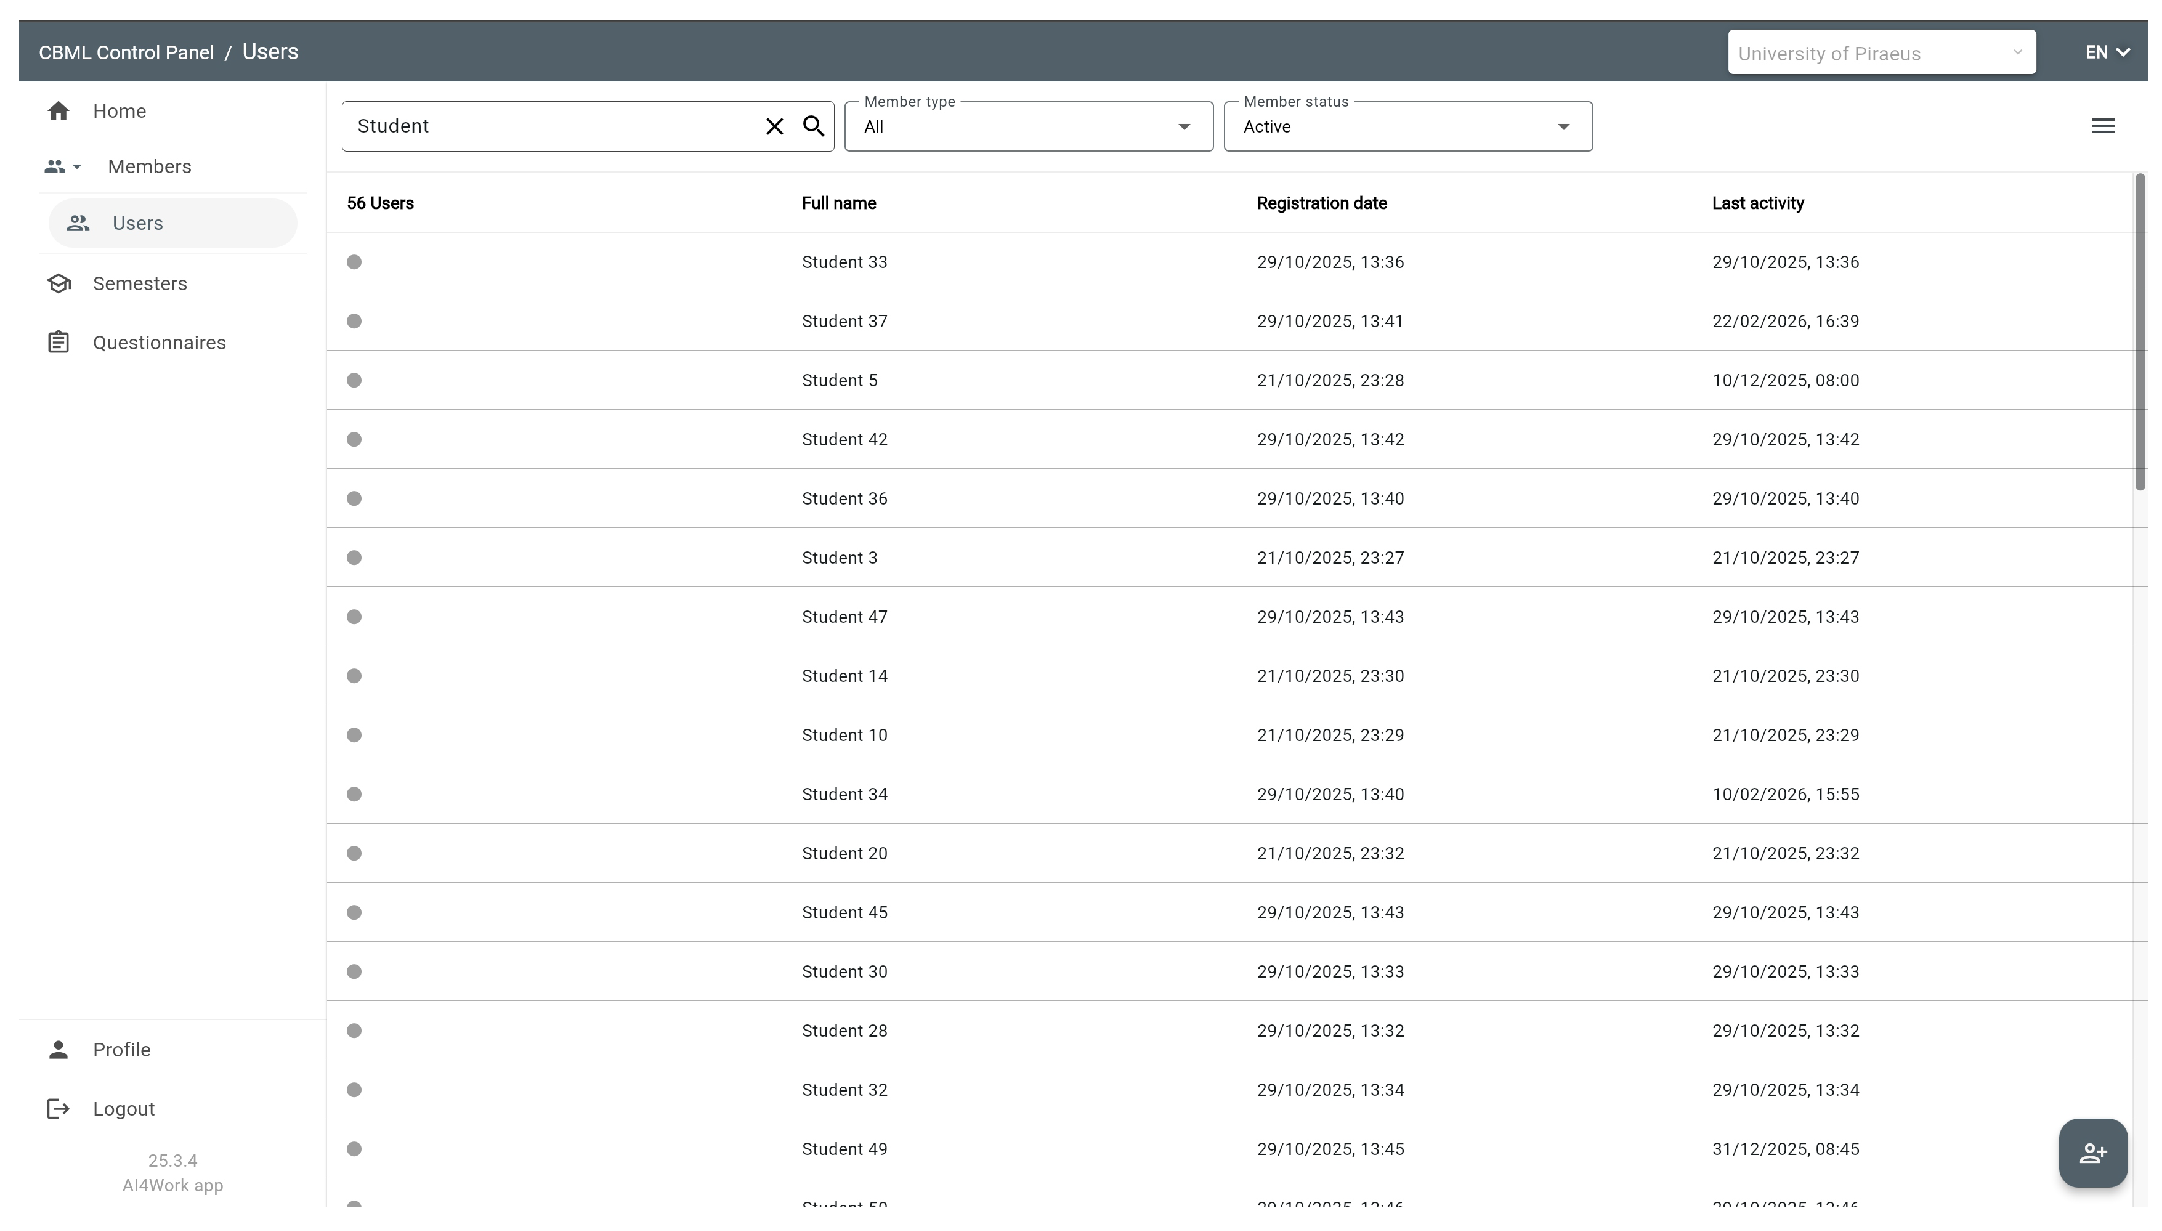
Figure 3 presents the participant management interface, where instructors and administrators can monitor enrolled students and manage user roles within the system.
In addition to user management, the platform supports structured configuration of data collection instruments.
Figure 4 shows the questionnaire management interface, which allows administrators to define, modify, and deploy stress assessment instruments used throughout the pilot.
4.2. System Operation in Practice
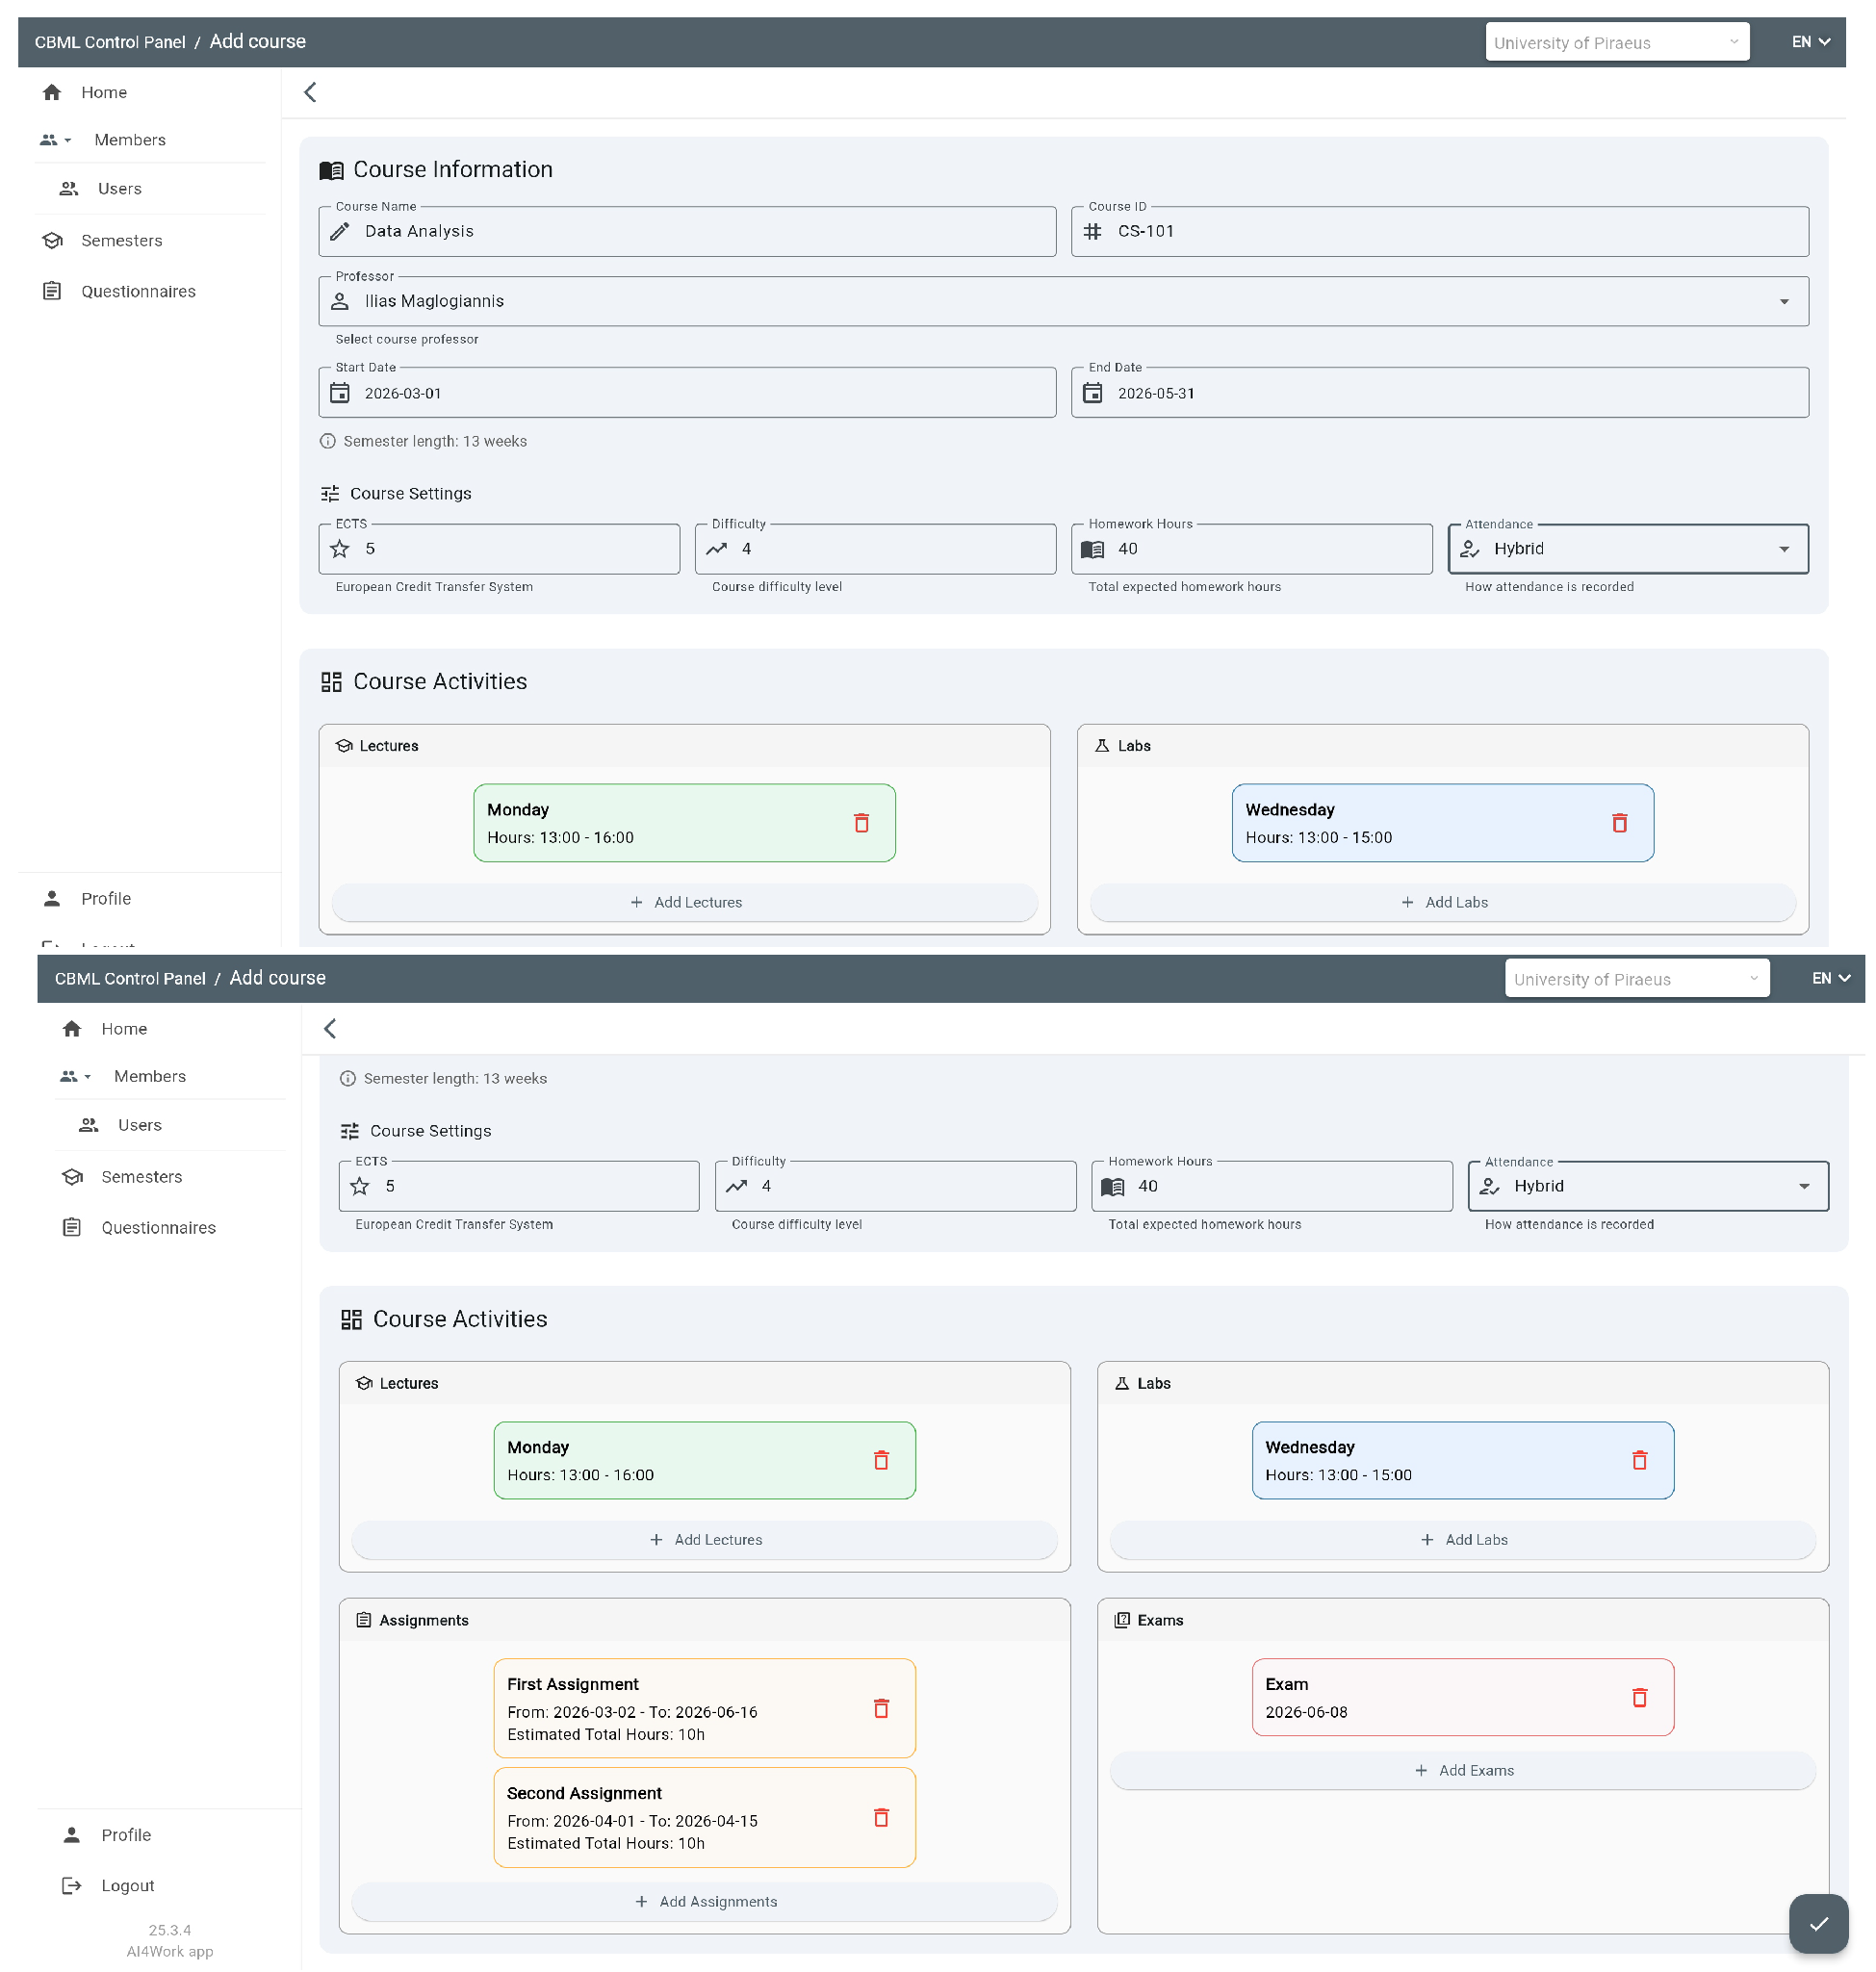
Course structure and workload parameters are configured through a dedicated scheduling interface that allows instructors to define lecture sessions, laboratory sessions, assignment timelines, and course metadata.
Figure 5 presents representative views of the course creation workflow. Instructors define core course attributes such as duration, ECTS credits, and difficulty level, followed by the specification of teaching activities including lectures, laboratory sessions, assignments, and examinations.
Once course parameters are defined, the system generates a structured workload model that forms the basis for stress trajectory simulation and analysis. The configured course is then represented within the Course Digital Twin environment, where workload distribution and stress dynamics can be examined.
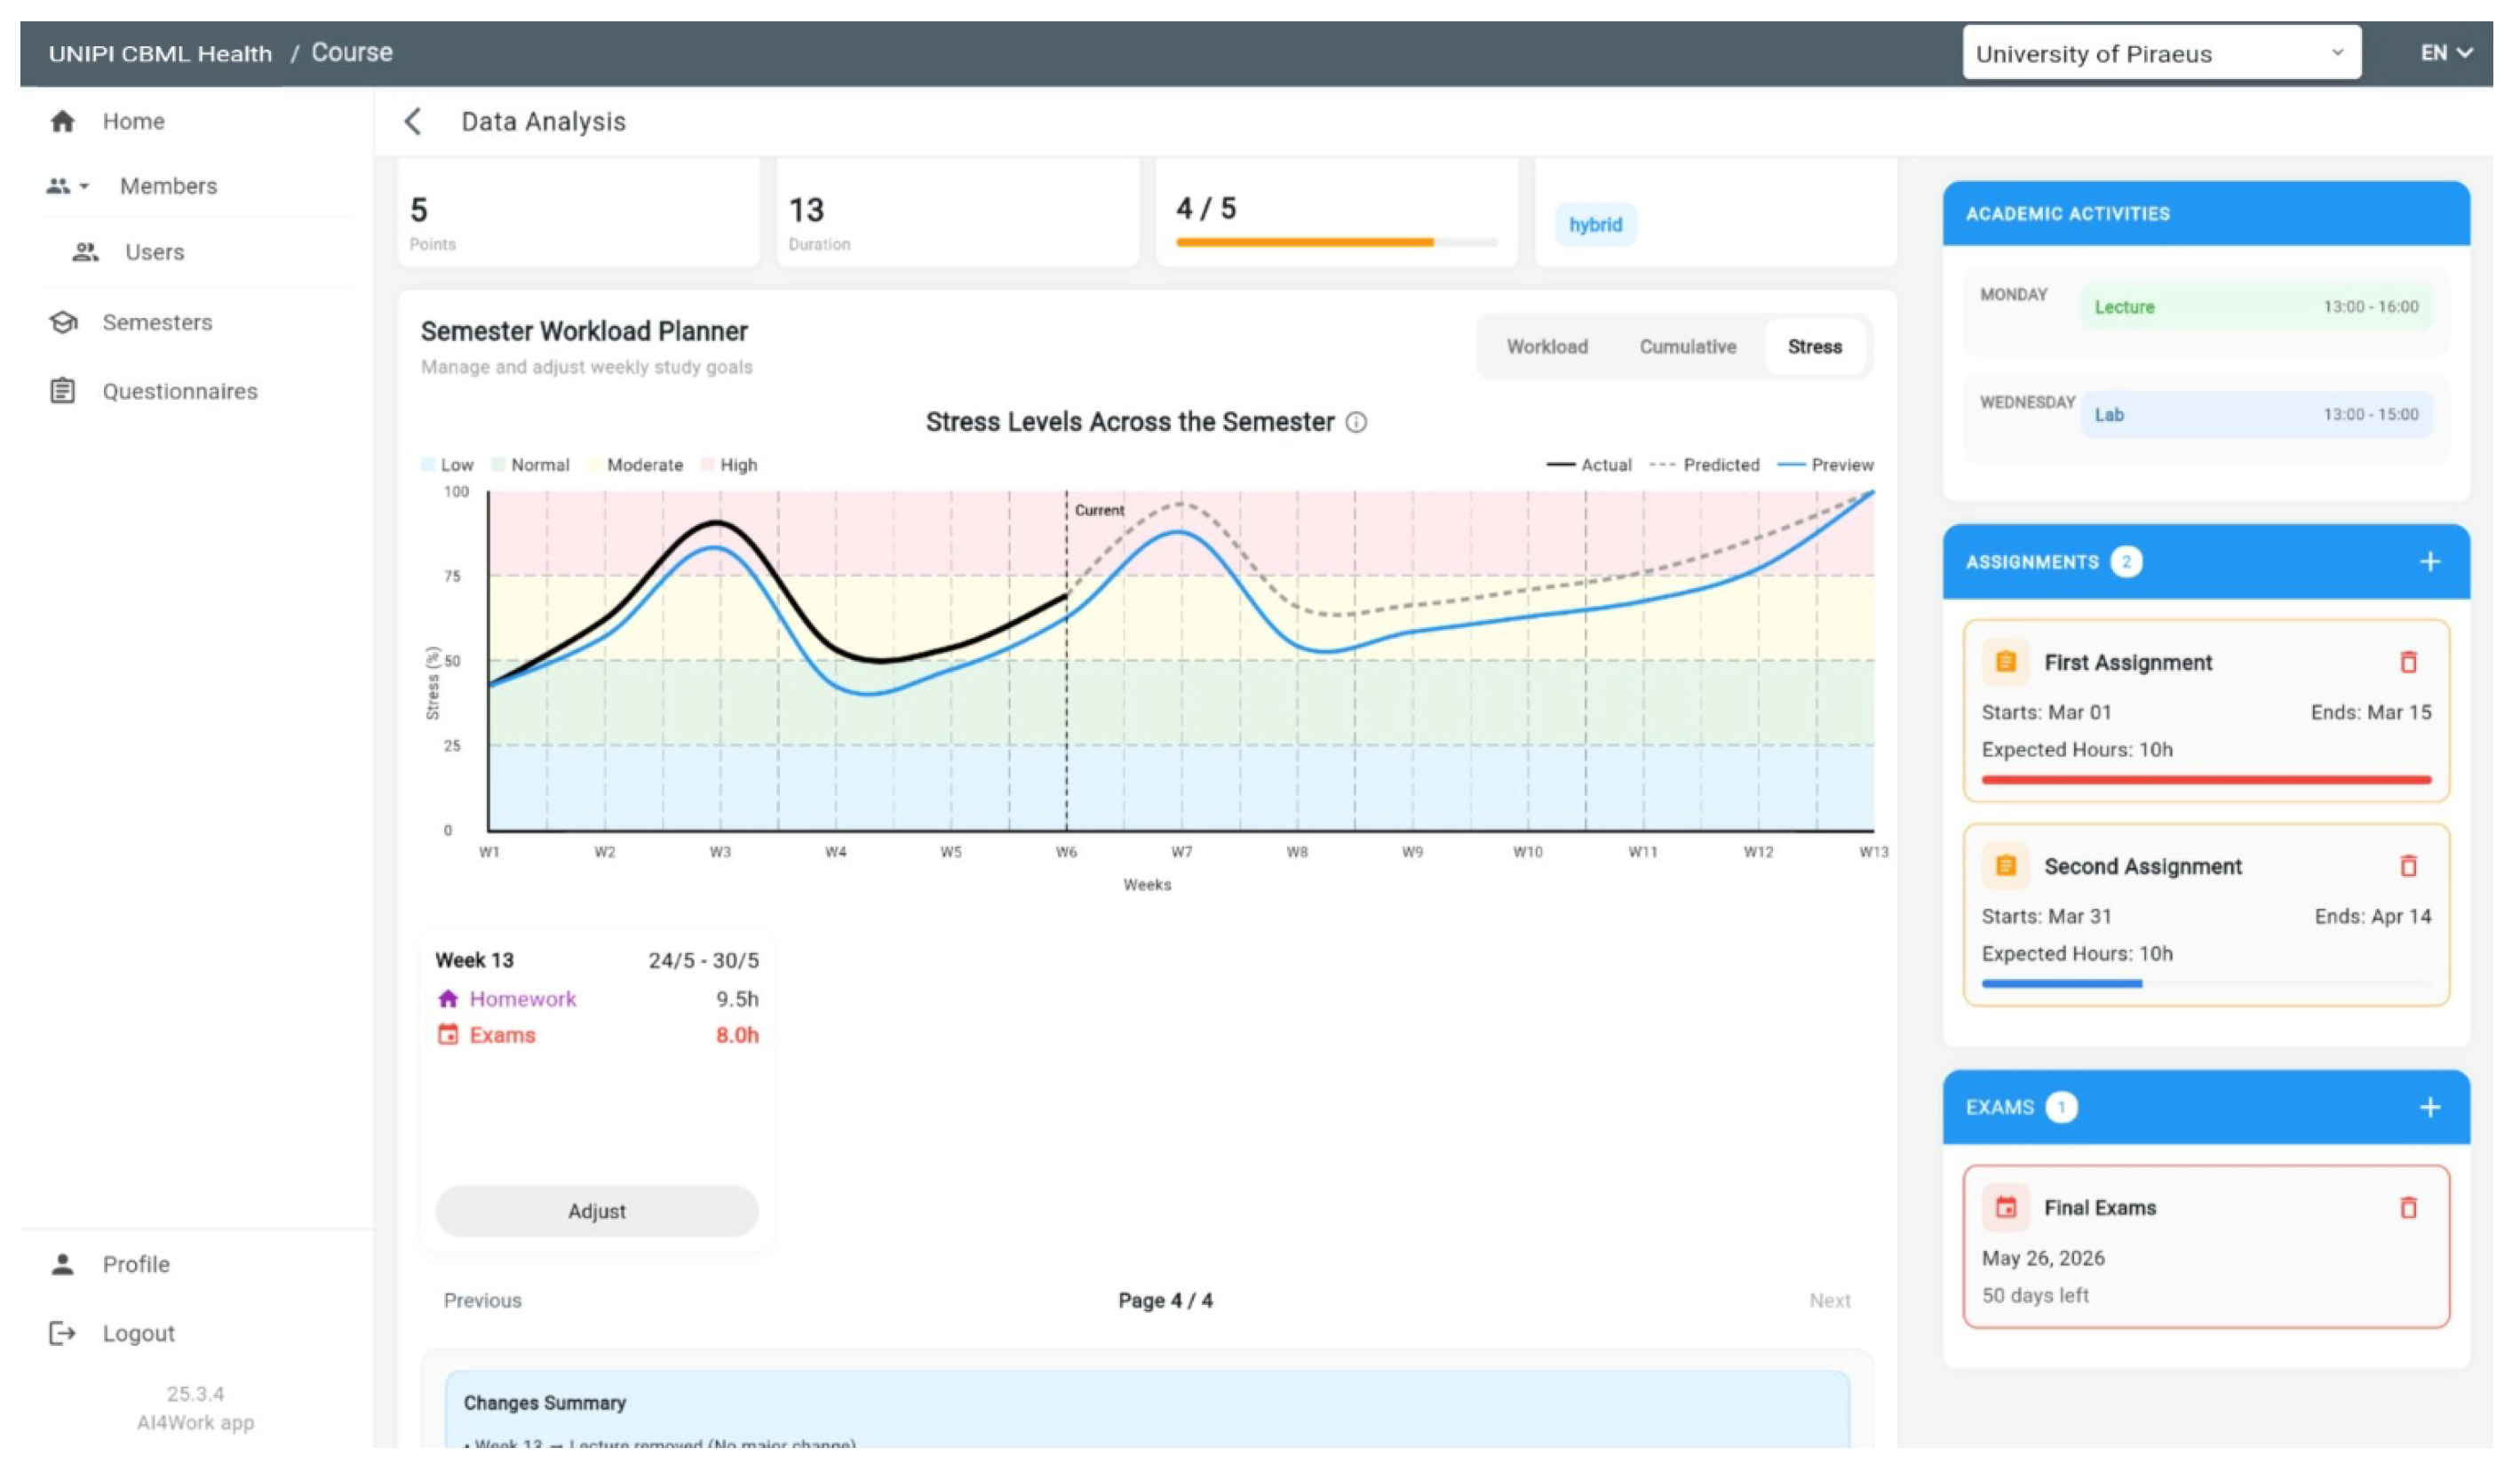
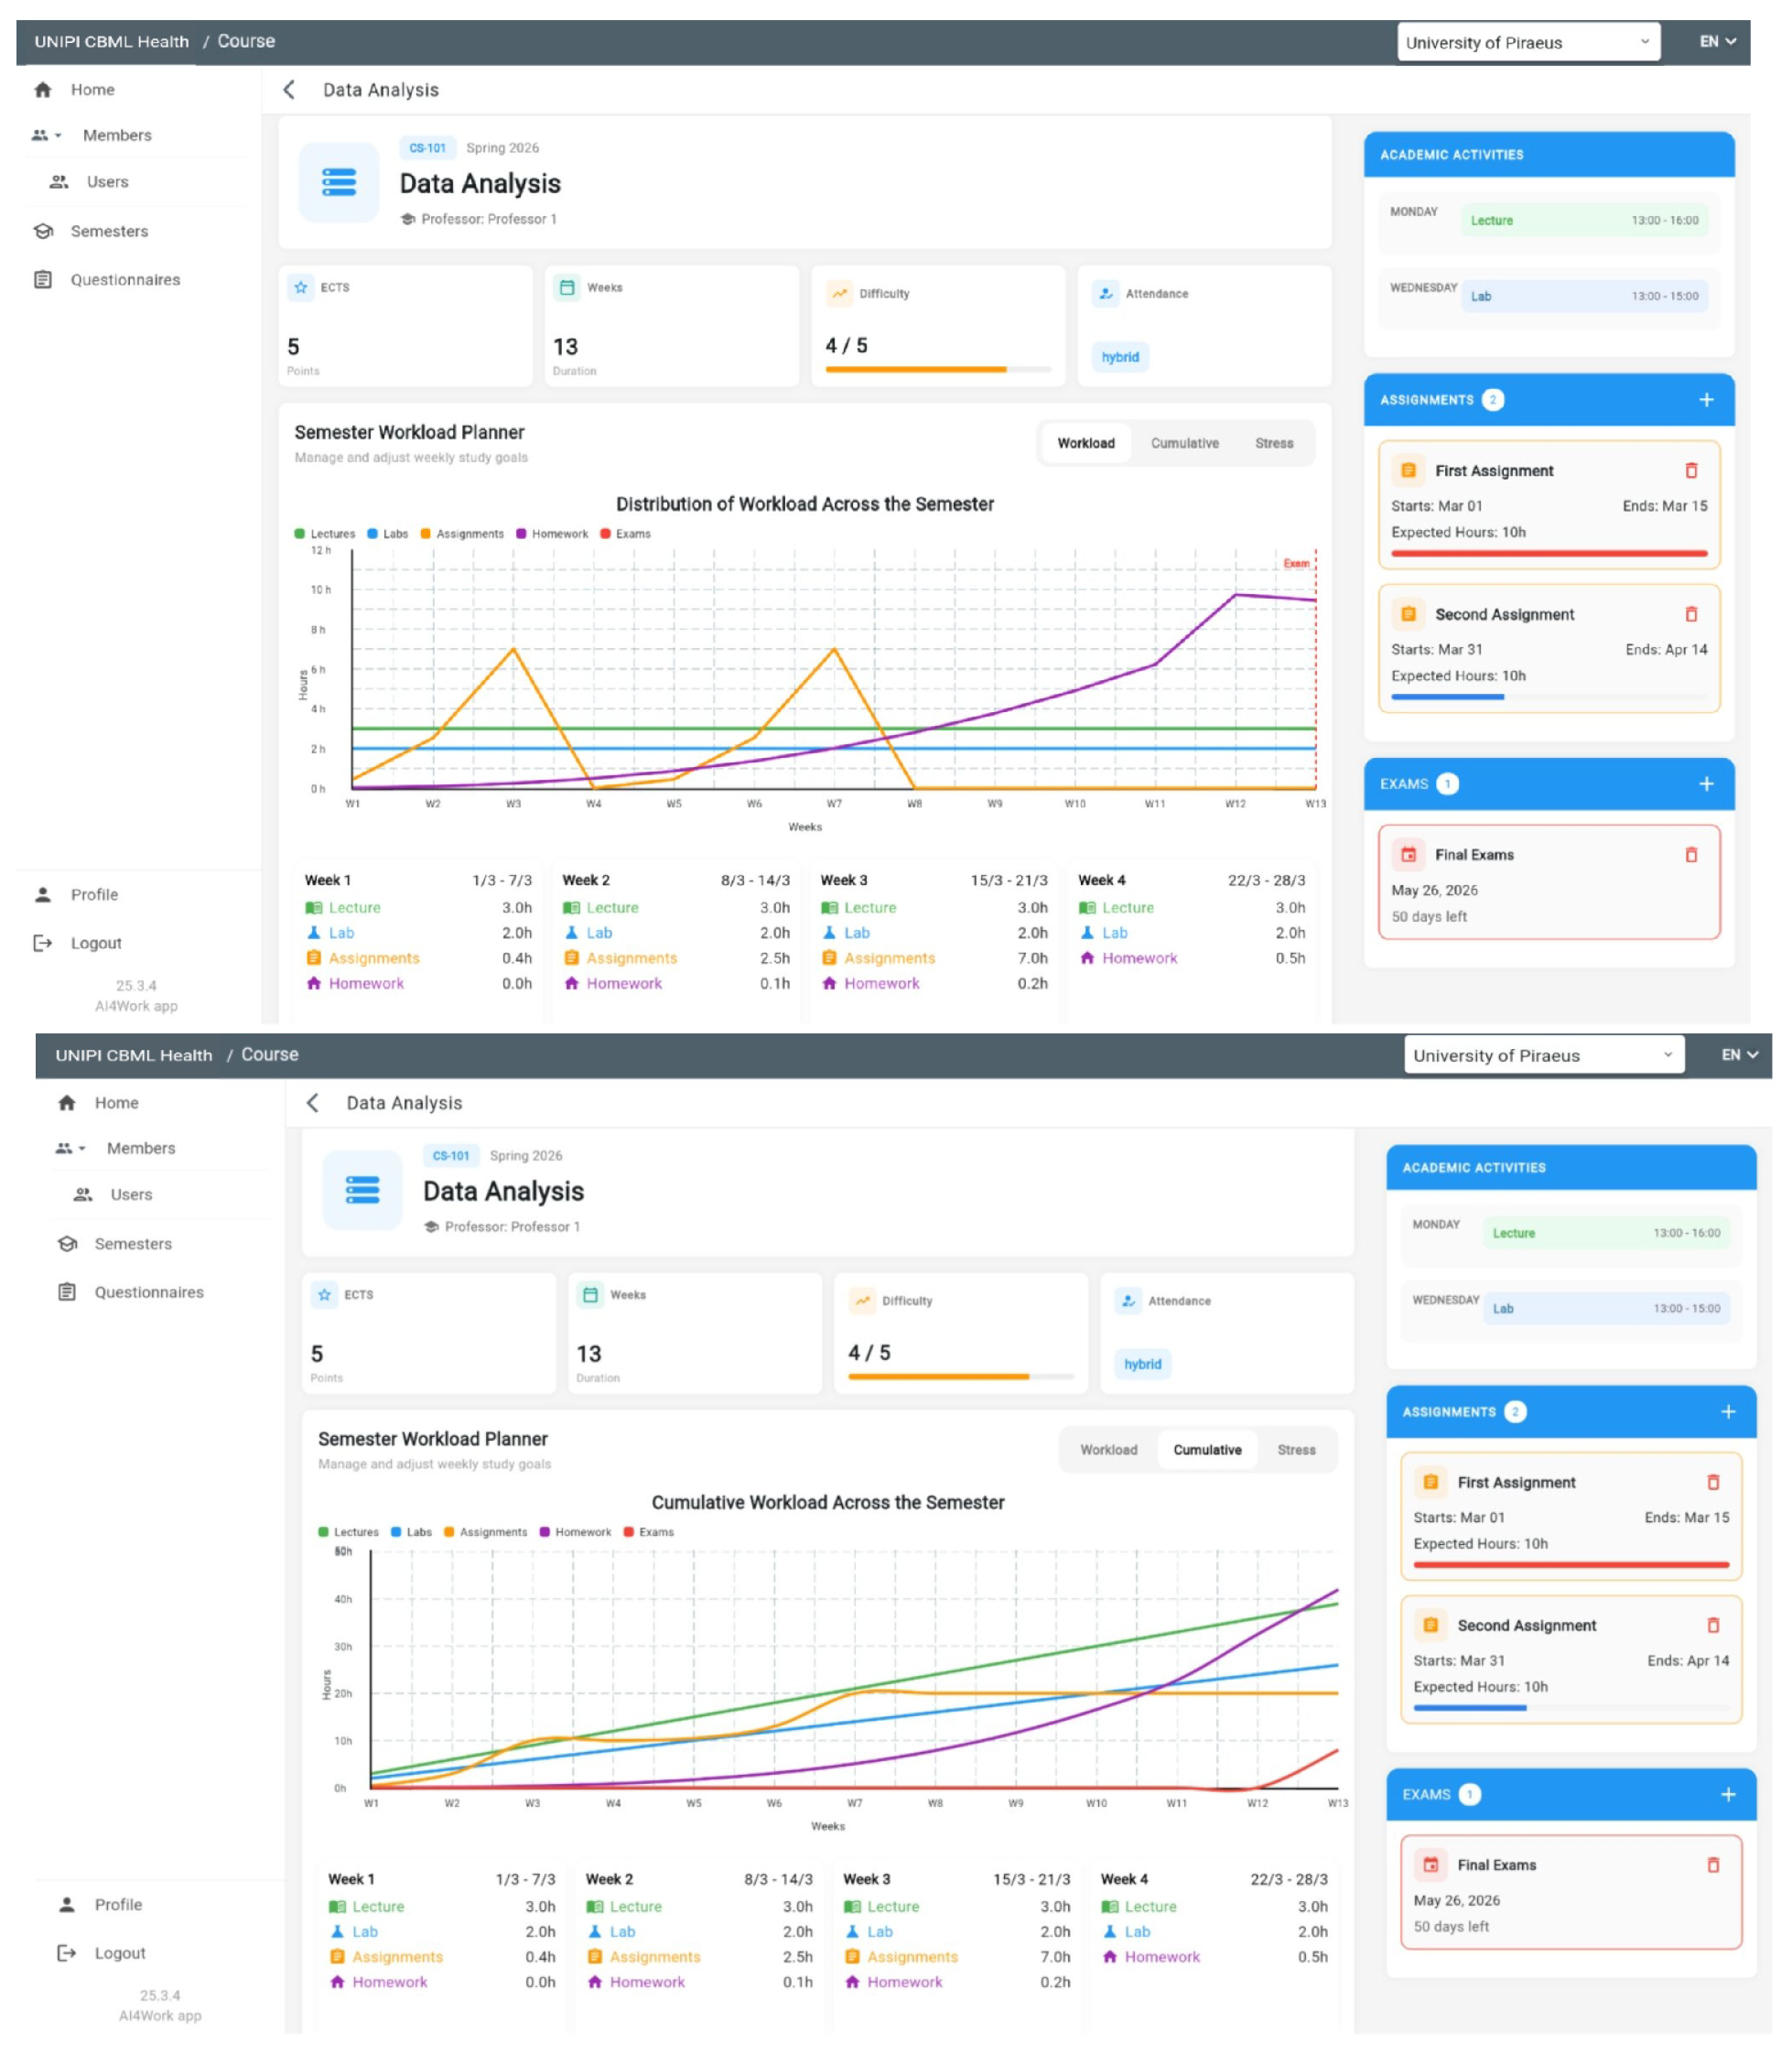
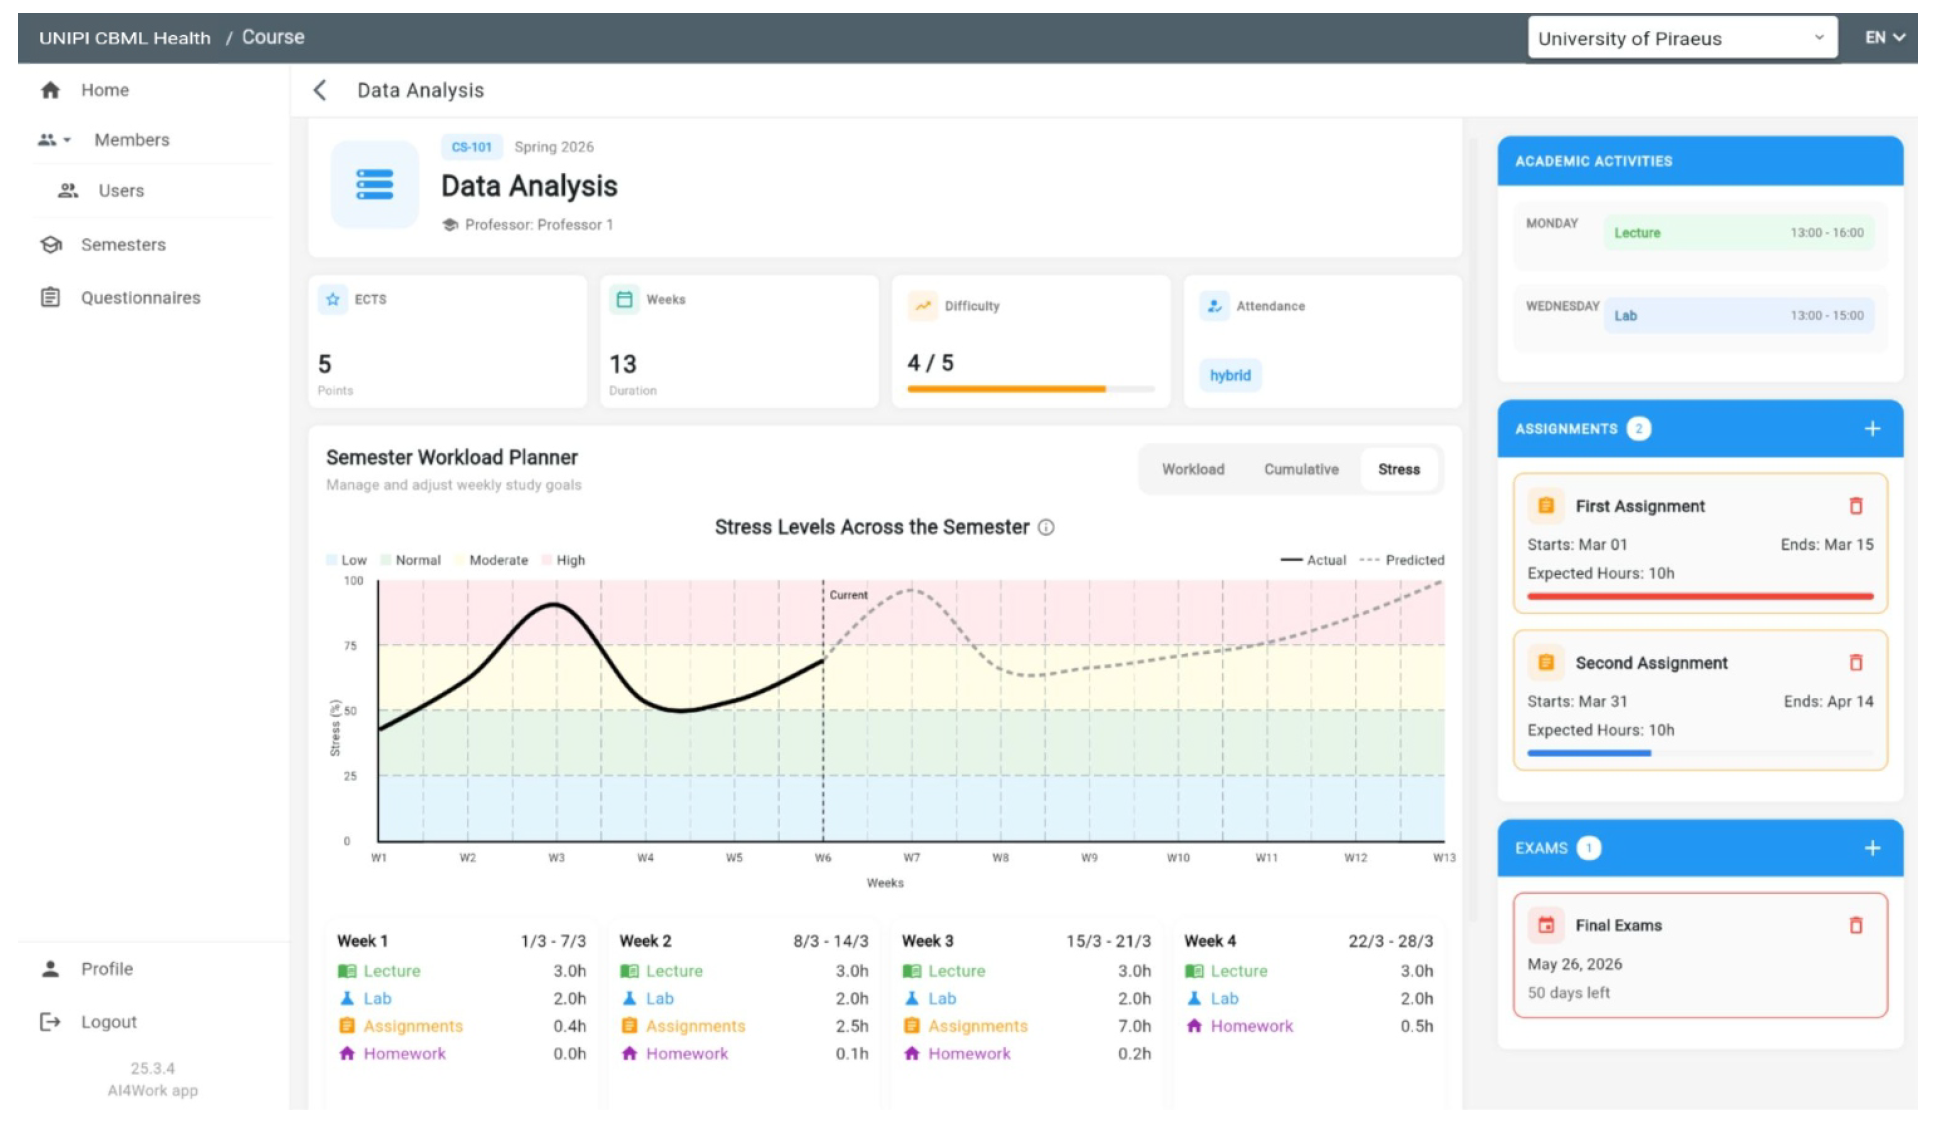
Figure 6 illustrates the course-level analytics and monitoring interface. This view provides a comprehensive representation of the course, including workload distribution across the semester, cumulative workload progression, and estimated stress trajectories derived from multimodal inputs.
4.2.1. Stress Trajectory Simulation and Schedule Adjustment
The Course Digital Twin estimates weekly stress levels by combining physiological signals, questionnaire responses, and contextual course scheduling information. The system enables instructors to not only monitor stress trajectories but also interactively simulate scheduling adjustments and evaluate their projected impact.
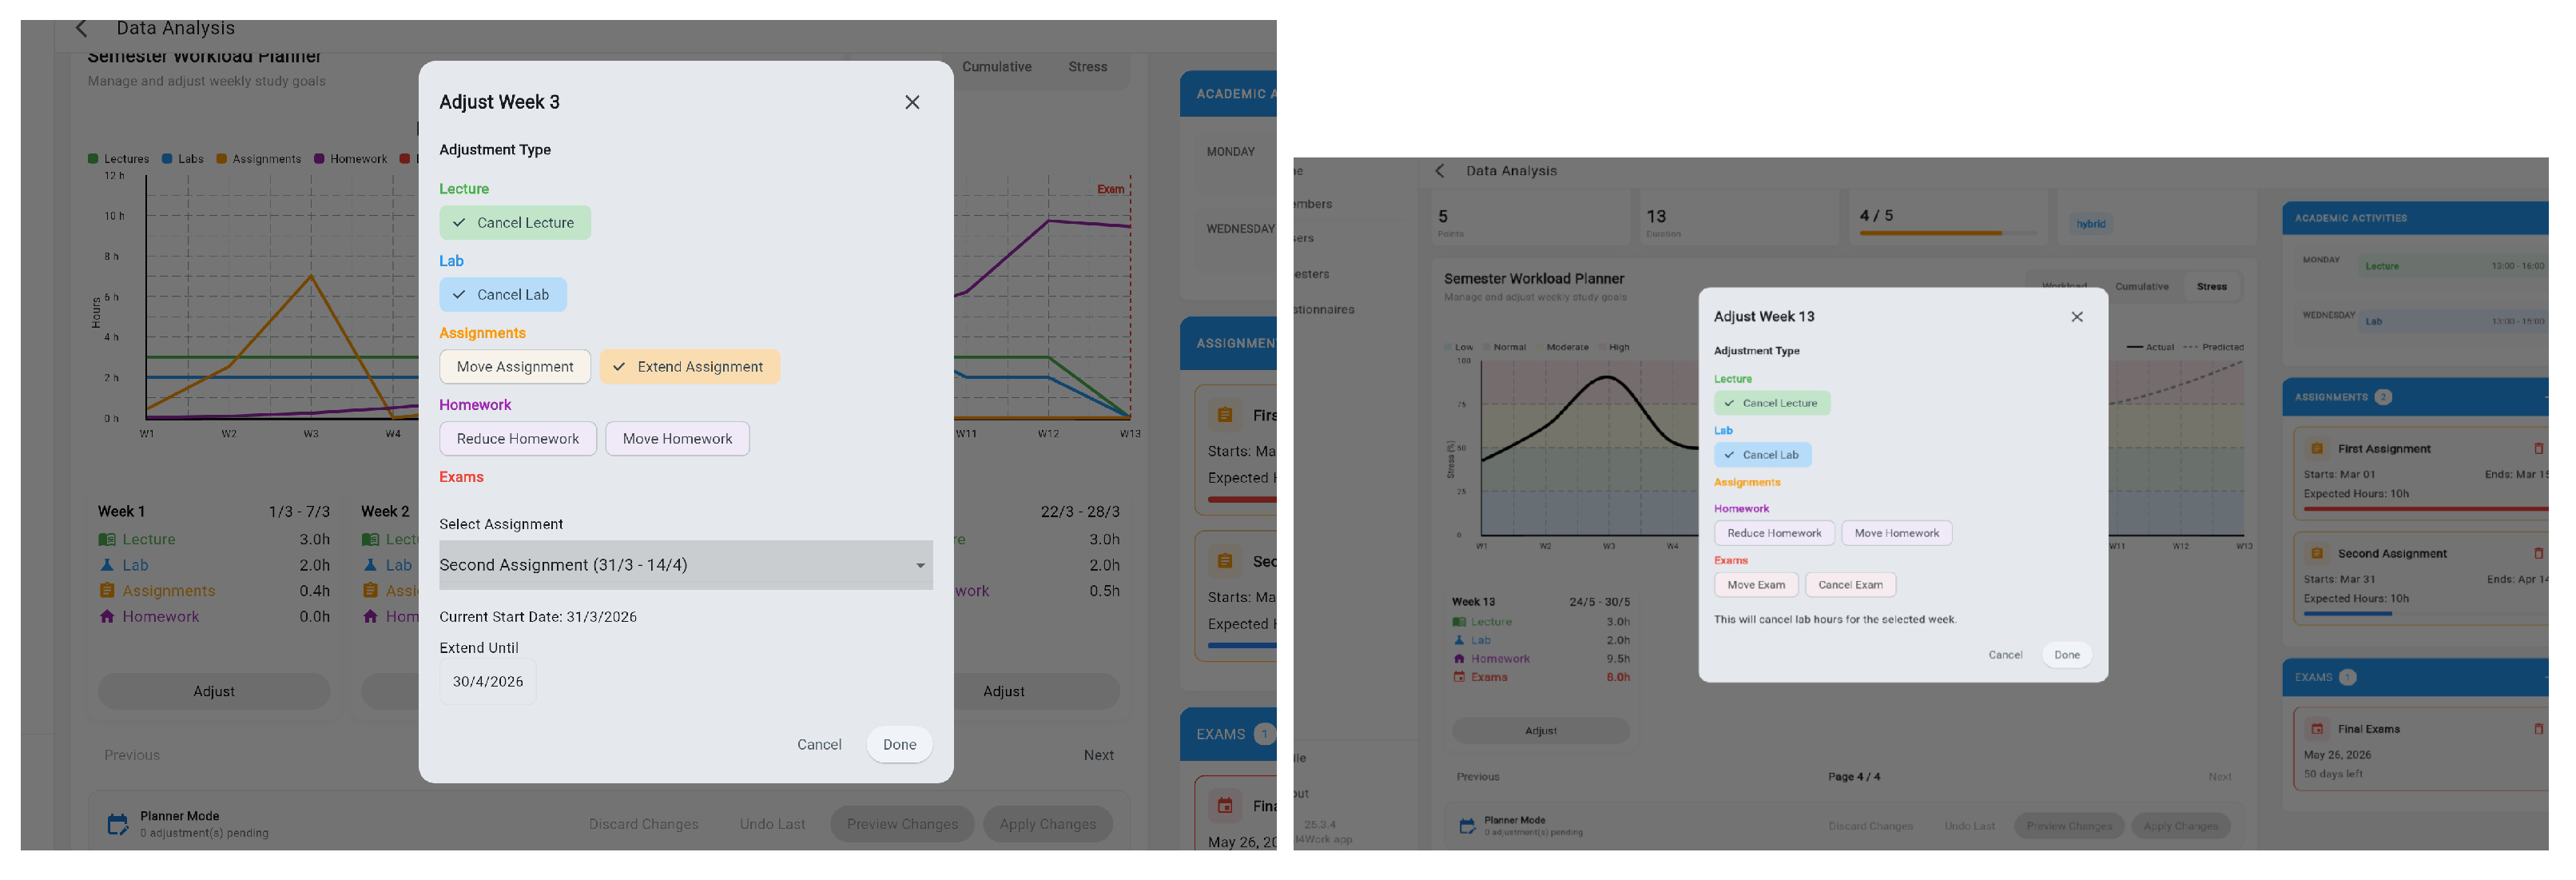
Figure 7 presents some of the available options for adjusting a weeks workload including the cancellation of course activities like lectures and labs, the redistribution of homework hours, the extension or change of assignments and exams.
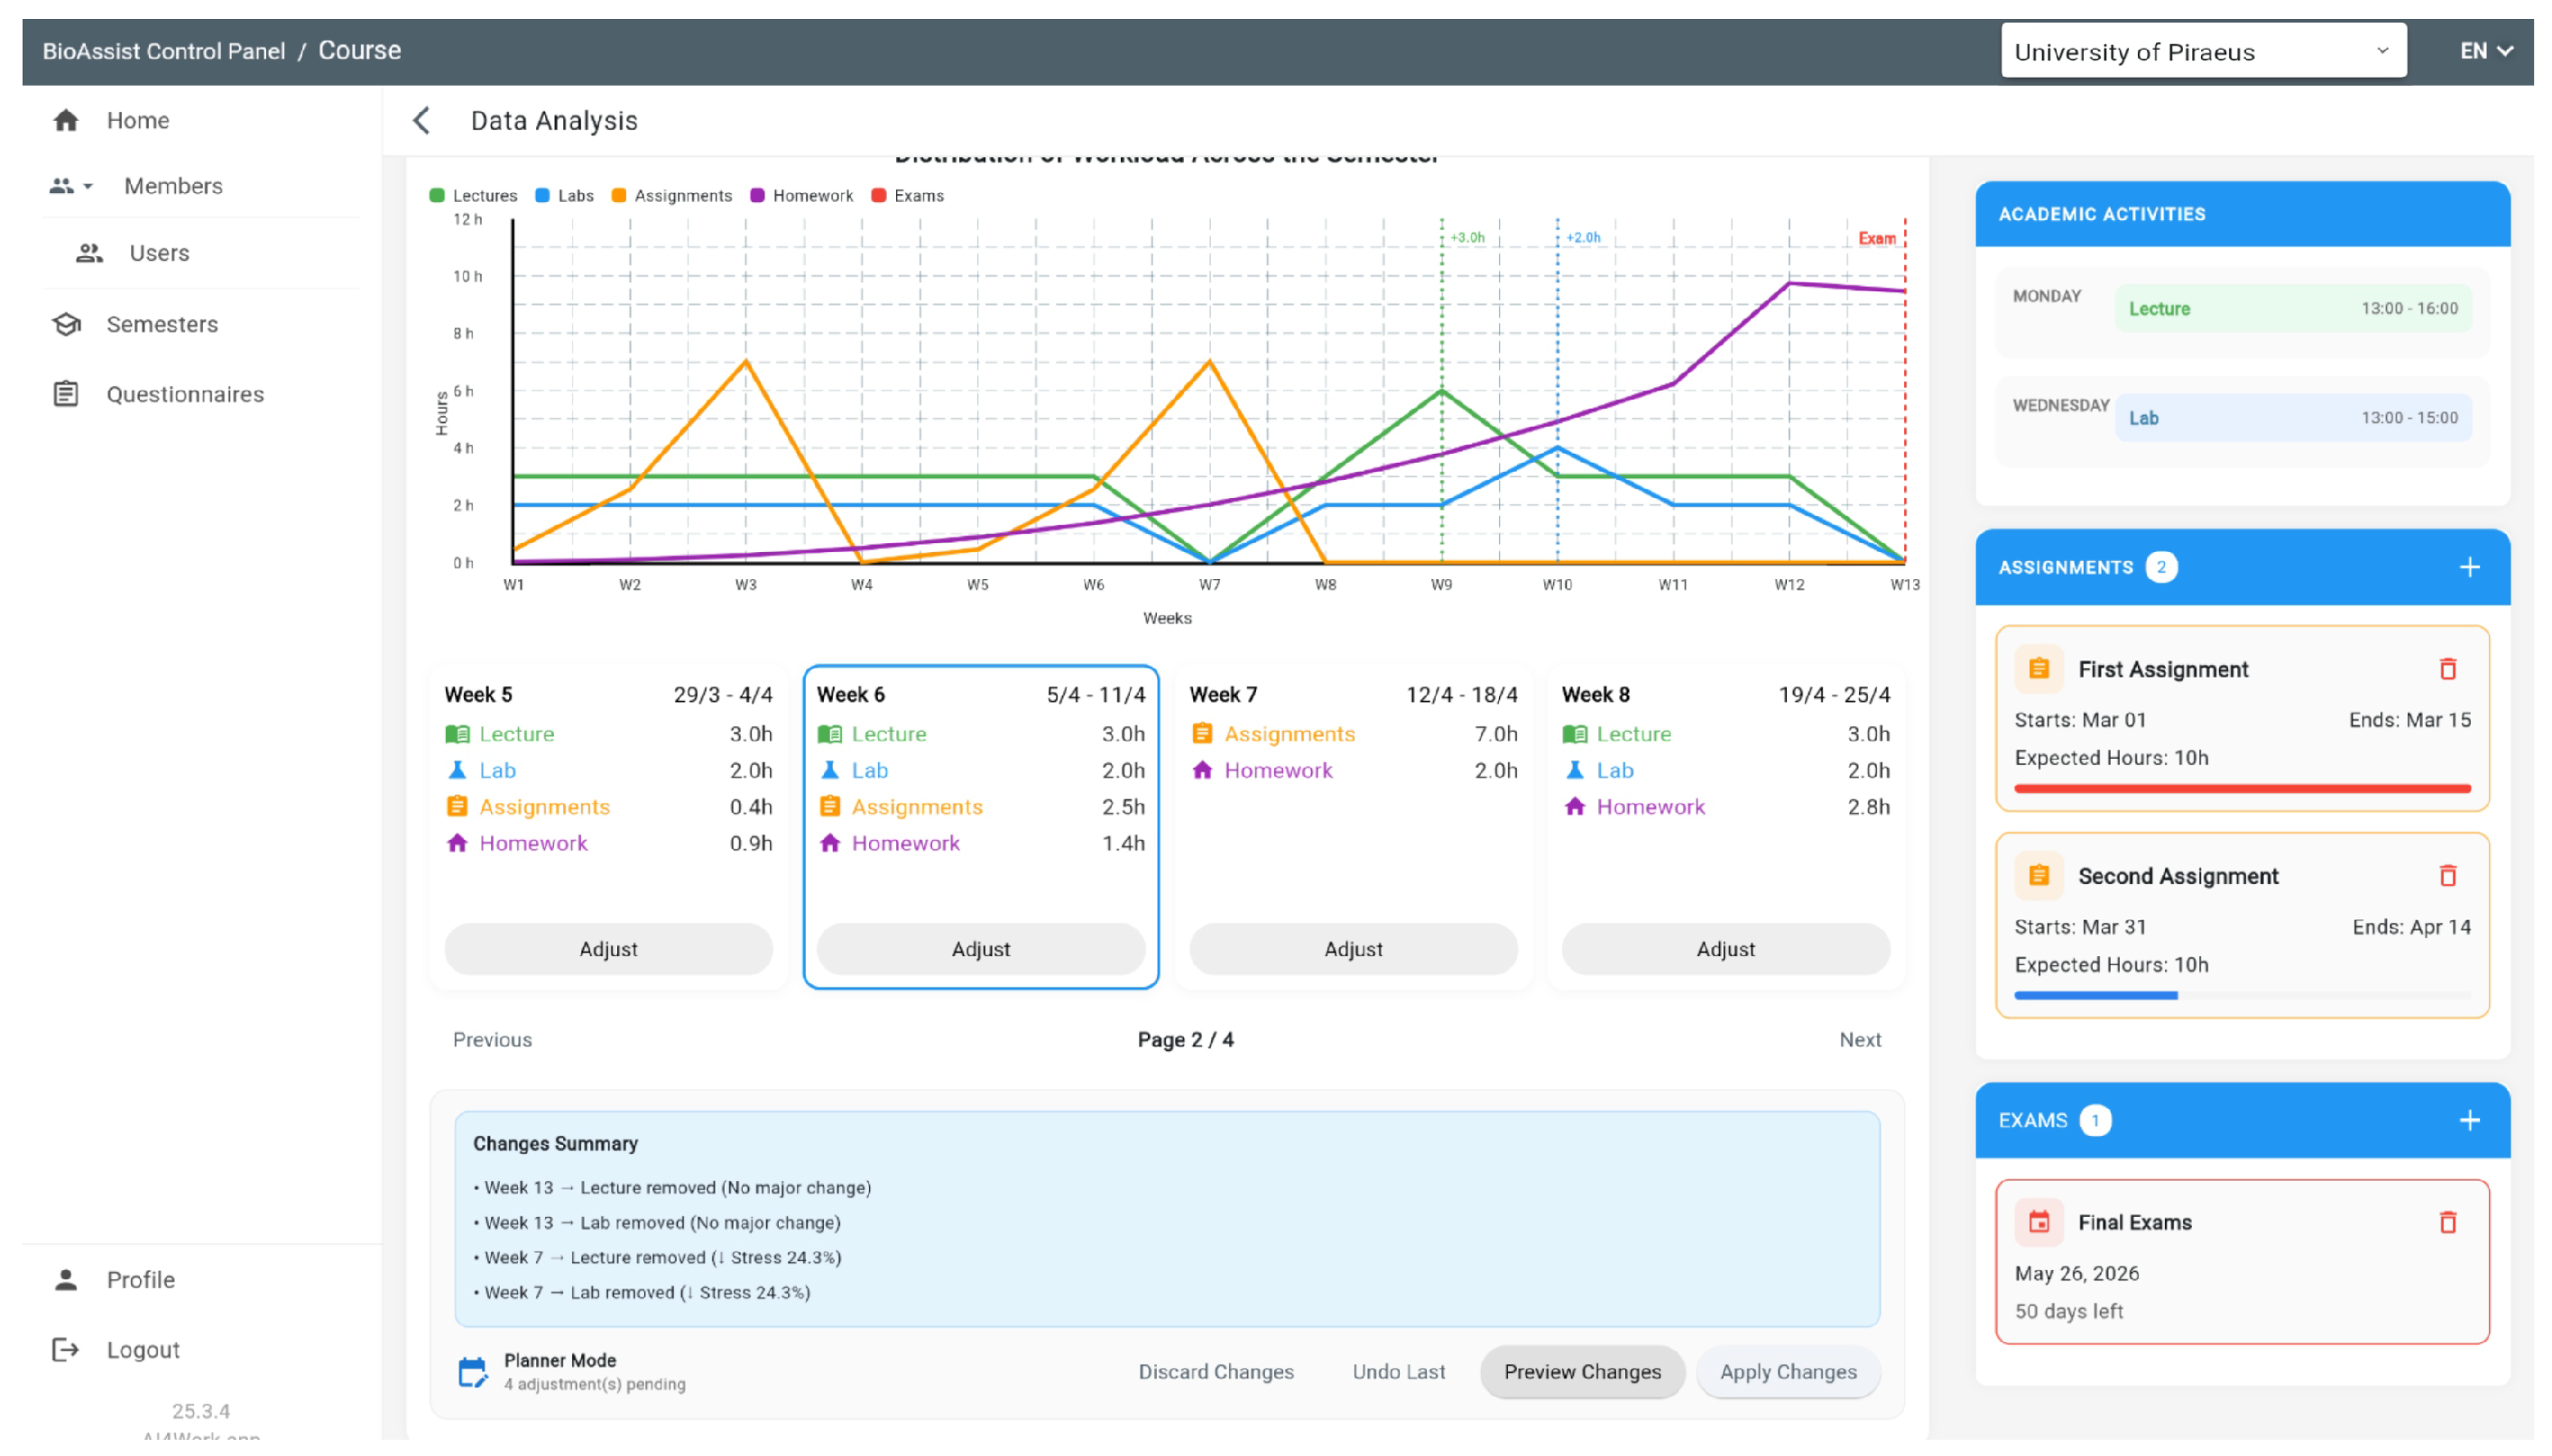
The platform further supports fine-grained inspection of scheduling interventions through a weekly workload visualization and an accompanying adjustment summary. Specifically, instructors can preview the effect of applied modifications directly on the per-week workload distribution graph, where changes in lectures, laboratories, assignments, and examinations are reflected in real time. This enables immediate identification of workload shifts and potential redistribution effects across the semester. In addition, a structured summary of all applied adjustments is provided below the visualization, listing the modified weeks, affected activities, and their corresponding impact.
It should be noted that the effect of scheduling adjustments depends on their temporal position within the semester. When instructional elements such as lectures or laboratory sessions are removed at the end of the semester, the system treats these actions as simple cancellations, resulting in a direct reduction of workload during the affected period. In contrast, when similar adjustments are applied within the active teaching period, the Course Digital Twin performs automatic redistribution of the affected workload across adjacent weeks. This adaptive behaviour aims to preserve the overall course requirements while minimizing localized stress peaks, ensuring that workload reductions do not introduce imbalances elsewhere in the schedule. As a result, mid-semester interventions are handled as stress-aware reallocations rather than isolated cancellations.
Figure 8 illustrates the weekly workload visualization and adjustment interface used to preview workload redistribution and summarize applied scheduling modifications.
Finally,
Figure 9 shows the preview of the stress trajectory after applying scheduling adjustments. The preview curve illustrates the projected effect of interventions, allowing instructors to evaluate their impact before committing changes.
Across the three pilot courses, the Course Digital Twin generated continuous weekly stress trajectories based on multimodal inputs. Following schedule adjustments, the peak Stress Index values observed during high workload weeks decreased by approximately 8–15 points on the 0–100 stress scale. In addition, the number of weeks classified in the High stress category (SI > 75) decreased in the two affected courses after schedule redistribution. These results provide preliminary indications that small structural modifications to assignment timing and laboratory scheduling are associated with reductions in projected stress accumulation without substantially altering the course workload.
Simulation preview indicated reduced projected peak stress levels. After applying these modifications, the recomputed Stress Index indicated a downward shift in peak stress from the “High” category (SI > 75) to the upper Medium range (SI between 60 and 70) in the affected weeks. The observed reduction was modest but consistent with the structural nature of the applied interventions. Importantly, stress reduction was achieved without reducing instructional hours or assessment quantity, but through temporal redistribution.
4.2.2. Student Monitoring and Personal Analytics
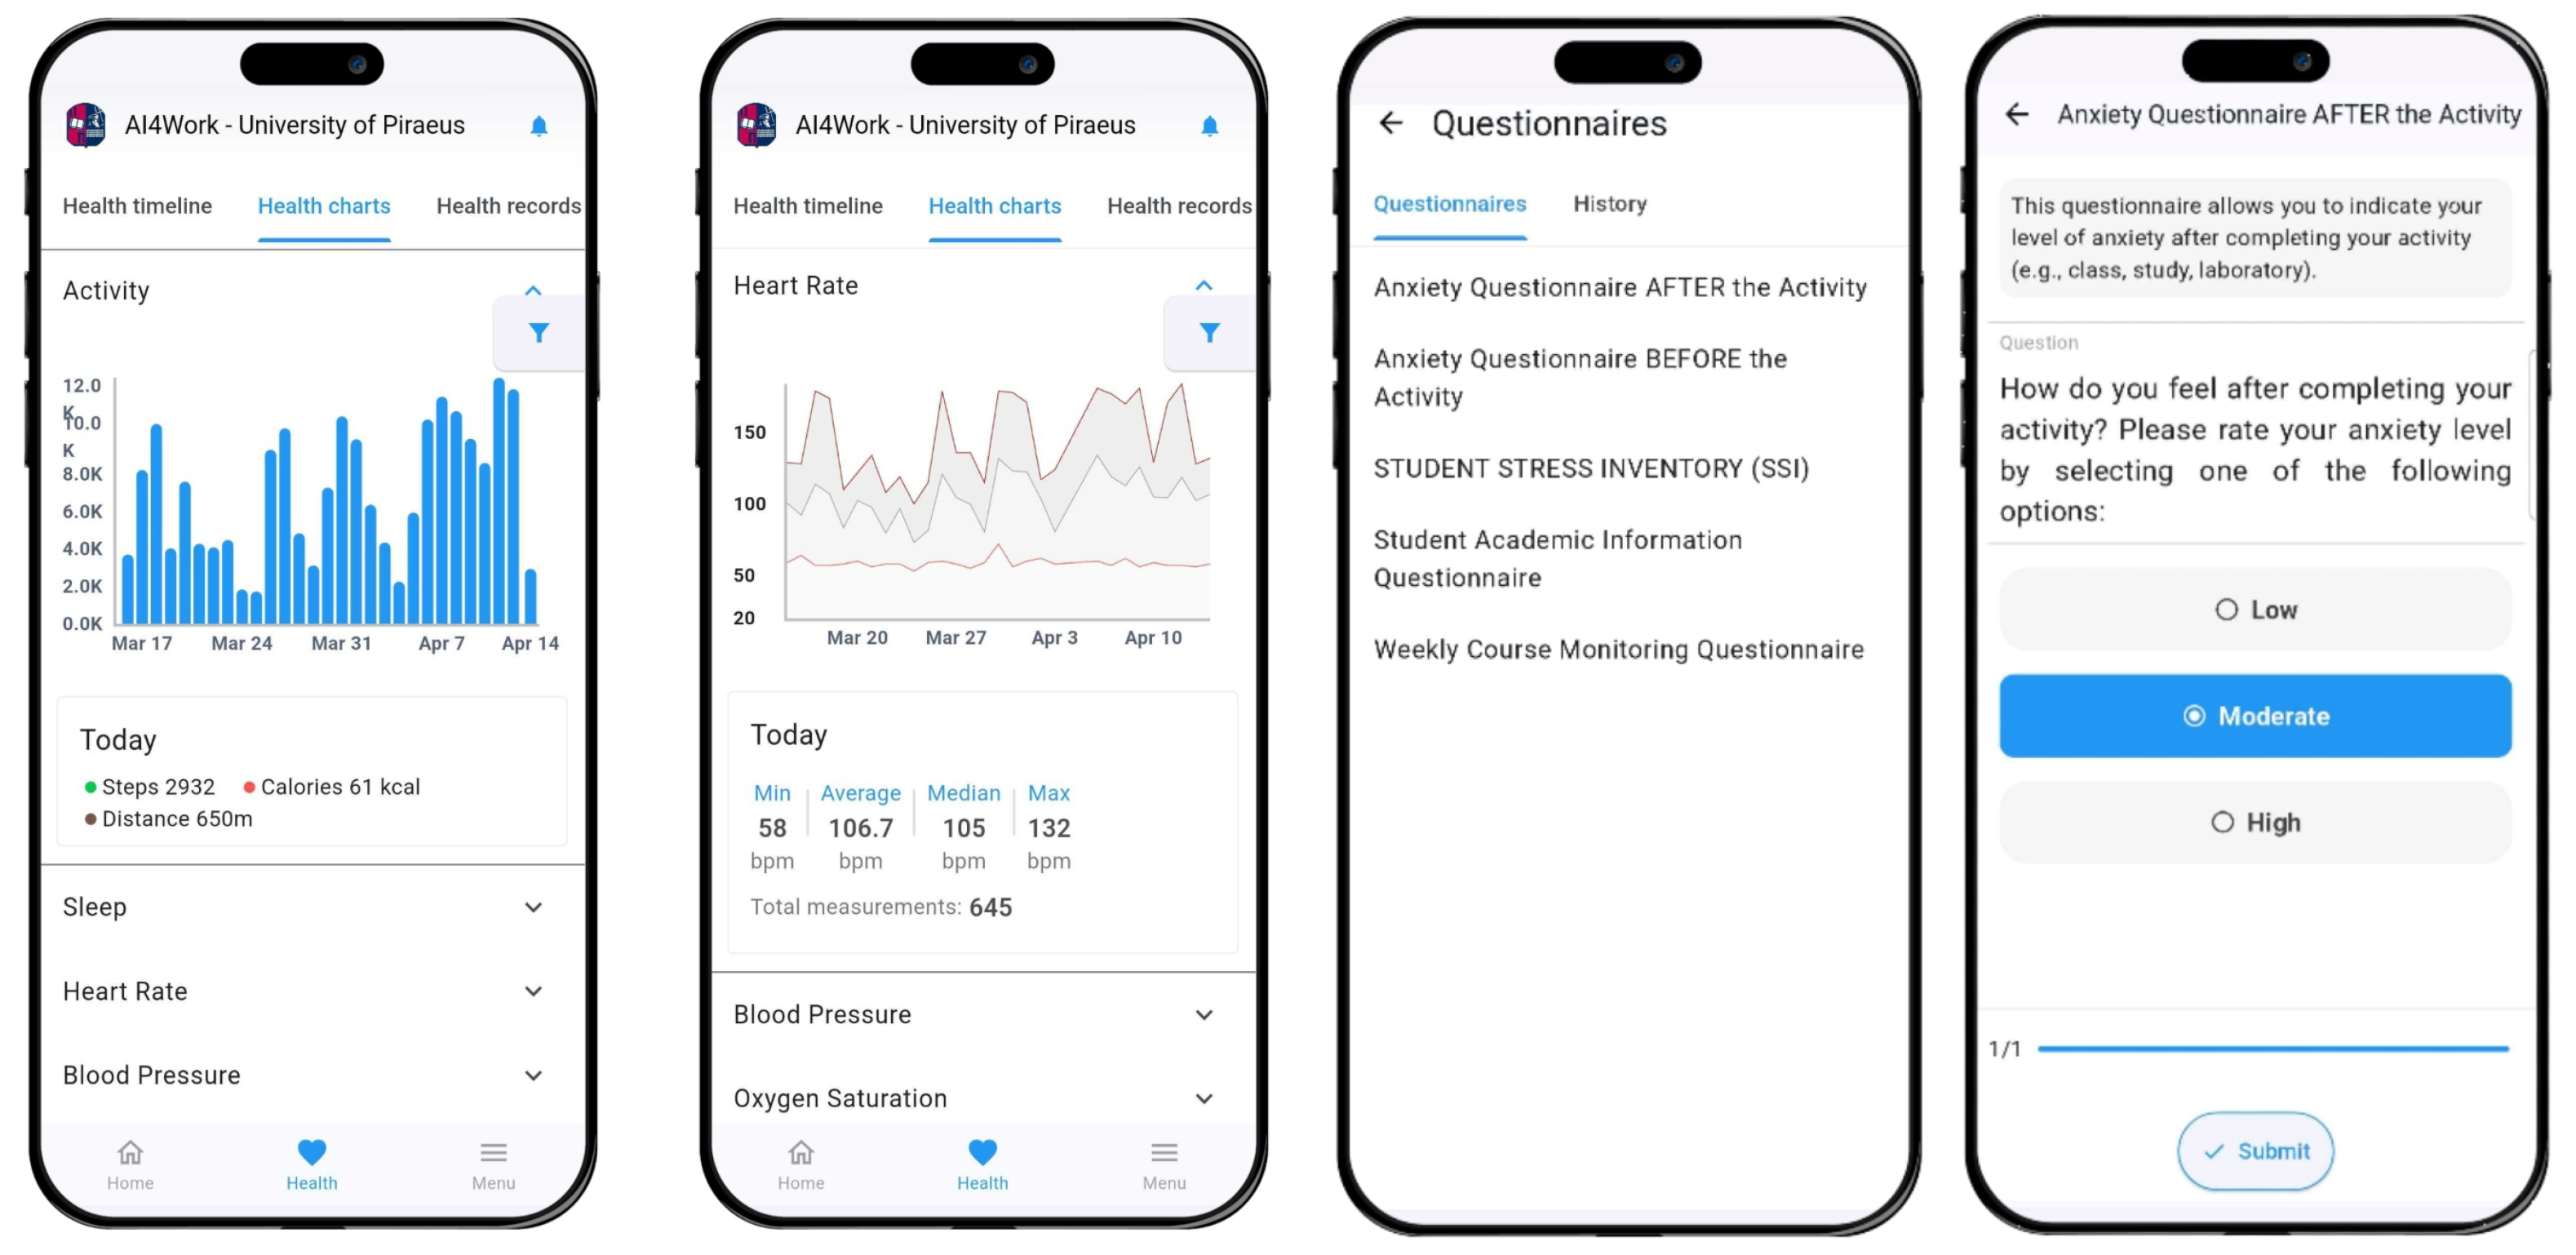
Students interacted with the system through a mobile application that collected physiological signals and questionnaire responses.
Figure 10 shows representative examples of the mobile interfaces used during the pilot.
Collected data streams were integrated into the Course Digital Twin to generate personalized analytics and recommendations.
4.2.3. Occupational Health Recommendations
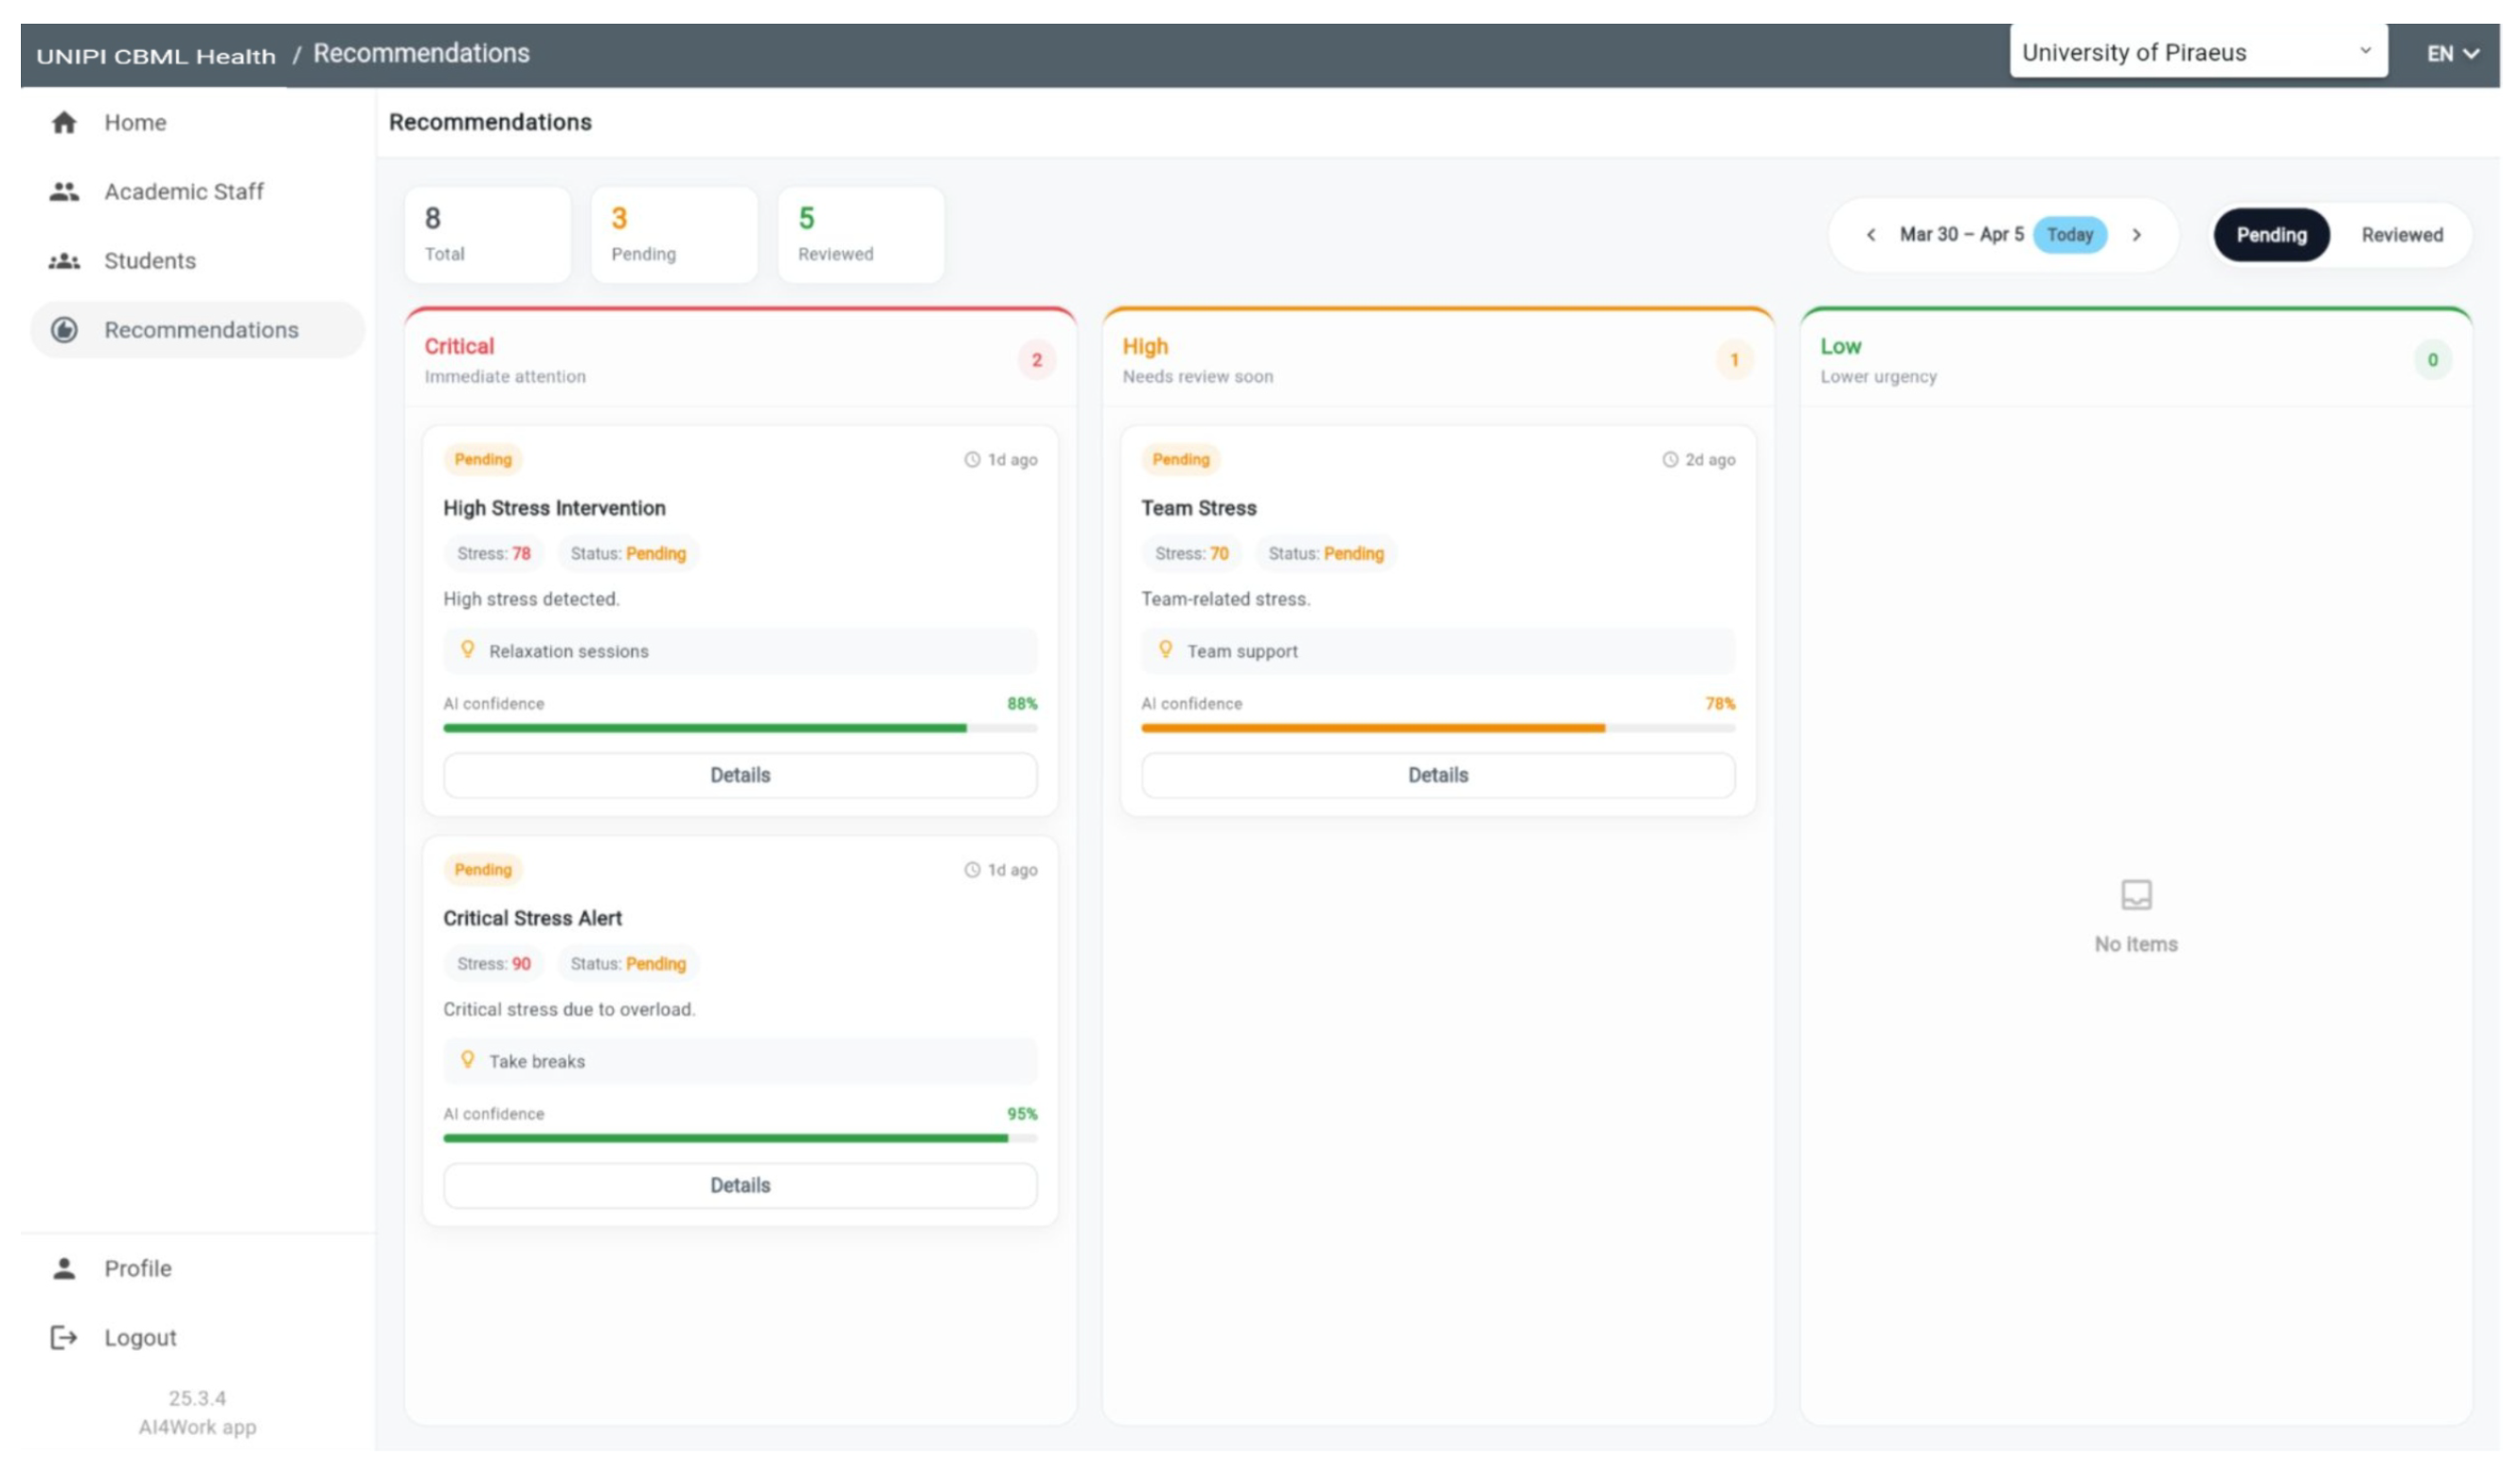
Based on the stress trajectories and behavioural indicators, the platform generates personalized recommendations for stress mitigation. Examples include physical activity suggestions, mindfulness exercises, and relaxation techniques.
Figure 11 presents an example recommendation dashboard used to display personalized stress-mitigation suggestions generated by the system.
Students engaged with the personal analytics dashboard primarily for retrospective monitoring rather than real-time adjustment. Personalized recommendations were delivered at the correct weekly rate providing insights for better stress management of the students. Given the limited sample size and short observation period, the results should be interpreted as preliminary feasibility evidence rather than confirmatory validation of stress reduction efficacy.
4.3. Evaluation Metrics and Key Performance Indicators
To assess the feasibility and operational performance of the proposed Course Digital Twin platform, a set of key performance indicators (KPIs) was monitored during the pilot deployment. These indicators capture system reliability together with user-centered evaluation aspects such as usability, acceptance, perceived recommendation quality, and explainability. The KPIs were derived from the evaluation framework used in the AI4Work Education sector pilot and were measured during the early prototype deployment phase through a set of questionnaires.
System reliability was measured as the ratio of successfully generated stress predictions and recommendations to total system requests, reaching approximately 90% across the pilot deployment period. In addition to technical performance indicators, user perception of the system was evaluated through questionnaire-based feedback using Likert-scale ratings. These measures assessed the perceived usefulness of the generated recommendations, ease of use of the platform interface, overall system acceptance, and the transparency of the provided recommendations.
Table 2 summarizes the key performance indicators observed during the pilot deployment. Overall, the results indicate positive user perception of the system, with ease of use rated at 4.0 and system acceptance at 4.2 on a five-point Likert scale. Recommendation quality received an average rating of 3.8, suggesting that participants generally considered the generated recommendations accurate for supporting stress self-management. The explainability metric obtained a rating of 3.5, indicating moderate perceived transparency of the recommendation mechanism, while also highlighting an area for further improvement in future iterations of the platform.
Workload adjustment mechanisms also demonstrated robust performance. In simulated scheduling scenarios, the system successfully generated valid workload adjustment recommendations in approximately 90% of cases. These results suggest that the proposed architecture can support real-world academic deployments while maintaining stable system behaviour under expected university usage conditions.
In addition to the technical KPIs, the relationship between the computed Stress Index (SI) and self-reported stress levels was examined using questionnaire responses collected during the pilot. The consistency of the computed Stress Index was qualitatively assessed against perceived stress levels obtained from the Student Stress Inventory (SSI) questionnaires administered during the pilot. Although the number of participants was limited, higher SI values generally coincided with increased perceived stress reported by students during high workload periods, particularly near assignment deadlines and examination weeks. This qualitative agreement suggests that the multimodal indicators used by the Course Digital Twin may capture stress patterns that are consistent with subjective stress perception. Larger deployments will allow future work to perform more rigorous statistical correlation analysis between SI and standardized psychometric stress measures.
4.4. Data Collection Summary Table
During the pilot deployment, questionnaire-based stress assessments generated a substantial volume of self-reported data. The pilot involved three courses with an average of 8 students per course, corresponding to approximately 24 participating students over a 13-week semester. Each student was asked to complete four weekly questionnaires (pre-course, post-course, pre-laboratory, and post-laboratory) as well as a monthly Student Stress Inventory (SSI) assessment.
Table 3 summarizes the estimated questionnaire and physiological data collection frequencies used during the pilot deployment.
Although physiological data streams were successfully collected during the pilot, the sampling frequency and accessibility of wearable data were constrained by the limitations of commercial wearable providers and by occasional device non-wear during daily activities. In practice, students did not wear the smartwatch continuously throughout the entire semester, resulting in slightly lower physiological sampling volumes than the theoretical maximum. Nevertheless, the collected heart rate (HR), heart rate variability (HRV), and activity data were sufficient to support weekly stress trajectory estimation and multimodal comparison with self-reported stress patterns.
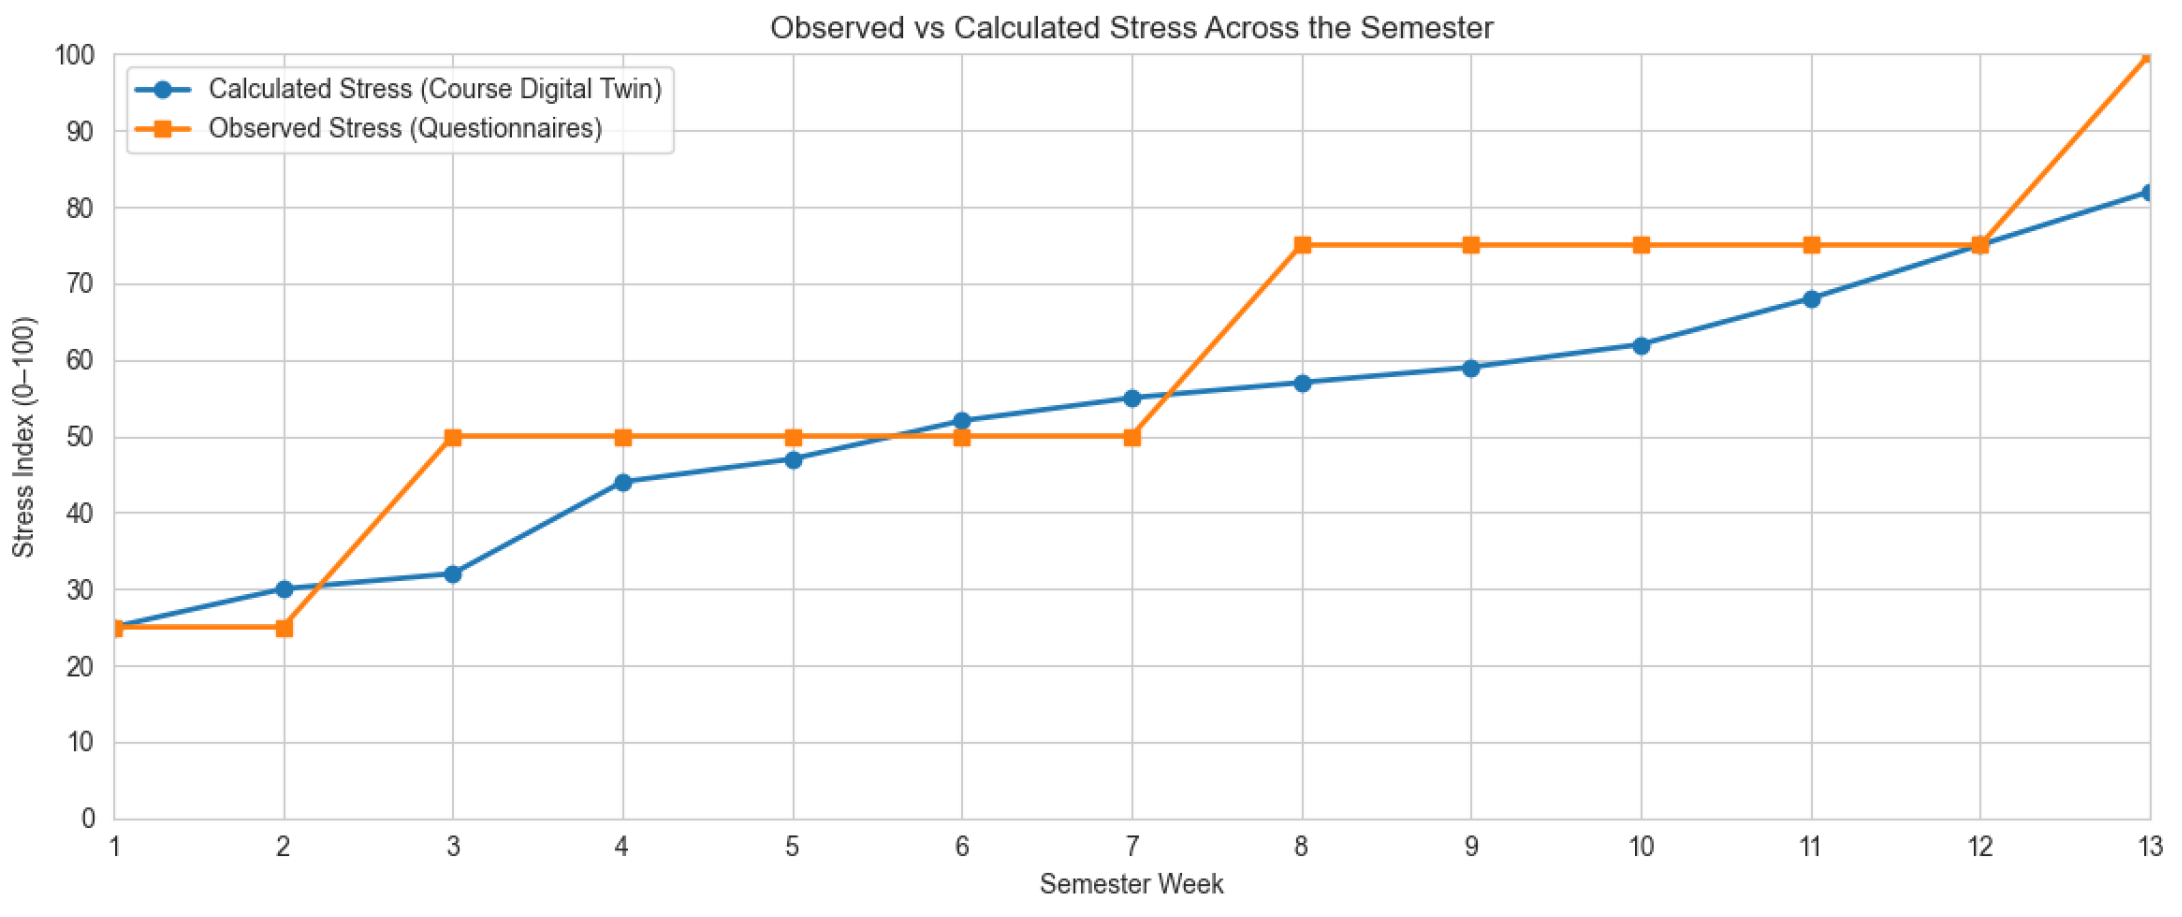
To further examine the relationship between the stress levels reported by students and the stress trajectories estimated by the Course Digital Twin, a temporal comparison across the semester weeks was conducted. Observed stress corresponds to questionnaire responses collected during the pilot deployment, while calculated stress represents the values generated by the Course Digital Twin using physiological signals and contextual academic workload indicators.
Figure 12 illustrates that both observed and calculated stress indicators follow a similar overall progression across the semester, gradually increasing as academic workload accumulates and reaching their highest levels during the final examination period. Minor differences between the two signals can be observed at several weeks, reflecting the different nature of the measurement sources. Questionnaire-based stress reports tend to change abruptly between discrete levels, reflecting the coarse granularity of survey responses where students typically select among a limited set of stress categories. In contrast, the Course Digital Twin produces smoother stress trajectories by integrating physiological measurements with contextual academic workload indicators. This multimodal approach captures gradual changes and intermediate fluctuations in stress levels that may not be visible in questionnaire responses alone, providing a more detailed representation of student stress dynamics throughout the semester.
Finally the pilot suggests that:
Multimodal stress modelling can be operationalized at course level,
Minor schedule redistributions may influence projected stress trajectories,
Simulation-based preview enables non-disruptive workload balancing,
Privacy-preserving deployment is feasible in real academic environments.
5. Discussion
Existing research in academic stress has predominantly focused on measurement and prediction at the individual level. Prior work has established heart rate variability and self-reported instruments as reliable indicators of stress exposure, particularly during examination periods and high workload phases [
10,
11,
12,
13,
29]. In parallel, learning analytics studies have examined workload distribution and deadline clustering as structural contributors to student stress [
38,
39]. However, these two research directions remain largely disconnected. Physiological and behavioural monitoring approaches are typically descriptive and retrospective, while scheduling and workload studies do not incorporate real-time or multimodal stress indicators into decision-making processes.
The present work contributes by bridging this gap through the introduction of a Course Digital Twin that integrates multimodal stress modelling with simulation-based academic scheduling. Rather than treating stress solely as an outcome to be monitored, the proposed framework operationalizes stress as a computational signal within course planning. This enables prospective evaluation of scheduling configurations, representing a shift from observational analytics toward intervention-oriented decision support. In this sense, the Course Digital Twin extends existing Digital Twin paradigms [
21,
22,
24] into the domain of academic workload management by incorporating human-centered physiological and behavioural variables.
The pilot deployment provides preliminary indications that temporal redistribution of academic activities may influence projected stress trajectories. The observed reductions in peak Stress Index values following schedule adjustments are consistent with prior findings on the impact of workload clustering and deadline density on student stress [
4,
18,
38]. Importantly, these changes were achieved without modifying course content or reducing academic requirements, but rather through temporal reorganization. This suggests that stress in academic environments is not solely a function of workload volume, but also of workload structure and distribution over time. While these findings remain indicative due to the limited scale of the pilot, they highlight the potential of simulation-driven scheduling as a mechanism for proactive stress management.
At the same time, the results should be interpreted within the constraints of an early-stage feasibility study. The pilot involved a relatively small sample size and did not include randomized controlled comparisons, limiting the ability to draw causal conclusions regarding stress reduction. In addition, variability in wearable device usage and signal availability introduces uncertainty in physiological measurements, despite normalization procedures applied within the system. The reliance on self-reported stress labels for model training further introduces subjectivity, which may affect the consistency of the learned physiological stress patterns. Moreover, the current implementation models stress at the level of an individual course and does not capture cumulative workload interactions across multiple simultaneous courses within a semester.
A key direction involves rigorous validation of the proposed framework through controlled experimental studies. In particular, randomized controlled trials (RCTs) comparing stress-aware scheduling with traditional course planning approaches would enable systematic evaluation of the impact of the Course Digital Twin on student stress and academic outcomes. Such studies would allow the assessment of causal relationships between scheduling interventions and stress reduction, addressing limitations of the current feasibility-level deployment. In addition, larger-scale datasets would support more robust statistical analysis and enable refinement of both the stress modelling components and the weighting scheme of the Stress Index.
Future work will focus on extending the Course Digital Twin toward semester-level and institutional-scale optimization. A primary direction involves the integration of multiple Course Digital Twins into a unified Semester Digital Twin, enabling coordinated scheduling across courses and reducing cumulative stress peaks at the curriculum level. In addition, larger multi-institutional deployments and longitudinal studies will be required to validate the robustness of the stress modelling framework and to assess its impact on student outcomes over time. Further methodological improvements include sensitivity analysis of the Stress Index weighting scheme, exploration of data-driven weighting approaches, and integration of advanced optimization techniques beyond rule-based scheduling adjustments. Controlled comparative studies between stress-aware and traditional scheduling approaches will also be necessary to establish the effectiveness of the proposed framework under real-world academic conditions.
6. Conclusions
This work presented a Course Digital Twin framework for stress-aware academic scheduling, integrating wearable-derived physiological signals, structured self-reports, and contextual workload parameters into a unified simulation-driven decision-support system. The proposed architecture combines a rule-based stress engine, optional machine learning components, and interactive scheduling interfaces to enable proactive workload redistribution at course level.
Unlike conventional stress monitoring systems that focus solely on detection, the platform operationalizes stress as a computational signal within academic planning. Through simulation preview and structured schedule adjustments, instructors can evaluate and modify workload distribution before applying changes. Early pilot deployment across two universities and three postgraduate courses demonstrated technical feasibility and indicated that modest temporal redistribution of assignments and laboratory sessions can reduce projected stress peaks.
In addition to scheduling-based modelling, the sensing layer demonstrated stable physiological data acquisition throughout the pilot deployment. Wearable-derived signals, including heart rate variability, activity levels, and sleep indicators, were collected through the mobile health platform and integrated with questionnaire-based stress reports. Due to platform restrictions imposed by commercial wearable providers, only a subset of aggregated physiological indicators is accessible through standard APIs, limiting direct access to raw sensor streams. Nevertheless, the available signals provided sufficient information for constructing the Course Stress Index and contextualizing student workload patterns. Preliminary analysis indicated moderate correlations between physiological indicators and self-reported stress levels, supporting the use of multimodal sensing as a complementary signal for stress modelling within the Course Digital Twin. Although the pilot sample size was limited, these observations suggest that physiological sensing can provide meaningful contextual input for stress-aware academic planning.
The system was designed under strict privacy by design principles, incorporating pseudonymous identifiers, role-based access control, and human-in-the-loop governance mechanisms. Stress analytics function as decision-support signals rather than diagnostic or punitive instruments, preserving institutional oversight and instructor autonomy. The findings of this study should be interpreted within the context of a pilot-scale feasibility deployment, and further large-scale validation is required to establish the effectiveness and generalizability of the proposed approach.
Although the pilot scale remains limited and longer-term validation is required, the results suggest that integrating multimodal stress modelling into academic scheduling workflows is both operationally viable and structurally meaningful. The presented framework establishes a foundation for future semester-level coordination across multiple courses and demonstrates how Digital Twin methodologies can support data-driven academic planning and stress-aware educational system design at institutional scale.





 ,
,