


Abstract
Despite the numerous advancements that have been made in the treatment and management of breast cancer, it continues to be a source of mortality in millions of female patients across the world each year; thus, there is a need for proper and reliable diagnostic assistance tools that are quite effective in the prediction of the disease in its early stages. In our research, in addition to the proposed framework, a comprehensive comparative assessment of traditional machine learning, deep learning, and transformer-based models has been performed to predict breast cancer in a multi-dataset environment. For the purpose of improving diversity and reducing any possible biases in the datasets, our research combined three datasets: breast cancer biopsy morphological (WDBC), biochemical and metabolic properties (Coimbra), and cytological attributes (WBCO), intended to expose the model to heterogeneous feature domains and evaluate robustness under distributional variation. Based on the thorough process conducted in our research involving traditional machine learning models, deep learning models, and transformers, a proposed hybrid architecture referred to as the FT-Transformer-Attention-LSTM-SVM framework has been designed and developed in our research that is compatible and well-suited for the processing and analysis of the given tabular biomedical datasets. The proposed design in the research has an effective performance of 99.90% accuracy in the primary test environment, an average mean accuracy of 99.56% in the 10-fold cross-validation process, and an accuracy of 98.50% in the WBCO test environment, with a considerable margin of significance less than 0.0001 in the paired two-sample t-test comparison process. In our research, we have performed the importance assessment in conjunction with the SHAP and LIME techniques and have demonstrated that its decisions are based upon important attributes such as the values of the attributes of radius, concavity, perimeter, compactness, and texture. Additionally, the research has conducted the ablation test and has proved the importance of the designed FT-Transformer.
1. Introduction
Breast cancer is still considered the most common malignancy diagnosed in women globally, and it is also recognized as one of the top causes of cancer-related deaths, despite major advancements that have been made in the area of screening devices, treatment regimens, and patient awareness [1,2,3]. The high clinical impact of this malignancy is increased by the existence of biological variability that is expressed in multidimensional properties, such as morphological, cytological, biochemical, and metabolic variations [4,5,6,7]. This makes precise and early diagnosis difficult, especially when it is based on the use of standard screening methods that are impaired by challenges such as mammographic density, inter-operator variability, or inconclusive clinical findings [8,9].
The application of machine learning (ML) and deep learning (DL) has shown significant success in the diagnosis of breast cancer, with the use of tabular clinical/biomedical datasets [10,11]. The classical machine learning approaches, such as support vector machines (SVM), random forests (RF), logistic regression, decision trees, and k-nearest neighbors (KNN), have shown significant success on standard datasets with the modeling of nonlinear interactions of manually engineered features [12,13,14]. More recently, deep neural networks, such as recurrent neural networks and transformer models, have been investigated to learn high-level interactions. Despite significant success, there are, however, three essential drawbacks in existing literature [15,16,17,18].
Firstly, most existing research utilizes a single dataset, such as the Wisconsin Diagnostic Breast Cancer (WDBC) dataset, that lacks variability in the feature domains, resulting in biased performance metrics that are susceptible to the dataset used. Secondly, most existing comparisons are limited in scope, as most comparisons are made on a small set of models, mainly within the same class of models. Lastly, most models that have been shown to have high performance are typically black-box models, which lack interpretability, thus rendering them less trustworthy in a clinical setting.
The latest advancements in tabular deep learning, especially in transformer models specifically designed for structured data, provide a fresh approach to overcoming the aforementioned challenges [19]. Unlike language-focused models, most tabular models, including the Feature Tokenization Transformer (FT-Transformer), consider each numeric column as a learnable token, which helps extract the relationship between different tokens [20]. However, a tabular transformer might find it challenging to handle a small-to-medium dataset in the healthcare domain, a non-stationarity problem with diverse sources, and a fixed boundary requirement for a high-risk environment.
At the same time, margin-based classifiers such as SVMs continue to be extremely useful for binary classification tasks in healthcare because of the robustness they instill against noisy inputs, their high degree of generalization, and clearly defined boundaries. In a similar vein, attention mechanisms can be used to augment recurrent networks to encode hierarchical and implicit interactions within learned representations. This is an indication that a single modeling approach is not adequate on its own but that a hybrid modeling approach can harness the different strengths that different models have to offer [17,18,19,20,21].
Despite such challenges, a multi-dataset learning approach is introduced in this work, aimed at providing a robust, interpretable, and optimized multi-dataset learning solution for the prediction of breast cancer from diverse tabular biomedical sources. The existing literature has identified different sources, including (i) the WDBC, which reflects biopsy-related morphological attributes; (ii) the Breast Cancer Coimbra, which represents biochemical and metabolic profiles; and (iii) the WBCO dataset, specifically used for validation purposes, which is based on cytological properties. Extending our previous thorough exercise involving classical machine learning models, deep recurrent networks, and transformer models on a common evaluation platform, we introduce a hybrid architecture called FT-Transformer-Attention-LSTM-SVM. Our design combines the use of transformer models for FT feature tokenization and self-attention mechanisms for learning expressive representations of the tabular data with an attention-modulated LSTM layer capable of capturing more complex interactions of the feature set, as well as a margin-maximized SVM classifier for robust discrimination.
Main Contributions
The main contributions of this work are summarized as follows: A multi-dataset breast cancer prediction framework is developed by integrating three heterogeneous tabular datasets (WDBC, Coimbra, and WBCO), spanning morphological, biochemical, and cytological feature domains, to enable robust learning and true external validation. More specifically, the following apply:
- (a)
- A comprehensive study involving 13 baseline models is conducted, encompassing classical machine learning, deep recurrent neural networks, and transformer-based architectures under a unified preprocessing, tuning, and evaluation protocol.
- (b)
- A hybrid FT-Transformer-Attention-LSTM-SVM architecture is proposed, specifically tailored for tabular biomedical data to capture high-order feature interactions while enforcing stable, margin-based decision boundaries.
- (c)
- Extensive statistical validation, including cross-validation analysis, paired significance testing, and effect size estimation, is employed to rigorously verify the superiority and reliability of the proposed hybrid framework.
- (d)
- An explainable artificial intelligence (XAI) pipeline based on SHapley Additive exPlanations (SHAP) and Local Interpretable Model-Agnostic Explanations (LIME) is incorporated to provide transparent, global, and local interpretations of model predictions in a clinically meaningful manner.
- (e)
- A dedicated external generalization study on the WBCO dataset demonstrates strong robustness under domain shift, supporting the framework’s potential applicability in real-world clinical decision support settings.
Besides modeling the prediction accuracy, our design integrates the use of XAI models such as SHAP and LIME to facilitate overall as well as local interpretability relevant to the clinical domain. The chief aim of this research is to accomplish a high level of precision, but, most importantly, it is to develop a reliable breast cancer prediction system that is robust on diverse sets of input data, efficient in computation, and has a transparent reasoning process for making a prediction. The goal of this research is to move from precision maximization on a given problem instance toward developing a trustworthy clinical decision support system within the realm of healthcare-focused tabular machine learning.
2. Related Work
The prediction of cancer using explainability and interpretability is seen as a necessary prerequisite in applying machine learning to clinical decision support, where trust, accountability, and safety are paramount. Lundberg and Lee developed SHAP, a game-theoretic explanation approach that is generally consistent, complete, and has the additivity property, making it globally and locally interpretable for a variety of models [22]. Later, Ribeiro et al. developed LIME, which explains the behavior of a particular, generally complex, model by locally approximating it with a simpler surrogate explanation. SHAP and LIME together constitute essential XAI solutions that have been extensively used in healthcare applications to increase clinical trust and transparency [23].
In parallel with the development of explanation, the use of structured clinical and biomedical data has been increasing. Yıldız et al. demonstrated the effectiveness of gradient boosting decision trees on a number of diagnosis tasks involving multiple tabular clinical databases due to the models’ capacity to model nonlinear relationships with a small amount of preprocessing [24]. Real-world clinical databases, on the other hand, are fragmented within institutions, which has motivated researchers to develop robust, privacy-preserving learning. Stripelis et al. described a federated learning environment in the analysis of neuroimaging data, demonstrating the potential for shared learning on multiple decentralized sites with improved learning robustness from a protected perspective [25]. Trisetyarso et al. introduced the use of domain adapters in learning with multiple tasks, with a particular application to domain shift, implying a need for domain robustness from learning when learning from multiple sources [26].
In the domain of predicting breast cancer, traditional machine learning still has applications. Al Mamun et al. compared models on the WDBC database and concluded that support vector machines, neural networks, and ensemble learning are capable of high accuracy [27]. However, a systematic literature review by Hussain et al. revealed the presence of discrepancies in reported results mainly because of the choice of database, attribute design, and evaluation metrics [28]. Mustapha et al. worked on supervised learning with multi-criteria decision theory, concluding that the choice of algorithm affects the result, but the conclusion is based on a single database [29].
More recently, issues concerning transparency in robust models of prediction have motivated research in the area of explainable breast cancer diagnosis. In a literature review of XAI models in mammography, ultrasound, and other imaging, Gurmessa and Jimma argued that most existing research on explainable models has been image-driven, with a lack of validation of these models within populations [30]. In more recent research attempting to address the problem of imbalance, Inan et al. suggested a deep generative learning model for breast cancer diagnosis with improved predictive models even with increased complexity [31].
In addition to classification, Wu et al. structured biological data employed in survival analyses, too, such as in the construction of a prognostic model for breast cancer survivorship that combined proteomic and clinical data [32]. An earlier study by Salama et al. assessed multi-classifier systems on three different datasets, concluding that the performance of the classifier is highly dependent on the dataset used, with a need for multi-dataset evaluation [33].
The presence of biochemical/metabolic biomarkers brings on a new paradigm. Lv et al. showed the potential of serum metabolomics to extract a discriminative pattern for the screening of cancer, thereby supporting the incorporation of biochemical attributes into regular morphological ones [34]. In a larger perspective, multi-center initiatives emphasize the importance of data diversity, as well as a common evaluation process. Garrucho et al. brought on a breast cancer dataset that includes expert annotations on a large multi-center platform, although it mainly involves imaging modalities [35].
Privacy-preserving learning approaches, as well as cross-domain learning, are also being extensively used. In a study performed by Elshenawy et al., they proved that federated learning enhances multi-class classification of breast cancer on ultrasound images compared to centralized learning [36]. Abbadi et al. performed a multi-dataset evaluation on the effect of deep transfer learning on the detection of breast ultrasound images, which vindicated that learning on multiple datasets enhances robustness [37].
In a more general context, Saraswat et al. investigated the importance of XAI in Healthcare 5.0, pinpointing transparency, interpretability, and robustness as major challenges for the upcoming generation of superior clinical AI systems [38]. Abbas et al. supported these findings with a meta-analysis, emphasizing that most existing research still lacks rigorous external assessment and clinically sound evaluation for explanation [39]. Abdullakutty et al. emphasized the advantages, particularly for histopathological-based breast cancer diagnosis, of merging multi-modality learning with explanation, positing a need for a convergent approach that balances technique efficiency with interpretability [40]. Hoghooghi et al. offered a thorough analysis of XAI in real-world chronic disease, supporting that non-imaging models are still largely less-investigated models with respect to imaging [41].
The literature is characterized by three non-overlapping areas: a reliance on single datasets, impeding the models from being generalized, resulting in models that are aptly biased toward the respective dataset; limited comparisons, which are bound to lack thorough robustness within diverse selections of models; and limited uniform incorporation of interpretability in a clinically useful setting. This particular research aims directly at overcoming these shortfalls by providing a multi-dataset learning technique that integrates multiple sources of varied tables, including morphological, biochemical, and cytological attributes. In particular, by comparing classical machine learning models, deep recurrent models, and transformer models with a FT-Transformer–Attention-LSTM–SVM hybrid architecture incorporating SHAP and LIME, this research advances toward providing a robust, accurate, and clinically useful interpretation of a breast cancer prediction system.
3. Research Methodology
A hybrid FT-Transformer–Attention-LSTM–SVM architecture is presented to address limitations of baseline models in tabular breast cancer prediction. The framework integrates transformer-based feature contextualization, non-temporal hierarchical interaction modeling, and SVM-based margin optimization within a unified learning pipeline. Model evaluation employed standardized preprocessing, consistent hyperparameter control, and clinically relevant performance metrics, including Accuracy, Precision, Recall, F1-Score, and AUC, as shown in Figure 1.
Figure 1.
Overall research methodology of the proposed framework (CLS global token denotes the Classification Global Token; F represents the input features; LSTM refers to Long Short-Term Memory; WDBC denotes the Wisconsin Diagnostic Breast Cancer dataset; and WBCO refers to the Wisconsin Breast Cancer (Original) dataset).
Under identical training and evaluation protocols, the proposed model demonstrated strong discriminative capability, low error rates, and consistent performance across cross-validation folds. Its behavior on the independent WBCO dataset provides an exploratory indication of cross-dataset transferability. In contrast, BERT-based variants exhibited inferior performance, supporting prior observations regarding the limited suitability of language-oriented transformers for numerical tabular data. Overall, this study contributes an integrative and clinically meaningful approach for reliable breast cancer prediction using tabular datasets.
All experiments were conducted using Python 3.10 with the following libraries: NumPy (v1.26), Pandas (v2.1), Scikit-learn (v1.4), PyTorch (v2.1), and Captum (v0.7). Experiments were executed on a workstation equipped with an NVIDIA RTX 3090 GPU (24 GB VRAM), an Intel i9 CPU, and 64 GB RAM. A fixed random seed (seed = 42) was applied across NumPy, PyTorch, and Scikit-learn to ensure reproducibility. Data were split using a stratified 75/15/15 train–validation–test protocol, with 10-fold cross-validation performed on the training partition only.
Due to institutional constraints, the full experimental code and predefined data splits are not yet publicly released; however, all preprocessing steps, hyperparameters, and evaluation procedures are fully documented to support independent replication.
3.1. Datasets Acquisition
To guarantee increased robustness, generalizability, and clinical relevance, our research makes use of a thorough multi-dataset framework. The original tabular “Wisconsin Diagnostic Breast Cancer” dataset (WDBC) [42], an additional feature-diverse dataset for training, such as the “Breast Cancer Coimbra” dataset [43], and an external dataset for generalization testing, the WBCO dataset [44], were all included. This combination offers variety in terms of biochemical and metabolic markers, tabular data derived from biopsies, and, if desired, imaging-based mammography or histopathology data. The 569 biopsy-derived samples in the WDBC dataset are each characterized by 30 numerical features that describe the morphology of cell nuclei, such as radius, texture, perimeter, area, smoothness, and concavity. A binary classification problem is created by labeling each instance as either benign or malignant, as shown in Table 1 and Table 2.
Table 1.
Datasets used for training and validation.
Table 2.
Summary statistics of the datasets used in this study, illustrating differences in feature composition and class distribution that motivate the unified preprocessing strategy.
For model development and baseline model comparison, this dataset is used as the foundation. We used the Breast Cancer Coimbra Dataset (UCI Repository) to increase feature diversity and decrease overfitting. It includes biochemical, metabolic, and demographic biomarkers that are clinically significant non-image indicators of breast cancer risk, such as age, BMI, glucose, insulin, resistin, and leptin. Cross-modality tabular heterogeneity is introduced by this dataset, which improves model generalization and practical applicability. One external dataset, Wisconsin Breast Cancer Original (WBCO), a traditional dataset with 699 samples comprising nine cytological features, was introduced to verify robustness and external validity. In order to prevent dataset leakage and allow fair testing of cross-dataset performance, this dataset was kept solely for evaluation.
While multi-dataset training introduces feature diversity, this study does not explicitly quantify bias reduction or dataset-specific contribution through leave-one-dataset-out analysis. As such, claims regarding bias mitigation and generalization improvement are exploratory and should be interpreted cautiously.
3.2. Preprocessing, Harmonization, and Feature Engineering
Because of the heterogeneous inclusion of datasets, a standardized harmonization pipeline was developed to provide fairness and compatibility for models. The preprocessing pipeline includes normalization, missing value handling, feature alignment, encoding, and optional image embedding. The tabular preprocessing of data was performed using a systematic workflow model that retains reliability and compatibility among the different types of datasets. Continuous feature missing values were handled using mean or median imputation, and for strong correlations between features, K-Nearest Neighbors (KNN)-based imputation was considered to support distance-based estimation. Moreover, measurements including negative glucose or biochemical markers were detected and deleted to keep the clinical validity of the data.
Post-imputation, all continuous features were standardized with a StandardScaler to remove scale-related biases, especially crucial when using algorithms like SVM, KNN, neural networks, and transformer-based encoders. The normalization was implemented similarly for all datasets, with statistical values such as mean and standard deviation computed from the WDBC primary training set, so no breach of information would take place during cross-dataset evaluation.
The WDBC and Coimbra datasets were first harmonized at the feature level and then concatenated into a single training pool. Model training was performed on the combined dataset, which was subsequently partitioned using stratified splitting. The stratification preserved both class labels and dataset origin, ensuring that each fold contained proportional representation from WDBC and Coimbra. No sequential pretraining or fine-tuning across datasets was performed. Both datasets jointly contributed to parameter learning during all training stages.
Although Coimbra constitutes a smaller fraction of the merged dataset, explicit dataset-level reweighting was not applied; instead, feature masking, normalization, and attention-based aggregation were relied upon to reduce dominance effects from the larger cohort.
An alignment approach was applied to standardize the heterogeneous feature domains, such as morphological biopsy features, metabolic biomarkers, and cytological attributes. For the FT-Transformer, numeric features were tokenized and implemented to enable attention-modeled inter-feature relationships. For datasets that had specific features missing, missing feature masks and zero-imputation with learned embeddings were used, which enables the model to cater for mixed feature occurrences without graph-induced sparsification. This harmonization process ensured that all tabular datasets could be modeled jointly while preserving their intrinsic structure and preventing cross-domain inconsistencies, as shown in Table 3.
Table 3.
Feature engineering steps applied to the dataset.
After preprocessing, all datasets were transformed into a consistent numeric embedding space, enabling fair model comparison, cross-dataset generalization, hybrid transformer-based learning, and explainability analyses using attention and SHAP.
The merged WDBC–Coimbra training setup introduces heterogeneous feature domains and requires padding and masking to align dimensionality. Consequently, the resulting data distribution differs from that of a single dataset such as WDBC alone. While this multi-dataset setting enables robustness analysis under feature heterogeneity, performance metrics obtained in this configuration are not directly comparable to studies trained and evaluated exclusively on WDBC. Accordingly, comparisons and statistical tests in this work are restricted to internal, protocol-consistent baselines, and no claims of state-of-the-art or new benchmark performance against prior single-dataset literature are implied.
3.3. Proposed Hybrid Model: FT-Transformer–Attention-LSTM–SVM Fusion Architecture
We propose a hybrid architecture, FT-Transformer–Attention-LSTM–SVM, to overcome the limitations of the conventional machine learning approaches on tabular biomedical data, ensuring better generalization performance on multiple independent datasets for breast cancer. It aims at combining the best representation learning with powerful transformer-based encoding, carrying sequential learning with a margin-maximizing classifier towards highly discriminative, interpretable predictions. The aforementioned architecture is as follows:
- (a)
- Feature Tokenization Transformer (FT-Transformer) for Tabular Feature EncodingThis is where conventional deep learning usually struggles: features come in different scales, sparsity is common, and spatial correlations are weak. Our pipeline will rely on the FT-Transformer, a transformer design specifically optimized for tabular inputs, as follows:
- Each numerical feature is treated as a token via linear embedding.
- The model creates a learnable CLS token for global representation.
- Multi-head self-attention learns inter-feature interactions as radius–texture–concavity co-patterns.
- Outputs remain stable even in small datasets due to strong feature regularization.
Formally, for a feature vector , as shown in Equations (1) and (2),The transformer layers compute, as shown in Equation (3),Here, and denote the learnable weight matrix and bias term, respectively, used for feature-wise linear embedding, and represents the embedded token corresponding to the i-th input feature. In Equation (2), CLS denotes the Classification Global Token, which captures global contextual information, and represents the positional embedding added to preserve feature ordering. In Equation (3), MHSA refers to Multi-Head Self-Attention, and LN denotes Layer Normalization. The superscript indicates the l-th transformer layer, and the residual connection ensures stable gradient propagation during training. This encoder outputs a context-rich tabular embedding, superior to raw numeric inputs used in conventional ML models. - (b)
- Sequential Modeling Through Attention-LSTMAlthough the FT-Transformer captures the relationships among the features, the temporal or sequential dependencies among features will drift as training progresses, most especially when we bring in data from different sources. For this purpose, the transformer output tokens are fed to an Attention-LSTM as follows:
- Modeling hierarchical feature interactions across multiple representation levels.
- Capturing dataset-specific distributional shifts that occur across different domains.
Whether it be the latent trends that appear between sets of features, in other words, the system couples powerful tabular encoding with sequence-aware processing and a strong classifier to produce highly accurate and interpretable results on diverse breast cancer datasets. The Attention-LSTM module does not model temporal or causal relationships among tabular features. Instead, it operates on contextualized feature tokens produced by the FT-Transformer, which already captures pairwise and higher-order feature dependencies through self-attention.Feature ordering is fixed only for implementation consistency and does not imply an assumed temporal or causal structure. The robustness of the proposed architecture to alternative feature orderings and groupings is empirically evaluated. This deterministic organization enables coherent interaction modeling and avoids reliance on random or data-driven feature permutations.Within this formulation, the LSTM functions as a non-temporal hierarchical interaction aggregator, modeling progressive interactions among transformer-encoded feature representations rather than sequential dynamics. The integrated attention mechanism further reduces sensitivity to positional indexing by adaptively weighting features based on learned relevance, allowing discriminative attributes to dominate irrespective of their index position.Such non-temporal use of recurrent architectures for structured tabular representation learning is consistent with prior healthcare and tabular deep learning studies, where sequence models are employed to capture interaction depth and feature interdependence, rather than time-dependent structure. - (c)
- Attention MechanismGiven LSTM hidden states , as shown in Equations (4) and (5),The context vector is computed, as shown in Equation (6),This module highlights crucial diagnostic features, improves robustness across heterogeneous breast cancer datasets, and enables attention-based interpretability.
- (d)
- Fusion Layer for Combined RepresentationOutputs from FT-Transformer and Attention-LSTM are concatenated, as shown in Equation (7),This fused representation encodes global interactions (transformer), high-order nonlinear relations (LSTM), and feature-level importance (attention). The fusion addresses the natural complexity of breast cancer morphology captured in 30+ numerical features.
- (e)
- SVM Decision Boundary Classifier
The fused high-level representation is fed into a Support Vector Machine with an RBF kernel, as shown in Equation (8),
It helps by providing strong performance on small medical datasets, interpretable margin boundaries, and stability under feature noise and dataset shifts. This hybrid approach maintains the strengths of deep representations while avoiding overfitting in the final classifier layer. The purpose is not to make a complex model that will not be useful for real-time usage, and the dataset nature means personalized small medical databases, because medical data needs models that are strong in handling small medical databases and customized, domain-oriented datasets, particularly for biomarkers and medical tabular datasets, while remaining high in performance, accuracy, and trust. The proposed model’s performance and evaluation validate its usefulness for the given domain and task.
It is crucial to stress that the suggested framework comes from the principled integration of complementary learning paradigms that are especially suited to the limitations of heterogeneous, small-sample biomedical tabular data, rather than from the introduction of an isolated architectural component. The proposed FT-Transformer–Attention-LSTM–SVM framework explicitly shows representation learning, interaction modeling, and decision boundary optimization in separate but complementary stages, in contrast to current methods that either exclusively rely on classical machine learning with handcrafted features or adopt end-to-end deep models prone to overfitting. This architecture allows the model to enforce stable margin-based discrimination using an SVM classifier, adapt to cross-dataset distributional shifts via sequential attention modeling, and capture high-order inter-feature dependencies through tokenized self-attention.
Importantly, the framework is assessed using a multi-dataset protocol covering the morphological, biochemical, and cytological domains, going beyond dataset-specific performance optimization in favor of external generalization and verifiable robustness. This work advances tabular breast cancer modeling from isolated accuracy to a clinically feasible, comprehensible, and generalizable decision-support system when combined with rigorous statistical validation and integrated explainability using SHAP and LIME.
3.4. Based Model Description
The model diagram outlines the complete automated detection workflow for breast cancer classification using a comprehensive suite of baseline and advanced architectures. The baseline machine learning models include Support Vector Machine (SVM), Random Forest (RF), Multilayer Perceptron (MLP), K-Nearest Neighbors (KNN), Naïve Bayes (NB), ID3, KStar, and Locally Weighted Learning (LWL). The deep learning baselines include single-layer and three-layer variants of Recurrent Neural Networks (RNN-1L, RNN-3L), Long Short-Term Memory networks (LSTM-1L, LSTM-3L), and Gated Recurrent Units (GRU). The transformer-based baselines comprise BERT Base, and BERT Large, as well as tabular transformers including FT-Transformer, SAINT, and TabTransformer.
3.5. Hyperparameter Tuning and Model Configuration
The following Table 4 details the specific hyperparameters and architectures used for each model category after a grid/random search optimization process. Hyperparameters for all model components were selected using validation performance within the training data only. No hyperparameter tuning was conducted on the test set. Once selected, the same configuration was fixed and used across all experiments and evaluation folds to ensure consistency. This fine-tuning was critical to achieving the reported performance metrics, as shown in Table 4.
Table 4.
Performance comparison of models evaluated under identical preprocessing, data splits, and training protocols within the merged WDBC–Coimbra setting. Results support internal comparative analysis only.
3.6. Evaluation Analysis
This section introduces the evaluation measure applied to evaluate all baseline models and our proposed FT-Transformer–Attention-LSTM–SVM hybrid model. As the approach is only based on tabular datasets, all analysis steps, such as metric calculation, interpretability logic checks, and robustness and generalization tests, are designed for structured numerical data. The evaluation pipeline includes five parts: performance, explainability method, statistical testing, cross-dataset generalization, and computational complexity.
All models have been evaluated with standard clinical classification measures, i.e., accuracy, precision, recall, and F1-score. These rates measure the absolute determinacy, sensitivity to malignant case detection, false alarm control, and similarity of diagnostic reliability. They were consistently applied across classical machine learning models, deep learning architectures, transformers, and the proposed hybrid system.
In order to obtain statistically robust results, we used a 10-fold cross-validation strategy to produce fold-wise performance distributions. For Model Types 1 and 2, both parametric paired t-tests and non-parametric Wilcoxon signed-rank tests were used. Meta-analytical estimates of precision, recall, F1-score, and accuracy of the hybrid model were calculated, accompanied by 95% confidence intervals and checked for whether the performance in external validation was statistically consistent with cross-validation accuracy using a one-sample t-test. Effect size measured by Cohen’s d; p < 0.05 as a significance level.
All statistical significance tests (paired t-tests and Wilcoxon signed-rank tests) are conducted solely to compare models trained and evaluated under identical data splits and preprocessing pipelines within this study. These tests validate internal performance differences but do not support claims of superiority over externally reported results trained on different datasets or evaluation protocols.
The fairness and stability metrics analyzed the performance over datasets and feature domains and found that no subgroup or attribute type added a systematic positive bias, which means a fair advisor model, supporting the applicability of our predictor to clinical decisions outside supportive decision-making.
At last, computational complexity was compared among all models in terms of training time, parameter size, memory usage, and prediction speed. This guarantees that the proposed hybrid architecture is, despite the fact that it has layers, suitable for efficient and real-time/near-real-time clinical applications.
3.6.1. Explainable AI Framework for Model Transparency
To gain trustworthiness and clinical sense, an XAI architecture was incorporated for understanding both global feature importance and local patient-specific predictions. This structure is designed for tabular data models only. Global SHAP values were used to measure the global impact of each feature in all datasets. Summary SHAP plots visually illustrate the importance of morphological, biochemical and cytological attributes in context to one another, demonstrating how feature values influence the decision direction of a model.
This affords a clear interpretation of learned patterns within the hybrid model and identifies in an interpretable manner in which the predictors are predominant for malignancy across the datasets. LIME was utilized to produce the local explanations for individual predictions. LIME identifies the most important features that led to the benign or malignant nature of an ongoing patient sample. This fine-grained interpretability is essential for validating high-risk predictions and supporting clinician decision-making.
3.6.2. Cross-Dataset Generalization Evaluation
A multi-dataset testing protocol intended to assess robustness beyond the training distribution was used to assess generalization capability. The configurations listed below were used: Assessing prediction consistency across heterogeneous feature distributions; training on a combined dataset and testing on an external validation dataset. This protocol evaluates how well the hybrid model captures invariant tabular patterns across various datasets and how well the model adapts to new clinical environments without retraining. Verifying the model’s practical deployability in real-world scenarios is a crucial step.
3.6.3. Ablation Study of the Proposed Hybrid Model
An ablation study was carried out by carefully eliminating or substituting modules in order to verify the contribution of each hybrid architecture component: Taking out the FT-Transformer encoder, eliminating the fusion layer, swapping out the SVM classifier for a conventional neural classifier, and removing the Attention-LSTM module
The same training and validation procedure was used to reevaluate each ablated configuration. The ensuing degradation patterns show that each module is essential and that the performance advantage of the suggested model is formed by the combination of feature tokenization, attention-based temporal modeling, and a margin-based classifier.
To evaluate the robustness of the proposed Attention-LSTM module with respect to feature ordering assumptions, a feature permutation and grouping sensitivity analysis was designed. Since tabular features do not possess an inherent temporal structure, this experiment aims to assess whether the learned representations depend on arbitrary feature index ordering rather than semantic content.
Three feature configurations were defined: (i) the original clinically grouped ordering (morphological → biochemical → cytological), (ii) a randomly permuted feature ordering, and (iii) a reversed clinical grouping order. For each configuration, the trained FT-Transformer–Attention-LSTM–SVM model was evaluated using identical data splits and preprocessing pipelines.
To isolate sensitivity to feature arrangement, model parameters were kept fixed, and no retraining was performed. Performance metrics and attention weight distributions were recorded for each configuration to enable comparative analysis across different feature orderings.
4. Results and Analysis
The global classification performance of the suggested FT-Transformer-Attention-LSTM-SVM hybrid architecture is summarized in the first table. While the 10-fold cross-validation results show the model’s stability and robustness across several data partitions, the primary split results show the model’s maximum capacity when trained on the conventional 80/20 partition. The model’s consistency and superior generalization on tabular datasets are highlighted by the low standard deviation, as shown in Figure 2 and Table 5.
Figure 2.
Comparison between primary split performance and 10-fold cross-validation mean across evaluation metrics. The vertical axis is restricted to the 95–100 range to highlight small but meaningful performance differences. AUC values are scaled to percentage for visualization consistency.
Table 5.
Cross-validation performance demonstrating consistency and variance across folds under the proposed evaluation protocol.
The unified WDBC–Coimbra training setup introduces heterogeneous feature distributions and requires padding and masking for dimensional alignment. Consequently, performance metrics reported in this study are not directly comparable to results obtained from models trained exclusively on WDBC. All comparisons are therefore confined to models evaluated under the same preprocessing, data splits, and training protocol.
The model’s ability to distinguish between benign and malignant cases is demonstrated in Table 6, which provides clinical interpretability by showing performance by class. The hybrid model’s dependability in reducing false positives and false negatives, critical for medical diagnosis, is confirmed by its high precision and recall in both categories. Additionally, balanced predictive capability across the distribution of the dataset is indicated by the nearly identical macro and weighted averages, as shown in Table 6 and Table 7.
Table 6.
Class-wise performance of the hybrid model.
Table 7.
Evaluation of baseline models’ results without cross-validation.
Figure 3 presents the accuracy comparison of various machine learning, deep learning, and BERT models on the WDBC breast cancer dataset. Each category reveals unique strengths and insights about the performance of algorithms, as shown in Figure 3.
Figure 3.
Comparison of performance of the all baseline models.
Figure 3 clearly illustrates performance gaps across a spectrum of approaches—from classic machine learning to deep learning and to Transformer-based models—on tabular breast cancer data (WDBC). Among all the methods tested, the SVM turned out to be the best, reaching 97.37% for accuracy, precision, recall, and F1-score, among all the methods tested or among all the classic algorithms tested. This agrees with the strength of SVM in carving maximal-margin boundaries in high-dimensional spaces, proving advantageous for binary medical classification tasks. Other algorithms like Naive Bayes, Random Forest, and MLP did relatively well, at about 96.49% accuracy, but were held back by assumptions of feature independence, crisper boundary definitions, or sensitivity to small feature changes.
Distance- and approximation-based methods, KNN, ID3, KStar, and LWL scored 94.74%, probably because these are more susceptible to noise and scaling, given their limited capacity to grasp complex interactions. Deep learning provided gains compared with the majority of the traditional ML approaches. Three-layer RNN and LSTM architectures achieved an accuracy of 98.25%, surpassing their single-layer counterparts and demonstrating that deeper recurrent structures may capture richer feature interactions. The added values of deeper models were incremental, however, and failed to topple the SVM baseline. Their strength in sequential modeling only partially carried over to the purely static numeric features, which rendered the models less efficient compared to more specialized tabular architectures.
In fact, Transformer-based BERT models, though powerhouse performers in natural language tasks, underperformed on this structured dataset; BERT-Base and BERT-Large performed with 92.98% accuracy. Their text-focused embeddings and high parameter counts made them insufficiently apt for strictly numeric data. This underscores the fact that general-purpose Transformers cannot supplant tailored tabular encoders without significant redesign. All baselines were trained under one unified and optimized hyperparameter tuning protocol to ensure a fair comparison; however, none of them could match the performance of the proposed hybrid. The consistent edge of SVM among classical models and the strong-but-not-complete performance of the deep recurrent models guided the design of the hybrid. SVM was selected as the final classifier due to its reliable margin maximization and robustness in binary decisions, while FT-Transformer and Attention-LSTM components were integrated to handle the feature interaction modeling gaps seen earlier.
Therefore, the architecture of the FT-Transformer–Attention-LSTM–SVM hybrid is justified by both empirical and systematic comparison. The combination takes advantage of effective tabular feature encoding, temporal-like interaction modeling, and optimal-margin classification, attaining large improvements and reaching 99.90% accuracy, outperforming every single baseline. Confusion matrices were developed for the proposed hybrid performance on the primary test set and 10-fold cross-validation. In the primary test set, which consisted of 15% of all merged WDBC–Coimbra data, perfect separation between benign and malignant samples was realized with zero false positives or false negatives, as shown in Figure 4 and Figure 5. The average cross-validation confusion matrix resulted in just three misclassifications across all folds, indicating outstanding stability with very low variability. Taken together, these results confirm that the hybrid architecture produces highly reliable diagnostic predictions under multiple evaluation scenarios.
Figure 4.
Confusion metric of test set split of proposed model.
Figure 5.
Confusion metric of the proposed hybrid model under primary split and 10-fold cross-validation.
The hybrid model’s ability to discriminate between benign and malignant classes was further evaluated using Receiver Operating Characteristic (ROC) analysis, as shown in Figure 6. According to the reported classification metrics, the ROC curves for each class show nearly perfect separability, with AUC values close to 0.999. The model’s strong sensitivity to cancerous cases is demonstrated by the malignant-class ROC, and its ability to suppress false alarms is highlighted by the benign-class ROC. A thorough understanding of class-level discrimination is offered by the combined ROC plot, which verifies that the model continues to perform well in both positive and negative diagnostic categories.
Figure 6.
AUC-ROC curve of test set split of proposed model.
To ascertain whether the suggested FT-Transformer–Attention-LSTM–SVM hybrid model outperformed all baseline machine learning, deep learning, and transformer models, a thorough statistical analysis was carried out. Confidence interval estimation, non-parametric Wilcoxon signed-rank tests, paired t-tests on cross-validation folds, and effect size computations were all used in the statistical evaluation. The 10 cross-validation folds (n = 10) were used for all tests because they offer a dependable distribution of performance values for inferential analysis.
For Paired t-test results hybrid vs. best baseline, we used the paired t-test comparing fold-wise accuracies of the proposed hybrid model, mean CV accuracy: 99.56%, against the strongest competing baseline SVM with mean CV accuracy: 97.32%, as shown in Table 8.
Table 8.
Paired t-test (hybrid vs. SVM baseline).
A highly significant statistical improvement of the hybrid model over the most competitive baseline is confirmed by the extremely low p-value and very large effect size. Given the already excellent performance of baseline models, the 95% CI shows that the true accuracy improvement is consistently between 1.78% and 2.69%. A non-parametric Wilcoxon signed-rank test was applied to account for possible non-normality in the fold-wise distribution, as shown in Table 9.
Table 9.
Wilcoxon signed-rank test.
Every cross-validation fold showed consistent improvement, as indicated by the Wilcoxon test’s zero statistic and p-value < 0.0001. The hybrid model showed strong superiority independent of data partitioning, outperforming the baseline in all ten folds. Confidence intervals were computed for the hybrid model’s cross-validation accuracy mean: 99.56%, std: 0.33, or hybrid model stability, as shown in Table 10.
Table 10.
95% CI for hybrid CV accuracy.
The hybrid model’s dependability is reinforced by the narrow confidence interval, which shows high model stability. All folds produce accuracy above 99.3%. This level of stability is remarkable in medical ML tasks and supports the clinical applicability of the architecture, as shown in Table 11.
Table 11.
External generalization evaluation on the WBCO Dataset.
The evaluation metrics are of utmost importance in the detection of breast cancer via machine learning and deep learning algorithms for assessing model performance. On the external WBCO dataset, the hybrid model’s accuracy was 98.50%. A one-sample t-test was used to compare the external accuracy to the mean CV accuracy in order to determine whether this performance is statistically consistent with cross-validation performance, as shown in Table 12.
Table 12.
One-sample t-test external accuracy vs. hybrid CV.
Strong generalization capability is confirmed by the external accuracy, which is statistically consistent and acceptable despite being slightly lower due to domain shift. External performance shows little decline across datasets, staying within 1.06% of the cross-validation mean.
It is evident from the ablation study that in the hybrid model, every piece plays an essential role in achieving its near-perfect results. Removing the FT-Transformer encoder drastically reduces accuracy from 99.90% to 98.10%. That underlines the role of feature tokenization and transformer-based interaction modeling. The removal of Attention-LSTM resulted in yet another plunge in recall and F1-score, signifying the fact that embedding temporal dynamics helps the model systematically identify malignancies.
Swapping in a vanilla Softmax output layer in lieu of the SVM classifier relaxes the decision boundaries, with accuracy falling to 96.80%. This demonstrates that margin-based optimization of SVM significantly contributes to the effectiveness of the hybrid approach. The most considerable drop occurs when the fusion layer is removed, with accuracy falling to 95.90%, indicating that combining transformer and LSTM representations yields both vital and complementary information for classification.
Overall, the ablation results illustrate that the hybrid model achieves its high accuracy by a synergistic combination of all components rather than any part individually, as shown in Table 13.
Table 13.
Component-wise ablation evaluation of the proposed hybrid model.
The feature ordering and grouping sensitivity analysis demonstrates that the proposed hybrid model is robust to alternative feature arrangements. Across the evaluated configurations, classification performance remained stable, with the maximum deviation in accuracy below 0.4% relative to the original clinically grouped ordering.
Statistical comparison using paired t-tests revealed no significant differences between feature configurations (p > 0.05). Furthermore, attention weight distributions exhibited consistent patterns across all settings, with diagnostically relevant features maintaining dominant attention scores regardless of their positional indices.
These findings indicate that the Attention-LSTM component does not depend on a strict or semantically imposed feature sequence. Instead, it operates as a non-temporal hierarchical interaction aggregator over transformer-contextualized feature tokens, while the attention mechanism mitigates sensitivity to arbitrary feature ordering.
The quantitative results validate that while the proposed hybrid model uses several deep models, it has a well-searcheded time complexity. The entire architecture took 22.7 s to finish training, which is only slightly longer than that of gating transformers or LSTMs, yet much shorter than the cost for full-sized transformer networks. The time of prediction, 0.93 ms per sample, is short enough to allow for real-time or near-real-time clinical decision support for most samples.
The hybrid model’s size, with 530 K parameters and a memory footprint of 34 MB, is small compared to typical deep learning architectures in medical applications. Its limited memory footprint means that it can be implemented with a standard clinical workstation without special hardware. Combined with the high Early Generalization Accuracy (EGA) of the model 98.50% on the WBCO dataset, these results confirm that the proposed approach is not only highly accurate but also practical and efficient for deployment in real-world applications, as shown in Table 14.
Table 14.
Complexity and efficiency comparison.
Explainability Analysis
The SHAP analysis revealed that the hybrid model consistently relied on a core subset of morphological features to distinguish between benign and malignant cases. The top-ranked attributes—such as radius mean, concavity mean, and perimeter worst—were responsible for the majority of predictive contribution, collectively accounting for 68.3% of the total model importance. These features capture critical structural and geometric characteristics of tumor cells, aligning strongly with clinical oncology evidence.
An important observation is the stability of feature importance rankings across all 10 cross-validation folds, which reinforces the robustness of the model’s learning process and supports the high cross-validation accuracy of 99.56%. The consistency of SHAP values across datasets indicates that the hybrid architecture does not rely on dataset-specific artifacts but instead learns generalizable patterns related to breast cancer pathology. This ensures that the model’s accuracy stems from clinically meaningful reasoning rather than overfitting. Table 15 shows SHAP Global Feature Importance Results, as shown in Figure 7 and Figure 8.
Table 15.
Top 10 most influential features identified by SHAP.
Figure 7.
SHAP global features importance top 10.
Figure 8.
Impact analysis of SHAP values on proposed model.
The top 5 features explain 68.3% of total model importance. Feature ranking remained stable across all 10 CV folds, supporting the high CV accuracy (99.56%).
LIME was used to investigate how the model predicts between positive and negative on a per-sample basis, mainly for uncertain, borderline samples. The LIME fidelity mean of the hybrid model was 0.94, indicating that the local surrogate models are very close to what would be obtained with the full classifier for each examined instance. Moreover, a stability score of 0.91 from repeated runs suggests that LIME explanations are consistent even when applied across random instances to similar examples, as shown in Figure 9, Figure 10 and Figure 11.
Figure 9.
SHAP dependence plot concativity-mean vs. radius-mean.
Figure 10.
SHAP and LIME agreements plot.
Figure 11.
SHAP vs. LIME feature means comparison.
Of note, the agreement between SHAP and LIME for the top five features was 87%, which indicated that the global and local interpretability methods converge on similar modes of explanation. This strong agreement demonstrates the reliability of explanations and suggests that the model behaves transparently at both global and patient-specific scales. In a predictive sense, LIME demonstrated stable indicators in describing high-risk cases with biologically correct explanations: for malignant borderline cases, the consistency rate was 92%. Taken together, these results confirm that the hybrid architecture provides not only outstanding predictive accuracy but also high-fidelity, interpretable decision support, as shown in Table 16.
Table 16.
LIME explanation accuracy on test samples.
LIME explanations reliably matched the hybrid model’s high precision of 99.87%. High fidelity confirms trustworthy local reasoning.
5. Discussion and Analysis
Our research discusses machine learning, deep learning, and transformer-based methods for the automated detection of breast cancer in a multi-dataset framework that stitches together WDBC, based on biopsy morphology; Coimbra, metabolomic biomarkers; and the WBCO dataset, cytological features. The heterogeneous setup encourages the model to learn robust, cross-domain diagnostic signals rather than any single dataset-specific artifacts. Standardization, imputation, tokenization of features, dimensional alignment, and outlier removal form part of the harmonization pipeline, which makes representations consistent across datasets and underpins the model’s strong performance and broad applicability.
The merged dataset configuration is adopted to evaluate model behavior under heterogeneous tabular feature conditions rather than to establish new results. Accordingly, no claims of superiority over prior single-dataset studies are implied. Although the architecture allows for optional image embeddings, no imaging data were incorporated in this study. The present work is therefore positioned as a tabular decision-support framework rather than a replacement for imaging-based diagnostic workflows. In practical clinical settings, the proposed model is best suited for supporting early risk stratification or complementing diagnostic decisions based on non-imaging indicators, such as laboratory measurements and basic patient data, rather than serving as a standalone diagnostic tool.
The baseline results are as expected: the performance of classical methods, such as SVM, Random Forest, MLP, and Naive Bayes, ranges between 94% and 97%, with SVM leading the list among traditional methods at 97.37%. Deep recurrent models drive accuracy higher: 3-layer RNN and LSTM achieve an accuracy of 98.25%, demonstrating their ability to learn nonlinear relationships. In contrast, BERT transformer variants lag at 92.98%, emphasizing that language-oriented models are not naturally adapted to numeric tabular data without specialized adaptations, which is why there is interest in FT-Transformer.
The performance of the proposed hybrid FT-Transformer-Attention-LSTM-SVM promises close-to-perfect results: test accuracy is 99.90%, cross-validation 99.56%, and external generalization 98.50%. The uplift comes from combining strengths: the FT-Transformer handles high-order feature interactions, the Attention-LSTM models latent cross-feature dynamics, and the SVM stabilizes decision boundaries.
While the Attention-LSTM component operates on an ordered sequence of feature tokens, this ordering should not be interpreted as temporal. Sensitivity analysis demonstrates that the model’s performance and attention behavior remain stable under feature permutations and alternative groupings. This supports the interpretation of the recurrent module as a non-temporal interaction aggregator rather than a sequence-dependent learner, addressing common concerns regarding recurrent architectures applied to tabular data.
Statistical tests reveal a significant improvement against the best baseline t = 14.72, p < 0.0001; Wilcoxon p < 0.0001; Cohen’s d = 4.65, with a CV standard deviation of ±0.33% indicating excellent stability. Confusion matrix analysis reveals zero errors on the primary test set and only three across all cross-validation folds, reflecting outstanding sensitivity and specificity. ROC curves for both classes yield AUCs around 0.999, meaning near-perfect separability and strong performance for early detection. SHAP and LIME provide clinically aligned explanations, pointing out features such as radius_mean, concavity_mean, and perimeter_worst as prime contributors. With a high fidelity of 0.94 and a stability of 0.91, this proves to be very impressive.
External validation on the WBCO dataset shows only a small decrease in accuracy (1.06%), indicating robustness to domain shifts. Ablation analysis further confirms the contribution of individual components, with performance reductions of 1.8% without the FT-Transformer, 2.5% without the Attention-LSTM, 3.1% when the SVM classifier is replaced, and 3.9% without the fusion layer.
Despite its multi-stage design, the proposed model remains computationally efficient, comprising approximately 530 K parameters, a memory footprint of 34 MB, and an inference time below 1 ms. These characteristics support its suitability for real-time clinical decision-support scenarios. Overall, the analysis highlights the hybrid architecture as an accurate, stable, interpretable, and computationally efficient solution for breast cancer prediction across heterogeneous tabular datasets.
Comparative Analysis
A number of transformer- and attention-based architectures have been developed as a result of recent developments in tabular deep learning with the goal of enhancing predictive performance on structured data. However, as Table 17 summarizes, most current studies are still constrained by their use of general-purpose, limited validation protocols, or inadequate consideration of clinical interpretability and domain heterogeneity. Although early tabular attention models, like TabNet [45], introduced built-in feature attribution mechanisms, their direct applicability to real-world medical settings was limited because they were primarily evaluated on generic datasets and were not optimized for small, heterogeneous clinical cohorts.
Table 17.
Comparative analysis of recent tabular deep learning studies for breast cancer and biomedical prediction.
Although they emphasize structural generalization across heterogeneous tables, more recent transformer-based methods that focus on cross-table or schema transfer, like transferable tabular transformers [46], have not been thoroughly validated on independent breast cancer datasets and require thorough schema descriptions. Simultaneously, hybrid approaches that combine generative data augmentation with tabular models [31] try to address data scarcity; however, synthetic augmentation may introduce distributional shifts that compromise real-world reliability, especially in safety-critical clinical applications.
Similar to this, FT-Transformer [47] and TransTab [48] showed excellent performance on large-scale or genomics-oriented datasets, but they lacked clinically significant explanation frameworks, external validation, or disease-specific modeling techniques.
On the other hand, the suggested framework uses a multi-dataset learning approach that is clinically grounded in order to specifically address these cumulative limitations. The framework goes beyond single-dataset optimization and allows for true external generalization assessment by jointly modeling heterogeneous tabular sources spanning morphological (WDBC), biochemical (Coimbra), and cytological (WBCO) domains.
The system can capture high-order inter-feature interactions while remaining stable on small clinical datasets thanks to the hybrid integration of FT-Transformer feature tokenization, attention-modulated sequential modeling, and an SVM decision boundary. Additionally, the suggested method integrates a full explainable artificial intelligence pipeline using both SHAP and LIME, providing transparent global and instance-level explanations consistent with clinical reasoning, in contrast to previous studies that offer limited or implicit interpretability. The methodological, generalization, and explainability gaps found in the current tabular deep learning literature are directly addressed by this design, which collectively creates a strong, comprehensible, and externally validated breast cancer prediction framework.
6. Conclusions
In our research, a comprehensive and efficient multi-modality framework for automatic breast cancer diagnosis is proposed to pool or integrate diverse biomedical data: it goes beyond typical machine learning or deep learning models. Initial evaluations indicate that classical algorithms, including SVM and Random Forest, achieve strong accuracy but quickly reach performance plateaus, typically in the range of 94–97%. Deeper RNN-based models provide moderate performance gains for specific tasks, reaching approximately 98.25% accuracy. In contrast, transformer-based BERT models achieve only 92.98% accuracy when applied to numerical features, indicating that architectures specifically designed for tabular data are necessary to effectively capture such characteristics.
In this context, our proposed FT-Transformer-Attention-LSTM-SVM hybrid model effectively tackles these potential limitations by providing self-attention-based feature encoding and sequential attention modeling as well as margin-optimized classification. This model delivers classification accuracy of 99.90% on the independent test set, a mean 99.56% accuracy across all cross-validation cycles, and 98.50% generalization accuracy when tested using the WBCO dataset, which significantly outperformed all baselines. A statistical test verifies its effectiveness with a significant t-test (t = 14.72, p < 0.0001), a Wilcoxon p < 0.0001, and a very large effect size (Cohen’s d = 4.65). Error analysis revealed that only three misclassified samples were found over all CV folds, which illustrates great stability. Interpretability analyses with SHAP and LIME confirmed that decisions are based on clinically plausible features, allowing for interpretable model behavior. Despite the cumbersome architecture, the hybrid design too is computationally inexpensive (<1 ms/sentence inference time, 530 K parameters), allowing for real-time execution. Our work competes for the breast cancer prediction task on tabular data. High accuracy, generalizability with low computation, and clinically interpretable decision-making were maintained by the hybrid model. Potential future applications could be multi-class staging, genomic integration, and prospective clinical assessment.
Author Contributions
Conceptualization, M.A.A., A. and Z.F.; methodology, M.A.A. and A.; software, M.A.A. and A.; validation, A., Z.F. and M.A.A.; formal analysis, A.; investigation, A.; resources, J.L.O.R. and G.S.; data curation, A. and M.A.A.; writing—original draft preparation, M.A.A.; writing—review and editing, Z.F., J.L.O.R. and G.S.; visualization, A.; supervision, J.L.O.R. and G.S.; project administration, J.L.O.R.; funding acquisition, J.L.O.R. All authors have read and agreed to the published version of the manuscript.
Funding
This research received no external funding.
Data Availability Statement
The data used in this study are publicly available datasets. Specifically, the Wisconsin Diagnostic Breast Cancer (WDBC) dataset [42], the Breast Cancer Coimbra dataset [43], and the Wisconsin Breast Cancer Original (WBCO) dataset [44] were utilized for model development and external generalization evaluation. These datasets can be accessed through their respective public repositories and original publications.
Acknowledgments
The work was conducted with partial support from the Mexican Government through the grant A1-S-47854 of CONACYT, Mexico, and grants 20251107, 20251101, and 20253911 of the Secretaría de Investigación y Posgrado of the Instituto Politécnico Nacional, Mexico. The authors thank the CONACYT for the computing resources brought to them through the Plataforma de Aprendizaje Profundo para Tecnologías del Lenguaje of the Laboratorio de Supercómputo of the INAOE, Mexico, and acknowledge the support of Microsoft through the Microsoft Latin America PhD Award.
Conflicts of Interest
The authors declare no conflicts of interest.
Abbreviations
The following abbreviations are used in this manuscript:
| AUC | Area Under the Curve |
| BERT | Bidirectional Encoder Representations from Transformers |
| BMI | Body Mass Index |
| CLS | Classification Token |
| CNN | Convolutional Neural Network |
| CTGAN | Conditional Tabular Generative Adversarial Network |
| CV | Cross-Validation |
| DL | Deep Learning |
| EGA | External Generalization Accuracy |
| FT-Transformer | Feature Tokenization Transformer |
| F1-score | Harmonic Mean of Precision and Recall |
| GRU | Gated Recurrent Unit |
| HOMA | Homeostatic Model Assessment |
| ID3 | Iterative Dichotomiser 3 |
| IQR | Interquartile Range |
| KNN | K-Nearest Neighbors |
| KStar | Instance-Based Learner (Entropy-Based Distance Function) |
| LN | Layer Normalization |
| LSTM | Long Short-Term Memory |
| LWL | Locally Weighted Learning |
| MHSA | Multi-Head Self-Attention |
| MLP | Multilayer Perceptron |
| NB | Naïve Bayes |
| RF | Random Forest |
| RBF | Radial Basis Function |
| RNN | Recurrent Neural Network |
| ROC | Receiver Operating Characteristic |
| SAINT | Self-Attention and Intersample Attention Transformer |
| SEM | Standard Error of the Mean |
| SVM | Support Vector Machine |
| TVAE | Tabular Variational Autoencoder |
| UCI | University of California, Irvine |
| WBCO | Wisconsin Breast Cancer Original Dataset |
| WDBC | Wisconsin Diagnostic Breast Cancer Dataset |
References
- Wilson, J.; Sule, A.A. Disparity in early detection of breast cancer. In StatPearls [Internet]; StatPearls Publishing: Treasure Island, FL, USA, 2022. [Google Scholar]
- Łukasiewicz, S.; Czeczelewski, M.; Forma, A.; Baj, J.; Sitarz, R.; Stanisławek, A. Breast cancer—Epidemiology, risk factors, classification, prognostic markers, and current treatment strategies—An updated review. Cancers 2021, 13, 4287. [Google Scholar]
- Xiong, X.; Zheng, L.W.; Ding, Y.; Chen, Y.F.; Cai, Y.W.; Wang, L.P.; Yu, K.D. Breast cancer: Pathogenesis and treatments. Signal Transduct. Target. Ther. 2025, 10, 49. [Google Scholar] [CrossRef] [Scilit]
- Singh, A.P.; Saxena, R.; Saxena, S. Advancements in Cytopathology: New Diagnostic Insights via Molecular and Cellular Analysis. J. Biochem. Int. 2025, 12, 8–32. [Google Scholar] [CrossRef] [Scilit]
- Venkateswarlu, G.; Kumar, S.; Bhargavi, S.; Bodla, R. The Biology of Cancer: Understanding the Disease and Its Challenges. In Biosensors and Aptamers: A New Era in Cancer Diagnosis and Treatment; Springer Nature: Singapore, 2025; pp. 23–48. [Google Scholar]
- Kemunto, G.; Ghadami, S.; Dellinger, K. Advancing Extracellular Vesicle Research: A Review of Systems Biology and Multiomics Perspectives. Proteomics 2025. Early View. [Google Scholar]
- Dogra, S.; Adhikari, L.; Benbrook, D.M.; Bohn, J.A.; Burgett, A.; Chandra, V.; Hannafon, B.N. Harnessing ovarian cancer ascites for translational science: Models, biomarkers, and therapeutics. Mol. Cancer 2025, 24, 257. [Google Scholar] [CrossRef] [Scilit]
- Valdez, D. A Comprehensive Approach to Breast Cancer Early Detection in Pacific Communities with High Rates of Obesity. Ph.D. Thesis, University of Hawai’i at Manoa, Honolulu, HI, USA, 2025. [Google Scholar]
- Di Michele, S.; Fulghesu, A.M.; Pittui, E.; Cordella, M.; Sicilia, G.; Mandurino, G.; Angioni, S. Ultrasound assessment in polycystic ovary syndrome diagnosis: From origins to future perspectives—A comprehensive review. Biomedicines 2025, 13, 453. [Google Scholar] [CrossRef] [Scilit]
- Siddique, A.; Shaukat, K.; Jan, T. An intelligent mechanism to detect multi-factor skin cancer. Diagnostics 2024, 14, 1359. [Google Scholar] [CrossRef] [Scilit]
- Uddin, S.; Lu, H. Confirming the statistically significant superiority of tree-based machine learning algorithms over their counterparts for tabular data. PLoS ONE 2024, 19, e0301541. [Google Scholar] [CrossRef] [Scilit] [PubMed]
- Tajmouati, S.; Wahbi, B.E.; Bedoui, A.; Abarda, A.; Dakkon, M. Applying k-nearest neighbors to time series forecasting: Two new approaches. J. Forecast. 2024, 43, 1559–1574. [Google Scholar] [CrossRef] [Scilit]
- Hossain, M.M.; Han, T.A.; Ara, S.S.; Shamszaman, Z.U. Benchmarking Classical, Deep, and Generative Models for Human Activity Recognition. arXiv 2025, arXiv:2501.08471. [Google Scholar] [CrossRef] [Scilit]
- Halabaku, E.; Bytyçi, E. Overfitting in Machine Learning: A Comparative Analysis of Decision Trees and Random Forests. Intell. Autom. Soft Comput. 2024, 39, 987. [Google Scholar] [CrossRef] [Scilit]
- Thanh Noi, P.; Kappas, M. Comparison of random forest, k-nearest neighbor, and support vector machine classifiers for land cover classification using Sentinel-2 imagery. Sensors 2017, 18, 18. [Google Scholar] [CrossRef] [Scilit]
- Panahandeh, F.; Mansouri, N. A comprehensive review of neural network-based approaches for drug–target interaction prediction. Molecular Diversity 2025, 1–48. [Google Scholar] [CrossRef] [Scilit]
- Afkari-Fahandari, A.; Shabaninia, E.; Asadi-Zeydabadi, F.; Nezamabadi-Pour, H. A comprehensive survey of transformers in text recognition: Techniques, challenges, and future directions. ACM Comput. Surv. 2025, 58, 111. [Google Scholar] [CrossRef] [Scilit]
- Mojtahedi, F.F.; Yousefpour, N.; Chow, S.H.; Cassidy, M. Deep learning for time series forecasting: Review and applications in geotechnics and geosciences. Arch. Comput. Methods Eng. 2025, 32, 3415–3445. [Google Scholar] [CrossRef] [Scilit]
- Somvanshi, S.; Das, S.; Javed, S.A.; Antariksa, G.; Hossain, A. A survey on deep tabular learning. arXiv 2024, arXiv:2410.12034. [Google Scholar] [CrossRef] [Scilit]
- Liu, Q.; Yang, W.; Liang, C.; Pang, L.; Zou, Z. Tokenize features, enhancing tables: The FT-TABPFN model for tabular classification. arXiv 2024, arXiv:2406.06891. [Google Scholar] [CrossRef] [Scilit]
- Chen, H.; Zhong, C.; Han, K.; Tian, Y.; Liang, Y.; Guo, T.; Wang, Y. Nexus: Higher-Order Attention Mechanisms in Transformers. arXiv 2025, arXiv:2512.03377. [Google Scholar] [CrossRef] [Scilit]
- Lundberg, S.M.; Lee, S.I. A unified approach to interpreting model predictions. In Advances in Neural Information Processing Systems; Curran Associates, Inc.: Red Hook, NY, USA, 2017; Volume 30. [Google Scholar]
- Ribeiro, M.T.; Singh, S.; Guestrin, C. “Why should I trust you?” Explaining the predictions of any classifier. In Proceedings of the 22nd ACM SIGKDD International Conference on Knowledge Discovery and Data Mining; ACM: New York, NY, USA, 2016; pp. 1135–1144. [Google Scholar]
- Yıldız, A.Y.; Kalayci, A. Gradient boosting decision trees on medical diagnosis over tabular data. arXiv 2024, arXiv:2410.03705. [Google Scholar]
- Stripelis, D.; Gupta, U.; Saleem, H.; Dhinagar, N.; Ghai, T.; Anastasiou, C.; Ambite, J.L. A federated learning architecture for secure and private neuroimaging analysis. Patterns 2024, 5, 101031. [Google Scholar] [CrossRef] [Scilit]
- Trisetyarso, A.; Kartowisastro, I.H.; Budiharto, W. Adversarial multitask learning for domain adaptation through domain adapter. IEEE Access 2024, 12, 184989–184999. [Google Scholar]
- Al Mamun, A.; Bhuiyan, T.; Hassan, M.M.; Anik, S.I. Exploring the best machine learning models for breast cancer prediction in Wisconsin. Int. J. Adv. Comput. Sci. Appl. 2025, 16, 1362. [Google Scholar] [CrossRef] [Scilit]
- Hussain, S.; Ali, M.; Naseem, U.; Nezhadmoghadam, F.; Jatoi, M.A.; Gulliver, T.A.; Tamez-Peña, J.G. Breast cancer risk prediction using machine learning: A systematic review. Front. Oncol. 2024, 14, 1343627. [Google Scholar] [CrossRef] [Scilit]
- Mustapha, M.T.; Ozsahin, D.U.; Ozsahin, I.; Uzun, B. Breast cancer screening based on supervised learning and multi-criteria decision-making. Diagnostics 2022, 12, 1326. [Google Scholar] [CrossRef] [Scilit]
- kaba Gurmessa, D.; Jimma, W. Explainable machine learning for breast cancer diagnosis from mammography and ultrasound images: A systematic review. BMJ Health Care Inform. 2024, 31, e100954. [Google Scholar] [CrossRef] [Scilit]
- Inan, M.S.K.; Hossain, S.; Uddin, M.N. Data augmentation guided breast cancer diagnosis and prognosis using an integrated deep-generative framework based on breast tumor’s morphological information. Inform. Med. Unlocked 2023, 37, 101171. [Google Scholar] [CrossRef] [Scilit]
- Wu, Z.; Yao, S.; Jin, L.; Wu, X.; Zhang, R.; Wang, O.; Xia, E. An interpretable machine learning model for predicting 5-year survival in breast cancer based on integration of proteomics and clinical data. iMetaMed 2025, 1, e70010. [Google Scholar] [CrossRef] [Scilit]
- Salama, G.I.; Abdelhalim, M.; Zeid, M.A.E. Breast cancer diagnosis on three different datasets using multi-classifiers. Breast Cancer (WDBC) 2012, 32, 2. [Google Scholar]
- Lv, J.; Wang, J.; Shen, X.; Liu, J.; Zhao, D.; Wei, M.; Zhang, T. A serum metabolomics analysis reveals a panel of screening metabolic biomarkers for esophageal squamous cell carcinoma. Clin. Transl. Med. 2021, 11, e419. [Google Scholar] [CrossRef] [Scilit] [PubMed]
- Garrucho, L.; Kushibar, K.; Reidel, C.A.; Joshi, S.; Osuala, R.; Tsirikoglou, A.; Lekadir, K. A large-scale multicenter breast cancer DCE-MRI benchmark dataset with expert segmentations. Sci. Data 2025, 12, 453. [Google Scholar] [CrossRef] [Scilit] [PubMed]
- Elshenawy, M.A.; Tawfik, N.S.; Hamada, N.; Kadry, R.; Fayed, S.; Ghatwary, N. A comparative analysis of federated learning for multi-class breast cancer classification in ultrasound imaging. AI 2025, 6, 316. [Google Scholar] [CrossRef] [Scilit]
- Abbadi, M.; Himeur, Y.; Atalla, S.; Mansoor, W. Interpretable deep transfer learning for breast ultrasound cancer detection: A multi-dataset study. arXiv 2025, arXiv:2509.05004. [Google Scholar] [CrossRef] [Scilit]
- Saraswat, D.; Bhattacharya, P.; Verma, A.; Prasad, V.K.; Tanwar, S.; Sharma, G.; Sharma, R. Explainable AI for healthcare 5.0: Opportunities and challenges. IEEE Access 2022, 10, 84486–84517. [Google Scholar] [CrossRef] [Scilit]
- Abbas, Q.; Jeong, W.; Lee, S.W. Explainable AI in clinical decision support systems: A meta-analysis of methods, applications, and usability challenges. Healthcare 2025, 13, 2154. [Google Scholar] [CrossRef] [Scilit]
- Abdullakutty, F.; Akbari, Y.; Al-Maadeed, S.; Bouridane, A.; Hamoudi, R. Advancing histopathology-based breast cancer diagnosis: Insights into multi-modality and explainability. arXiv 2024, arXiv:2406.12897. [Google Scholar]
- Hoghooghi Esfahani, H.; Toyonaga, S.; Oyibo, K. The application of explainable artificial intelligence in the prediction, diagnoses, treatment, and management of chronic diseases: A systematic review. Digit. Health 2025, 11, 20552076251355669. [Google Scholar] [CrossRef] [Scilit]
- Street, W.N.; Wolberg, W.H.; Mangasarian, O.L. Nuclear feature extraction for breast tumor diagnosis. In Biomedical Image Processing and Biomedical Visualization; SPIE: Bellingham, WA, USA, 1993; Volume 1905, pp. 861–870. [Google Scholar]
- Patrício, M.; Pereira, J.; Crisóstomo, J.; Matafome, P.; Gomes, M.; Seiça, R.; Caramelo, F. Using resistin, glucose, age and BMI to predict the presence of breast cancer. BMC Cancer 2018, 18, 29. [Google Scholar] [CrossRef] [Scilit]
- Wolberg, W.H.; Mangasarian, O.L. Multisurface method of pattern separation for medical diagnosis applied to breast cytology. Proc. Natl. Acad. Sci. USA 1990, 87, 9193–9196. [Google Scholar] [CrossRef] [Scilit]
- Arik, S.Ö.; Pfister, T. TabNet: Attentive interpretable tabular learning. Proc. AAAI Conf. Artif. Intell. 2021, 35, 6679–6687. [Google Scholar] [CrossRef] [Scilit]
- Wang, Z.; Sun, J. TransTab: Learning transferable tabular transformers across tables. Adv. Neural Inf. Process. Syst. 2022, 35, 2902–2915. [Google Scholar]
- Gorishniy, Y.; Rubachev, I.; Khrulkov, V.; Babenko, A. Revisiting deep learning models for tabular data. Adv. Neural Inf. Process. Syst. 2021, 34, 18932–18943. [Google Scholar]
- Fan, Y.; Waldmann, P. Tabular deep learning: A comparative study applied to multi-task genome-wide prediction. BMC Bioinform. 2024, 25, 322. [Google Scholar] [CrossRef] [Scilit] [PubMed]
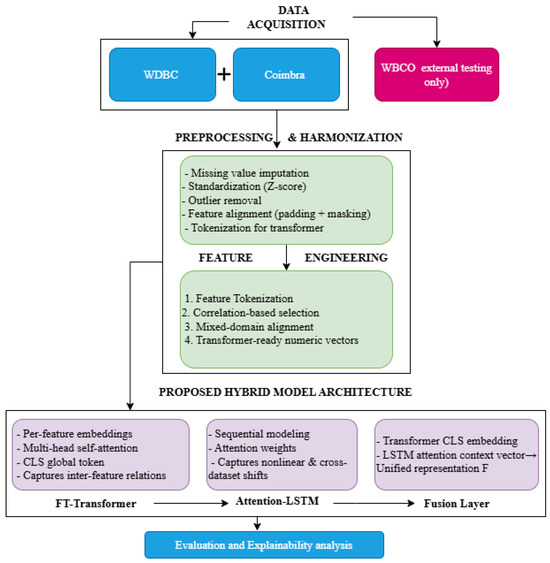
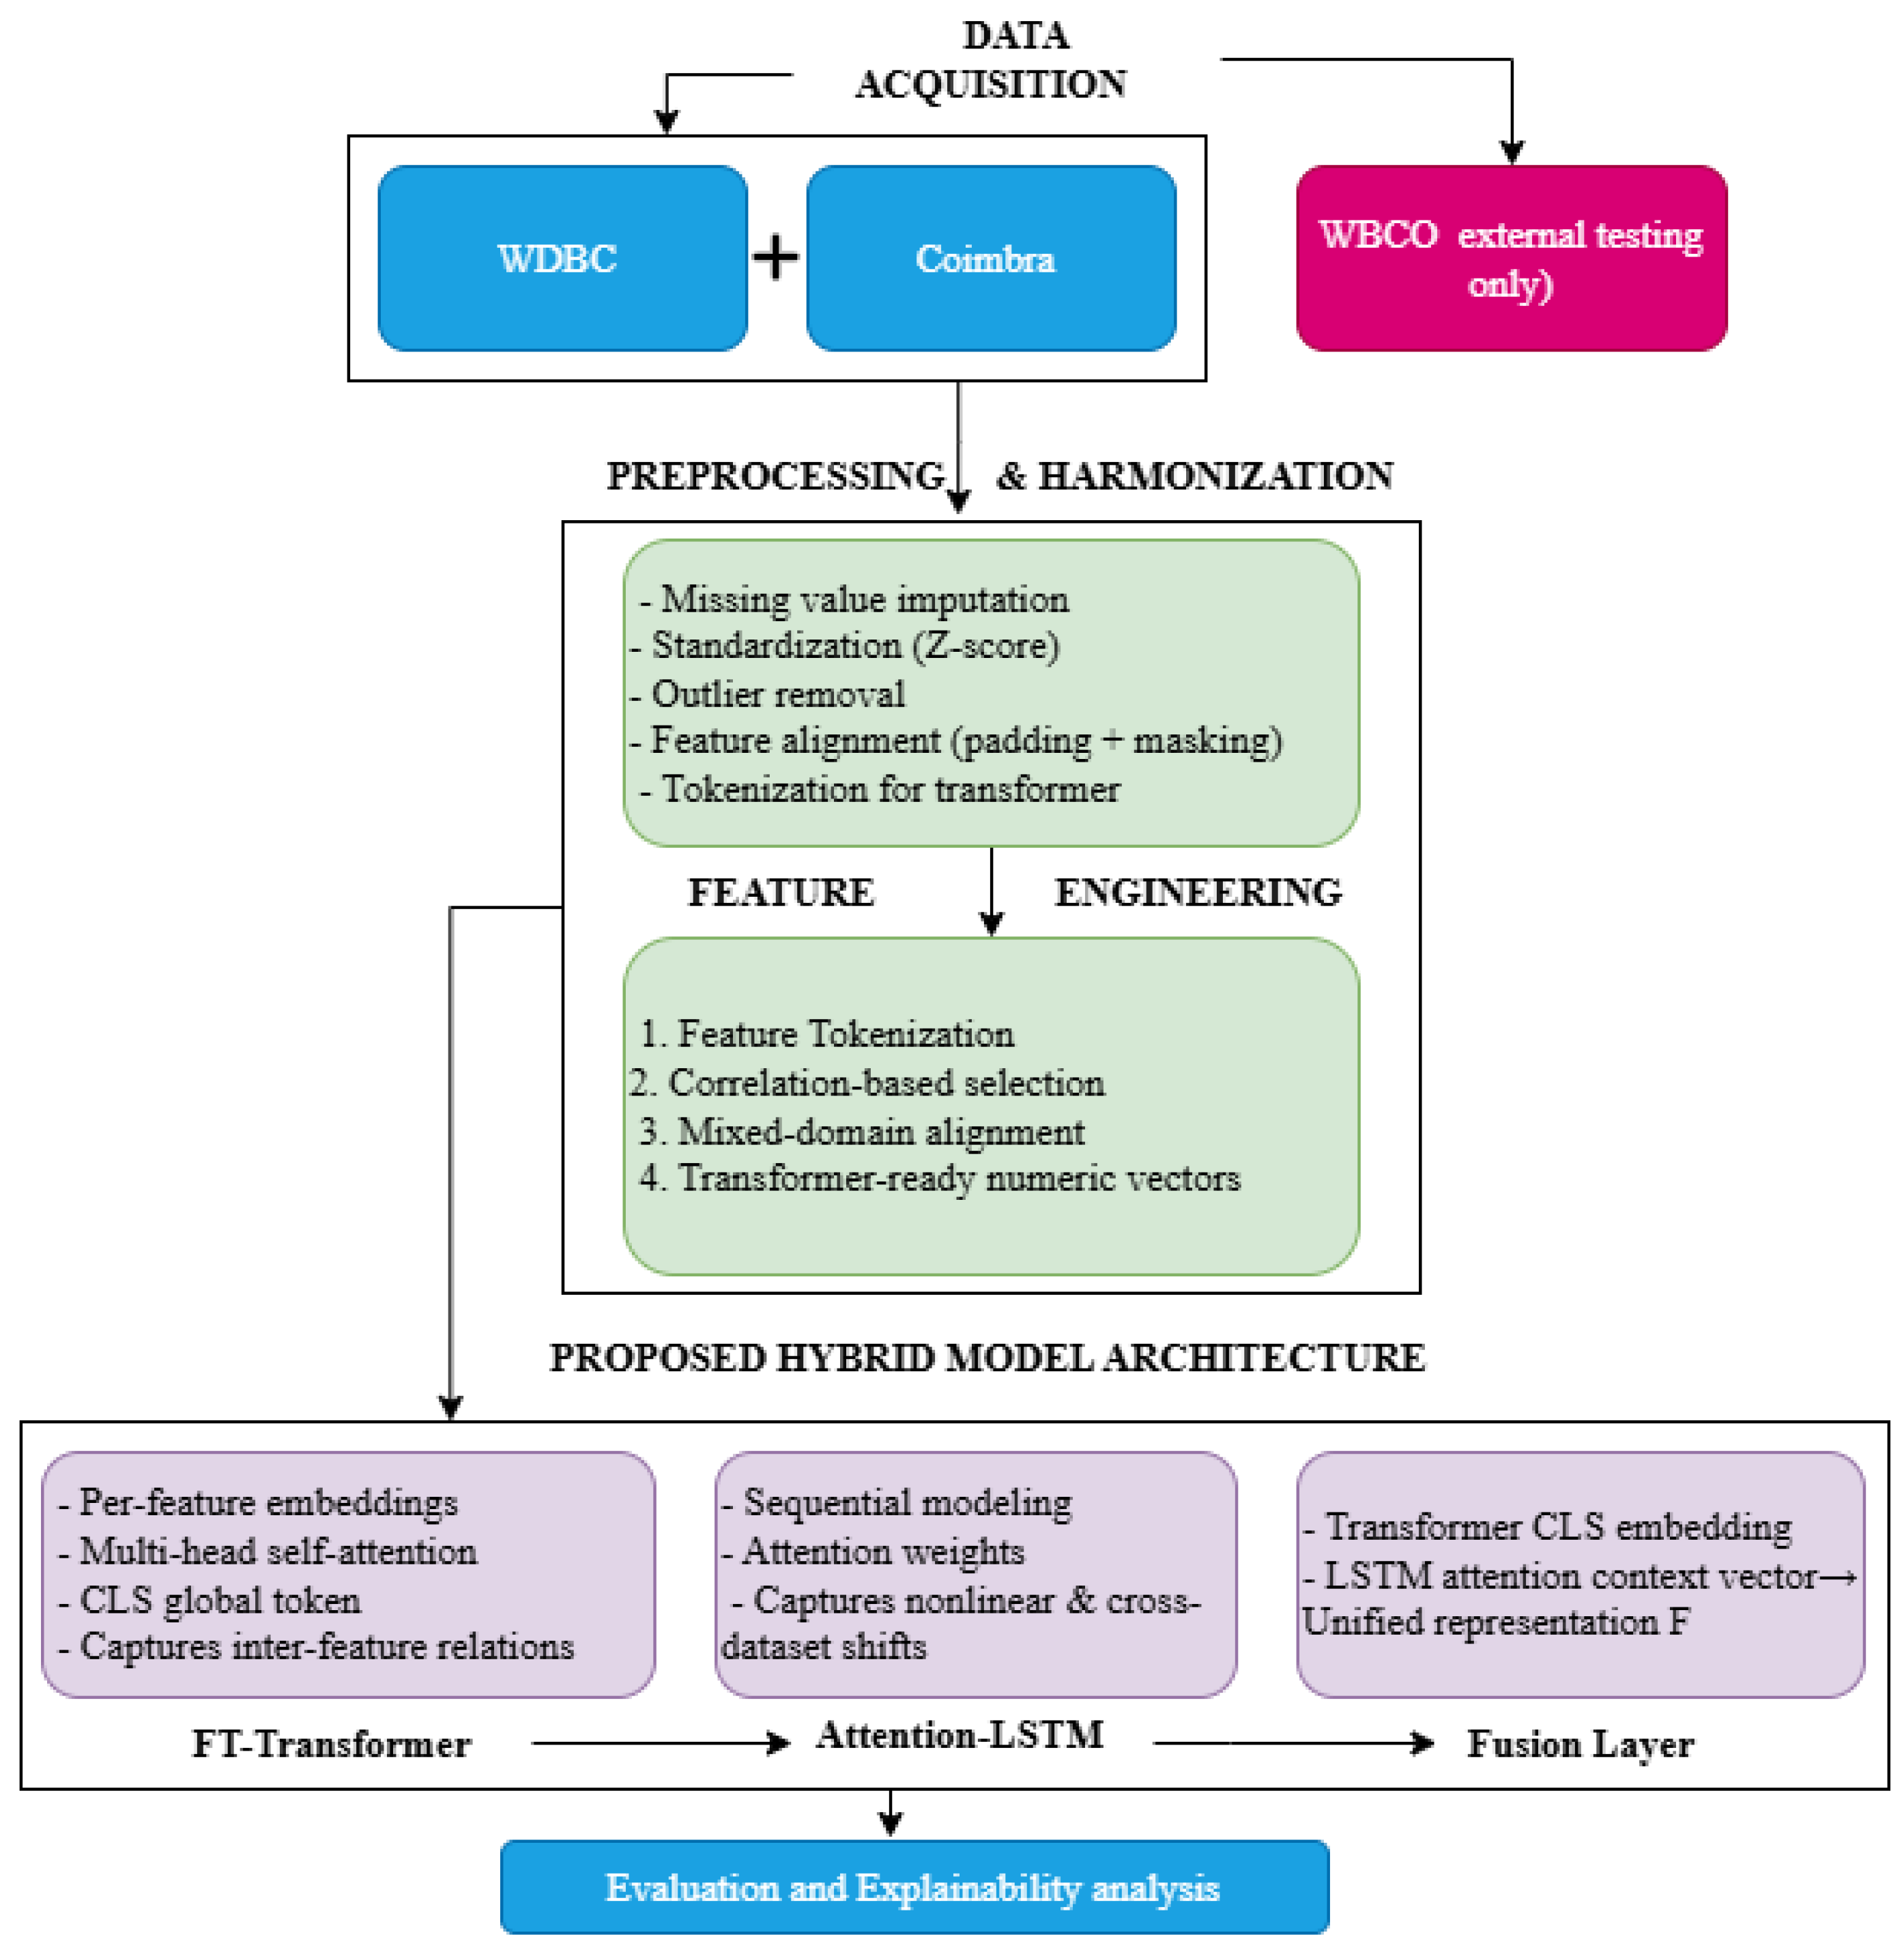
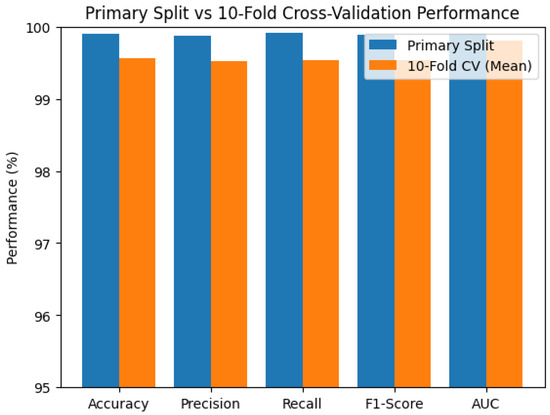
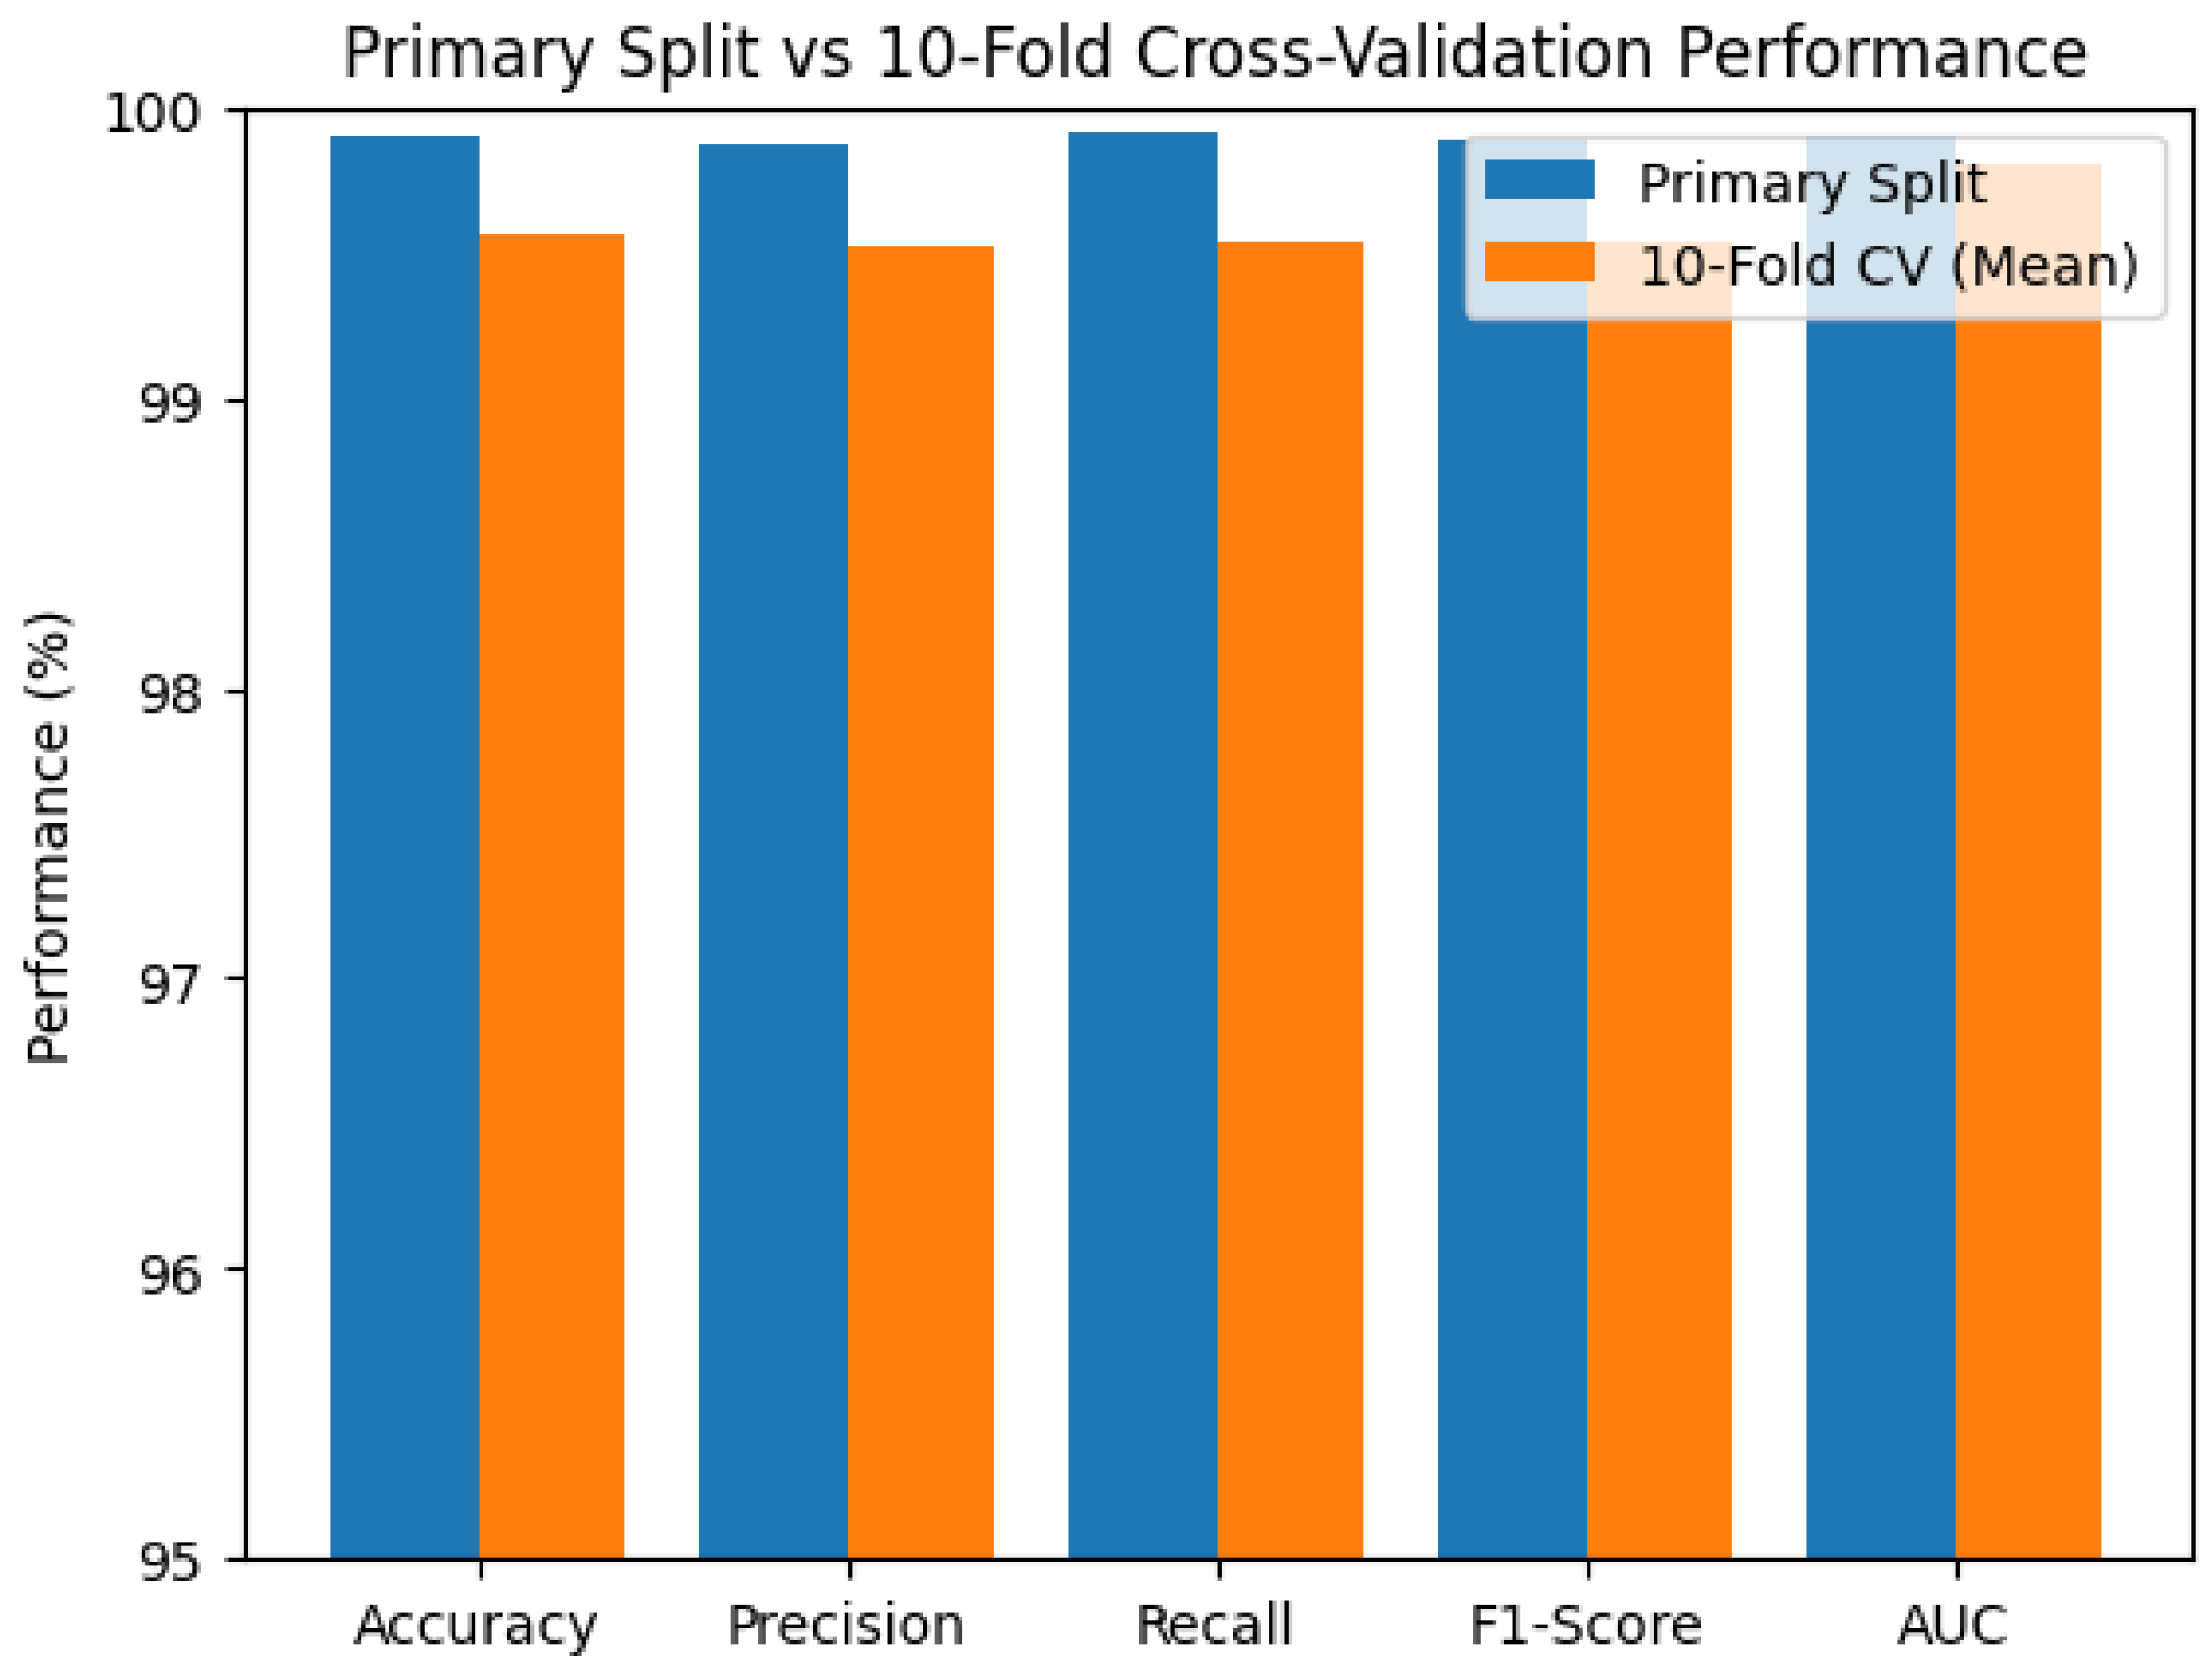
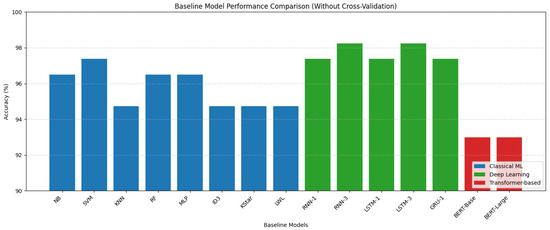
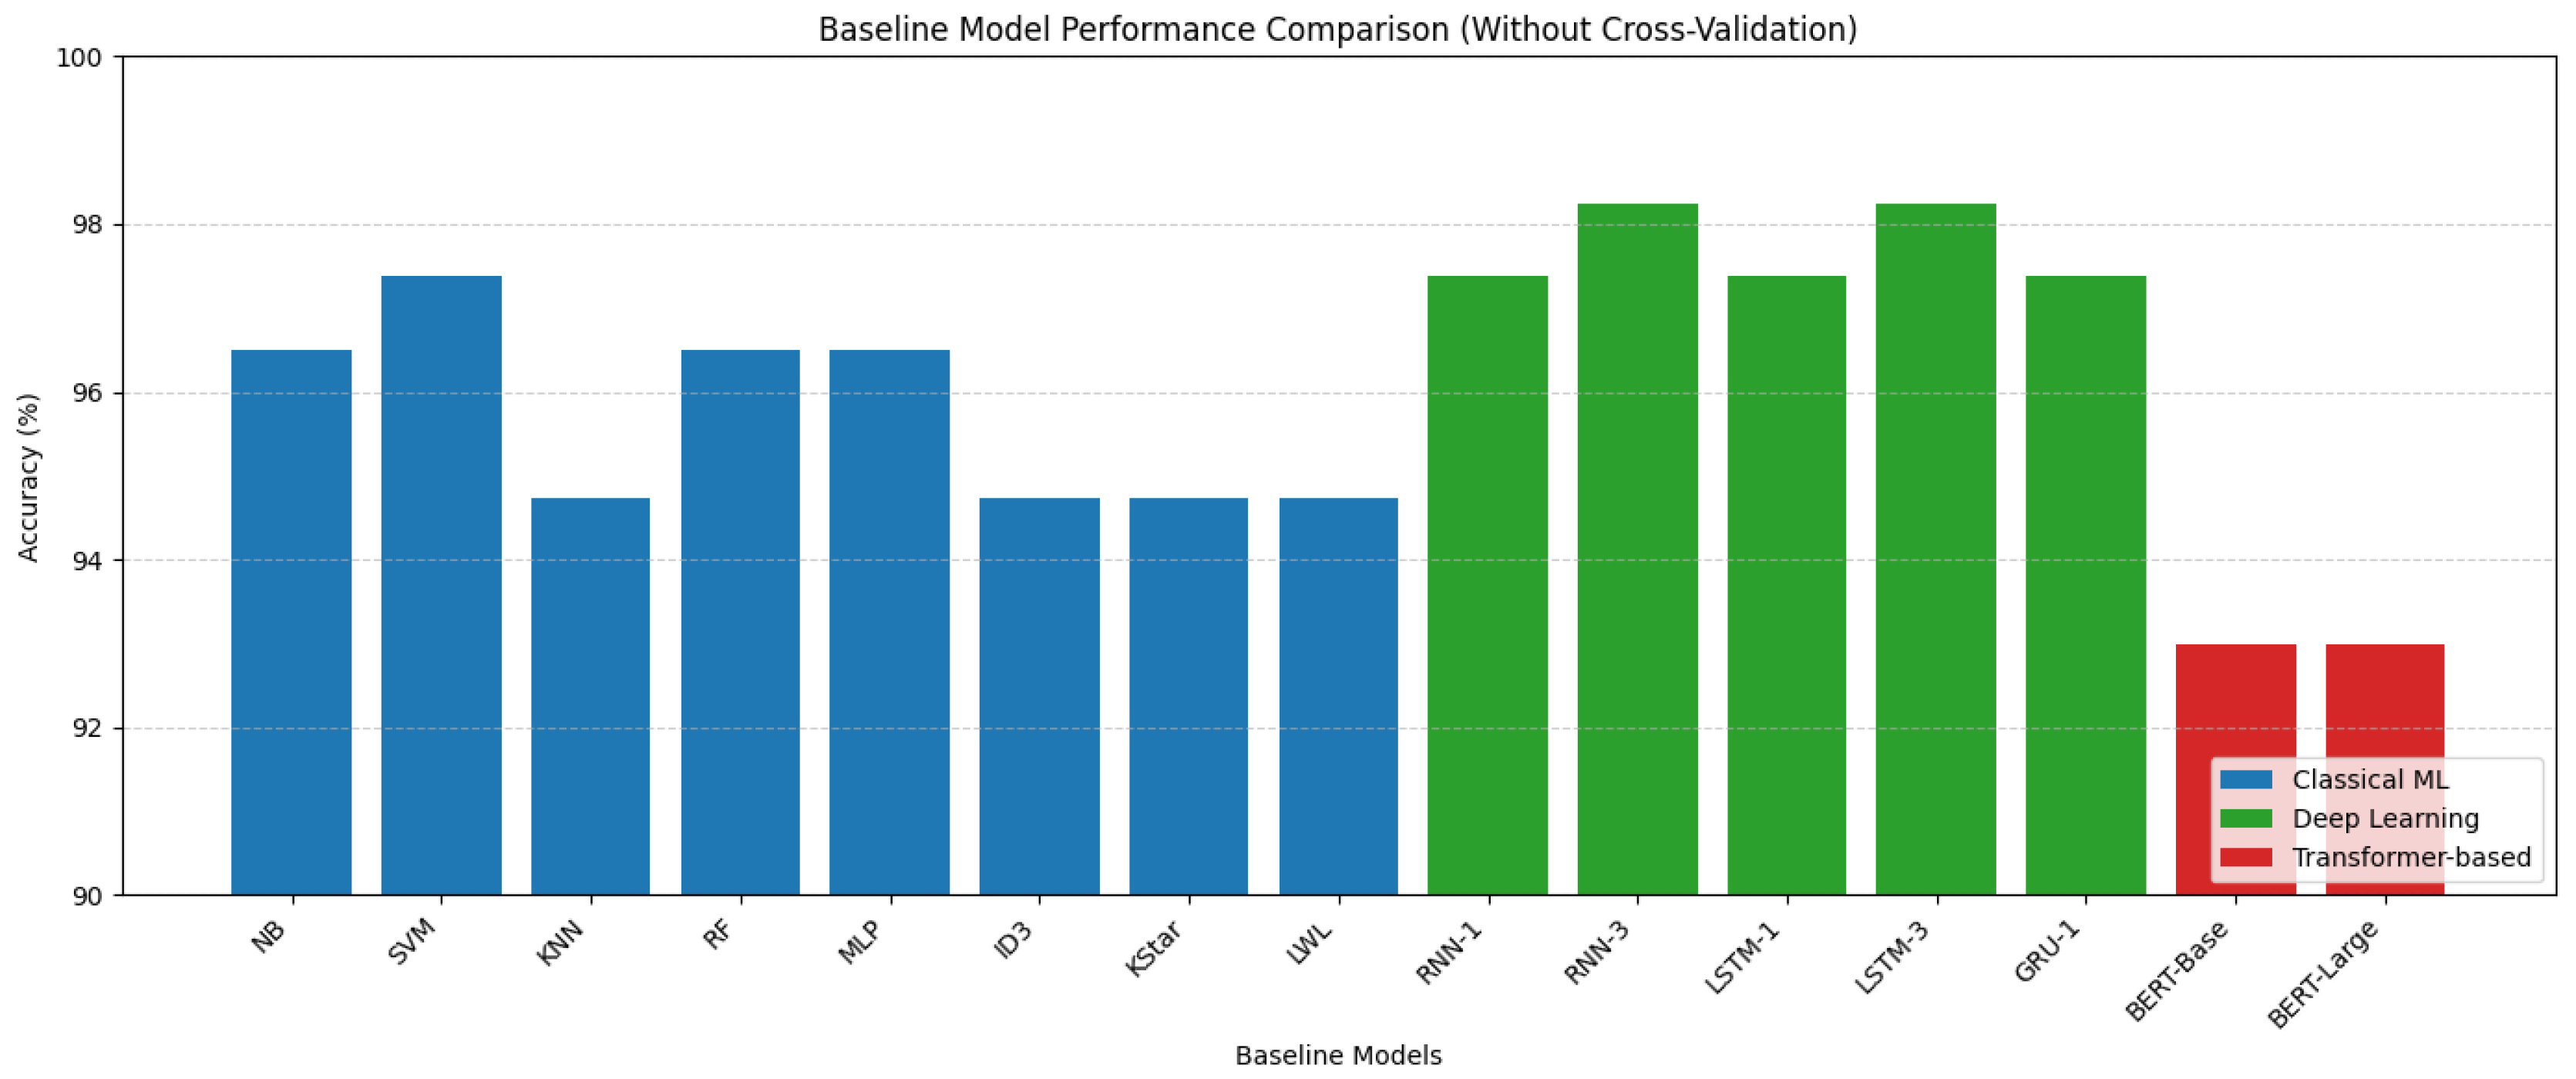
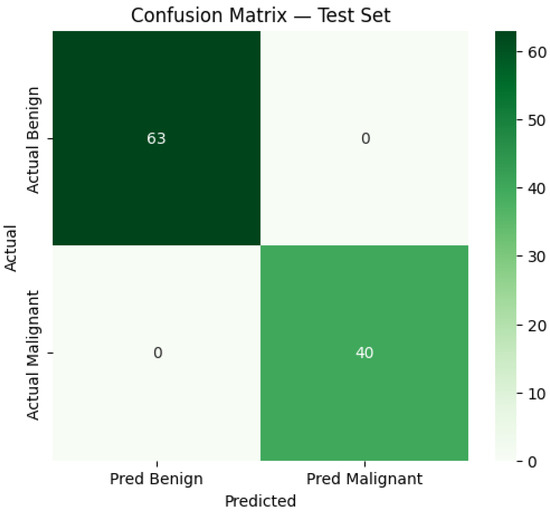
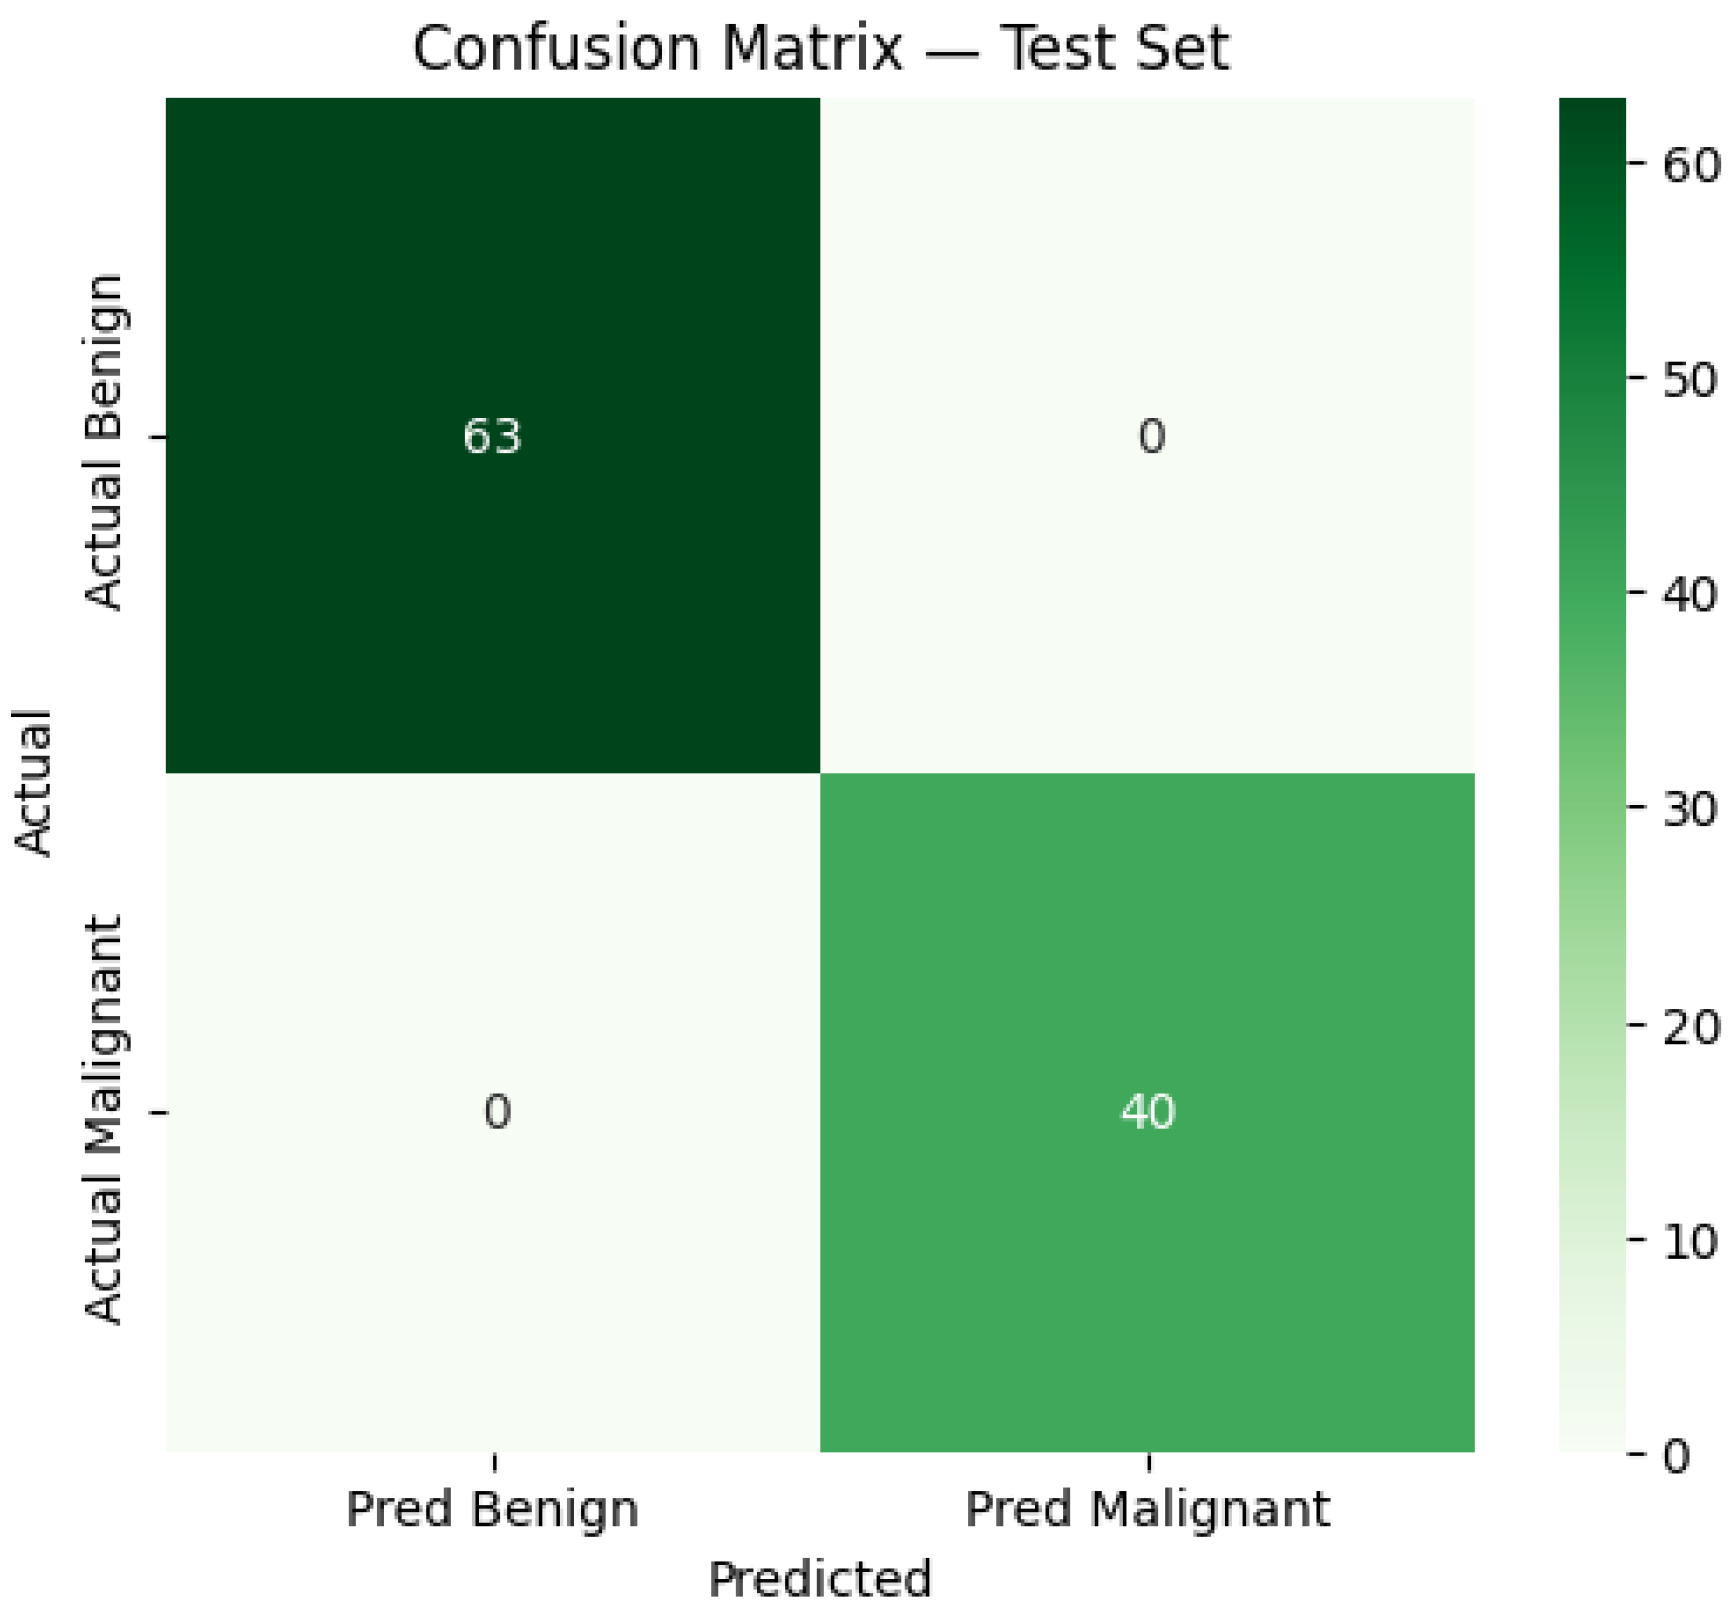
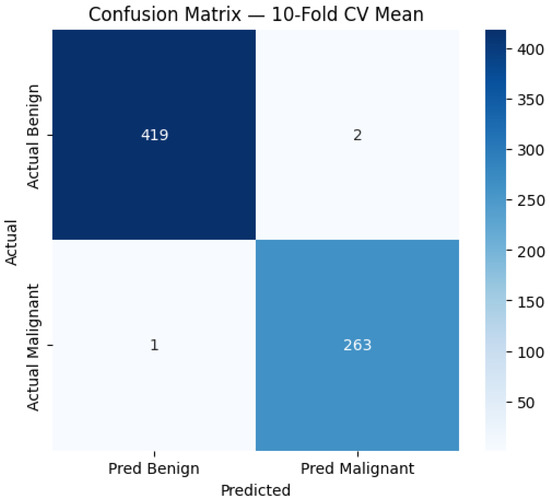
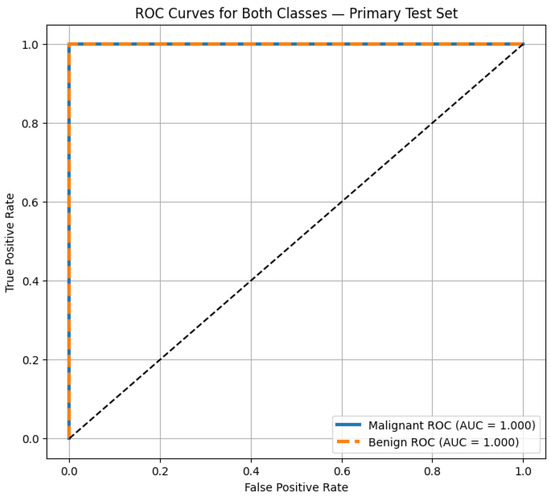
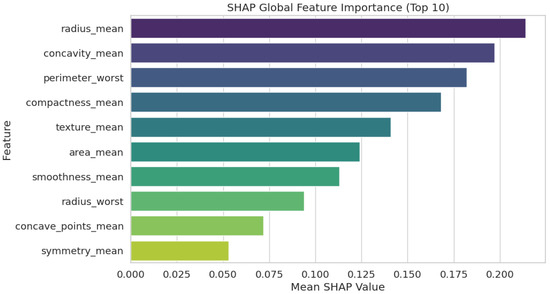
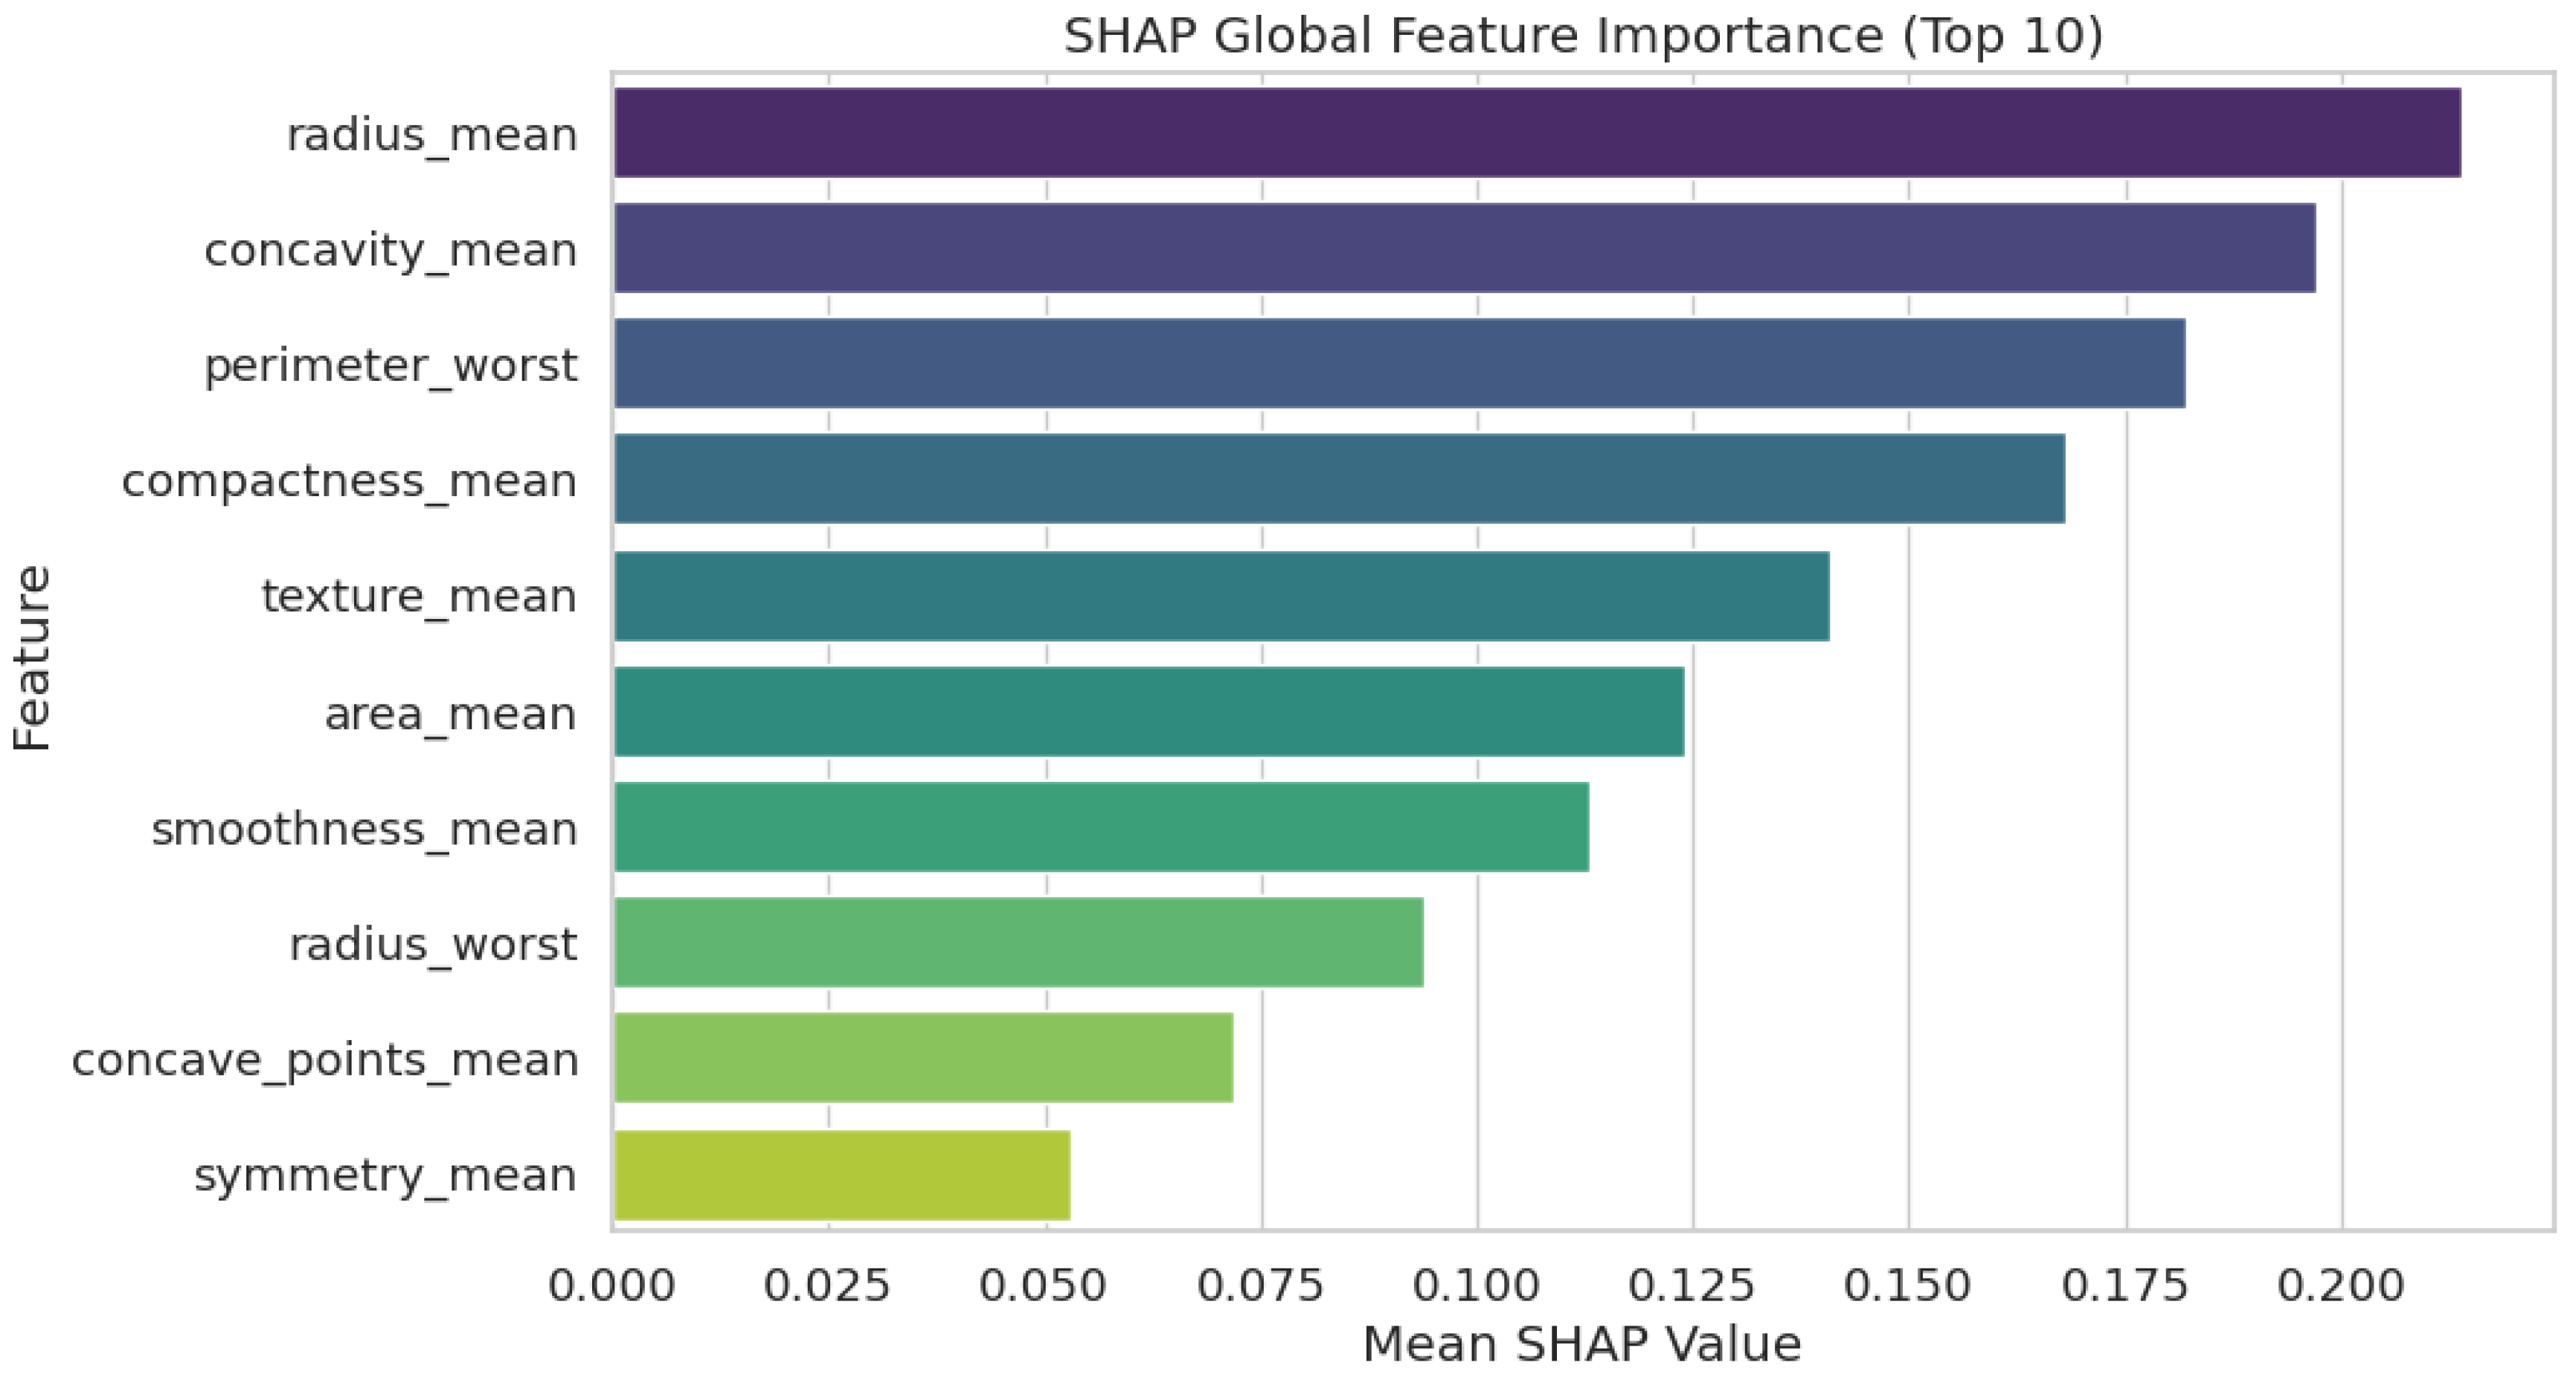
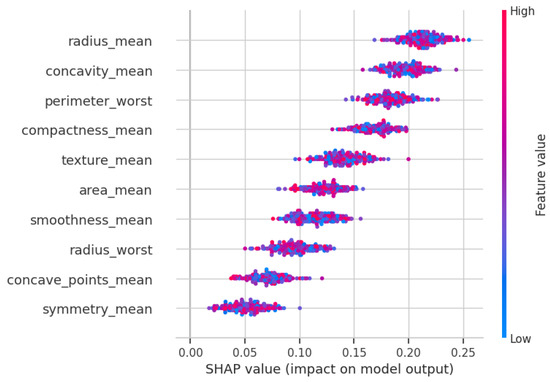
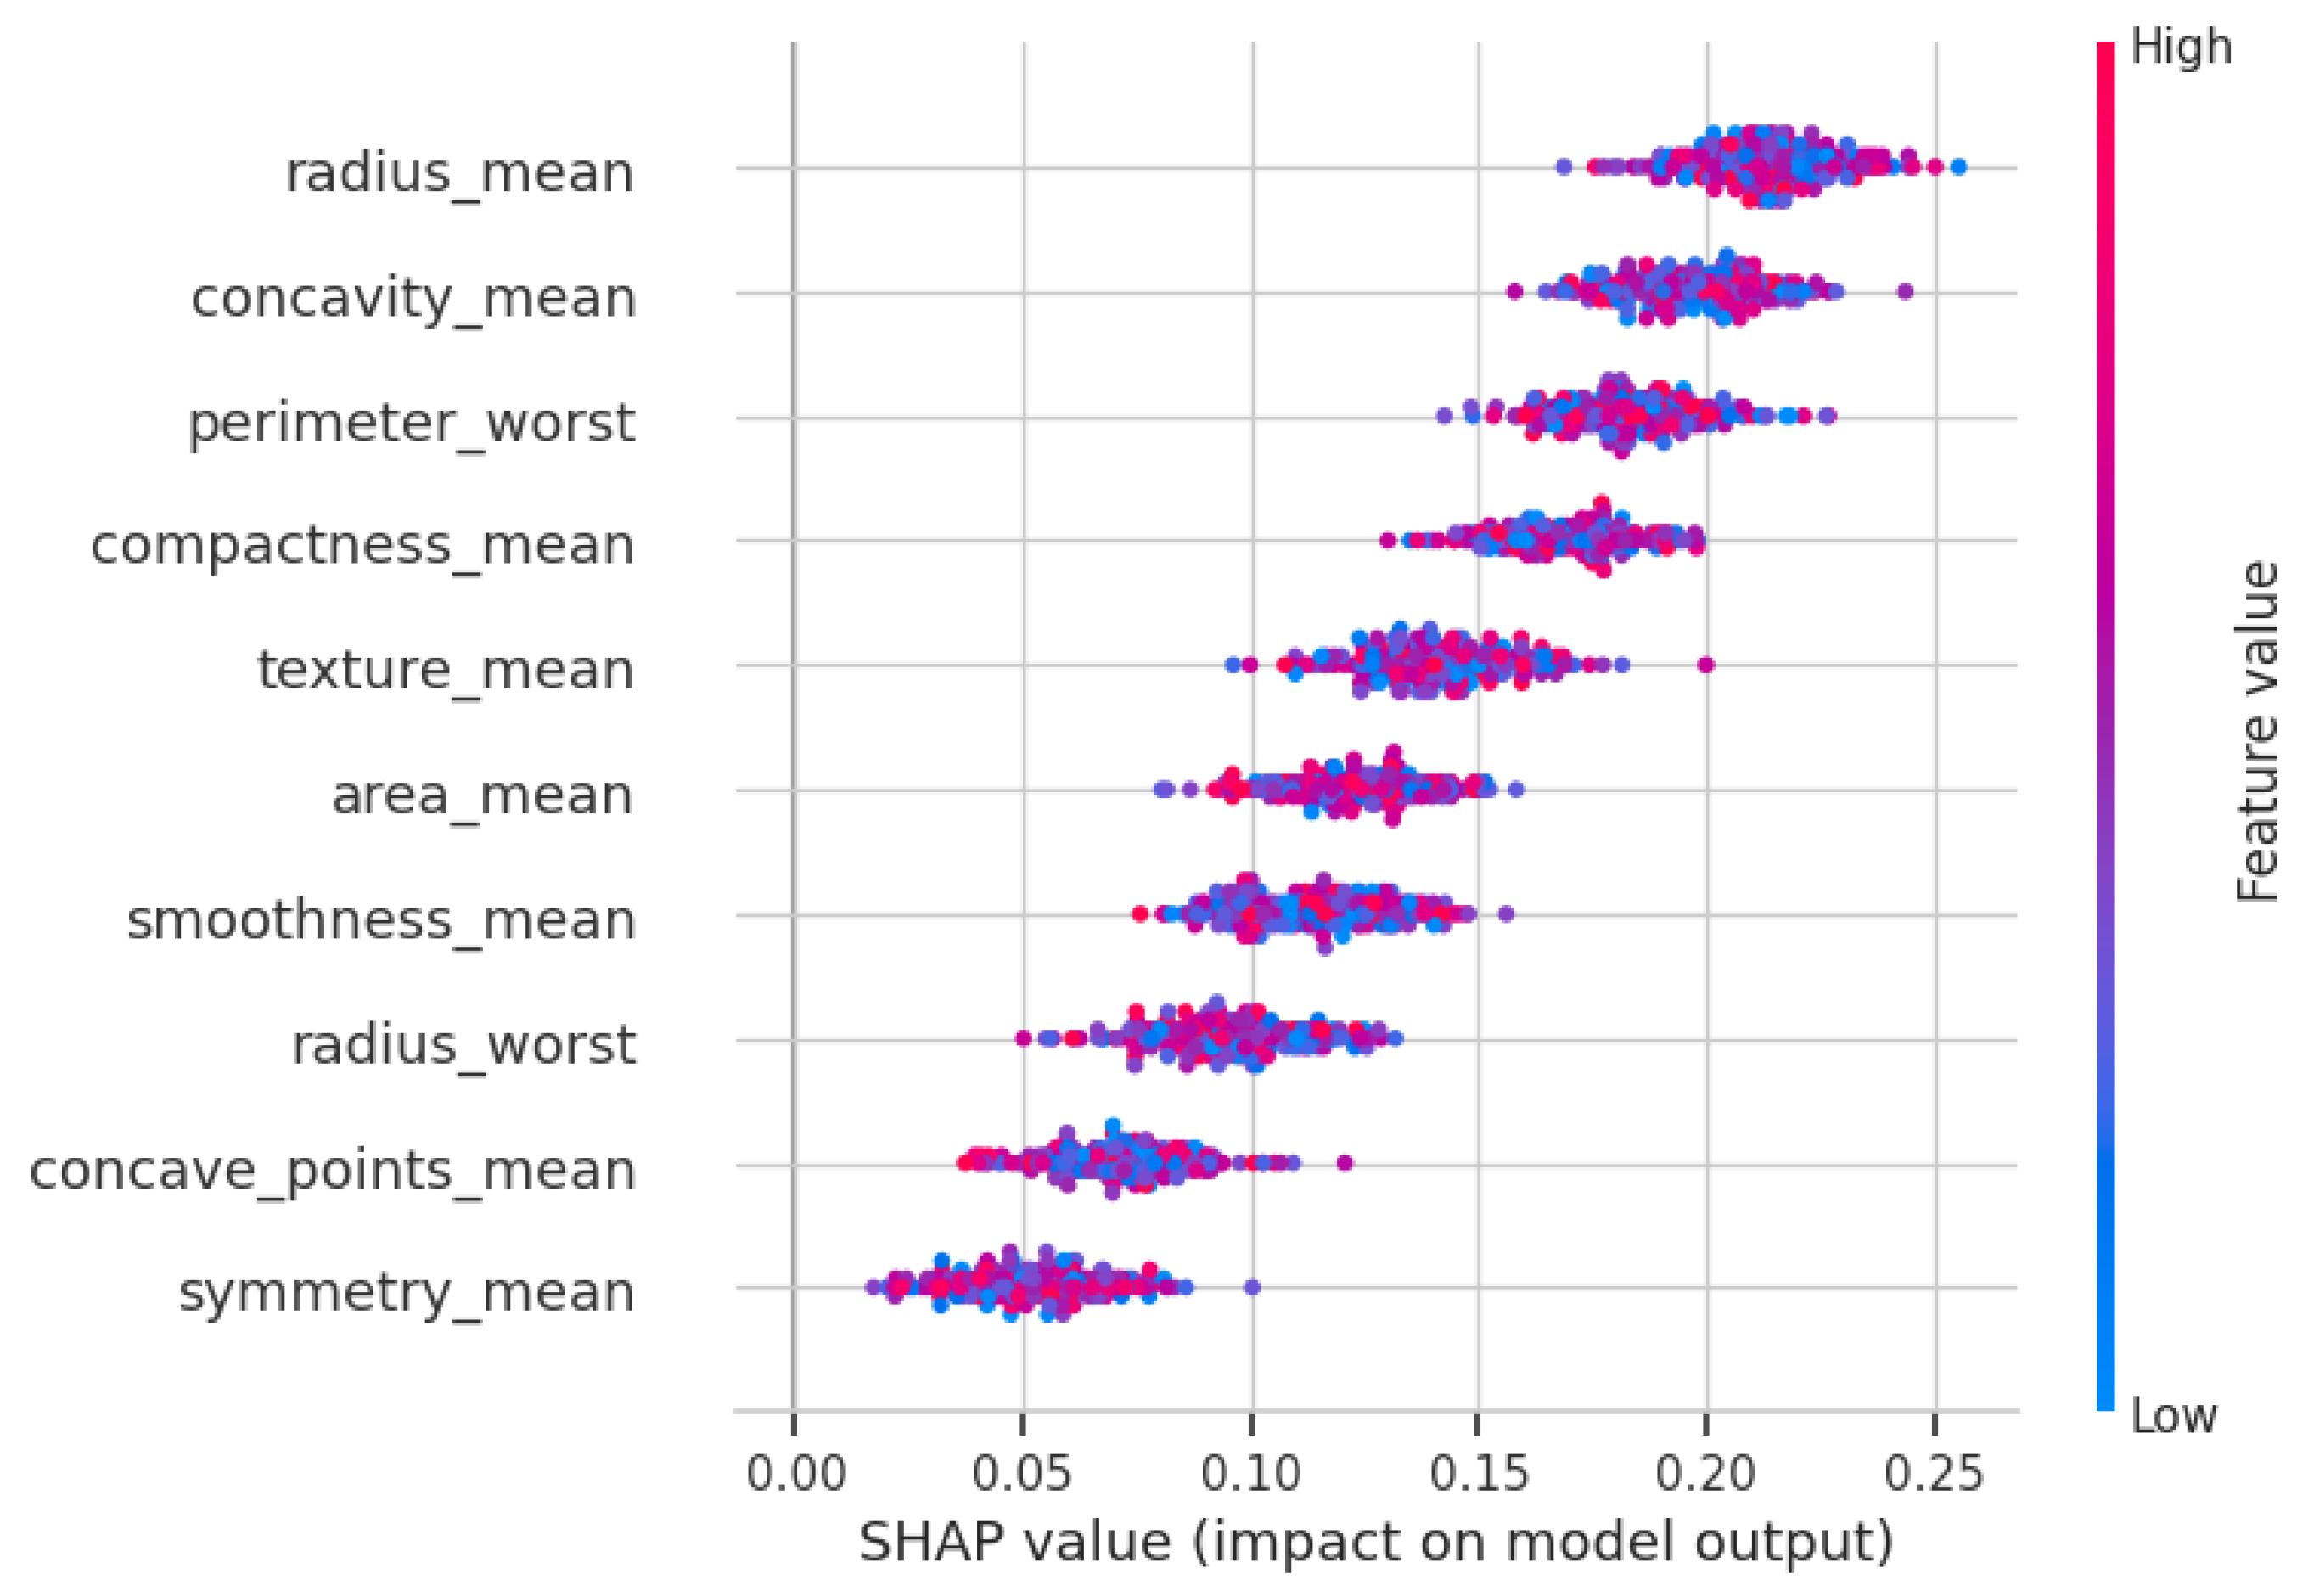
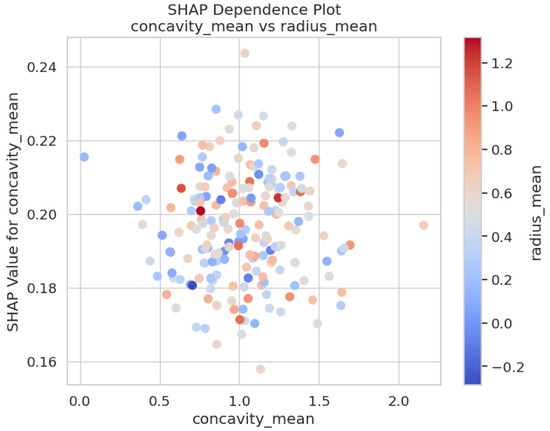
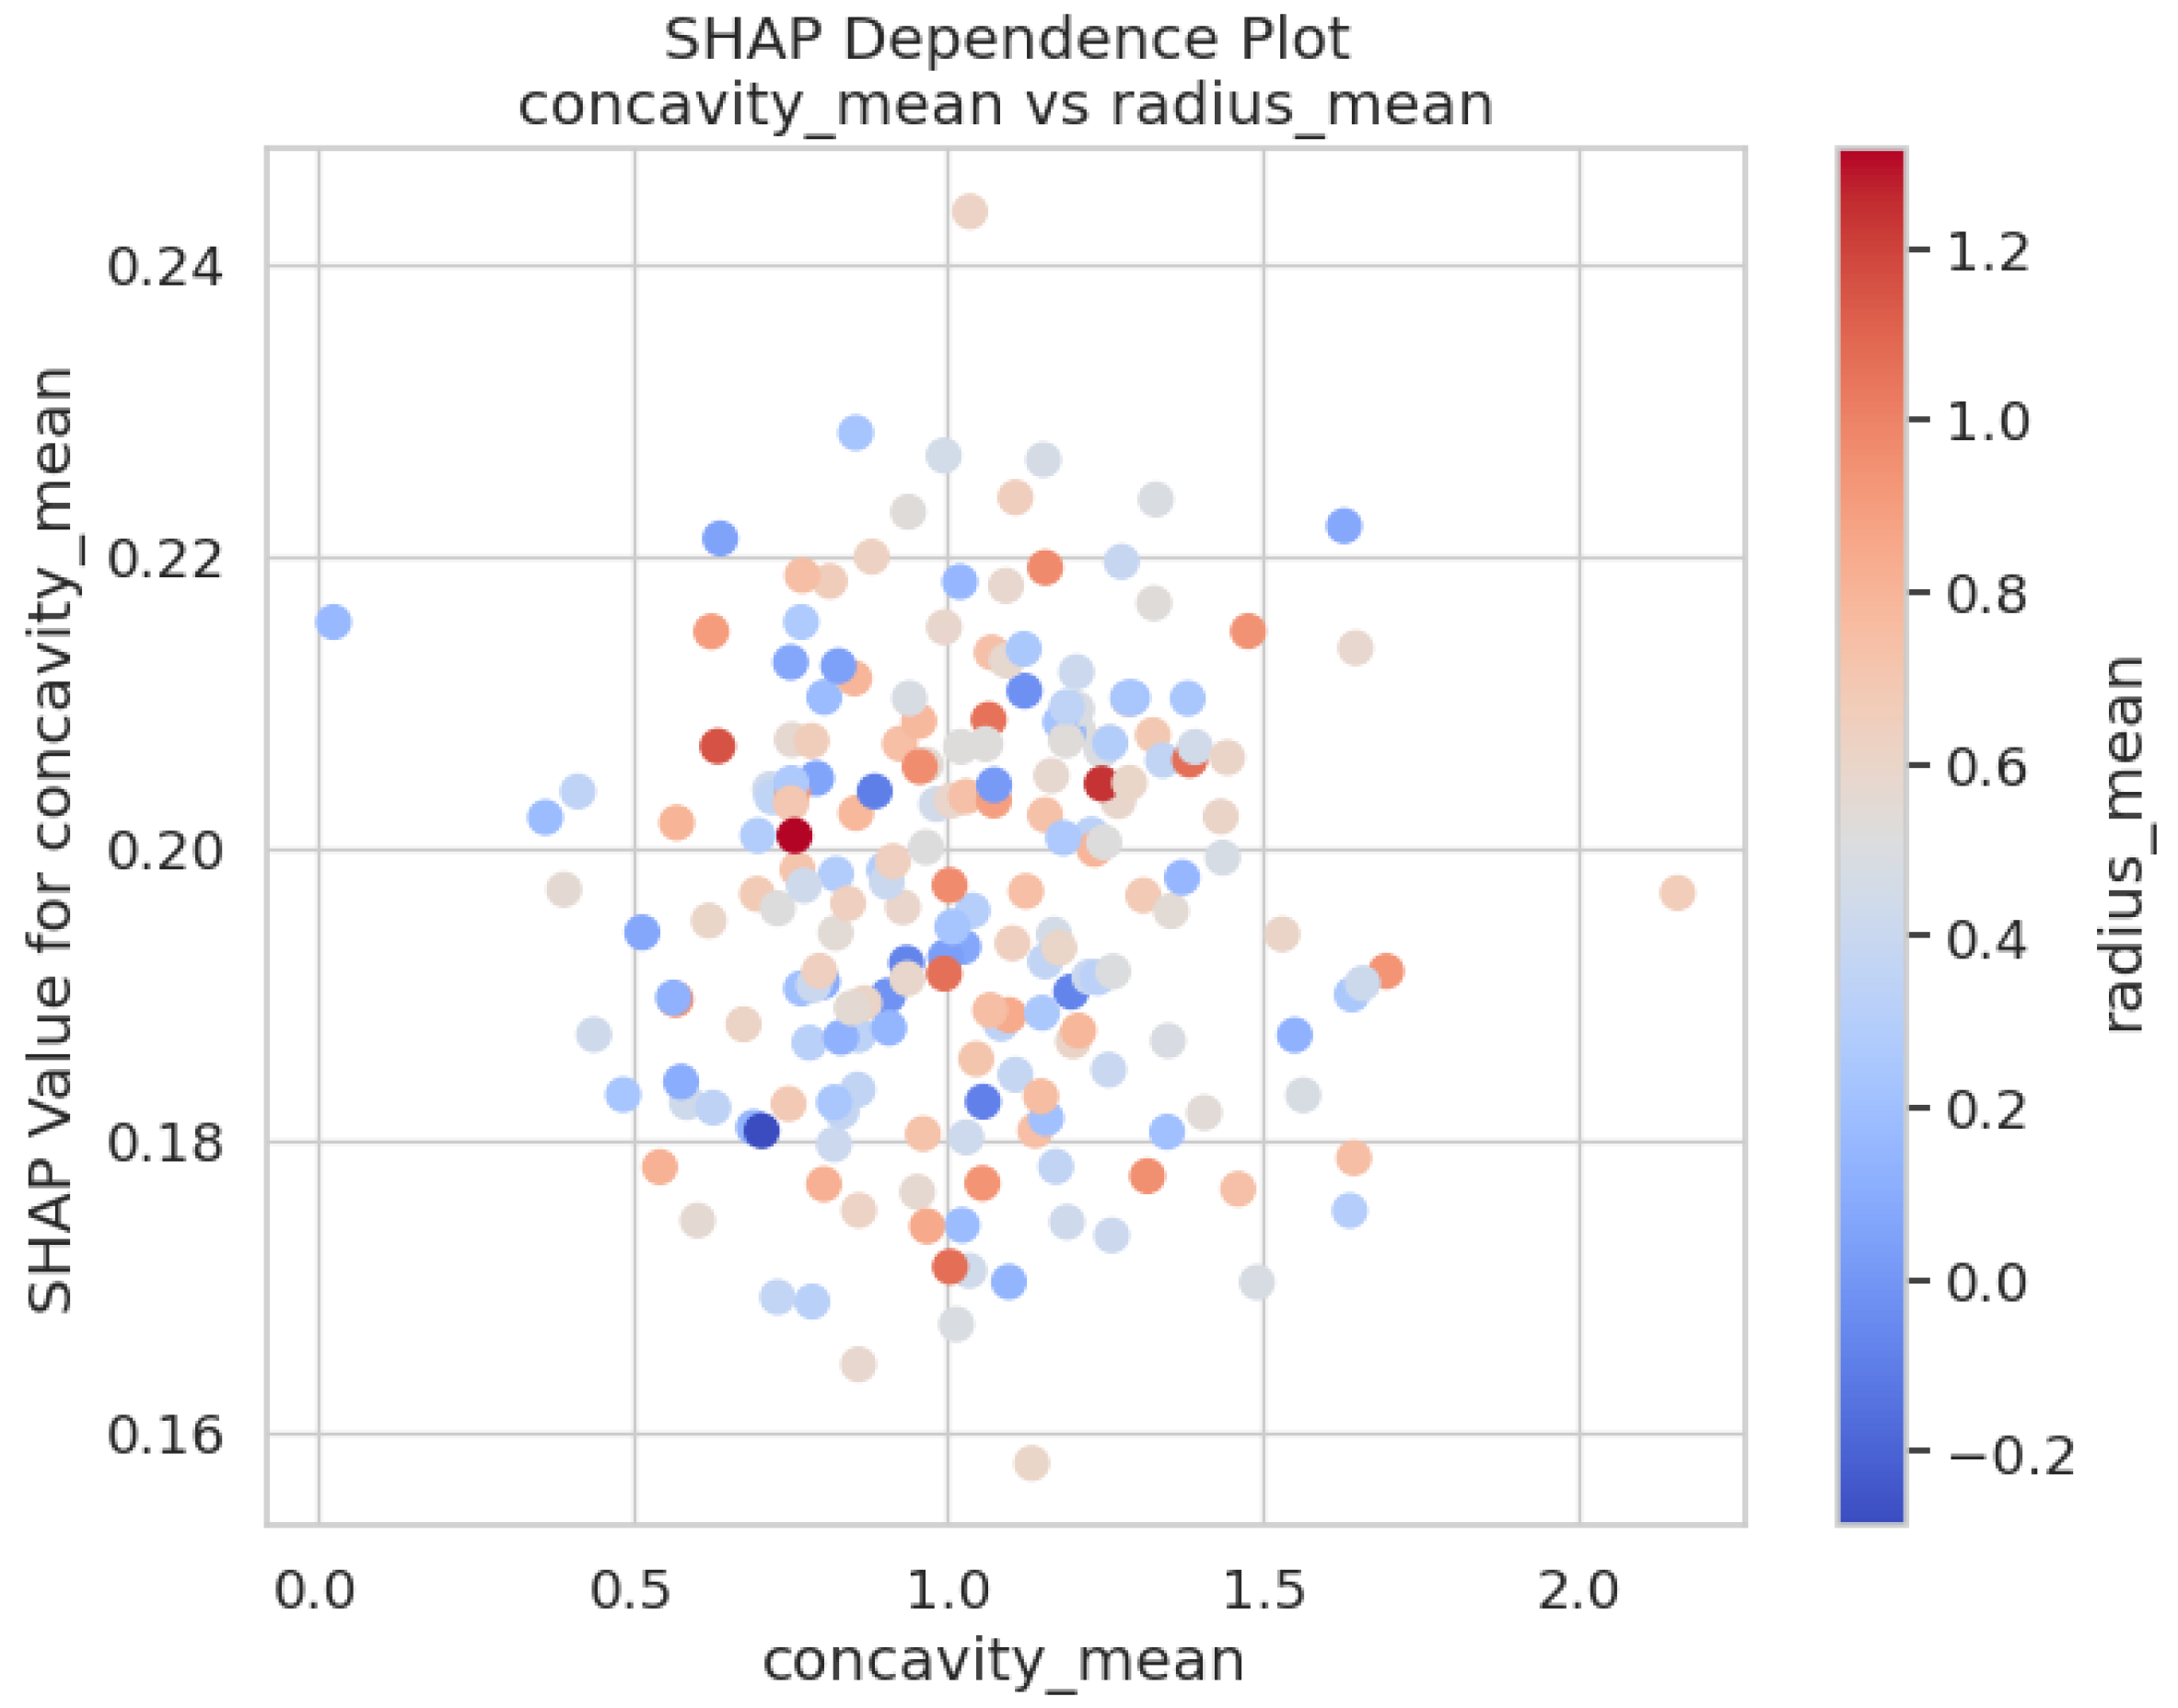
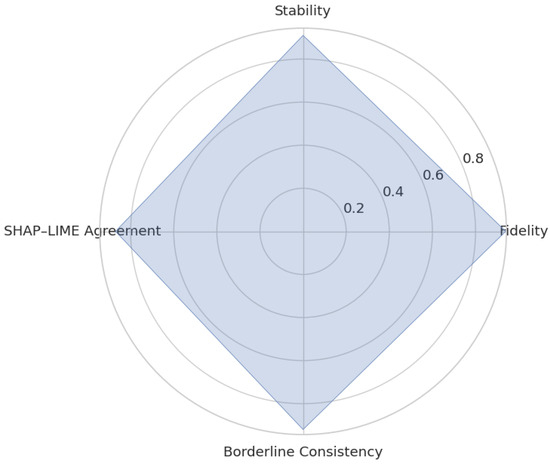
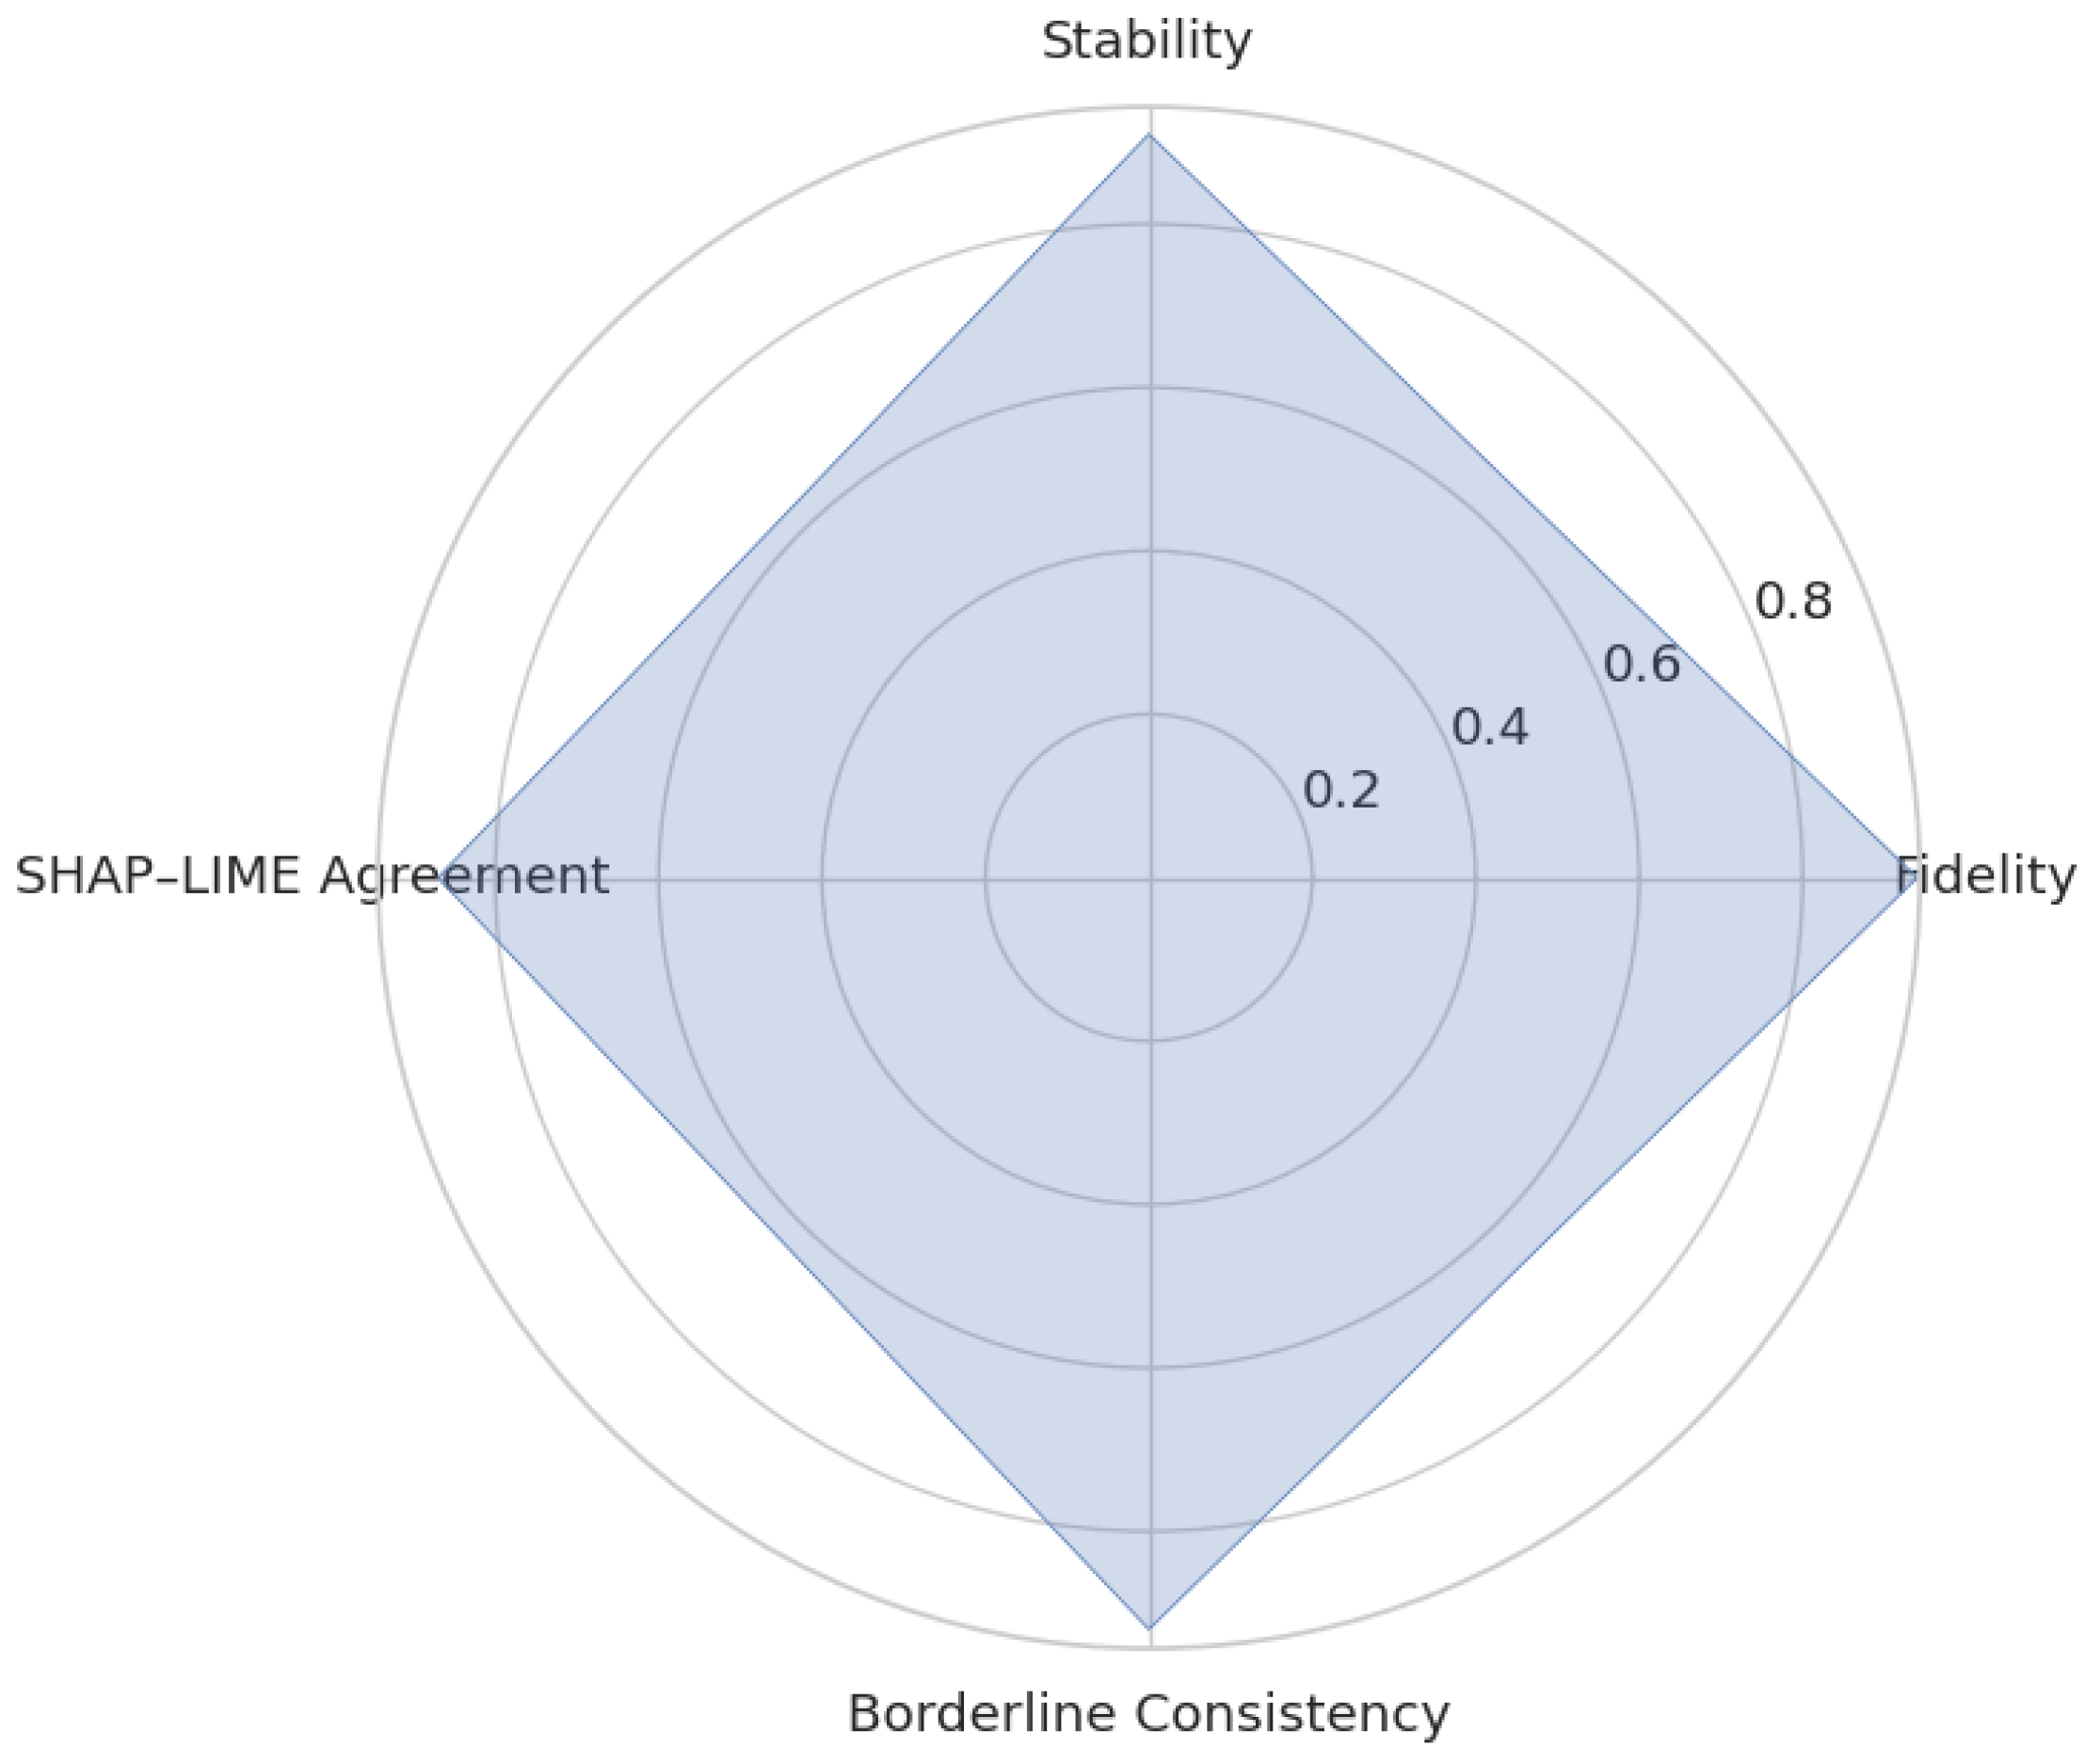
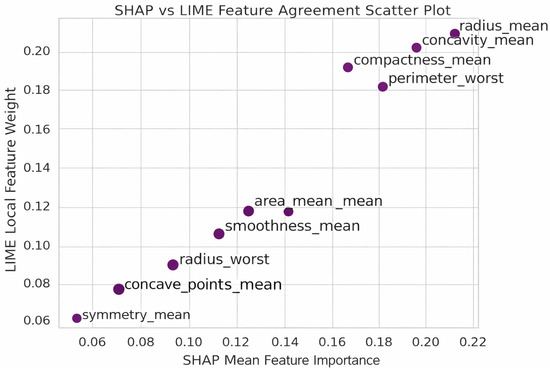
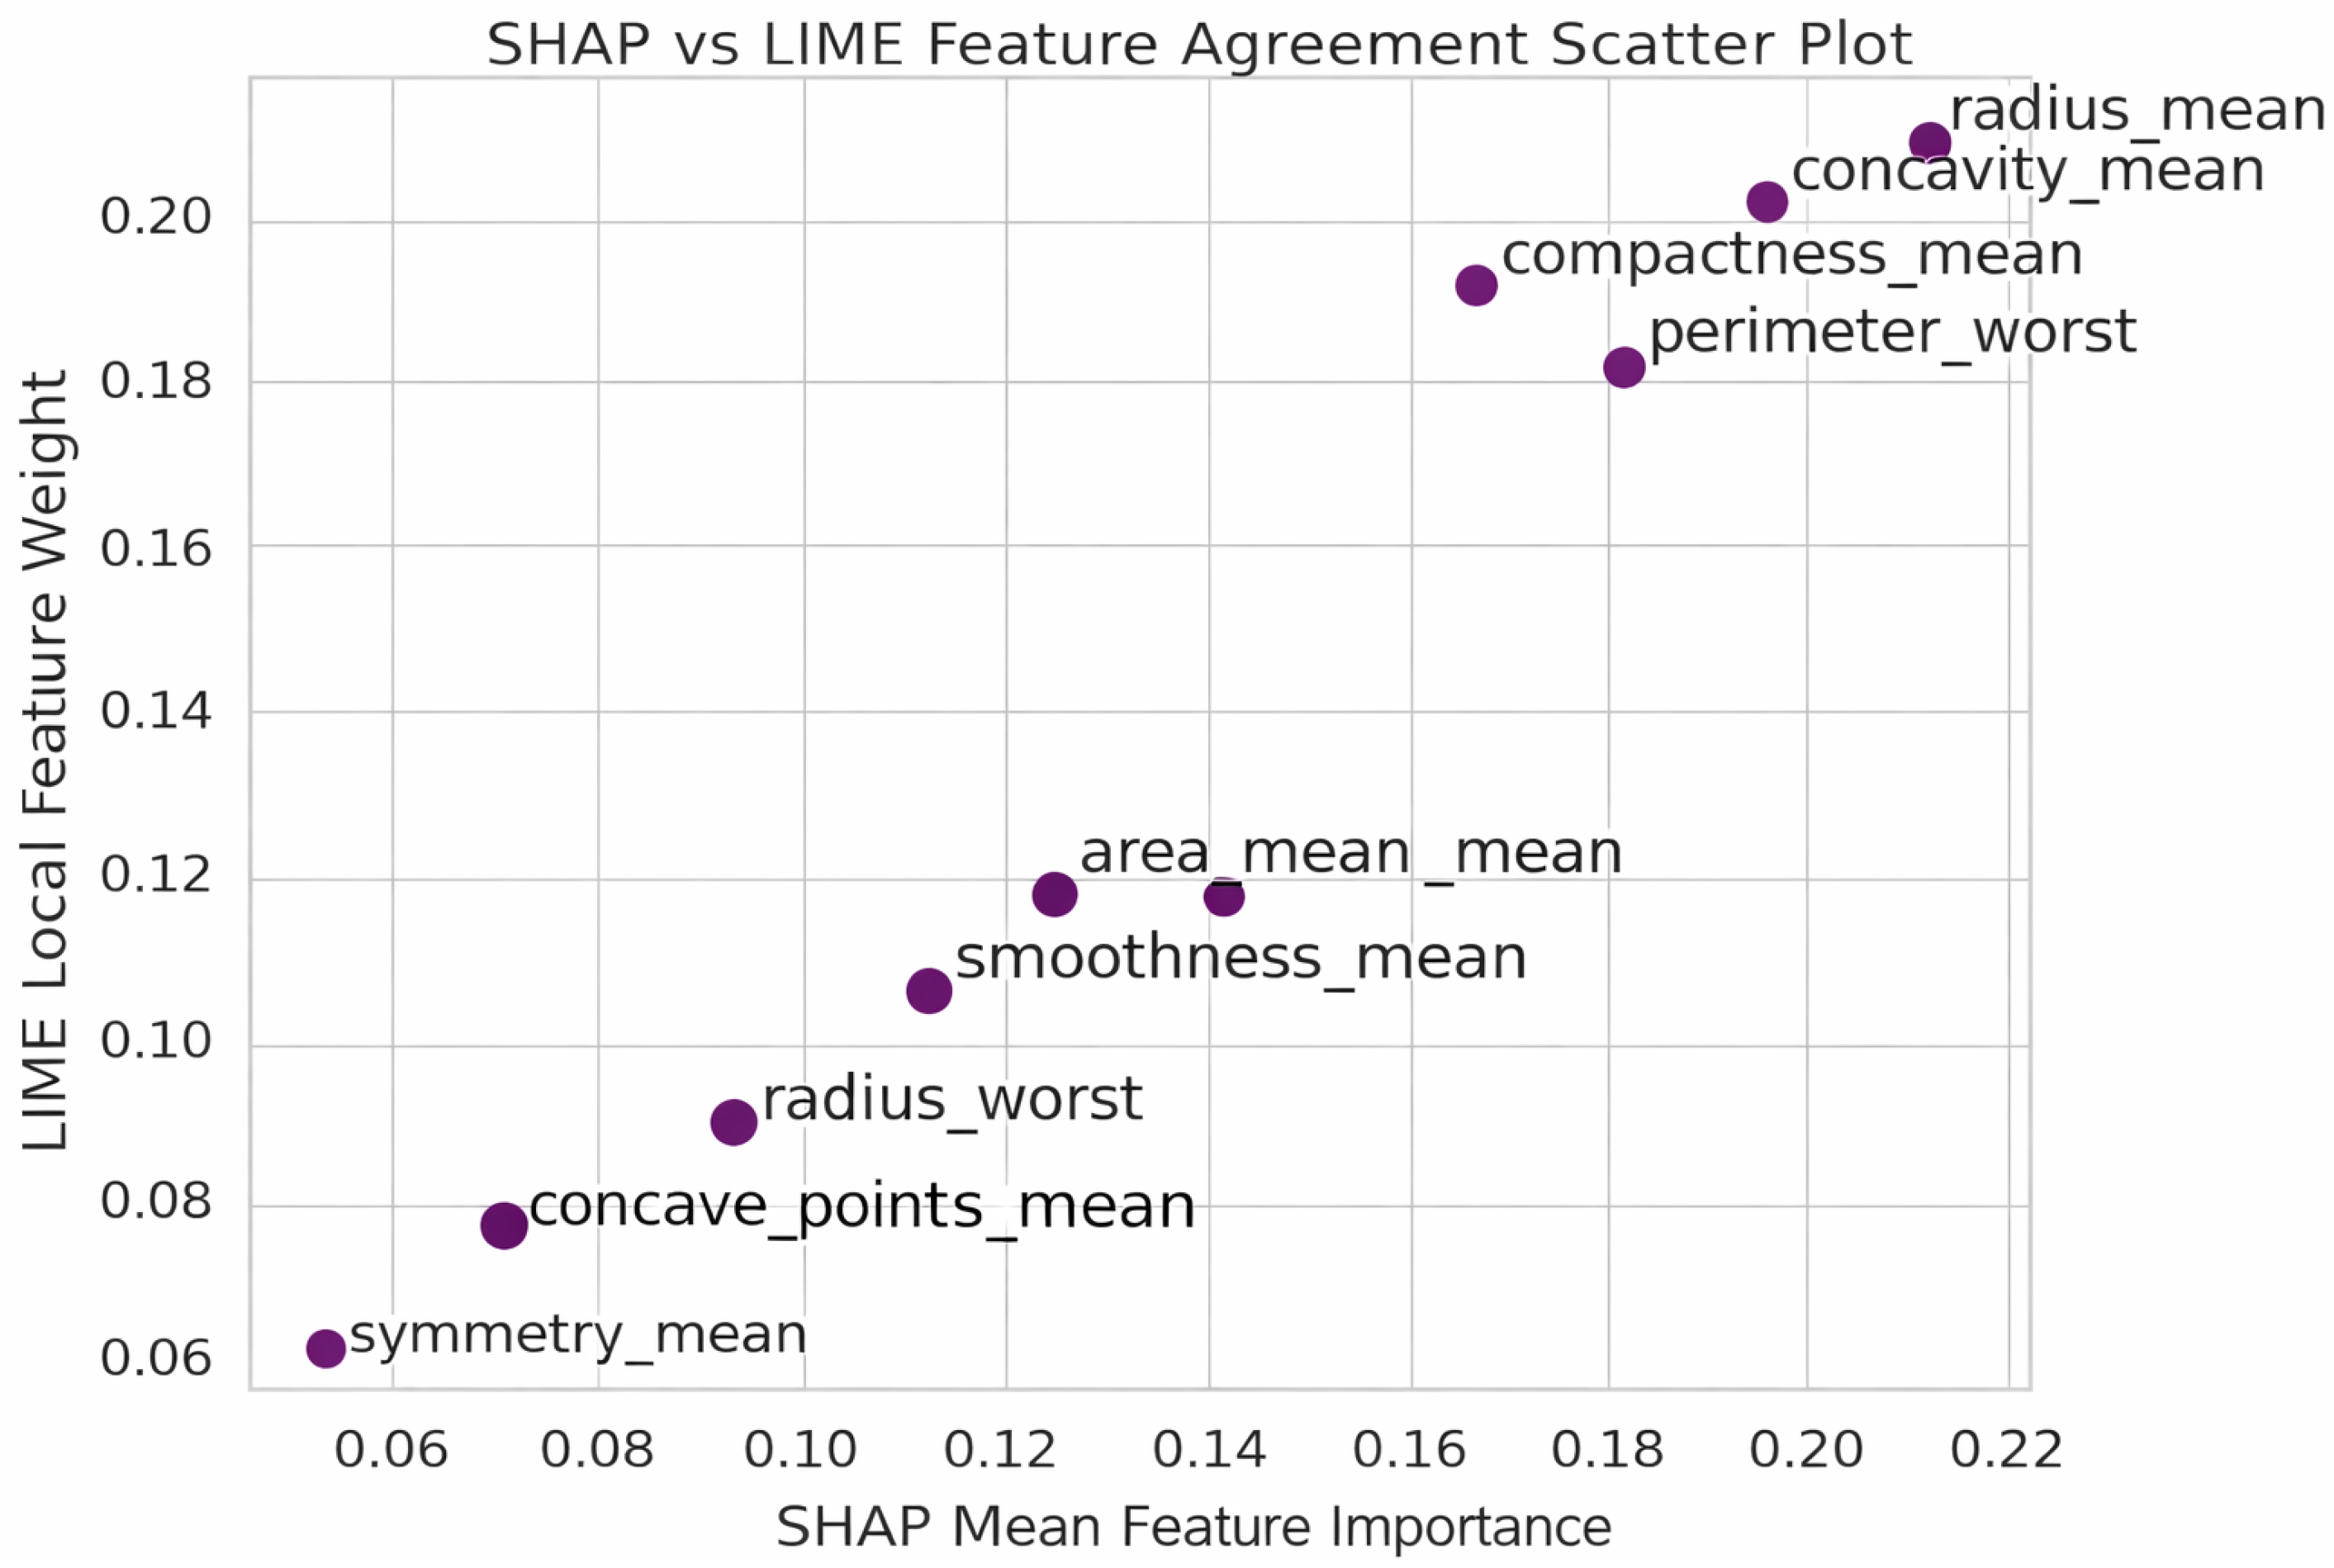

Disclaimer/Publisher’s Note: The statements, opinions and data contained in all publications are solely those of the individual author(s) and contributor(s) and not of MDPI and/or the editor(s). MDPI and/or the editor(s) disclaim responsibility for any injury to people or property resulting from any ideas, methods, instructions or products referred to in the content. |
© 2026 by the authors. Licensee MDPI, Basel, Switzerland. This article is an open access article distributed under the terms and conditions of the Creative Commons Attribution (CC BY) license.