Abstract
In recent years, the increasing complexity of production systems driven by technological development has created new opportunities in the industrial world but has also brought challenges in the practical use of these systems by operators. One of the biggest changes is data existence and its accessibility. This work proposes an IoT architecture specifically designed for real-world industrial environments. The goal is to present a system that can be effectively implemented to monitor operations and production processes in real time. This solution improves fault detection and identification, giving the operators the critical information needed to make informed decisions. The IoT architecture is implemented in two different industrial applications, demonstrating the flexibility of the architecture across various industrial contexts. It highlights how the system is monitored to reduce downtime when a fault occurs, making clear the loss in performance and the fault that causes this loss. Additionally, this approach supports human operators in a deeper understanding of their working environment, enabling them to make decisions based on real-time data.
1. Introduction
The rapid technological advancements of recent years have significantly altered the way we live, work, and communicate. Innovations in technology, thanks to Industry 4.0 and Industry 5.0, have opened up unprecedented opportunities, enhancing productivity, quality of life, and access to information. However, despite the exceptional solutions these technologies provide, they also bring about considerable challenges. Humanity has struggled to keep up with such rapid and complex changes. One prevalent concern regarding new technological developments is the fear of job automation, particularly the notion that operators may eventually be replaced by robots [1]. Moreover, there is a growing demand for advanced technical skills in the workforce [2,3]. This rapid growth creates a gap between the skills needed in today’s job market and the abilities of many workers. This skills gap needs continuous education and training to learn the high-level skills required for the new complex job tasks [4].
Industry 4.0 technologies in industrial applications are reshaping the role of the operator. The goal of Industry 4.0 is to transform isolated production cells into an optimized system, where these cells are integrated and automated, resulting in increased efficiency [5]. The term Operator 4.0 refers to an operator who is supported by automated systems that alleviate physical and mental stress in a sustainable manner [6]. This concept emphasizes the idea of operators interacting with machines in a relationship built on trust and collaboration, to empower them with the opportunities provided by Industry 4.0 [7].
Industry 5.0 aims to overcome the limitations of Industry 4.0, integrating the new society and the concept of Operator 5.0 [8]. Industry 5.0 vision is to obtain a system which is flexible and resilient, enabled by the use of adaptable and flexible technologies [9]. The focus of Industry 5.0 extends beyond technological advancements, as seen in Industry 4.0, to emphasize human centrality [10]. In this perspective, the operator evolves from being a technology-assisted operator, as Operator 4.0, to the Resilient Operator 5.0, which emphasizes human resilience, including health and safety, and system resilience, which involves the dynamic exchange of control between the operator and the machine to ensure the system’s continuous operation [11].
Many operators in different industries face challenges in keeping up with the rapid advancement of technology. They may not be familiar with the complex systems, software, or tools being introduced, which makes it hard for them to adapt quickly. As new technologies are integrated into the workplace, these operators often lack the technical skills and knowledge required to use them effectively [12].
The scientific gap that this paper aims to fill is in supporting non-expert operators in complex industrial systems, where both a high level of knowledge and technical skills are required, and to support them with the rapid spread of new technologies. For this reason, this paper presents an IoT architecture designed for implementation in real-world industrial settings, illustrating how it can assist operators in system analysis, management, and fault response. The primary objective of this work is to provide operators with a tool that enhances their ability to work autonomously while maximizing the benefits of technological advancements, especially in the area of data collection. Two use cases are examined to validate the proposed IoT architecture. The first case involves implementing the architecture with Automatic Guided Vehicles (AGVs), while the second applies it to a collaborative robotic cell. In both cases, potential faults are identified and prevented from occurring.
The paper structure is reported here: in Section 2, the state of the art of IoT technology is presented, while Section 3 describes maintenance strategies, fault analysis and monitoring system technologies. The proposed IoT architecture is reported in Section 4, while the first use case is described in Section 5, and the second in Section 6. The conclusions are given in Section 7.
2. Internet of Things
The term IoT indicates a network of physical objects that are embedded with software, hardware, sensors, and other components. These elements do not need to be identical devices, allowing for the connection of various types of “things” [13]. IoT enables connectivity and allows objects to collect data [14], connecting physical and digital spheres, particularly in modern production lines. With IoT, a physical device is assigned a unique digital ID within the network, enabling device recognition [15]. Normally, developing an IoT application requires the integration of various technologies, such as Wireless Sensor Networks, Radio Frequency Identification (RFID), and Machine-to-Machine (M2M) communication [16].
IoT can be applied in both industrial and non-industrial settings. When implemented in industrial environments, it is referred to as Industrial IoT (IIoT). The main benefit of adopting IIoT is the enhancement of efficiency and productivity, enabling the smart, remote management of systems [17]. Another advantage of IoT technologies is their ability to facilitate the easy management of reconfigurations and interoperability through software, all while maintaining the stringent requirements of many industrial systems [18].
In Suresh, 2014 [19], five wireless communication standards are described as the ones mainly adopted to implement an IoT system. Those technologies are as follows:
- RFID: RFID technology involves attaching a tag to each object, allowing it to be automatically identified and tracked using radio waves [20]. The system is cost effective, requiring only RFID tags, readers, signal processing, and an IT infrastructure. RFID is primarily used in manufacturing enterprise operations [15].
- Bar Code and QR Code: A bar code is a simple symbol placed on objects, readable by a scanner, and widely used due to its ease of implementation. A QR code is a 2D version of a bar code that encodes information in a grid of black and white squares [21]. A phone camera can read the QR code to retrieve information about the object.
- Wi-Fi: Wi-Fi enables wireless internet access using radio waves, offering high-speed data transfer for activities like video streaming, gaming, and file downloads. It supports multiple devices simultaneously. However, Wi-Fi can be power intensive and may not be ideal for battery-powered IoT devices such as sensors or wearables.
- ZigBee: ZigBee is based on the IEEE 802.15.4–2003 WPAN standard [22] and is known for its low power consumption, as its devices are designed for energy efficiency. It is used in applications like home energy monitoring and wireless light switches. ZigBee is an open standard protocol managed by the Connectivity Standards Alliance (https://csa-iot.org, accessed on 4 December 2024).
- Bluetooth: Bluetooth (https://www.bluetooth.com, accessed on 13 January 2025) enables short-range data exchange between devices using radio waves, making it unsuitable for long distances or large networks. Designed for short-range communication [23], Bluetooth employs encryption and authentication for secure device communication. It is energy efficient.
One of the main strengths of IoT lies in its capacity to interconnect small devices, facilitating real-time interaction between physical assets and digital systems. This connectivity simplifies the management of complex production lines within distributed systems, enabling efficient data collection and analysis to support informed decision-making.
Many systems also automatically generate alerts to help monitor their operational health. However, there is no universally accepted architecture for IoT applications [24], which may affect development and widespread adoption [25].
At the beginning of the research investigation, the three-layer architecture was introduced [16,26], which has the following:
- Perception layer: it connects the physical world with the real one, and it consists of sensor networks responsible for data collection.
- Transmission layer: it facilitates the transmission of data from sensors to subsequent levels.
- Application layer: it provides the user interface for interaction with the system, and it is the uppermost layer.
Soumyalatha, 2026 [27] identifies a four-layer architecture, which has the following:
- Perception layer.
- Gateway and network layer: it transfers the information from the sensors to the next layer.
- Management service layer: it is an interface between the two layers.
- Application layer.
Comparing this with the three-layer architecture, the Transmission layer is split into two different layers. Mouha, 2021 [26] proposes an architecture of five layers, which are the following:
- Perception layer.
- Application layer.
- Processing layer: it processes the information received from the network layer to have information available and make decisions.
- Transport layer: it transmits data from the perception layer to the processing layer and over networks.
- Business layer: it visualizes information and statistics from the application layer.
The common point of those architectures is that they consider the core elements to enable effective data management and user engagement.
The advent of IoT has improved various sectors, offering opportunities to improve efficiency, resource optimization, and support decision-making. Remote monitoring of the entire system can be implemented with IoT, and this monitoring system does not require the users to be physically present. IoT technologies have improved operational efficiency by supplying operators with real-time data from interconnected devices [28]. In manufacturing, IoT sensors on machines monitor parameters such as temperature, vibration, and pressure, allowing operators to optimize maintenance schedules and avoid unplanned downtime [29]. IoT-driven automation and smart devices minimize the need for human intervention in routine tasks, enabling operators to concentrate on more strategic decisions.
The integration of Artificial Intelligence and Machine Learning with IoT allows operators to forecast operational trends and make data-driven decisions [30]. The predictive maintenance applications of IoT can be implemented thanks to IoT [31]. IoT systems can alert operators to potential equipment failures or irregularities early on, allowing them to take corrective action before problems escalate. This helps minimize costly downtime and extends the lifespan of the equipment.
In the literature there is a lack of interest in non-expert operators in new technologies in industrial scenarios. This work aims to propose a solution in this direction.
3. Maintenance Strategy and Fault Identification
In industrial environments, maintenance activities are performed to keep something in proper condition, with the goal of decreasing failures and downtime, maximizing system availability, minimizing breakdown, and maximizing system reliability [32].
Maintenance is a cost-demanding activity; maintenance costs are between 15% and 60% of the total operating costs of production in industrial companies [33,34]. The maintenance strategy performed needs to be evaluated with regard the industrial field where it is applied. The maintenance strategies are as follows:
- Corrective maintenance: It is performed when a system breakdown occurs. As an advantage, it is the less expensive strategy; on the other hand, it is not suggested when the failure consequence is severe [35]. It is the best solution when there are cheap components [36].
- Preventive maintenance: Its goal is to prevent a possible failure by detecting potential issues before they occur, using the mean-time-to-failure (MTTF) parameter [33]. An advantage is that regular maintenance increases the expected life of the components [37]. There are different techniques in the preventive maintenance strategies, some of which are as follows:
- −
- Failure finding maintenance: it detects hidden failures.
- −
- Risk-based maintenance: it is implemented based on the failure risks of all system components.
- −
- Condition-based maintenance: it aims to perform maintenance actions leveraging on a condition monitoring process of the target. Normally, the parameters detected are specific monitoring parameters, such as vibration, temperature, and noise levels [38].
- −
- Predictive maintenance: it is the most complex maintenance strategy, and its target is to predict failures with the scope to optimize the maintenance efforts [39].
- Proactive maintenance: it reduces unplanned downtime and increases the useful life of components by decreasing asset deterioration thanks to actions that increase the asset’s life.
Maintenance can improve thanks to the technological advancements born with the Industry 4.0 revolution [40], in particular, thanks to IoT development [31]. A monitoring system is required to monitor the asset’s health status. This could be reached in different ways. The easiest one is to monitor the system’s machines manually, based on visual inspections or instrument inspections [32]. Otherwise, it is possible to monitor the machine’s health status over time, continuously tracking the system data and warning the users when anomalies are detected. To support this application, a proper IoT infrastructure must be implemented [31]. Motaghare, 2018 [33] describes the main functionalities required, which are as follows:
- Data acquisition.
- Data analysis.
- State detection.
- Health assessment and prognosis.
- Maintenance actions and alerts.
The methodology used to diagnose failures by monitoring some variables was described in Bertoli, 2024 [41]. In the three-layer IoT architecture, the fault monitoring process is in the business layer. This methodology aims to simplify the analysis and identification of the fault. The main steps are as follows:
- Fault identification: The fault to be monitored needs to be identified.
- Event identification: A single fault is not always caused only by a specific event, and this needs to detect all the possible events that can cause the specific fault.
- Event impact: To know the corrective action to implement to restore the system, the event impact on the system must be studied.
- Variables identification: A variable or a set of variables to monitor the event must be identified to monitor the system’s status.
4. Proposed IoT Architecture
Some of the aspects of this IoT architecture were published by Bertoli, 2021 [42]. The system has two main components: the IoT node and the central server. Based on the literature review, the Wi-Fi is used as the wireless communication standard in this architecture, which is the most widely available.
An “IoT node” refers to any industrial device that gathers data relevant to the user, produced in the system. It is the element in the system that is connected with the object that needs to be monitored, collects its data and sends it to the central server. Multiple IoT nodes may be present, each collecting data and transmitting it to the same central server. Each node is assigned a unique ID for identification purposes. The IoT node software is embedded in a small device, such as a Raspberry Pi (https://www.raspberrypi.com, accessed on 14 March 2025) or a mini industrial PC. The specific device used depends on the particular implementation, but it is important to use a small object not to interfere with the environment. This device is responsible for communicating with sensors, implementing the perception layer of the IoT architecture, acquiring data, which is the transmission layer, and transmitting it to the central server where the application layer is developed, allowing the user to interact with the system.
The central server is the central element of the architecture. Only one server is required, and it becomes the central access point to monitor the system. It could be used a cloud server or an on-premise server. The IoT nodes are managed directly from the central server, and the IoT nodes’ data are visible thanks to a graphical user interface (GUI). The data are also stored in a database. The software modules are written using Python (https://www.python.org, version 3.8.10), which is a high-level, dynamic, and interpreted programming language recognised for its clear and easy-to-read syntax. Over time, it has become one of the most popular languages, praised for its simplicity, versatility, and powerful capabilities. For the visualisation software module, Node.js (https://nodejs.org, version 16.14.2) is used, which is a popular, open-source, cross-platform runtime environment that enables running JavaScript code on the server side, outside the web browser.
4.1. IoT Node Description
The IoT node schema is reported in Figure 1.
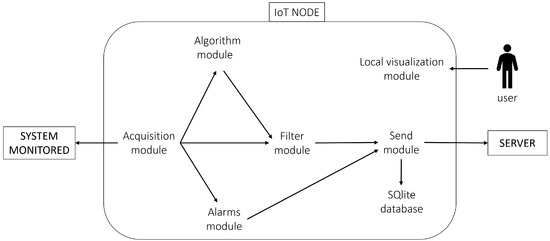
Figure 1.
IoT node architecture schema.
The software modules of the IoT node are as follows:
- Acquisition moduleThe acquisition module collects data from various sensors and publishes it via Message Queue Telemetry Transport (https://mqtt.org, version 3.1.1) (MQTT), using the Eclipse Mosquitto broker (https://mosquitto.org, version 1.6.9). MQTT follows a publish/subscribe model, where devices (clients) publish messages to a topic, and subscribers to that topic receive the messages; the broker dispatches the messages. This module is customised for each application. The acquired data can be categorised into two types: functioning data (e.g., temperature, speed, and pressure) and alarms, which are critical variables that need immediate attention.
- Alarms moduleThis module manages two types of alarms:
- (a)
- System alarms: They are generated by the acquisition system to indicate warnings in the system’s operation.
- (b)
- User alarms: They are triggered when a monitored variable exceeds a defined threshold.
- Algorithm moduleThis module, configured by the user on the central server, computes new variables using input from acquisition data. It subscribes to MQTT for input and publishes the computed values via MQTT. If multiple variables are used, their acquisition timestamps must match for computation, except for the moving average. This module is only installed on IoT devices where real-time variable computation is needed.
- Filter moduleThe filter module receives data from both the acquisition and algorithm modules via MQTT. It filters the data to reduce the volume sent to the server and stored in the database. Filter rules can be set for each variable. The filtered data is then prepared and sent to the send module when a set timeout occurs.
- Send moduleThe send module is responsible for communicating with the server via REST API, which is an application programming interface (API) based on the design principles of the REST (Representational State Transfer) architectural style. It sends data received from the filter and alert modules in a defined format. Alarms are sent immediately, while filtered data is sent after a set timeout, typically every 30 s, to keep the server updated. The IoT node is internet connected, either through the local Wi-Fi or a SIM card. If the internet connection fails, an SQLite (https://www.sqlite.org, version 3.31.1) local database is used to store data temporarily. SQLite is a C-language library, developed to implement a SQL database engine that is small, fast, and self-contained, with high reliability. Once the connection is restored, the send module transmits the saved data to the server and deletes it from the local database.
- Local visualization moduleThe local visualization module is a web page hosted by the IoT node that displays data from MQTT and active alarms. It can only be accessed locally, showing information specific to the linked IoT node. The primary purpose of this page is to facilitate the initial configuration of the IoT node, though it may not be included in all applications.
4.2. Central Server Description
The central server has four different processes to meet all the project requirements. The central server schema is reported in Figure 2.
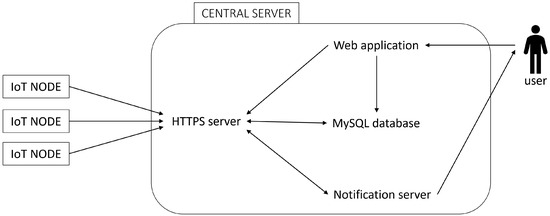
Figure 2.
Central server architecture schema.
The software components are as follows:
- HTTPS serverThe HyperText Transfer Protocol over Secure Socket Layer (HTTPS) is a secure version of HTTP that uses encryption for safer communication. The HTTPS server manages communication with IoT nodes, the web application, the database, and the notification server. IoT nodes and the web app use REST API to communicate with the server. When new data is received, and its timestamp is within a 5 min threshold, it is published on MQTT. Every time the data are saved in the database, the HTTPS server is the sole access point to control database access. Additionally, the server handles IoT node configuration requests. The IoT node periodically checks for updates, and if a change is detected, the server sends the new configuration.
- DatabaseDatabases used in cloud servers can be categorized into relational and non-relational databases. Relational Database Management Systems (RDBMSs) are based on relational, and they organize data into interconnected tables. Data is stored in tables consisting of rows (records) and columns (attributes). These tables can be linked using keys, and each record is usually identified by a unique primary key. The Structured Query Language (SQL) is used to query and manage the structured data in RDBMSs, facilitating operations on data with defined relationships among entities and variables. Non-relational databases, commonly called NoSQL databases, are designed to handle large volumes of unstructured or semi-structured data that do not fit into traditional tables. While relational databases rely on a fixed schema and tables, NoSQL databases provide more flexibility in data modeling and storage. A relational database was chosen to handle related data, with MySQL being the selected system. MySQL, an open-source RDBMS from Oracle, is widely used for its performance [43]. Each variable received has its own automatically created table, storing data along with a timestamp and value. All data related to system functioning includes a timestamp of data acquisition and the corresponding value. For this reason, a new table can be automatically created whenever a new metric is acquired. Information about users, the system, and IoT node configurations is also stored in the database, but this information is stored in specific tables (e.g., the users table) to enable system management and data interpolation.Using SQL helps prevent data redundancy. However, since SQL databases have a fixed schema, it is important to define the variable structure before starting data acquisition. To automate this, the server is configured with predefined variable types. When a new variable is received, the server checks if its table exists. If not, it creates a new table with the appropriate structure for storing the variable.
- Web applicationThe different pages manage the different aspects of the IoT nodes.
- Users manager: This module manages the creation of new users, requiring their name, surname, email, username, and password. The email is used for password recovery in case the user forgets it. Users can also update their personal information.
- IoT nodes manager: In this section of the web application, the user manages the IoT nodes. To connect a physical IoT node to the server, the user creates a virtual object with a unique ID and a random password, which is then exported to the IoT node. The IoT node communicates with the server via REST API and is authenticated by the module using the ID and password.
- Algorithms: On this page, the user can implement specific algorithms for the IoT nodes. The system is aware of the IoT node configuration and available options, providing a range of operations that can be computed. Those operations are as follows:
- −
- Sum;
- −
- Multiply;
- −
- Square root;
- −
- Moving average.
- Alerts: This module enables the creation and management of user alarms and the display of alarms received from IoT nodes stored in the database. The user can set a threshold for a specific variable, and if the variable exceeds this threshold, an alarm is triggered. The system allows the following types of thresholds to be set:
- −
- Max: the value exceeds a set threshold;
- −
- Min: the value is lower than a set threshold;
- −
- Equal to: the value is equal to a set threshold;
- −
- Different to: the value is different from a set threshold;
- −
- In the range: the value is inside the settled range of a threshold;
- −
- Outside the range: the value is outside the settled range of a threshold.
- Notifications: The user can select an alert and link it to a notification. When the chosen alarm is triggered by an IoT node, the corresponding notification is sent to the user. The notification can be either an email or a Telegram bot message.
- Live dashboard: it shows the data received in the last 5 min of selected variables of the desired IoT node.
- Historical dashboard: The user can select a specific IoT node, a time range, and a variable, and this page displays the collected data in a graph. The x-axis represents time, while the y-axis represents the variable. The user can analyze data trends and has the option to download the data as a CSV file.
- Notification serverWhen an alarm is received from an IoT node and is linked to a notification request, the HTTPS server publishes the information via MQTT, which is then received by the notification server, via an MQTT subscriber. The user is notified via email or Telegram, depending on the system’s configuration. An automatic Telegram chatbot sends messages containing the alarm details and the specific IoT node that triggered the alarm. The chatbot is designed to perform automated tasks, like delivering notifications through the Telegram app. The user can configure new alerts and link notifications to specific alerts through the website.
5. First Application: AGVs
5.1. System Implementation
The first application involves an Automatic Guided Vehicle (AGV) fleet used in an industrial plant. The AGV communicates with a central server, which serves as the main access point between system requests and the AGVs. Specifically, the server manages three key aspects:
- It processes user commands;
- It monitors the AGV traffic;
- It plans the AGV missions.
This same server oversees all the AGVs within the industrial plant. A Raspberry Pi, a single-board computer, is integrated into the system to implement an IoT infrastructure based on the previously described architecture.
The decision to use a Raspberry Pi is based on its compact size and ability to blend seamlessly into the environment. This device collects data directly from the central server using the Modbus protocol, a standard communication protocol in industrial settings. The system schema is reported in Figure 3.
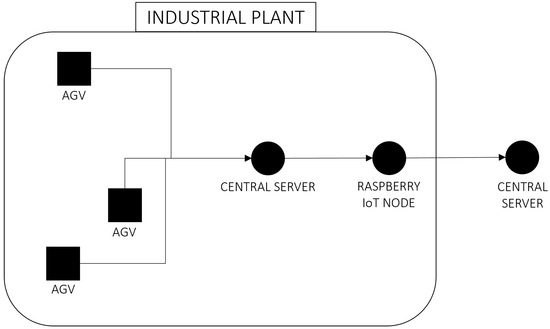
Figure 3.
AGV plant schema.
The data collected are reported in Table 1. All the data are collected simultaneously, once every second. The position variable is an array consisting of three float values: the x position of the AGV, the y position of the AGV, and an angle theta, which represents the orientation of the AGV within the plant. The data collected via Modbus protocol from the central server is published on MQTT. An algorithm on the cloud server is added to obtain the electric power of the AGV. This algorithm multiplies the current and voltage readings after checking their timestamps to ensure data synchronization. The power is only calculated if the timestamps of the current and voltage are within a predefined threshold. If synchronized, the power is computed and published on MQTT back to the system with a timestamp that is the average of the input timestamps. This ensures accurate monitoring of the electrical consumption of the AGV.

Table 1.
List of the AGV variables acquired.
The data are transmitted via the REST API to a cloud server for storage. A web application with a user-friendly GUI is implemented to allow access to this data. Leveraging the cloud server enables users to access the data remotely, without needing a physical connection to the AGV central server within the plant. The data, along with their timestamps, are stored in the database, facilitating the correlation of multiple information points. The key pages of the application are outlined below. The page used in this application is as follows:
- Users manager.
- IoT nodes manager.
- Algorithms.
- Alerts.
- Notifications.
- Live dashboard.
- Historical dashboard.
5.2. Easy Fault Analysis
The proposed system aims to help operators understand the interaction of the AGVs with their environment. This analysis is published in Bertoli, 2024 [41]. The key issue is the loss of efficiency in AGVs due to unnecessary stops or speed reductions, which increases mission time. In this research, three main causes of efficiency loss are considered:
- Low number of reflectorsAGVs use reflectors for positioning. If the number of reflectors is lower than four, the AGV may reduce speed or stop. The number of reflectors is the variable to monitor. The analysis is performed by extracting records from the database where the number of reflectors for the AGV is less than or equal to three, including the position of the AGV in the plant when this happens. This data is visualized through a heat map applied to the plant layout. This system allows a not expert operator to visually see the plant section when the number of reflectors is not enough and support him/her in identifying possible solutions.
- Active “warning state”The AGV can enter a critical state called “warning state” that causes it to slow down as a precaution. It is possible to track when the AGV enters a “warning” condition. A novel approach has been implemented to enhance AGV safety and monitoring by detecting the “warning” state through an alerts module. When the AGV microscan detects a condition requiring a “warning” state, it automatically reduces speed to prevent accidents. The IoT node receives alarms from the AGV and sends alarm information to the central server. Upon receiving this data, the central server sends an email to alert operators. This is performed thanks to the notification modules that send emails to interested users regarding specific alerts when they are triggered. Additionally, the cloud server features a web application that maps the location of the warning event in the plant layout, allowing operators to monitor and respond remotely. This real-time monitoring, coupled with accessible data on the warning state and its location, enhances operational safety, enabling quick responses and reducing downtime.
- Discrepancy between set and real speedIf the actual speed differs significantly from the expected speed, it indicates a system issue. It is possible to compare the real and set speeds to detect significant differences in values. The methodology used to analyze AGV speed differences mirrors the approach for tracking reflectors. The system records key parameters, such as real and set speeds, and the AGV position, to identify instances where the AGV speed falls below the expected threshold. This data helps optimize the layout during the speed-setting process, enabling operators to make informed decisions to improve efficiency and safety. The heatmap created in the plant layout visually represents speed discrepancies, highlighting areas with frequent speed issues. By identifying these regions, operators can focus on optimizing them to ensure the AGV operates within the desired speed parameters. This data-driven approach enhances AGV system efficiency and supports better operational management in industrial environments.
6. Second Application: Robotic Cell
6.1. System Implementation
The proposed architecture is applied in an industrial use case involving a robot-assisted welding solution for automated MIG/MAG welding, produced by the Italian SME company “Industria Tecnologica Italiana” (https://www.it-i.it, accessed on 16 June 2025). The brand name of the cell is “MyWelder” (https://mywelder.it-i.it, accessed on 2 July 2025). The information regarding the welding process is reported in Ferraguti, 2023 [44].
The system, represented in Figure 4, consists of three key components:
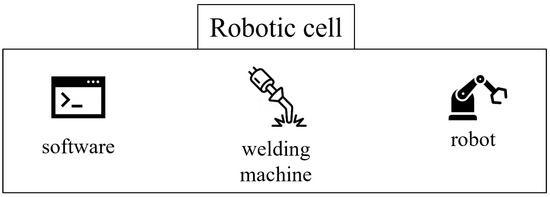
Figure 4.
AGVs plant schema.
- Collaborative robotThis application uses a collaborative robot (cobot), which is a robot that physically interacts with humans. The cobot shares the same working space with the operator. To complete the desired task the cobot and the human need to cooperate [45]. A Doosan (https://www.doosanrobotics.com, accessed on 31 March 2025) collaborative robot with six degrees of freedom is selected.
- Human–Machine Interface (HMI)The HMI is installed on an industrial mini PC. This interface allows easy robot programming and communicates via Modbus with the robot controller.
- Welding equipmentThe welding equipment includes the welding power source, torch, and a stable work table, providing a complete and manageable welding solution.
The system works as follows: the HMI offers basic movement primitives as points, lines, circles, and arcs, which are commonly used in industrial welding. Operators can define a welding path by selecting and combining these primitives, specifying welding parameters like torch power and type. The created path is saved as a reusable welding program, enabling batch production without reprogramming. Once defined, the robot executes the task autonomously, improving both efficiency and safety. This collaborative robotic system is an important innovation in industrial welding and IT innovation, with ease of use.
The IoT node software modules is embedded in the external industrial mini PC. The data that are known in the software that manages the cobot and the welding are published on MQTT. The data acquired are three: the cell status, the welding program executed, and the movement executed. Those data structures contain different information that are reported in Table 2.
Table 2.
List of data collected from the collaborative cell.
In this application, the alarms are the robot alarms automatically generated from the robot. Those are normally described in the commercial robot troubleshooting guide. As in the previous industrial application, the data are transmitted via REST API to a cloud central server for storage and accessible thanks to a web application with a user-friendly GUI. The page used in this application are as follows:
- Users manager.
- IoT nodes manager.
- Alerts.
- Notifications.
- Live dashboard.
- Historical dashboard.
6.2. Easy Fault Analysis
The system described addresses common issues encountered during robot welding operations, such as unexpected stops due to faults or errors. In Bertoli, 2024 [46], this fault analysis is widely described. Traditional methods of diagnosing these faults often require manual access to the robot’s log files. This process is time consuming and complex, especially for operators without knowledge of robotics. This new system eliminates the need for manual log checks by automatically collecting the robot alarms when a fault occurs, offering detailed feedback on the nature of the error, such as collisions or encoder issues, simplifying troubleshooting. The proposed system improves the user experience by simplifying fault diagnosis, enabling operators to identify issues quickly. Direct fault diagnosis through the interface also enhances repair and maintenance efficiency, leading to more reliable robot operation.
New opportunities can be reached with this architecture, like supporting the operator with active feedback from the system when a robot alarm arises. To prove this opportunity, the singularity alarm is considered. A singularity happens when the robot’s configuration limits its movement, and it prevents the end effector from precise maneuvering [47]. The singularity can disrupt welding accuracy and lead to defective products, particularly when the robot’s policy to overcome the singularity is to find a similar path, and if an unexpected path is performed during the welding process, the welder may not be acceptable. By detecting singularities during program execution, the system logs the singularity alarm and notifies the operator using a popup in the robot interface, suggesting to change the piece orientation to avoid the singularity. This process allows for proactive adjustments to prevent defects.
Although challenges remain for non-expert operators, this approach significantly improves diagnostic efficiency and supports smoother robot operation, ultimately enhancing the quality of the welding process and reducing material waste.
7. Conclusions
Industry 4.0 integrates advanced technologies like big data, autonomous robots, IoT, and additive manufacturing to improve production and automation. In contrast, Industry 5.0 focuses on human well-being, ethics, and sustainability, emphasizing human–machine collaboration, personalization, and social innovation. Industry 5.0 addresses the limitations of Industry 4.0 by integrating new technologies with a focus on ethical production and sustainability.
This research proposes a fault methodology that can be easily implemented by non-experts, facilitated by an industrial IoT architecture. The IoT connects physical objects through sensors, software, and communication networks to exchange data. The proposed methodology aims to address industrial challenges, particularly in maintenance and fault diagnosis.
Two industrial use cases demonstrate the IoT architecture. The first involves AGVs, which are used for transporting materials in industrial settings. The IoT system monitors the health of the AGV and its interaction with its environment, with a GUI enabling operators to manage and diagnose faults remotely. The second case uses cobots in MyWelder, a robotic welding application, where operators are assisted by an intuitive GUI, and operational data is collected for analysis and fault diagnosis.
Future developments include improving operator support, identifying and preventing new failures, and expanding the IoT architecture to other industrial sectors for greater applicability and flexibility.
Author Contributions
Conceptualization, A.B. and C.F.; Methodology, A.B. and C.F.; Software, A.B.; Validation, A.B.; Formal analysis, A.B.; Writing—original draft, A.B. and C.F.; Writing—review and editing, A.B. and C.F.; Supervision, C.F. All authors have read and agreed to the published version of the manuscript.
Funding
This research received no external funding.
Institutional Review Board Statement
Not applicable.
Informed Consent Statement
Not applicable.
Data Availability Statement
Data is contained within the article.
Acknowledgments
The authors strongly acknowledge the invaluable help of Silvia Costi, Marcos Da Silva and Simone Orlandini of ”Industria Tecnologica Italiana” s.r.l., who supported the experimental validation of the collaborative robot application. During the preparation of this article, the authors used ChatGPT/GPT-4 and Grammarly for the purposes of text editing to improve the English (e.g., grammar, structure, spelling, punctuation, and formatting). The authors have reviewed and edited the output and take full responsibility for the content of this publication.
Conflicts of Interest
The authors declare no conflicts of interest.
References
- Kurt, R. Industry 4.0 in terms of industrial relations and its impacts on labour life. Procedia Comput. Sci. 2019, 158, 590–601. [Google Scholar] [CrossRef]
- Bayraktar, O.; Ataç, C. The effects of Industry 4.0 on Human resources management. In Globalization, Institutions and Socio-Economic Performance; Peter Lang: Lausanne, Switzerland, 2018; pp. 337–359. [Google Scholar]
- Guo, Y.; Langer, C.; Mercorio, F.; Trentini, F. Skills mismatch, automation, and training: Evidence from 17 European countries using survey data and online job ads. EconPol Forum 2022, 23, 11–15. [Google Scholar]
- Bonekamp, L.; Sure, M. Consequences of Industry 4.0 on human labour and work organisation. J. Bus. Media Psychol. 2015, 6, 33–40. [Google Scholar]
- Rüßmann, M.; Lorenz, M.; Gerbert, P.; Waldner, M.; Justus, J.; Engel, P.; Harnisch, M. Industry 4.0: The future of productivity and growth in manufacturing industries. Boston Consult. Group 2015, 9, 54–89. [Google Scholar]
- Kaasinen, E.; Schmalfuß, F.; Özturk, C.; Aromaa, S.; Boubekeur, M.; Heilala, J.; Heikkilä, P.; Kuula, T.; Liinasuo, M.; Mach, S.; et al. Empowering and engaging industrial workers with Operator 4.0 solutions. Comput. Ind. Eng. 2020, 139, 105678. [Google Scholar] [CrossRef]
- Romero, D.; Stahre, J.; Wuest, T.; Noran, O.; Bernus, P.; Fast-Berglund, Å.; Gorecky, D. Towards an operator 4.0 typology: A human-centric perspective on the fourth industrial revolution technologies. In Proceedings of the International Conference on Computers and Industrial Engineering (CIE46), Tianjin, China, 29–31 October 2016; pp. 29–31. [Google Scholar]
- Leng, J.; Sha, W.; Wang, B.; Zheng, P.; Zhuang, C.; Liu, Q.; Wuest, T.; Mourtzis, D.; Wang, L. Industry 5.0: Prospect and retrospect. J. Manuf. Syst. 2022, 217, 279–295. [Google Scholar] [CrossRef]
- Huang, S.; Wang, B.; Li, X.; Zheng, P.; Mourtzis, D.; Wang, L. Industry 5.0 and Society 5.0—Comparison, complementation and co-evolution. J. Manuf. Syst. 2022, 64, 424–428. [Google Scholar] [CrossRef]
- Cotta, J.; Breque, M.; De Nul, L.; Petridis, A. Towards a Sustainable, Human-Centric and Resilient European Industry. 2021. Available online: https://eurocid.mne.gov.pt/sites/default/files/repository/paragraph/documents/17991/brochura-industry-50_0.pdf (accessed on 18 April 2025).
- Romero, D.; Stahre, J. Towards the resilient operator 5.0: The future of work in smart resilient manufacturing systems. Procedia Cirp 2021, 104, 1089–1094. [Google Scholar] [CrossRef]
- Rikala, P.; Braun, G.; Järvinen, M.; Stahre, J.; Hämäläinen, R. Understanding and measuring skill gaps in Industry 4.0—A review. Technol. Forecast. Soc. Change 2024, 201, 123206. [Google Scholar] [CrossRef]
- Vaidya, S.; Ambadb, P.; Bhosle, S. Industry 4.0—A Glimpse. In Proceedings of the 2nd International Conference on Materials Manufacturing and Design Engineering, Lisbon, Portugal, 26–28 September 2018; pp. 233–238. [Google Scholar]
- Madakam, S.; Ramaswamy, R.; Tripathi, S. Internet of Things (IoT): A Literature Review. J. Comput. Commun. 2015, 3, 164–173. [Google Scholar] [CrossRef]
- Yang, H.; Kumara, S.; Bukkapatnam, S.; Tsung, F. The Internet of Things for Smart Manufacturing: A Review. IISE Trans. 2019, 51, 1190–1216. [Google Scholar] [CrossRef]
- Gupta, B.B.; Quamara, M. An overview of Internet of Things (IoT): Architectural aspects, challenges, and protocols. Concurr. Comput. Pract. Exp. 2020, 32, e4946. [Google Scholar] [CrossRef]
- Sissini, E.; Saifullah, A.; Han, S.; Jennehag, U.; Gidlund, M. Industrial internet of things: Challenges, opportunities, and directions. IEEE Trans. Ind. Inform. 2018, 14, 4724–4734. [Google Scholar] [CrossRef]
- Vieira, G.; Barbosa, J.; Leitão, P.; Sakurada, L. Low-Cost Industrial Controller based on the Raspberry Pi Platform. In Proceedings of the 2020 IEEE International Conference on Industrial Technology (ICIT), Buenos Aires, Argentina, 2–28 February 2020; pp. 292–297. [Google Scholar]
- Suresh, P.; Daniel, J.V.; Parthasarathy, V.; Aswathy, R. A state of the art review on the Internet of Things (IoT) history, technology and fields of deployment. In Proceedings of the 2014 International Conference on Science Engineering and Management Research (ICSEMR), Chennai, India, 27–29 November 2014; IEEE: Piscataway, NJ, USA, 2014; pp. 1–8. [Google Scholar]
- Jia, X.; Feng, Q.; Fan, T.; Lei, Q. RFID technology and its applications in Internet of Things (IoT). In Proceedings of the 2012 2nd International Conference on Consumer Electronics, Communications and Networks (CECNet), Yichang, China, 21–23 April 2012; IEEE: Piscataway, NJ, USA, 2012; pp. 1282–1285. [Google Scholar]
- Scanzio, S.; Rosani, M.; Scamuzzi, M.; Cena, G. QR codes: From a Survey of the State-of-the-Art to Executable eQR Codes for the Internet of Things. IEEE Internet Things J. 2024, 11, 23699–23710. [Google Scholar] [CrossRef]
- Safaric, S.; Malaric, K. ZigBee wireless standard. In Proceedings of the ELMAR 2006, Zadar, Croatia, 7–9 June 2006; IEEE: Piscataway, NJ, USA, 2006; pp. 259–262. [Google Scholar]
- Lonzetta, A.M.; Cope, P.; Campbell, J.; Mohd, B.J.; Hayajneh, T. Security vulnerabilities in Bluetooth technology as used in IoT. J. Sens. Actuator Netw. 2018, 7, 28. [Google Scholar] [CrossRef]
- Kotha, H.D.; Guptaa, V.M. IoT application: A survey. Int. J. Eng. Technol 2018, 7, 891–896. [Google Scholar] [CrossRef]
- Al-Qaseemi, S.A.; Almulhim, H.A.; Almulhim, M.F.; Chaudhry, S.R. IoT architecture challenges and issues: Lack of standardization. In Proceedings of the Future Technologies Conference (FTC), San Francisco, CA, USA, 6–7 December 2016; pp. 731–738. [Google Scholar]
- Mouha, R.A.R.A. Internet of Things (IoT). J. Data Anal. Inf. Process. 2021, 9, 77. [Google Scholar]
- Soumyalatha, S.G.H. Study of IoT: Understanding IoT architecture, applications, issues and challenges. In Proceedings of the 1st International Conference on Innovations in Computing & Net-working (ICICN16), CSE, RRCE, International Journal of Advanced Networking & Applications, Bangalore, India, 12–13 May 2016; Volume 478. [Google Scholar]
- Malek, Y.N.; Kharbouch, A.; El Khoukhi, H.; Bakhouya, M.; De Florio, V.; El Ouadghiri, D.; Latré, S.; Blondia, C. On the use of IoT and big data technologies for real-time monitoring and data processing. Procedia Comput. Sci. 2017, 113, 429–434. [Google Scholar] [CrossRef]
- Lee, J.; Bagheri, B.; Kao, H.A. A cyber-physical systems architecture for industry 4.0-based manufacturing systems. Manuf. Lett. 2015, 3, 18–23. [Google Scholar] [CrossRef]
- Da Xu, L.; He, W.; Li, S. Internet of things in industries: A survey. IEEE Trans. Ind. Inform. 2014, 10, 2233–2243. [Google Scholar]
- Compare, M.; Baraldi, P.; Zio, E. Challenges to IoT-Enabled Predictive Maintenance for Industry 4.0. IEEE Internet Things J. 2019, 7, 4585–4597. [Google Scholar] [CrossRef]
- Ran, Y.; Zhou, X.L.; Wen, Y.; Deng, R. A Survey of Predictive Maintenance: Systems, Purposes and Approaches. IEEE Commun. Surv. Tutor. 2019, 20, 1–36. [Google Scholar]
- Motaghare, O.; Pillai, A.S.; Ramachandran, K.I. Predictive Maintenance Architecture. In Proceedings of the IEEE International Conference on Computational Intelligence and Computing Research (ICCIC), Madurai, India, 13–15 December 2018; pp. 1–4. [Google Scholar]
- Zonta, T.; da Costa, C.A.; Righi, R.R.; de Lima, M.L.; da Trindade, E.S.; Li, G.P. Predictive maintenance in the Industry 4.0: A systematic literature review. Comput. Ind. Eng. 2020, 150, 106889. [Google Scholar] [CrossRef]
- Mungani, D.S.; Visser, J.K. Maintenance approaches for different production methods. S. Afr. J. Ind. Eng. 2013, 24, 1–13. [Google Scholar] [CrossRef]
- Tran, N.T.; Trieu, H.T.; Ngo, N.H.; Dao, Q.K. An overview of the application of machine learning in predictive maintenance. Petrovietnam J. 2021, 10, 47–61. [Google Scholar] [CrossRef]
- Erbiyik, H. Definition of maintenance and maintenance types with due care on preventive maintenance. In Maintenance Management-Current Challenges, New Developments, and Future Directions; IntechOpen: London, UK, 2022. [Google Scholar]
- Ahmad, R.; Kamaruddin, S. An overview of time-based and condition-based maintenance in industrial application. Comput. Ind. Eng. 2012, 63, 135–149. [Google Scholar] [CrossRef]
- Pech, M.; Vrchota, J.; Bednář, J. Predictive Maintenance and Intelligent Sensors in Smart Factory. Sensors 2021, 21, 1470. [Google Scholar] [CrossRef]
- Pinciroli, L.; Baraldi, P.; Zio, E. Maintenance optimization in industry 4.0. Reliab. Eng. Syst. Saf. 2023, 234, 109204. [Google Scholar] [CrossRef]
- Bertoli, A.; Battilani, N.; Fantuzzi, C. Fault Diagnosis and Identification in AGVs System. IFAC-Pap. Online 2024, 58, 246–251. [Google Scholar] [CrossRef]
- Bertoli, A.; Cervo, A.; Rosati, C.A.; Fantuzzi, C. Smart Node Networks Orchestration: A New E2E Approach for Analysis and Design for Agile 4.0 Implementation. Sensors 2021, 21, 1624. [Google Scholar] [CrossRef]
- Tongkaw, S.; Tongkaw, A. A comparison of database performance of MariaDB and MySQL with OLTP workload. In Proceedings of the IEEE Conference on Open Systems (ICOS), Kedah, Malaysia, 10–12 October 2016; IEEE: Piscataway, NJ, USA, 2016. [Google Scholar]
- Ferraguti, F.; Villani, V.; Storchi, C. MyWelder: A collaborative system for intuitive robot-assisted welding. Mechatronics 2023, 89, 102920. [Google Scholar] [CrossRef]
- Sherwani, F.; Asad, M.M.; Ibrahim, B.S.K.K. Collaborative Robots and Industrial Revolution 4.0 (IR 4.0). In Proceedings of the 2020 International Conference on Emerging Trends in Smart Technologies (ICETST), Karachi, Pakistan, 26–27 March 2020; pp. 1–5. [Google Scholar]
- Bertoli, A.; Ferraguti, F.; Fantuzzi, C. An IoT-enabled Software Architecture for User-Friendly Fault Diagnosis and Identification: The Welding Cobot Use Case. In Proceedings of the 2024 7th Iberian Robotics Conference (ROBOT), Madrid, Spain, 6–8 November 2014; IEEE: Piscataway, NJ, USA, 2024; pp. 1–6. [Google Scholar]
- Sciavicco, L.; Siciliano, B. Modelling and Control of Robot Manipulators; Springer Science & Business Media: Berlin/Heidelberg, Germany, 2012. [Google Scholar]
Disclaimer/Publisher’s Note: The statements, opinions and data contained in all publications are solely those of the individual author(s) and contributor(s) and not of MDPI and/or the editor(s). MDPI and/or the editor(s) disclaim responsibility for any injury to people or property resulting from any ideas, methods, instructions or products referred to in the content. |
© 2025 by the authors. Licensee MDPI, Basel, Switzerland. This article is an open access article distributed under the terms and conditions of the Creative Commons Attribution (CC BY) license (https://creativecommons.org/licenses/by/4.0/).