Abstract
Precise electricity consumption forecasting and anomaly detection constitute fundamental requirements for maintaining grid reliability in smart power systems. While consumption patterns demonstrate quasi-periodic behavior with region-specific fluctuations influenced by environmental factors, existing approaches may fail to systematically model these dynamic variations or quantify environmental impacts. This limitation results in a compromised prediction accuracy and ambiguous anomaly identification. To overcome these challenges, we propose a novel Multi-Task Graph Attention Network (MGAT) framework leveraging an adaptive entropy analysis. Our methodology comprises four key innovations: (1) the temporal decomposition of consumption data with entropy-based adaptive clustering into predictable low-entropy components (processed via multi-scale attention networks) and volatile high-entropy components; (2) the graph-based representation of high-entropy fluctuations through numerical correlation encoding, complemented by temporal environmental graphs quantifying external influences; (3) the hierarchical fusion of environmental and fluctuation graphs via a specialized Graph Attention Autoencoder that jointly models dynamic patterns and environmental dependencies; (4) the integrated synthesis of all components for simultaneous consumption prediction and anomaly detection. Experiments verify the MGAT’s performance in both forecasting precision and anomaly identification compared to conventional methods.
1. Introduction
The increasing reliance on a stable power infrastructure underscores the paramount importance of precise electricity consumption forecasting and effective anomaly detection in modern smart grids. Regional power consumption patterns manifest two distinct yet interconnected characteristics: macro-scale quasi-periodicity and micro-scale consumption volatility, both profoundly influenced by localized environmental factors including meteorological variations and seasonal events [1,2,3,4,5]. Current analytical methodologies encounter fundamental limitations in simultaneously addressing these dual aspects. While conventional techniques like time series analysis [4,5] and regression models effectively capture sequential dependencies, they demonstrate an inadequate capability in decoupling periodic trends from stochastic fluctuations. More sophisticated approaches employing deep learning architectures (attention mechanisms [6], CNNs [7]) and spectral analysis have advanced periodicity modeling, yet persistent difficulties remain in precisely quantifying fluctuation magnitudes. This critical shortfall adversely impacts both predictive accuracy and anomaly discrimination performance. Compounding these technical challenges is the significant but understudied influence of environmental variables on regional consumption patterns, particularly weather anomalies and holiday effects, with current research offering limited solutions for systematically incorporating these factors into forecasting and anomaly detection frameworks.
Addressing these challenges, we present an innovative Multi-Task Graph Attention Network (MGAT) framework that leverages adaptive entropy analysis to advance electricity consumption forecasting and anomaly detection. The innovations are manifested through the following: modeling macro-scale quasi-periodicity and micro-scale consumption volatility via adaptive signal decomposition; incorporating environmental factors for distinct signal components; developing graph-based modeling approaches; and integrating electricity consumption forecasting with anomaly detection within a unified multi-task framework. Specifically, our methodology unfolds through four principal stages: First, we employ Ensemble Empirical Mode Decomposition (EEMD) to disassemble consumption data into Intrinsic Mode Functions (IMFs), subsequently clustered via a sequence entropy analysis into distinct high-entropy and low-entropy components. Second, the quasi-periodic patterns in low-entropy IMFs are processed through a specialized Multi-Scale Attention Network (MSAT) that extracts temporal features across multiple resolutions. Third, for high-entropy components encoding consumption volatility, we introduce temporal-sensitive fluctuation graphs that mathematically characterize numerical correlations through novel similarity metrics incorporating both the temporal proximity and amplitude variation. Concurrently, we construct complementary environmental information graphs to quantify external influences. These graph representations undergo hierarchical fusion via a custom Graph Attention Autoencoder that jointly models fluctuation dynamics and environmental dependencies through parameterized encoding. Finally, the framework synthesizes all components through a multi-task architecture with a unified loss optimization, simultaneously generating consumption forecasts and anomaly alerts. The comprehensive evaluation across two benchmark datasets confirms the MGAT’s superior performance in both prediction accuracy and anomaly identification compared to conventional approaches.
The main contributions of this paper can be summarized as follows:
- This paper proposes an MGAT that addresses the dual characteristics of electricity consumption. By decomposing consumption data into high-entropy (fluctuation-driven) and low-entropy (quasi-periodic) components, the MGAT separately models these patterns. The low-entropy components are forecasted via a Multi-Scale Attention Network (MSAT), while high-entropy components are analyzed using temporal-sensitive fluctuation graphs to quantify consumption peaks and troughs.
- By constructing temporal environmental information graphs and fusing them with temporal-sensitive fluctuation graphs, the MGAT explicitly captures the interplay between numerical consumption changes and external environmental information using a designed Hierarchical Graph Attention Autoencoder within the MGAT for forecasting the high-entropy components. Finally, the MGAT synthesizes all the forecasted components for electricity consumption forecasting and anomaly detection.
The structure of this paper is organized as follows: Section 2 reviews the related work on electricity consumption forecasting and anomaly detection. In Section 3, we present the proposed MGAT framework. Section 4 provides the experimental validation of the effectiveness of the proposed MGAT, while Section 5 concludes this paper.
2. Related Works
This study tackles the challenge of electricity consumption forecasting and anomaly detection. The forecasting model identifies two critical temporal patterns that are essential for accurate predictions: (1) periodicity, characterized by a higher industrial and commercial demand during weekdays and lower activity on weekends and holidays, and (2) sector-specific fluctuations, where production-related consumption spikes maintain relatively consistent amplitudes, even amidst sectoral variations. These sectors exhibit a combination of periodicity and fluctuation, but their statistical characteristics differ, and some sectors show weak periodicity with fluctuations driven by specific events, while others exhibit strong periodicity with more stable fluctuations. This variance necessitates modeling three interconnected dimensions simultaneously: (a) the baseline periodicity, (b) sector-specific fluctuation amplitudes, and (c) the temporal persistence of production-related events. This multifaceted approach presents significant challenges for achieving predictive accuracy, challenges that traditional single-aspect models fail to address.
Over time, electricity consumption forecasting has progressed from conventional statistical models to advanced neural network architectures. Early models primarily relied on parametric methods like autoregressive integrated models [1,2,3,4,5] and stochastic approaches such as Markov chains [2], which, while foundational, were limited by their linear assumptions and inability to capture complex nonlinear temporal dependencies, thus hindering their effectiveness in more complex forecasting scenarios. The advent of deep learning marked a transformative shift in the field [8,9,10,11], followed by innovations such as multi-scale LSTM architectures [12] for hierarchical feature extraction and bidirectional LSTM (BLSTM) models [13], which a incorporate bidirectional context to improve short-term forecasting accuracy [14]. Hybrid models combining LSTM with Markovian dynamics [14] and ensemble methods integrating deep belief networks with random forest-based feature selection [15] have also emerged. Simultaneously, frequency domain methods like Empirical Mode Decomposition (EMD) [16] and Fourier analysis [17] have gained popularity. Although Fourier-based neural architectures [18] are effective at capturing cyclical patterns, they often face a trade-off between temporal resolution and frequency localization, leading to the loss of transient features. The wavelet-based multi-resolution analysis [19] addresses this issue by using adaptive basis functions suited for heterogeneous time-series data. More recently, the incorporation of attention mechanisms [6,7] has redefined state-of-the-art frameworks, enabling models to focus dynamically on the most relevant temporal segments and overcoming the recursive limitations of traditional RNNs [20].
Autoencoder (AE) architectures have gained considerable attention for detecting anomalies in electricity consumption, particularly in low-order fluctuation components. These models work by learning latent representations of normal consumption patterns, allowing them to identify deviations caused by factors such as equipment failures, operational disruptions, or cyber–physical threats. To enhance anomaly detection, Variational Autoencoders (VAEs) leverage probabilistic latent spaces and use reconstruction probability thresholds, making them particularly well-suited for addressing industrial fluctuation. Further advancements have been made with the integration of Graph-AE frameworks, which incorporate graph neural networks (GNNs) to capture spatial–temporal dependencies in multi-sector data, thereby improving anomaly localization under volatile conditions. Additionally, hybrid AE-LSTM models, which combine sequence encoding with LSTMs and reconstruction-based anomaly scoring, offer an improved robustness for detecting anomalies in quasi-periodic patterns. These methods overcome the limitations of traditional threshold-based techniques, which struggle to adapt to dynamic and complex industrial environments. However, a significant challenge remains: integrating AE-based anomaly detection into end-to-end forecasting frameworks without compromising prediction accuracy.
3. Research Methodology
This study proposes the MGAT, a multi-task entropy adaptive learning framework that integrates signal processing with graph-structured learning. The electricity consumption data is segregated into multiple IMF components. The MGAT calculates the sequence entropy of each component and clusters them into high-entropy components and low-entropy components. Low-entropy patterns are modeled through an MSAT to capture periodic trends, while fluctuation-dominant high-entropy components are mapped to fluctuation graphs, which is further fused with environmental information graphs. The MGAT then deploys a Hierarchical Graph Attention Autoencoder for the high-entropy component prediction. The final electricity consumption predictions and anomaly detection results are calculated based on forecasted components. The structure of the MGAT is shown in Figure 1.
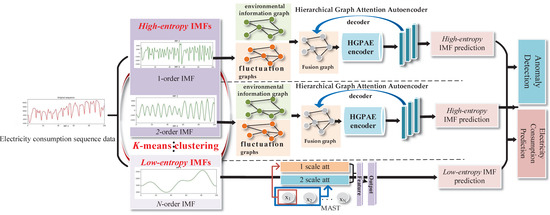
Figure 1.
MGAT structure.
3.1. Adaptive Consumption Decomposition and Low-Entropy Component Prediction
3.1.1. Adaptive Electricity Consumption Data Decomposition
We first normalize the electricity consumption data to the [0, 1] range. Then, the MGAT framework integrates signal decomposition by using EEMD, which dissects raw consumption signals into IMFs in Formula (1).
Within Formula (1), K specifies the decomposition hierarchy index, where ResulK denotes the residual term and Compk represents the k-th level IMF component.
For a given electricity consumption dataset, MGAT constructs an adaptive sequence entropy-based IMF clustering method to separately analyze the periodicity and fluctuation of the electricity consumption data. Sequence entropy (SeqEntropy) is defined as a metric to quantify the complexity of a sequence, where a higher entropy value indicates greater randomness and numerical volatilities of the sequence. For an IMF component Comp = {Comp1, Comp2,…, CompN}, given a tolerance threshold r = 0.2 × std (Comp).
For the extracted continuous subsequences of length k from Imf:
Comp = {Compi, Compi+1, Compi+2,…, Compi+k−1}, 1 < i < N − k
- 1.
- Calculate the Euclidean distance bdij between all pairs of subsequences Compk (i) and Compk (j) (i ≠ j). Then, count the number of pairs Bi that satisfy bdij ≤ r.
- 2.
- Construct subsequences of length 2k, denoted as Comp2k (i). Calculate the Euclidean distance adij between all pairs Comp2k (i) and Comp2k (j) (i ≠ j), and count the number of pairs Ai that satisfy adij ≤ r.
- 3.
- Then, the SeqEntropy of this IMF component can be calculated as follows:
Therefore, the sequence entropy of all IMF components can be calculated according to the Formulas (2)–(5). For IMF components with higher SeqEntropy, the inherent uncertainty is greater, indicating that they contain more numerical fluctuations. Components with lower SeqEntropy indicate higher determinism, and this means that their corresponding sequences exhibit quasi-periodic patterns. Hence, we use k-means clustering (k = 2) to partition the IMF components of this dataset into high-entropy components and low-entropy components (it is important to note that since the process of calculating sequence entropy is based on the dataset, the number of components in the high-entropy and low-entropy groups remain unchanged for the same dataset).
3.1.2. Low-Entropy Component Prediction
For low-entropy components, which mainly exhibit quasi-periodic patterns, MGAT employs Multi-Scale Attention Networks (MSATs) to capture approximate periodic patterns and forecast low-entropy components. The MSAT is designed to integrate multiple attention layers that operate on different scales. It aims to capture both fine details and broader patterns in the sequence. Each attention layer focuses on a specific scale, extracting unique features that reflect different aspects of the sequence. These features are then merged to form a feature vector, which provides a representation by combining information from various scales. The feature extraction process for the low-entropy IMF is calculated as
Here, fIMF_j represents the extracted feature of the j-th low-entropy IMF component (denoted as LowEnCompj in Formula (6)). Utilizing the extracted features, we forecast the values of these IMFs, capturing the periodic patterns within these components. The predicted values of the j-th low-entropy IMF component are expressed as
where SLP is a single layer neural network with ReLU as its activation function. Next, MGAT designs graph-based methods for high-entropy component prediction.
3.2. High-Entropy Component Prediction
The high-entropy IMF components derived from electricity consumption data play a critical role in characterizing fluctuation. Assume there are a total of K high-entropy IMF components, and we take the analysis of the k-th high-entropy IMF component as an example.
3.2.1. Construct Temporal-Sensitive Fluctuation Graph
First, MGAT transforms high-entropy IMF components from temporal sequences into temporal-sensitive fluctuation graphs, where similarity edges explicitly represent numerical dependencies in electricity consumption fluctuations to integrate temporal correlations and numerical similarities, translating fluctuations into structured correlated graphs. In temporal-sensitive fluctuation graphs, nodes represent electricity consumption value, and edges encode temporal continuity and value-based correlations across two axes: temporal adjacency (event interval regularity, denoted as temporality) and numerical fluctuation magnitude (denoted as numerical) in Formula (8).
In this context, temporality (xi, xj) represents the temporal representations between xi and xj, while Numerical (xi, xj) captures the numerical similarities between these nodes, len is the length of the current sequence, and |i − j| is the temporal distance between xi and xj, which means that longer time intervals diminish the influence of temporal factors. To measure the numerical similarities between xi and xj, MGAT employs cosine similarity.
3.2.2. Construct Temporal Environmental Information Graphs
As previously mentioned, regional electricity consumption patterns experience fluctuations. These patterns are closely tied to regional environmental factors, such as weather conditions and holidays. Changes in environmental factors are important drivers behind the fluctuations in regional electricity consumption. Moreover, the different combinations of these environmental information factors, along with their numerical variations, collectively influence electricity consumption patterns. Commonly used complementary environmental factors include temperature, weather, humidity, holidays, and weekends versus weekdays. These variables are correlated and jointly contribute to the fluctuations in electricity consumption. To model these factors, we, respectively, represent holidays, weekends, weather, weekdays to one-hot encoded vectors using the Bag-of-Words model and combine normalized temperature and humidity into a unified environmental information vector. The use of combined environmental information vectors in this process allows for the integration of the correlations between multiple environmental factors. Subsequently, we construct a graph of environmental information, where each node represents the environmental information vector for a given time slice, and the edges capture the numerical similarity between nodes. The similarity can be calculated as follows:
In this context, c represents the environmental information vector. After obtaining the environmental information graph, we integrate this graph into the corresponding temporal-sensitive fluctuation graph by concatenating the corresponding node features and adding the corresponding edge features, thereby constructing a fusion fluctuation graph.
3.2.3. Construct HGAE for High-Entropy Component Prediction
MGAT proposes a HGAE to jointly capture both numerical correlations and environmental dependencies by using parameterized encoding to model both fluctuation trends and fluctuation magnitudes. This formulation quantifies data variations and characterizes fluctuation in a unified framework, enabling high-entropy component prediction based on the extracted numerical dependency features. The structure of HGAE in MGAT is shown in Figure 2.

Figure 2.
HGAE structure.
As illustrated in Figure 2, we leverage a hierarchical graph attention-based encoder–decoder architecture to extract hierarchical attention features, where the encoder incorporates a hierarchical cosine attention mechanism comprising three core elements: (1) a similarity metric quantifying associations between nodes in the graph, (2) attention coefficients reflecting the differential impacts of input relationships, and (3) aggregated attention features. The decoder subsequently reconstructs attention-enhanced representations by synthesizing these weighted associations. This similarity between two input vectors is calculated as Formula (10):
where Aih represents the h-order neighborhood of node i in the adjacency matrix of graph, SimiMutualij h represents the h-order similarity feature between i and j, P is the learnable weight matrix, and SLN () is a single-layer neural network. Based on this h-order similarity function, h-order attention coefficients are defined as Formula (11):
where αijh is the attention coefficient. HGAE calculates H order’s attention coefficients; then, the attention feature of i can be calculated based on the H order’s attention coefficients as Formula (12):
where V is trainable weights. To enforce learning of fluctuation patterns, we incorporate a graph-constrained reconstruction loss as Formula (13).
where F is the input matrix consisting of f in Formula (10). Building upon the extracted features from the fusion high-entropy graphs, we employ a single-layer neural network to forecast the k-th high-entropy component values, as defined in Formula (14).
where SLNIMF is a simple linear layer neural net, and is the k-th high-entropy component prediction, while there are a total of K high-entropy IMF components.
3.3. Electricity Consumption Forecasting and Anomaly Detection Based on All Components
After the above steps, the final forecasting for the electricity consumption data is calculated by synthetizing the forecasted IMF components, as shown in Formula (15).
For anomaly detection, each electricity consumption data point is assigned a binary label, classifying it as either normal or abnormal. This task is then framed as a classification problem that integrates fluctuation encoding. The accuracy of detection is directly influenced by how well the fluctuations in the electricity data are captured, making it essential to differentiate abnormal consumption from regular fluctuations. To address this, we combine the reconstruction of high-entropy components, which incorporate numerical fluctuation elements, with the model’s prediction results to effectively perform anomaly detection. The model outputs used for anomaly detection are in Formula (16).
where SLPdetection is a simple linear layer neural net with sigmoid as its threshold activation function for anomaly detection. The goal of the anomaly detection task is to minimize the following loss:
Based on the trained model, the final detection result is generated by combining the reconstruction error of the high-entropy components and the classification probability:
For the generalization process on the test data, the model sets a threshold based on the score distribution of normal and abnormal samples in the training set. Scores above the threshold are labeled as abnormal, while scores below the threshold are labeled as normal consumption.
As a multi-task learning framework, in the total training process of MGAT, we construct a loss function based on the reconstruction loss, minimum mean squared error (MSE) loss for anomaly detection, and the MSE loss for predictions, expressed as Formula (19):
where Loss_forecast represents the prediction loss, and Loss_det represents the anomaly detection loss. The loss function is optimized using the Adam method.
4. Research Results
For the electricity consumption anomaly detection, it should be emphasized that this paper does not simply designate a subset of the acquired electricity consumption data as anomalies for detection purposes. Specifically, for the electricity consumption prediction task, the MGAT is trained using the entire dataset with all data points labeled as normal. In contrast, for the anomaly detection, artificially introduced anomalous data points with corresponding labels are incorporated into the dataset. Consequently, the multi-task framework remains inactive during pure prediction tasks, while during anomaly detection, the MGAT simultaneously performs both the anomaly identification and consumption prediction, thereby fully activating the multi-task learning paradigm. This dual-phase approach ensures that the prediction accuracy is maintained for normal data while enabling robust anomaly detection through joint optimization.
4.1. Dataset and Experiment Settings
This paper conducts the experiments using two datasets. All datasets undergo a 0-1 normalization. For the temporal pattern extraction, the 14-day segmentation captures the weekly periodicity, while 7-step sliding windows enable sequential grouping.
- 1.
- The first electricity consumption dataset is obtained from Tetouan in Morocco (Electric Power Consumption https://www.kaggle.com/datasets/fedesoriano/electric-power-consumption, 1 August 2022) (Data_kaggle) [21]. The data consists of 52,416 observations of energy consumption in a 10 min window. Every observation is described by the following feature columns.
- ⮚
- Date Time: Time window of ten minutes.
- ⮚
- Temperature: Weather temperature.
- ⮚
- Humidity: Weather humidity.
- ⮚
- Wind Speed: Wind Speed.
- ⮚
- General Diffuse Flows: “Diffuse flow” is a catchall term to describe low-temperature (<0.2° to ~100 °C) fluids that slowly discharge through sulfide mounds, fractured lava flows, and assemblages of bacterial mats and macrofauna.
- ⮚
- Zone 1 Power Consumption.
- ⮚
- Zone 2 Power Consumption.
- ⮚
- Zone 3 Power Consumption.
The environmental information contains the temperature, humidity, Wind Speed, and diffuse flow. We do not introduce holiday information in this dataset.
- 2.
- The second electricity consumption dataset is obtained from the China Southern Power Grid’s operational jurisdiction (https://pan.baidu.com/s/1b3S-EBYeaiIcNwHGBUtSYw?pwd=ggtv, 5 June 2025) across seven administrative divisions (Data_Southern). The reason for selecting this time period is that it includes the COVID-19 pandemic era, during which the changes in electricity consumption can effectively reflect the model’s predictive and anomaly detection capabilities. The dataset contains the aggregate regional electricity consumption, a three-tier industrial breakdown, and nine granular subsectors spanning manufacturing, logistics, and service industries.
Figure 3 shows the 30-day consumption data in a region of the China Southern Power Grid, including the May Day holiday. The data represents the electricity consumption of the “Manufacturing Industry of Cultural, Educational, Artistic, and Sports Goods” in the region. We can observe that the electricity consumption in this industry is closely related to the May Day holiday period.
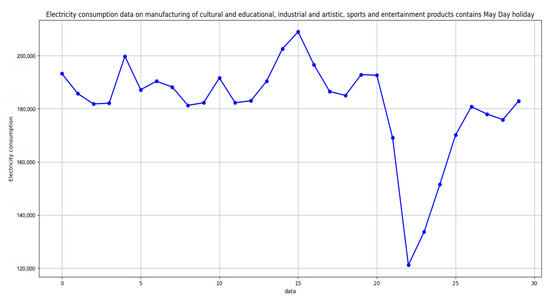
Figure 3.
The 30-day consumption data in an area of the China Southern Power Grid.
- 3.
- For the anomaly detection:
These two datasets serve dual purposes for electricity consumption forecasting and anomaly detection. For forecasting tasks, 20% of the continuous data is allocated as the test set. To evaluate the MGAT’s anomaly detection performance, artificial anomalies are introduced into both the Tetouan and China Southern Power Grid consumption datasets through a standardized protocol: the complete sequence data is collected with anomalies injected at a 20% probability per 7-point segment, where anomalies are generated by adding/subtracting fluctuations equivalent to 10% of the current consumption values—with such perturbed points being labeled as abnormal nodes with binary indicators (0/1). To further assess the model robustness, variations including a 10% anomaly ratio with ±10% fluctuations and a 20% ratio with ±5% fluctuations are implemented. Experimental baselines are subsequently established for comparative benchmarking.
4.2. Baselines
This paper employs a set of benchmark models, categorized into three distinct groups, to evaluate and compare their performance. The first group contains traditional time series models, such as Support Vector Regression (SVR) [15], bidirectional Long Short-Term Memory (Bi-LSTM) networks [8], Genetic Algorithm-based Bidirectional LSTM (GA-BLSTM) [22], and a deep attention-based neural network (Attention) [23]. The second group contains models incorporating time–frequency analysis methods, including DFT-Attention (utilizing Discrete Fourier Transform) and the Multi-Scale Attention model (MS-Attention) [24]. The third group contains models using signal decomposition methods, such as EMD-OSVR, which combines EMD with optimized SVR [16], and EMD-Attention, an advanced model extending EMD with attention mechanisms [25]. These diverse models provide robust frameworks for analysis. In addition to the aforementioned model, this paper also introduces commonly used coding-based anomaly detection models as comparison models, including the VAE-based anomaly detection model [26] and the Hierarchical Graph Attention Autoencoder-based anomaly detection model [27].
The experimental configuration employs a three-layer MSAT architecture with scale factors {1,2}, 200 hidden nodes, and a three-attention-layer Hierarchical Graph Autoencoder, trained under Adam optimization (lr = 1 × 10⁻³). For sequence entropy calculations, the length k of the IMFs is seven. For k-means clustering, we select two centers. The coefficient λ of Loss_ae is 0.01. The compared models which use the graph autoencoder have the same number of layers as the Hierarchical Graph Autoencoder. The scales in MS-Attention are {2,3,5}.
4.3. Validating the Effectiveness of the MGAT
4.3.1. Validating on Data_kaggle
- A.
- Electricity Consumption Prediction
For the electricity consumption prediction, we verify the effectiveness of the MGAT using the Tetouan-Electricity-Consumption data (Data_kaggle). The original electricity consumption sequence and its decomposed IMF components are shown in Figure 4. Table 1 records the prediction results, showing the electricity consumption forecasts for the week.
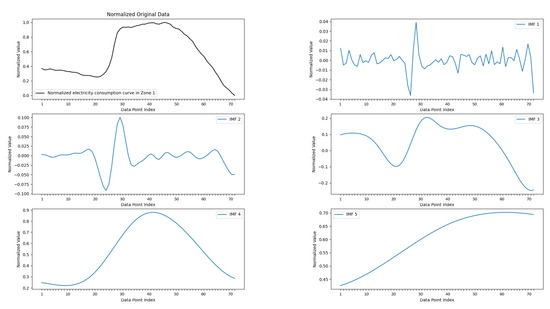
Figure 4.
The distribution of the electricity consumption data and its IMFs on 70 data points of Tetouan-Electricity-Consumption in Zone 1.

Table 1.
Test MSE of electricity consumption in Tetouan-Electricity-Consumption dataset.
The results on the Tetouan-Electricity-Consumption dataset verify the proposed MGAT, achieving the lowest MSE for all zones. While the conventional LSTM and SVR exhibit limited adaptability, decomposition-enhanced methods like EMD-Attention show notable improvements. Notably, the MGAT maintains a robust performance during high fluctuations, suggesting an enhanced capability in modeling both the baseline consumption and consumption spikes. This improved performance can be attributed to the increased fluctuations in electricity consumption, as shown in Figure 4. It should be emphasized that the high-entropy IMFs in the MGAT for this dataset are IMF 1 and IMF 2.
As Figure 4 shows, the low-order IMFs contain more fluctuations, and the high-order IMFs are more smoothing. The forecasted electricity consumption and the original electricity consumption are shown in Figure 5 in Zone 1.
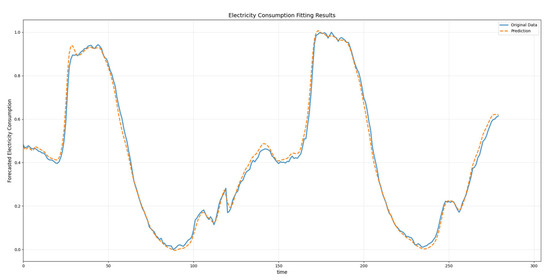
Figure 5.
The forecasted electricity consumption curve in Zone 1.
As illustrated in Figure 5, the model captures the overall trend of the electricity consumption, demonstrating an accurate fitting to actual usage patterns for both broad consumption trends and most fluctuations. Minor deviations occur in fitting localized variations, yet the model maintains a low prediction error level evidenced by consistently small MSE values, which aligns with the quantitative results.
- B.
- Electricity Consumption Anomaly Detection
Building upon these quantitative benchmarks, the model’s anomaly detection capabilities are validated using the Tetouan-Electricity-Consumption dataset (Data_kaggle). This evaluation phase verifies the MGAT’s ability for anomaly detection, leveraging its integrated graph attention mechanism to distinguish between normal operational fluctuations and anomalous electricity consumption patterns. The anomaly detection accuracies are shown in Table 2.

Table 2.
Accuracy of anomaly detection on Tetouan-Electricity-Consumption dataset.
In Table 2, the dual values within the parentheses under accuracy represent the anomaly injection ratio and anomaly magnitude ratio, respectively. As evidenced by the comparative results, a decrease in the anomaly detection capability is observed across models when the fluctuation magnitude diminishes, yet the MGAT maintains a superior performance over alternative models under these conditions. The results on the Tetouan-Electricity-Consumption dataset demonstrate the effectiveness of the proposed EMDCAT model in detecting anomalies. Among the tested models, the MGAT achieves the highest accuracy, showcasing its superior performance in identifying anomalies. GAE-AD and EMD-Attention also perform well, highlighting the potential of graph-based and attention mechanisms in enhancing anomaly detection accuracy. Conversely, the LSTM and SVR show relatively lower performances, suggesting that traditional models may struggle with the complexity of the dataset. DFT-Attention also shows moderate success, leveraging signal processing techniques to enhance anomaly detection.
4.3.2. Validating on Data_Southern
- A.
- Electricity Consumption Prediction
In the following experiments, we show the forecasting performance of the MGAT on the electricity consumption data in both the Tetouan-Electricity-Consumption dataset and the China Southern Power Grid dataset. Figure 6 shows the decomposed IMF components from a particular area of the China Southern Power Grid. It is important to note that the high-entropy IMFs in the MGAT for this dataset are the first-order IMF and the second-order IMF, which significantly contribute to the model’s effectiveness.
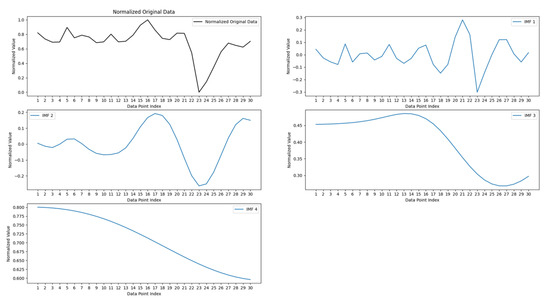
Figure 6.
The distribution of the specific electricity consumption in Data_Southern.
As Figure 6 shows, the low-order IMF is similar to the electricity consumption sequence, and the high-order IMFs are more smoothing. Table 3 shows the global forecasting performance of the MGAT using the electricity consumption data in both the Tetouan-Electricity-Consumption dataset and the China Southern Power Grid dataset. The results are presented in terms of the MSE.

Table 3.
The global MSE of the MGAT model on the two datasets.
As evidenced in Table 3, the MGAT achieves the lowest MSE across both benchmark datasets. Building upon these results, the analysis extends to a localized operational scenario within China’s Southern Power Grid, where the MGAT’s daily forecasting capabilities are tested against region-specific demand patterns. The experimental outcomes, quantified through MSE metrics in Table 4, reveal the MGAT’s exceptional performance with baselines in different regions.

Table 4.
The test MSE of 7 local areas of the China Southern Power Grid.
As demonstrated in Table 4, the proposed MGAT model achieves a superior MSE performance across diverse regional datasets, highlighting its cross-regional adaptability to electricity consumption patterns characterized by heterogeneous proximal periodicities and volatilities. This performance underscores the MGAT’s enhanced capability in data fitting and predictive accuracy compared to conventional electricity consumption forecasting frameworks. The industrial forecasted electricity consumption and the original electricity consumption in Area 1 of Data_Southern are shown in Figure 7.
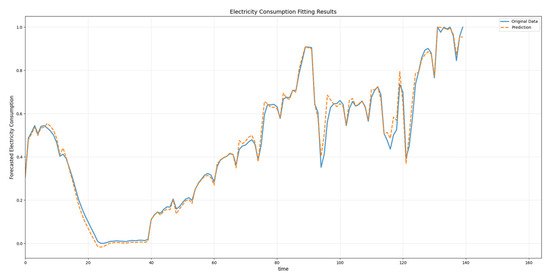
Figure 7.
The forecasted electricity consumption curve in Area 1 of Data_Southern.
As illustrated in Figure 7, despite the inherent volatility in the electricity consumption data, the MGAT algorithm effectively captures both the underlying consumption trends and the magnitude of fluctuations. Furthermore, we access the MGAT’s multi-sector forecasting capabilities within Region 1, specifically targeting industrial, manufacturing, and residential consumption sectors. The experimental results, as detailed in Table 5, validate the model’s performances in resolving sector-specific electricity consumption patterns, particularly in scenarios where consumption patterns exhibit divergent cyclical behaviors and transient fluctuations.

Table 5.
Test MSE for electricity consumption prediction in Area 1 of Data_Southern.
The experimental evaluation across industrial sectors in Region 1 of the Southern Power Grid dataset demonstrates that the MGAT achieves the lowest MSE in five of six sectors, while securing competitive performance in manufacturing and the First Industry. Notably, the MGAT outperforms decomposition-enhanced benchmarks like EEMD-Attention in critical sectors such as residential and service, reflecting its robustness in modeling heterogeneous consumption patterns. While EMD-Attention marginally excels in the First Industry, the MGAT maintains a lower average MSE across all sectors. Traditional methods like SVR and LSTM exhibit significantly higher errors, particularly in residential forecasting. The results underscore the MGAT’s advantages in balancing sector-specific dynamics, particularly its ability to resolve demand variations in energy-intensive sectors like manufacturing while maintaining stability.
The industrial forecasted electricity consumption and the original electricity consumption in Area 1 of Data_Southern are shown in Figure 8.
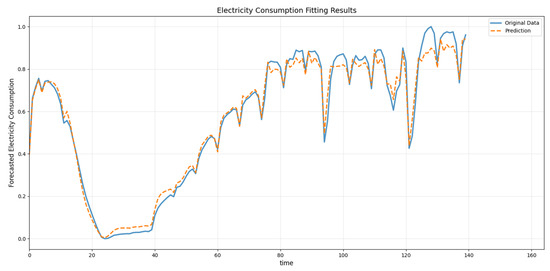
Figure 8.
The industrial forecasted electricity consumption curve in Area 1 of Data_Southern.
As shown in Figure 8, though the electricity consumption data exhibits continuous fluctuations, the MGAT algorithm successfully captures consumption trends; however, observable prediction errors occur in estimating fluctuation magnitudes.
- B.
- Electricity Consumption Anomaly Detection
In the next experiment, we test the anomaly detection capability of the MGAT on the Southern Grid in China dataset, and the test results are shown in the table below.
From Table 6, it can be seen that the proposed MGAT achieves the best accuracy in the electricity consumption anomaly detection task, which validates that the MGAT can effectively distinguish abnormal consumption data from normal consumption data compared to other comparison methods.

Table 6.
The accuracy of the anomaly detection on the Southern Grid in China dataset.
4.4. Ablation Experiments for MGAT
To validate the efficacy of the proposed MGAT framework, we conduct ablation studies targeting its core components: the Multi-Scale Attention Network (MSAT) for low-entropy component processing and the Hierarchical Graph Attention Autoencoder (HGAE) for fluctuation modeling and anomaly detection, where the HGAE integrates a fluctuation graph with hierarchical encoding. Four ablated variants are evaluated: (1) the single-scale MGAT (removing Multi-Scale Attention), (2) multiple-scale MGAT (removing HGAE), (3) MGAT-AE (replacing HGAE with standard autoencoders), (4) MGAT-AttAE (substituting hierarchical encoding with conventional attention mechanisms), and (5) MGAT-Vgprah (only use the fluctuation graphs without using environmental information graphs). These variants are benchmarked against the full MGAT model on two real-world datasets for electricity consumption forecasting and anomaly detection. Experimental results are shown in the following two figures.
As Figure 9 and Figure 10 show, experiments quantify the individual contributions of each architecture to the overall performance. The designed components improve the performances for the electricity consumption forecasting and anomaly detection.
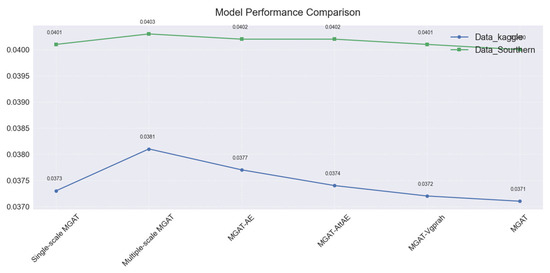
Figure 9.
The ablation MSE for the electricity consumption prediction on the 2 datasets.
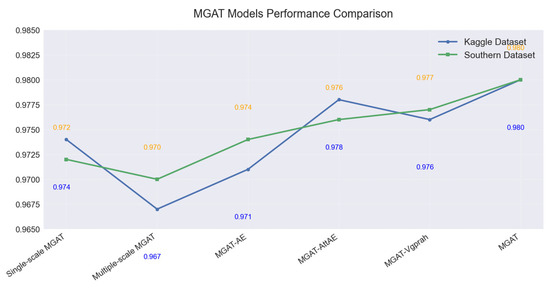
Figure 10.
The ablation accuracy of the anomaly detection on the two datasets.
4.5. Discussion
The experimental results demonstrate that the Multi-Scale Graph Attention Network achieves a superior performance in both the electricity consumption prediction and anomaly detection across diverse datasets, with the model attaining state-of-the-art MSE results (0.0373 for Data_kaggle and 0.0400 for Data_Southern) and an exceptional anomaly detection accuracy, outperforming traditional models (Bi-LSTM/SVR) and decomposition-enhanced benchmarks (EMD-Attention) by 2.9–26.8%, which stems from its multi-scale temporal modeling that captures the weekly periodicity through 14-day segmentation and short-term patterns via 7-step sliding windows, combined with the hierarchical graph attention that effectively processes high-entropy IMF components (first/second-order) for fluctuation modeling, while maintaining a robust performance during high-fluctuation scenarios and demonstrating cross-dataset generalizability across Morocco (Kaggle) and China Southern Grid datasets, with ablation studies confirming the critical contributions of its core components, the Multi-Scale Attention Network and Hierarchical Graph Attention Autoencoder, though minor deviations occur in fluctuation scenarios, positioning the MGAT as a versatile framework for smart grid analytics that balances temporal pattern extraction and anomaly identification through its integrated architecture.
5. Conclusions
This study presents the Multi-Task Graph Attention Network (MGAT), an innovative framework that addresses the dual challenges of electricity consumption forecasting and anomaly detection in smart grids by integrating adaptive signal decomposition, environmental factor modeling, and hierarchical graph attention mechanisms. The MGAT framework demonstrates a superior performance through its ability to simultaneously capture macro-scale quasi-periodicity (via Multi-Scale Attention Network) and micro-scale volatility (via Hierarchical Graph Autoencoder), while incorporating environmental influences via adaptive graph fusion. Experimental results across diverse datasets confirm significant improvements in both the prediction accuracy and anomaly detection performance, outperforming conventional approaches. The success of the MGAT lies in its four key innovations: (1) entropy-based IMF clustering for targeted component processing, (2) temporal–environmental graph fusion for holistic pattern modeling, (3) Multi-Scale Attention for hierarchical feature extraction, and (4) the joint optimization of forecasting and anomaly detection tasks. This work establishes a new paradigm for smart grid analytics that bridges the critical gap between high-accuracy consumption prediction and reliable anomaly identification in complex power systems.
Future research directions will focus on three key areas: (1) enhancing environmental modeling by incorporating dynamic metadata through adaptive graph structures, (2) extending the framework to ultra-high-resolution data and multi-energy systems via heterogeneous graph attention mechanisms, and (3) developing edge-compatible lightweight versions of the MGAT for deployment in resource-constrained smart meters, potentially leveraging quantum-inspired optimization techniques.
Author Contributions
Conceptualization, N.B. and J.Z.; Methodology, N.B., J.Z. and Z.W.; Software, N.B. and J.Z.; Validation, N.B. and J.Z.; Data curation, Z.W.; Writing—original draft, N.B. and J.Z.; Writing—review & editing, J.Z. and Z.W.; Visualization, Z.W. All authors have read and agreed to the published version of the manuscript.
Funding
This work is supported by the General Project of Basic Science Research in Higher Education Institutions in Jiangsu Province (23KJB520008) and the National Natural Science Foundations of China (No. 62206297), the “Qinglan Project” of Jiangsu Higher Education Institutions.
Data Availability Statement
The data supporting this study’s findings are available from the corresponding author, Jian Zhang, upon reasonable request.
Conflicts of Interest
The authors declare no conflicts of interest.
References
- Yildiz, B.; Bilbao, J.I.; Sproul, A.B. A review and analysis of regression and machine learning models on commercial building electricity load forecasting. Renew. Sustain. Energy Rev. 2017, 73, 1104–1122. [Google Scholar] [CrossRef]
- González, A.M.; Roque, A.S.; García-González, J. Modeling and forecasting electricity prices with input/output hidden Markov models. IEEE Trans. Power Syst. 2005, 20, 13–24. [Google Scholar] [CrossRef]
- Munkhammar, J.; van der Meer, D.; Widén, J. Very short term load forecasting of residential electricity consumption using the Markov-chain mixture distribution (MCM) model. Appl. Energy 2021, 282, 116180. [Google Scholar] [CrossRef]
- Velasquez, C.E.; Zocatelli, M.; Estanislau, F.B.; Castro, V.F. Analysis of time series models for Brazilian electricity consumption demand forecasting. Energy 2022, 247, 123483. [Google Scholar] [CrossRef]
- Gomez, W.; Wang, F.K.; Amogne, Z.E. Electricity Load and Price Forecasting Using a Hybrid Method Based Bidirectional Long Short-Term Memory with Attention Mechanism Model. Int. J. Energy Res. 2023, 2023, 3815063. [Google Scholar] [CrossRef]
- Zhang, X.M.; Grolinger, K.; Capretz, M.A.M.; Seewald, L. Forecasting Residential Energy Consumption: Single Household Perspective. In Proceedings of the 17th IEEE International Conference on Machine Learning and Applications, Orlando, FL, USA, 17–20 December 2018. [Google Scholar]
- Imani, M. Electrical load-temperature CNN for residential load forecasting. Energy 2021, 227, 120480. [Google Scholar] [CrossRef]
- Wang, S.; Wang, X.; Wang, S.; Wang, D. Bi-directional long short-term memory method based on attention mechanism and rolling update for short-term load forecasting. Int. J. Electr. Power Energy Syst. 2019, 109, 470–479. [Google Scholar] [CrossRef]
- Torres, J.F.; Martínez-Álvarez, F.; Troncoso, A. A deep LSTM network for the Spanish electricity consumption demand forecasting. Neural Comput. Appl. 2022, 34, 10533–10545. [Google Scholar] [CrossRef]
- Kim, N.; Choi, J. LSTM Based Short-term Electricity Consumption Forecast with Daily Load Profile Sequences. In Proceedings of the IEEE 7th Global Conference on Consumer Electronics, Nara, Japan, 9–12 October 2018. [Google Scholar]
- Zheng, J.; Xu, C.; Zhang, Z.; Li, X. Electric load forecasting in smart grids using Long-Short-Term-Memory based Recurrent Neural Network. In Proceedings of the 51st Annual Conference on Information Sciences and Systems(CISS), Baltimore, MD, USA, 22–24 March 2017. [Google Scholar]
- Yang, Y.; Gao, Y.; Wang, Z.; Li, X.A.; Zhou, H.; Wu, J. Multiscale-integrated deep learning approaches for short-term load forecasting. Int. J. Mach. Learn. Cybern. 2024, 15, 6061–6076. [Google Scholar] [CrossRef]
- Feng, S.; Miao, C.; Xu, K.; Wu, J.; Wu, P.; Zhang, Y. Multi-scale attention flow for probabilistic time series forecasting. IEEE Trans. Knowl. Data Eng. 2023, 36, 2056–2068. [Google Scholar] [CrossRef]
- Xu, A.; Guo, Y.; Wu, T.; Wang, X.; Jiang, Q.; Zhang, Y. Household Electricity Consumption Forecast Based on Bi—LSTM. Ind. Control. Comput. 2020, 33, 11–13. [Google Scholar]
- Dedinec, A.; Filiposka, S.; Dedinec, A.; Kocarev, L. Deep belief network based electricity load forecasting: An analysis of Macedonian case. Energy 2016, 115, 1688–1700. [Google Scholar] [CrossRef]
- Tsai, C.L.; Chen, W.T.; Chang, C.S. Polynomial-Fourier series model for analyzing and predicting electricity consumption in buildings. Energy Build. 2016, 127, 301–312. [Google Scholar] [CrossRef]
- Gashler, M.; Ashmore, S. Modeling time series data with deep Fourier neural networks. Neurocomputing 2016, 188, 3–11. [Google Scholar] [CrossRef]
- Liu, X.; Li, S.; Gao, M. A discrete time-varying grey Fourier model with fractional order terms for electricity consumption forecast. Energy 2024, 296, 131065. [Google Scholar] [CrossRef]
- Imani, M.; Ghassemian, H. Lagged Load Wavelet Decomposition and LSTM Networks for Short-Term Load Forecasting. In Proceedings of the 4th International Conference on Pattern Recognition and Image Analysis, Tehran, Iran, 6–7 March 2019. [Google Scholar]
- Chang, S.; Zhang, Y.; Han, W.; Yu, M.; Guo, X.; Tan, W.; Cui, X.; Witbrock, M.; Hasegawa-Johnson, M.; Huang, T.S. Dilated Recurrent Neural Networks. Annu. Conf. Neural Inf. Process. Syst. 2017, 1, 77–87. [Google Scholar]
- Available online: https://www.kaggle.com/datasets/fedesoriano/electric-power-consumption (accessed on 1 August 2022).
- Zhen, H.; Niu, D.; Wang, K.; Shi, Y. Photovoltaic Power Forecasting Based on GA improved Bi-LSTM in Microgrid without Meteorological Information. Energy 2021, 231, 120908. [Google Scholar] [CrossRef]
- Ma, Z.; Mei, G. A hybrid attention-based deep learning approach for wind power prediction. Appl. Energy 2022, 323, 119608. [Google Scholar] [CrossRef]
- Liu, Y.; Guan, L.; Hou, C.; Han, H.; Liu, Z.; Sun, Y.; Zheng, M. Wind Power Short-Term Prediction Based on LSTM and Discrete Wavelet Transform. Appl. Sci. 2019, 9, 1108. [Google Scholar] [CrossRef]
- Meng, Z.; Xie, Y.; Sun, J. Short-term load forecasting using neural attention model based on EMD. Electr. Eng. 2022, 104, 1857–1866. [Google Scholar] [CrossRef]
- Wang, Z.; Pei, C.; Ma, M.; Wang, X.; Li, Z.; Pei, D.; Rajmohan, S.; Zhang, D.; Lin, Q.; Zhang, H.; et al. Revisiting vae for unsupervised time series anomaly detection: A frequency perspective. Proc. ACM Web Conf. 2024, 2024, 3096–3105. [Google Scholar]
- Wu, J.; Zhang, H.; Qiang, M. An attention graph stacked autoencoder for anomaly detection of electro-mechanical actuator using spatio-temporal multivariate signal. Chin. J. Aeronaut. 2024, 37, 506–520. [Google Scholar]
Disclaimer/Publisher’s Note: The statements, opinions and data contained in all publications are solely those of the individual author(s) and contributor(s) and not of MDPI and/or the editor(s). MDPI and/or the editor(s) disclaim responsibility for any injury to people or property resulting from any ideas, methods, instructions or products referred to in the content. |
© 2025 by the authors. Licensee MDPI, Basel, Switzerland. This article is an open access article distributed under the terms and conditions of the Creative Commons Attribution (CC BY) license (https://creativecommons.org/licenses/by/4.0/).