
A Machine-Learning-Based Data Science Framework for Effectively and Efficiently Processing, Managing, and Visualizing Big Sequential Data †


Abstract
1. Introduction
- Severe Acute Respiratory Syndrome outbreak (SARS) in 2003, which was caused by a coronavirus (CoV), associated with SARS;
- Swine flu outbreak, which was caused by influenza A (A/H1N1) and led to a pandemic from 2009 to 2010;
- MERS-CoV caused Middle East Respiratory Syndrome (MERS). This disease was predominantly present in the Middle East (e.g., Saudi Arabia) from 2012 until 2018, while in 2015, a notable occurrence of MERS was reported in South Korea;
- Zika virus disease was primarily transmitted by the bite of an infected mosquito. An outbreak was reported in Brazil during 2015–2016;
- SARS-CoV-2 caused coronavirus disease 2019 (COVID-19), which was initially reported in early 2020. This outbreak swiftly escalated into a worldwide pandemic.
- Volume and Velocity: the continuous inflow of temporal data (e.g., daily COVID-19 reports) results in high-volume and high-frequency updates that require scalable processing mechanisms.
- Heterogeneity and Integration: epidemiological data come from diverse sources (e.g., public health agencies, and hospitals), often in varied formats and structures, necessitating robust integration strategies.
- High Dimensionality: the presence of multiple co-occurring features (e.g., age, hospitalization, transmission method) calls for advanced techniques in pattern mining and dimensional reduction.
- Temporal Complexity: capturing the temporal evolution of patterns demands methods capable of both aggregating over time and preserving chronological nuances.
- Visualization Bottlenecks: conventional tools struggle with rendering and interpreting large-scale patterns over time.
1.1. Research Questions and Objectives
1.2. Key Research Contributions
- We initiate by presenting a comprehensive overview of the context, background, and motivation that inspired us to conduct this research;
- We also provide a detailed state-of-the-art analysis, which allows us to provide a comprehensive vision of the most pertinent work related to our research;
- We demonstrate a working methodology of our proposed framework that clearly shows its anatomy and functionalities;
- We illustrate a case study along with a reference architecture where our approach can be practically employed to analyze and visualize COVID-19 sequential data;
- We conduct a rigorous experimental evaluation and analysis of real-life Canadian COVID-19 data to ensure the effectiveness and reliability of the proposed framework in handling and analyzing large-scale and real-life sequential data.
1.3. Paper Organization
2. Related Work
- Lack of multidimensional modelling: Reference works do not introduce powerful multidimensional modelling during the data modelling/processing phase, thus losing the power of multidimensional, intuitive spaces that are able to capture multiple aspects of the investigated target big data domains;
- Lack of supervised learning metaphors combined with multidimensional hierarchies: Out of the addressed solutions, no one proposes the innovative idea of combining supervised learning metaphors with multidimensional hierarchies to strengthen the overall expressive power of the surrounding mining process;
- Lack of comprehensive combination with authoritative visualization tools: Combination of multidimensional modelling, multidimensional supervised learning, and visualization tools is yet another relevant gap in the actual literature, especially when applied to real-life case studies.
3. Background Analysis
3.1. Processing and Mining Big Sequential Data with Multidimensional Metaphors
3.2. Visualization and Big Data Characteristics
- Volume relates to the enormous quantity of data generated from diverse sources, necessitating scalable visualization techniques capable of summarizing and filtering vast information.
- Velocity reflects the high speed at which data are produced and must be analyzed, which requires visualization tools to support real-time or streaming data representation.
- Variety encompasses the heterogeneity of data formats—including structured, semi-structured, and unstructured data, which demands adaptable visualization methods.
- Veracity refers to data uncertainty and quality issues; visual analytics can help detect anomalies, inconsistencies, or gaps in datasets.
- Value signifies the meaningful insights derived from data; visualization plays a critical role in uncovering hidden correlations, patterns, and actionable knowledge.
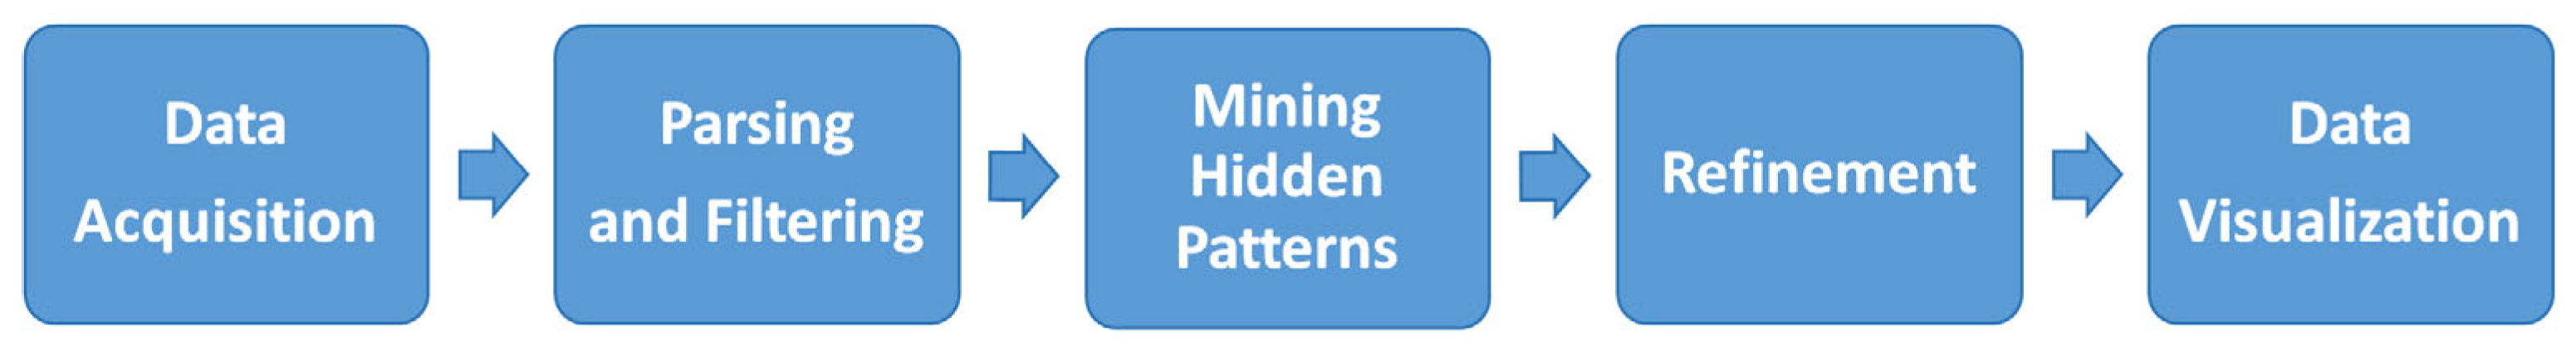
3.3. Big Data Visualization Process
- Data Acquisition: This initial step involves collecting raw data from a wide range of sources such as sensors, transaction logs, and social media platforms (e.g., [70]). Data can be often unstructured or semi-structured, which necessitates transformation into a consistent format suitable for further analysis.
- Parsing and Filtering: The acquired data undergo parsing to convert them into a structured format. Filtering is then applied to remove noise, inconsistencies, and irrelevant elements, ensuring that only high-quality and relevant data are retained for further processing.
- Mining Hidden Patterns: In this phase, advanced data mining techniques (e.g., [71,72]) are used to extract meaningful patterns, associations, and trends from the cleaned data. These hidden patterns form the foundation for insight generation and serve as the analytical core of the visualization process.
- Refinement: The extracted patterns are then refined through operations such as dimensionality reduction, normalization, and contextual enrichment. This step enhances the clarity and interpretability of data, preparing them for effective visual representation.
- Data Visualization: The final step involves representing the refined data through various visual formats such as charts, graphs, heatmaps, and dashboards. The goal is to convey complex insights in an intuitive and accessible manner, allowing users to explore relationships, detect trends, and support data-driven decision-making.
3.4. Big Data Visualization Methods
- Tree Map involves the visualization of hierarchical data by representing them as a series of nested rectangles. An algorithm known as a tiling algorithm (e.g., [73]) partitions the initial parent rectangle into sub-rectangles to illustrate hierarchy. This technique is particularly useful when sequential data exhibit hierarchical categorization, such as web traffic logs grouped by domain and subdomain over time (e.g., [74]). However, it may not be ideal for visualizing precise time-dependent trends due to its static, space-filling layout. Tree maps can handle zero and negative values effectively and are suitable when space optimization and category comparison are crucial [75].
- Circle Packing serves as an alternative technique for hierarchical data visualization, utilizing nested circles instead of rectangles. While less space-efficient than tree maps, it can be used in interactive dashboards where aesthetics and intuitive groupings are prioritized, for example, in visual storytelling of sequential data from social media engagement grouped by topic. Like tree maps, it is more suited to structural overviews than detailed sequential trends.
- Parallel Coordinates are employed for visualizing large-scale and multivariate datasets, especially when data contain sequential records with multiple attributes evolving over time, such as financial data. This visualization technique allows for the observation of inter-variable relationships by mapping each attribute to a vertical axis. It is particularly useful when identifying correlations and trends across high-dimensional sequential data, although it suffers from over-plotting when data volume is very high, and it is less effective for categorical data [76].
- Stream Graph is suitable for visualizing the temporal evolution of values across multiple categories, making them highly suitable for sequential big data. For example, stream graphs are effective in displaying how the popularity of various search terms, product categories, or website traffic sources change over time. The flowing, organic shapes support an intuitive reading of rise and fall trends, although fine-grained comparisons can be challenging due to distortion in stream widths [77].
- Time Curves: This technique transforms sequential data into a 2D spatial layout using temporal distance as a guiding metric (e.g., [78]). They are effective for detecting co-occurrence and temporal clusters in sequences such as user behavior logs and system events.
- Arc Diagrams: This technique is useful when identifying repetitions and patterns in sequences; arc diagrams (e.g., [79]) represent data items along a horizontal axis with arcs connecting related items. This technique is effective for text or DNA sequence analysis, but may not be suitable for large-scale datasets.
- Visual Analytics Dashboards: In real-time monitoring systems (e.g., [80]), such as stock markets and IoT sensor networks, animated transitions help track changes dynamically, supporting continuous user engagement and temporal coherence.
- Virtual Reality-Based Visualization: Tools like Space Titans 2.0 enable users to immerse themselves in multidimensional, evolving datasets. These tools are particularly promising for exploratory analysis of high-dimensional and spatially distributed sequential data, such as climate simulations or astrophysical data (e.g., [81]).
3.5. Big Data Visualization Challenges
- utilizing pre-computed data;
- implementing parallel processing and rendering techniques;
- integrating predictive middleware.
- Visual Noise: high similarity among data objects complicates visual differentiation;
- Information Loss: simplifying visual output for faster rendering can omit critical insights;
- Perception of Large Images: physical and cognitive limitations affect users’ ability to interpret dense visual content;
- High Rate of Image Change: the rapid visual updates can hinder user comprehension and reaction;
- High-Performance Requirements: dynamic visualization demands low-latency performance, which static tools often fail to provide.
3.6. Big Data Visualization Tools
- Tableau: This tool addresses the challenge of interactivity and user responsiveness by providing real-time, dynamic dashboards that allow users to zoom, filter, and drill down into large datasets. It reduces visual noise and information overload by enabling custom filtering and aggregation. While it supports structured data well, integration with external analytics helps extend its utility to more complex modeling tasks involving semi-structured data, partially mitigating data heterogeneity issues. Its speed and adaptability also contribute to latency mitigation.
- Microsoft Power BI: Power BI enhances accessibility and scalability by supporting more than 60 data sources and integrating seamlessly with enterprise tools such as MS Office and SQL Server. Its natural language querying directly addresses the usability challenge by lowering the barrier for non-technical users. By allowing the execution of R scripts, it also contributes to advanced analytics and model integration, enabling richer insights without compromising performance.
- Plotly 6.2.0: Designed with a developer-centric approach, Plotly is particularly adept at producing high-dimensional and multi-modal visualizations, including 3D and multi-axis charts, thereby tackling the problem of dimensionality and dense visualizations. The availability of offline modes and private Cloud deployment helps ensure data security and low-latency rendering, especially in restricted environments. Its integration with environments like Jupyter Notebooks also facilitates real-time exploration and prototyping, aligning well with interactive exploratory analysis goals.
- Gephi 0.10.1: Specifically built for network-based visualizations, Gephi addresses the scalability and complexity challenges posed by large, relational datasets. Its GPU-accelerated 3D engine enables real-time interaction with extensive graph structures, directly confronting the performance bottlenecks often seen in traditional visualization tools. Its ability to render dynamic data over time also supports the visual perception and temporal change rate challenges.
- Excel 2021: Though traditionally a spreadsheet tool, Excel has evolved to handle semi-structured data through its Power Query and Cloud integration features. By enabling connections to systems like Hadoop Distributed File System (HDFS) and Software as a Service (SaaS) platforms, Excel supports basic big data processing and interactive visualization, particularly for business users. Its ease of use and familiar interface help mitigate cognitive load and usability barriers, although it is best suited for medium-scale datasets.
3.7. Visualization and Visual Analytics Application on COVID-19 Data
- Frequent patterns are best represented visually through lattice representation [99]. With it, frequent patterns are represented as nodes in a lattice (a concept hierarchy). Edges connect immediate supersets and subsets of a frequent pattern;
- Using pixels as the representation, a frequent -itemset (a pattern consisting of items) is represented by a pixel [100];
- Linear visualization, in which frequent patterns are represented linearly. For example, a frequent -itemset in a polyline is represented by FIsViz [101], which connects nodes in a two-dimensional space. Rather than representing frequent patterns in an orthogonal diagram (i.e., a wiring-type diagram), FpVAT [26] represents them as frequent patterns;
- Tree visualization, in which frequent patterns are represented according to a tree hierarchy. For example, frequent patterns with a side-view of the pyramid are shown by PyramidVizi [102], which puts short patterns on the bottom of the pyramid and longer related patterns (e.g., extensions of short patterns) on the top. Likewise, FpMapViz [103], which shows frequent patterns by overlaying related patterns over shorter patterns, shows frequent patterns in the foreground and background.
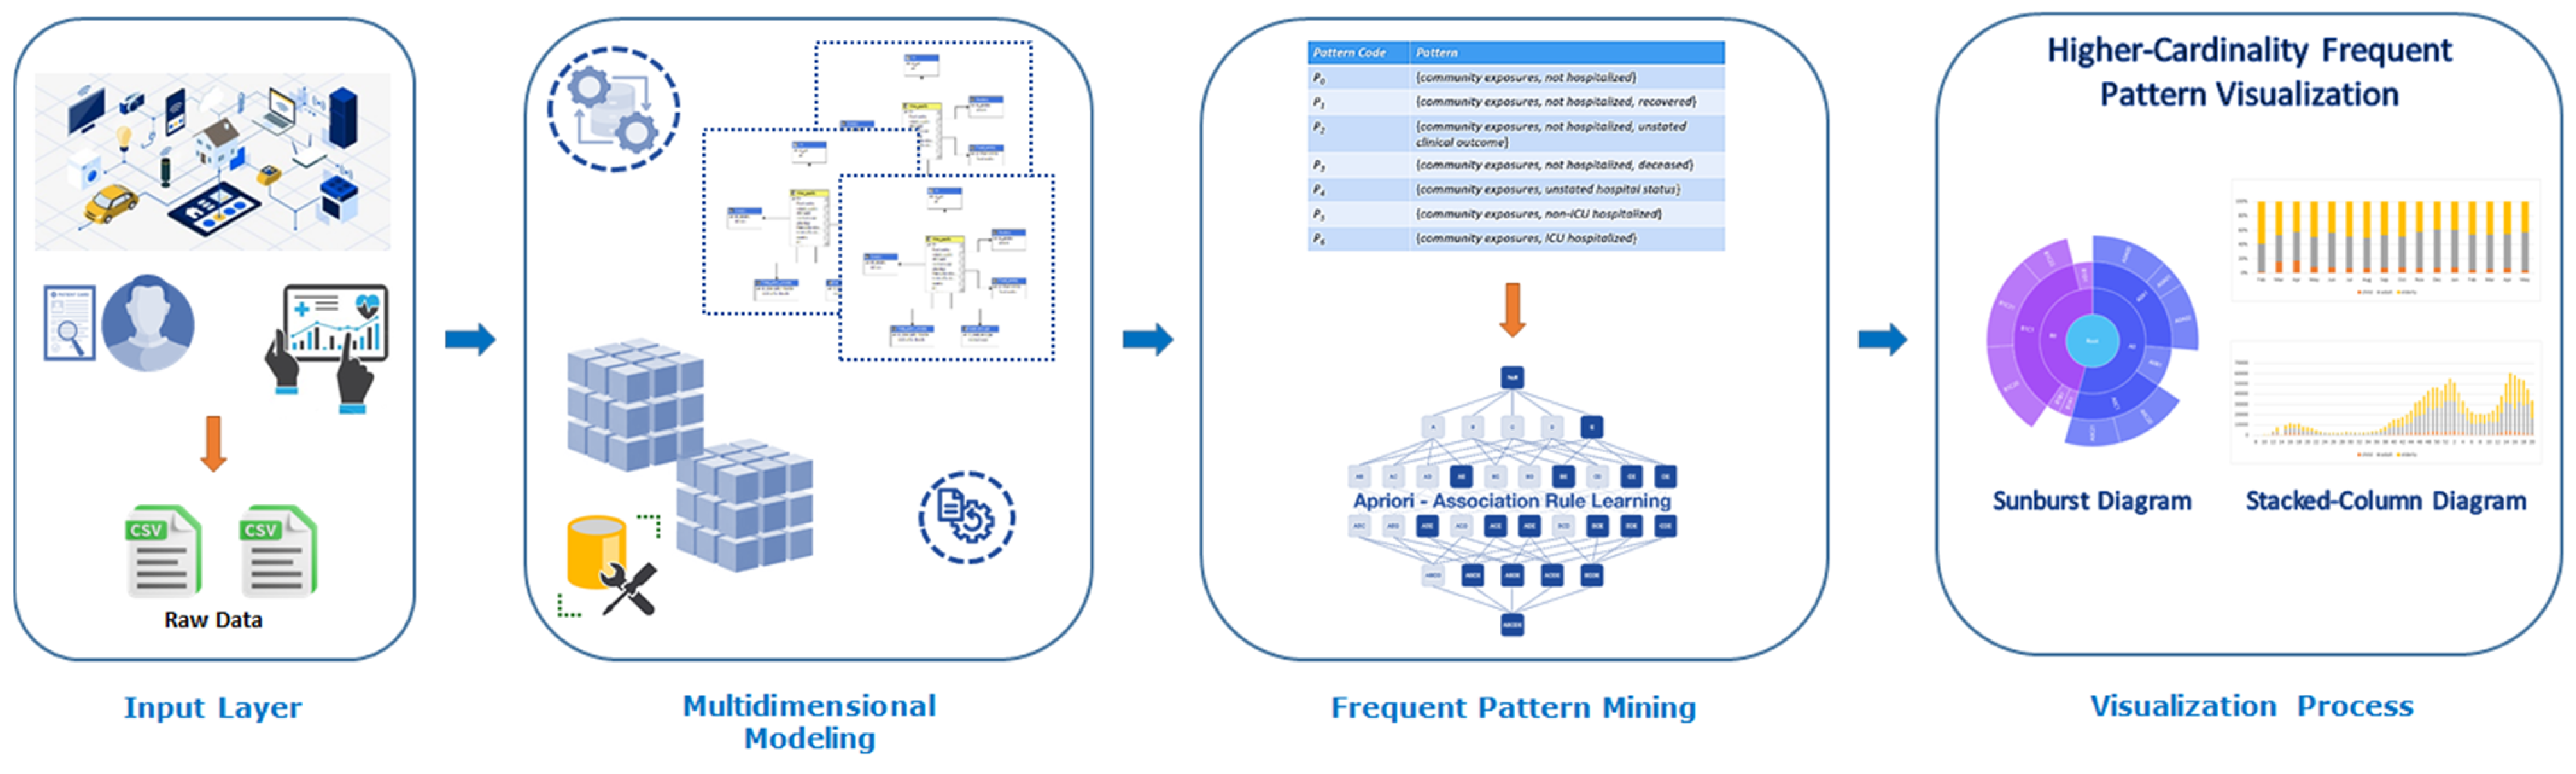
4. An Innovative Data Science Approach for Supporting Visual Big Data Analytics over Big Sequential Data Effectively and Efficiently
4.1. Data Collection and Integration
4.2. Data Processing and Multidimensional OLAP Modeling
| Algorithm 1. MultidimensionalModeling |
| Input Dataset . |
| Output OLAP Data Cube . |
| Begin new ; null; ; ; M ← identifyMeasures(R_pre ) for () do ; end for ; return ; End |
4.3. Frequent Pattern Mining
4.4. Visualization and Interpretation
| Algorithm 2. FrequentPatternMining |
| Input OLAP Data Cube , Minimum Support Threshold . |
| Output Frequent Pattern Set . |
| Begin null; ; ; ; while () do ; for () do Ct ← getSubset(C_k,t) for () do count[c] ← count[c] + A.measure(t) end for end for ; ; ; end while return ; End |
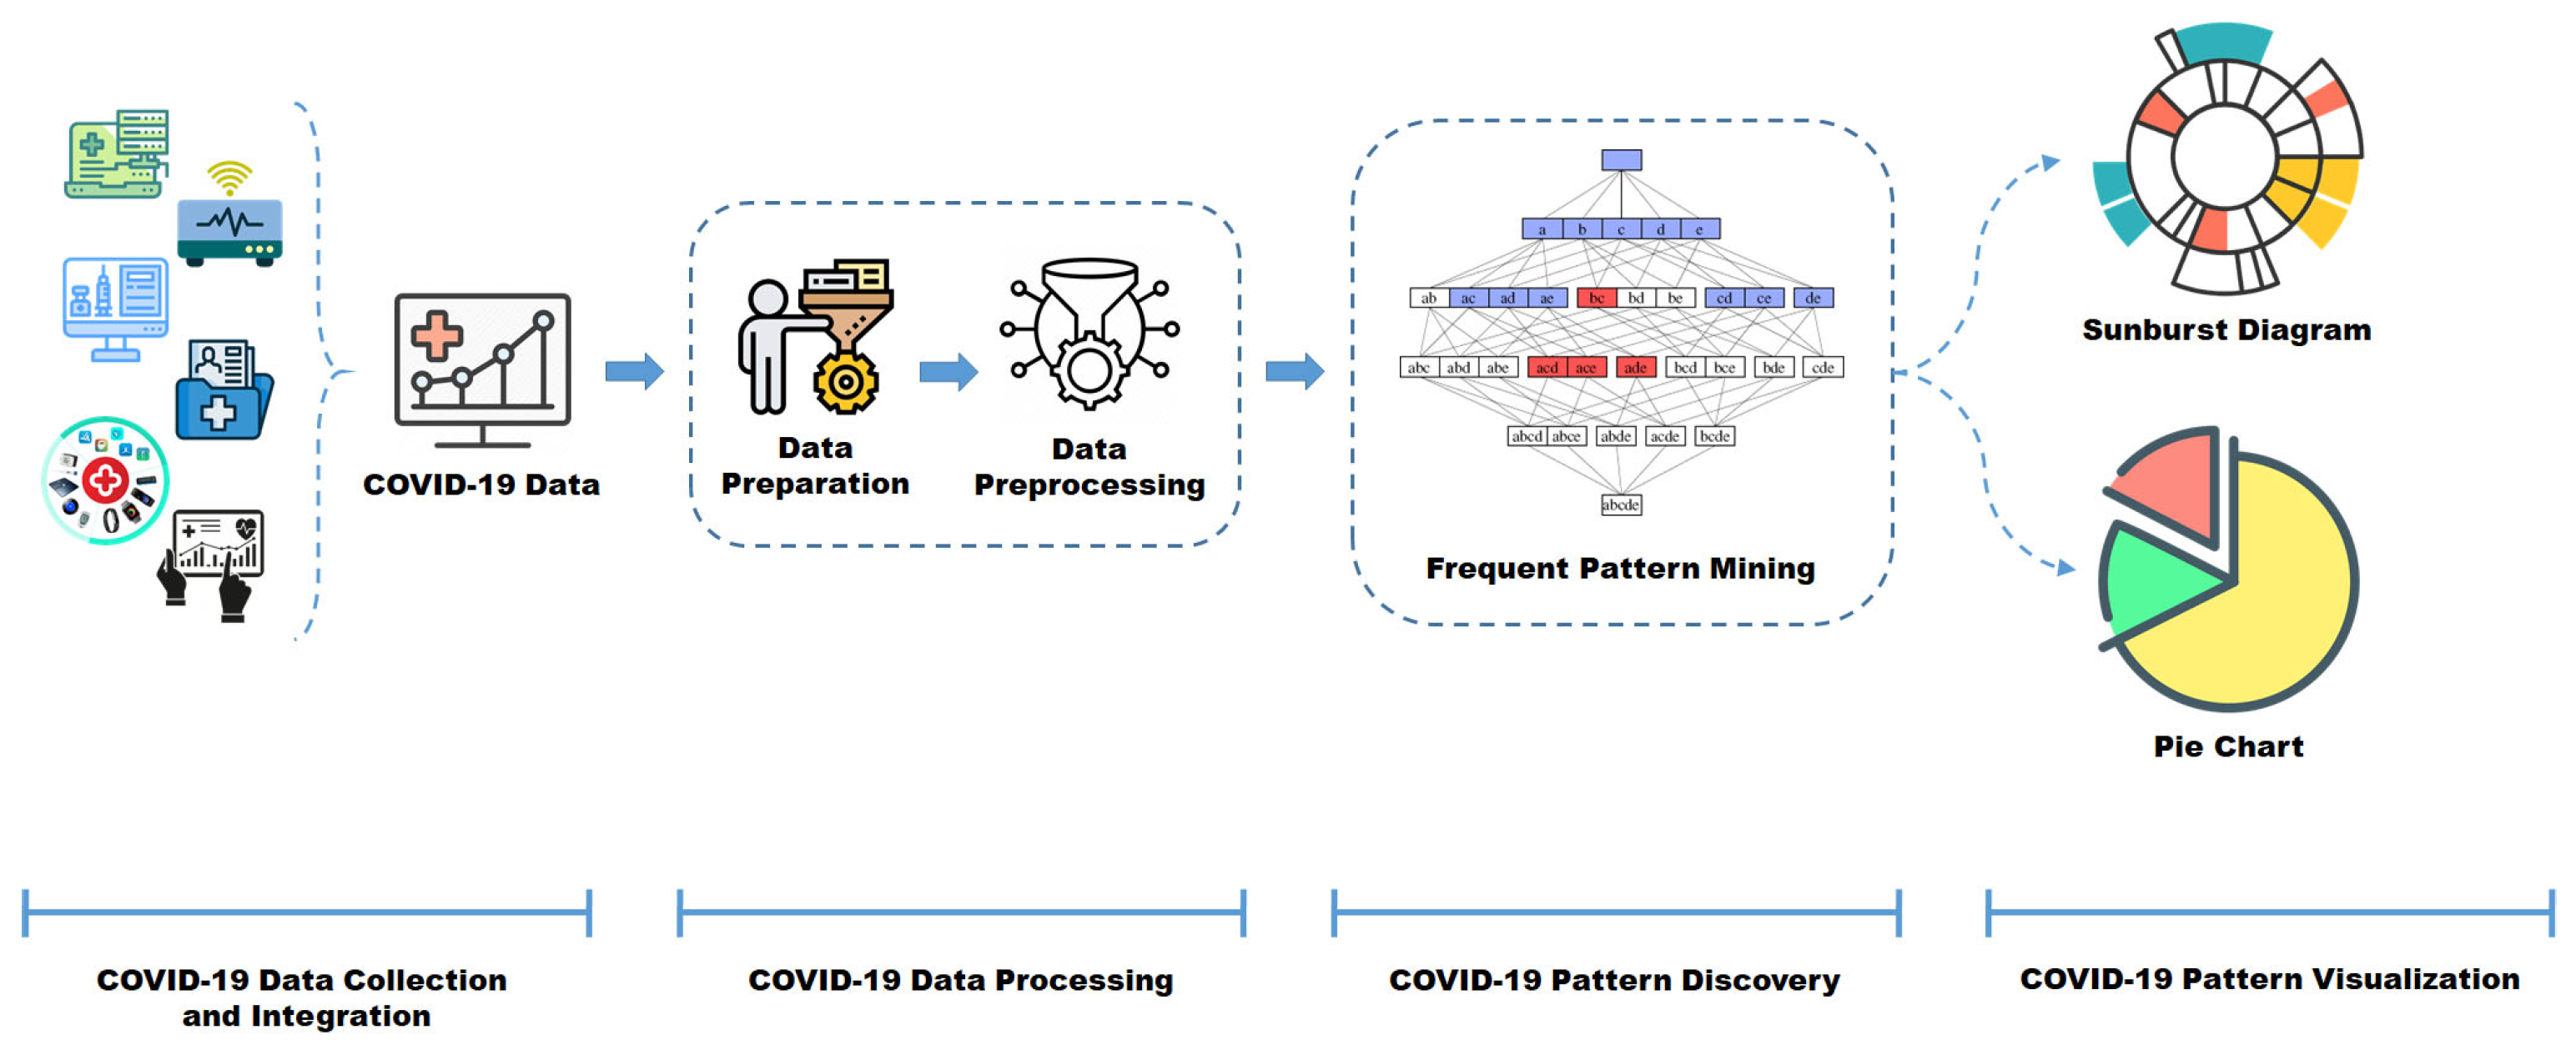
5. Case Study: Big COVID-19 Data Analysis
- COVID-19 Data Collection and Integration: This layer addresses the intricate task of aggregating COVID-19 data originating from diverse and heterogeneous sources;
- COVID-19 Data Processing: Serves as the center wherein data undergoes modeling in a multidimensional structure. The data are meticulously processed based on derived dimensions and measures, laying the groundwork for subsequent elaboration and analysis within the subsequent analytical layer. The initial phase in this process is data preparation, involving the meticulous selection of optimal data samples after an exhaustive data review. Data pre-processing becomes imperative to refine data quality, requiring appropriate transformations to enhance the efficacy of data modeling [111,112];
- COVID-19 Data Pattern Discovery: This layer constitutes the primary component of the architectural framework, serving as the front-end layer where the primary objective of big data analytics is executed. This layer encompasses several integral components, including the Frequent Pattern Mining Component and supervised Learning Component: These components aid in the ultimate prediction of clinical patterns, leveraging the insights garnered from the frequent pattern mining process to generate conclusive predictions regarding COVID-19-related clinical patterns;
- COVID-19 Data Pattern Visualization: This crucial segment emphasizes the facilitation of visualization techniques aimed at presenting intricate frequent patterns. It particularly focuses on scenarios involving datasets with high-cardinality attributes or values, ensuring an enhanced visualization of discovered patterns within the COVID-19 dataset.
5.1. Big COVID-19 Data Collection and Integration
5.2. Big COVID-19 Data Processing
5.3. Big COVID-19 Data Pattern Discovery
- Deep Learning Models: deep learning (DL) models offer intricate pattern recognition capabilities beneficial for tasks such as Convolutional Neural Networks (CNNs) for radiographic image analysis (e.g., [141]), Natural Language Processing (e.g., [142]), and LSTM for time series forecasting (e.g., [143]) within COVID-19 data;
5.4. Big COVID-19 Data Pattern Visualization
6. Experimental Assessment and Analysis
7. Discussion and Remarks
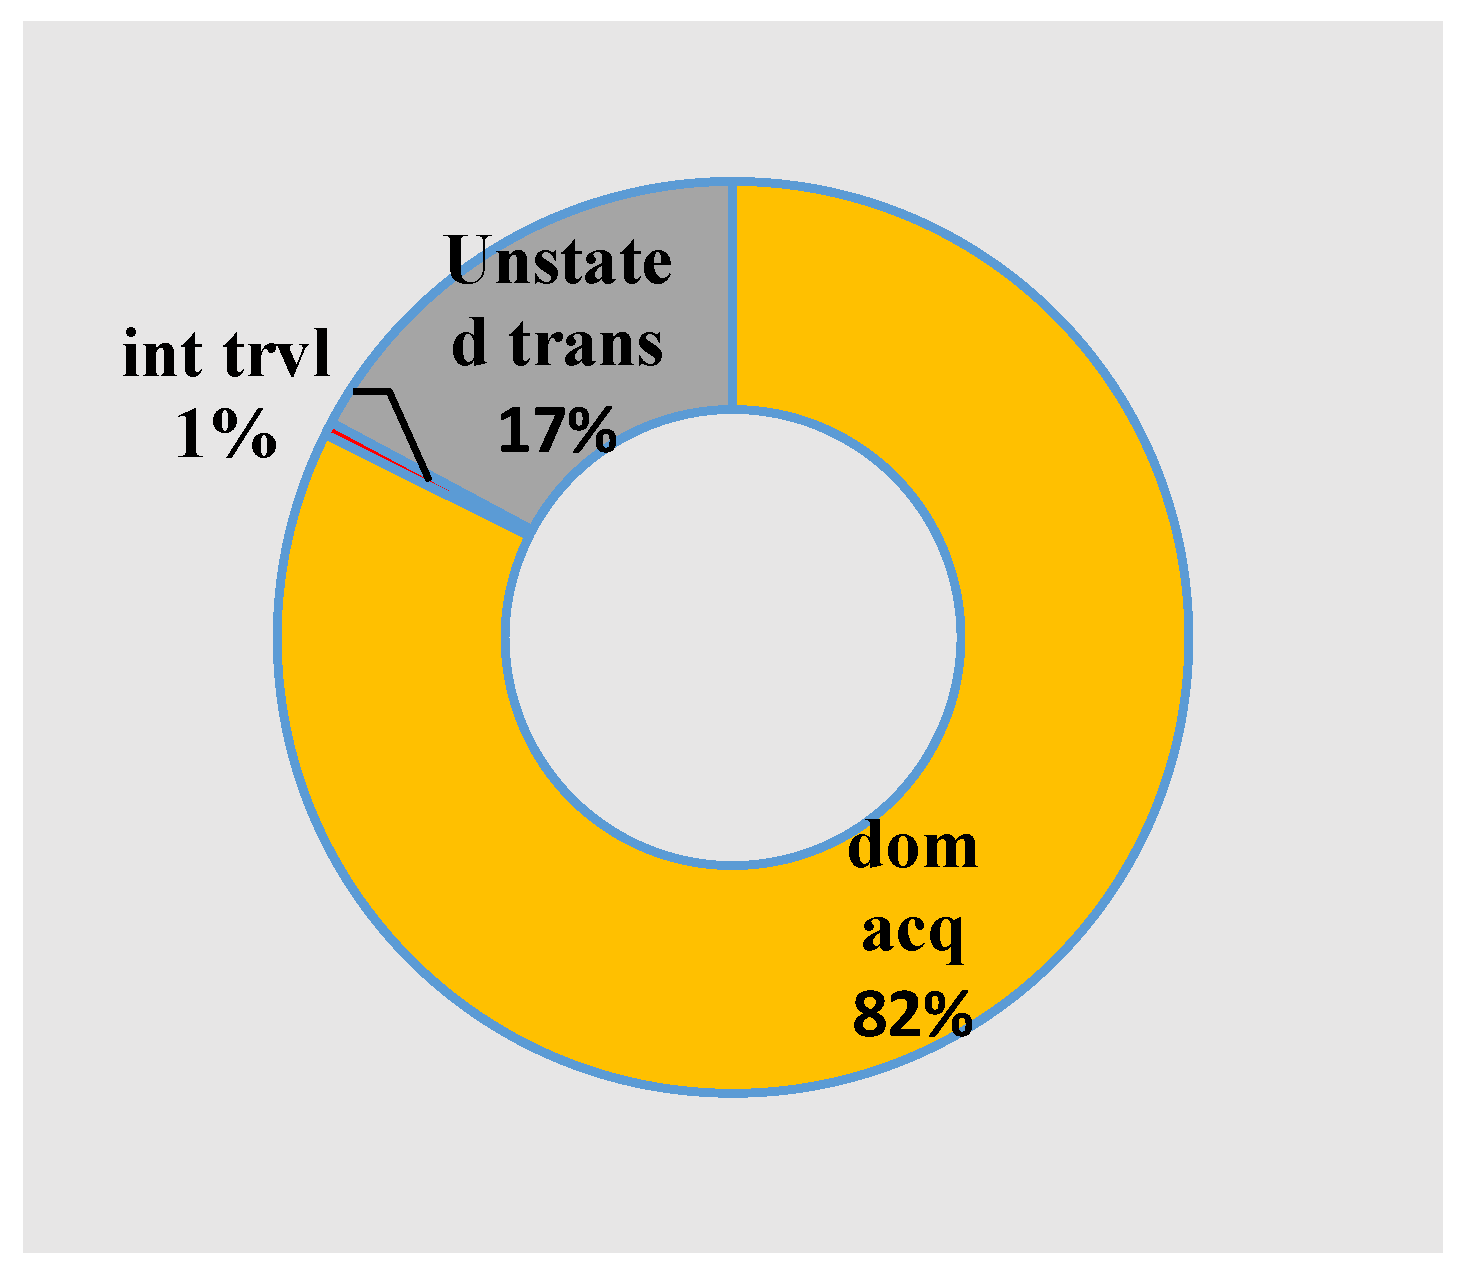
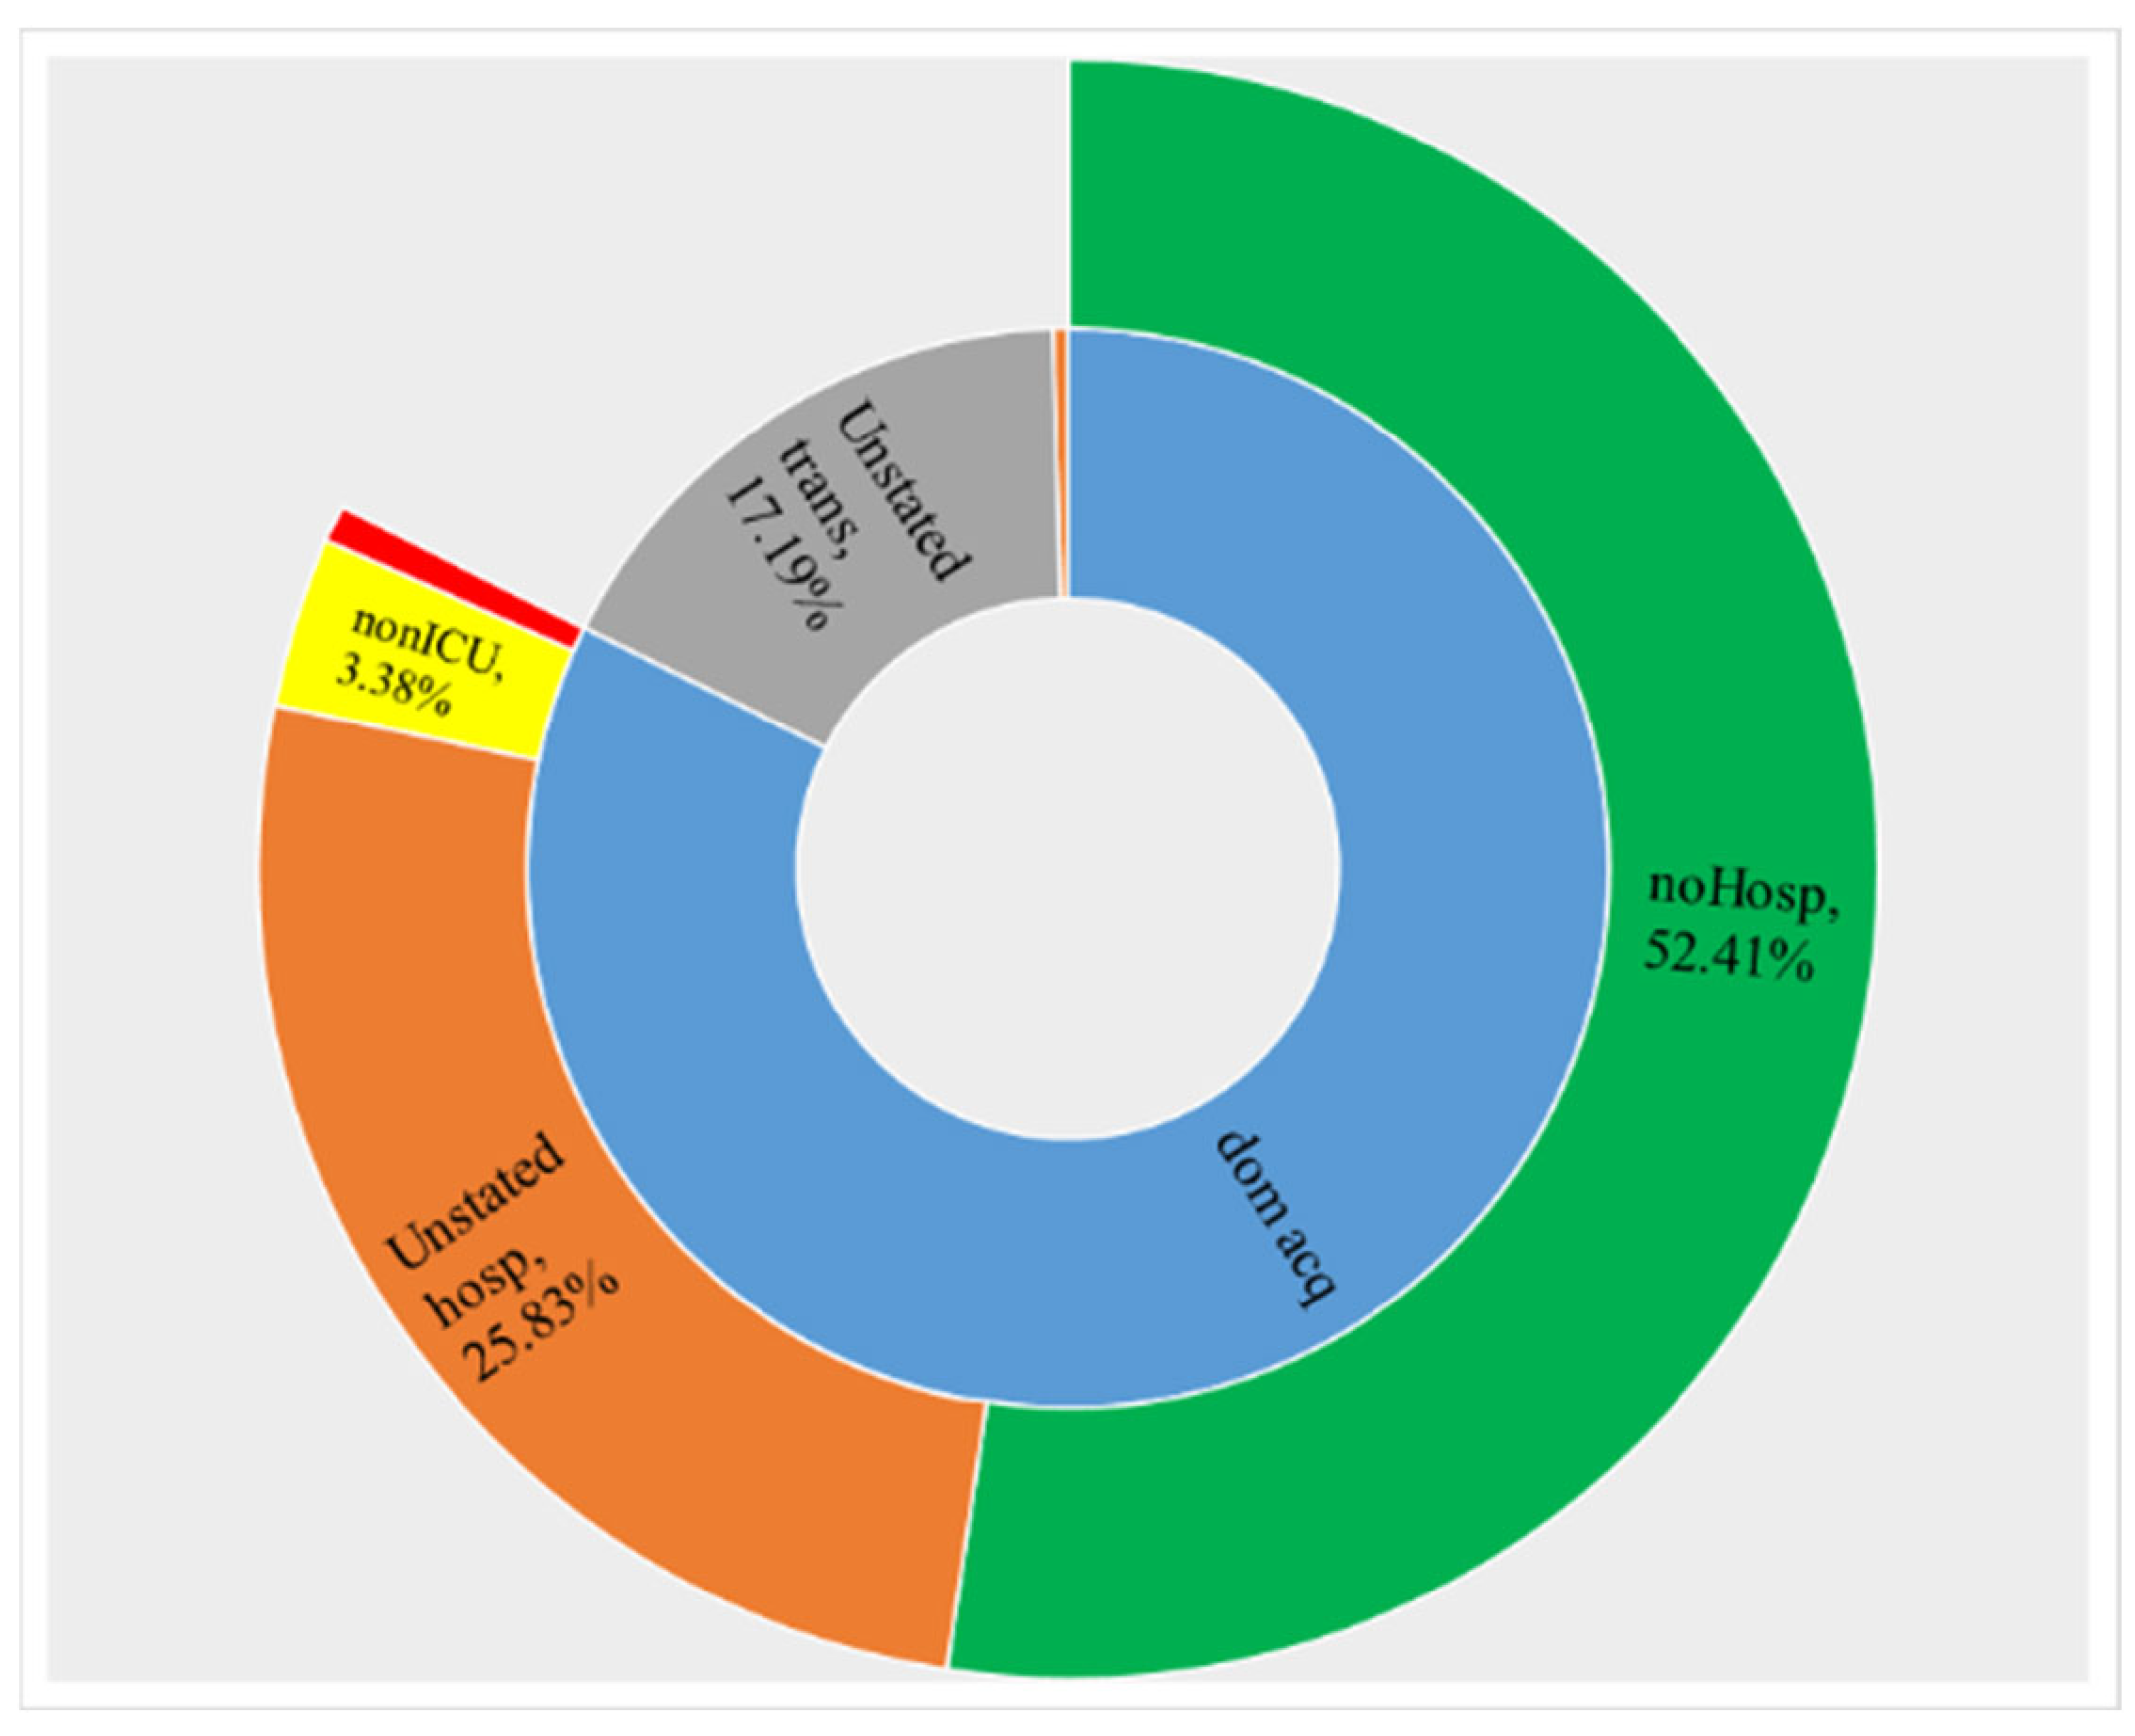
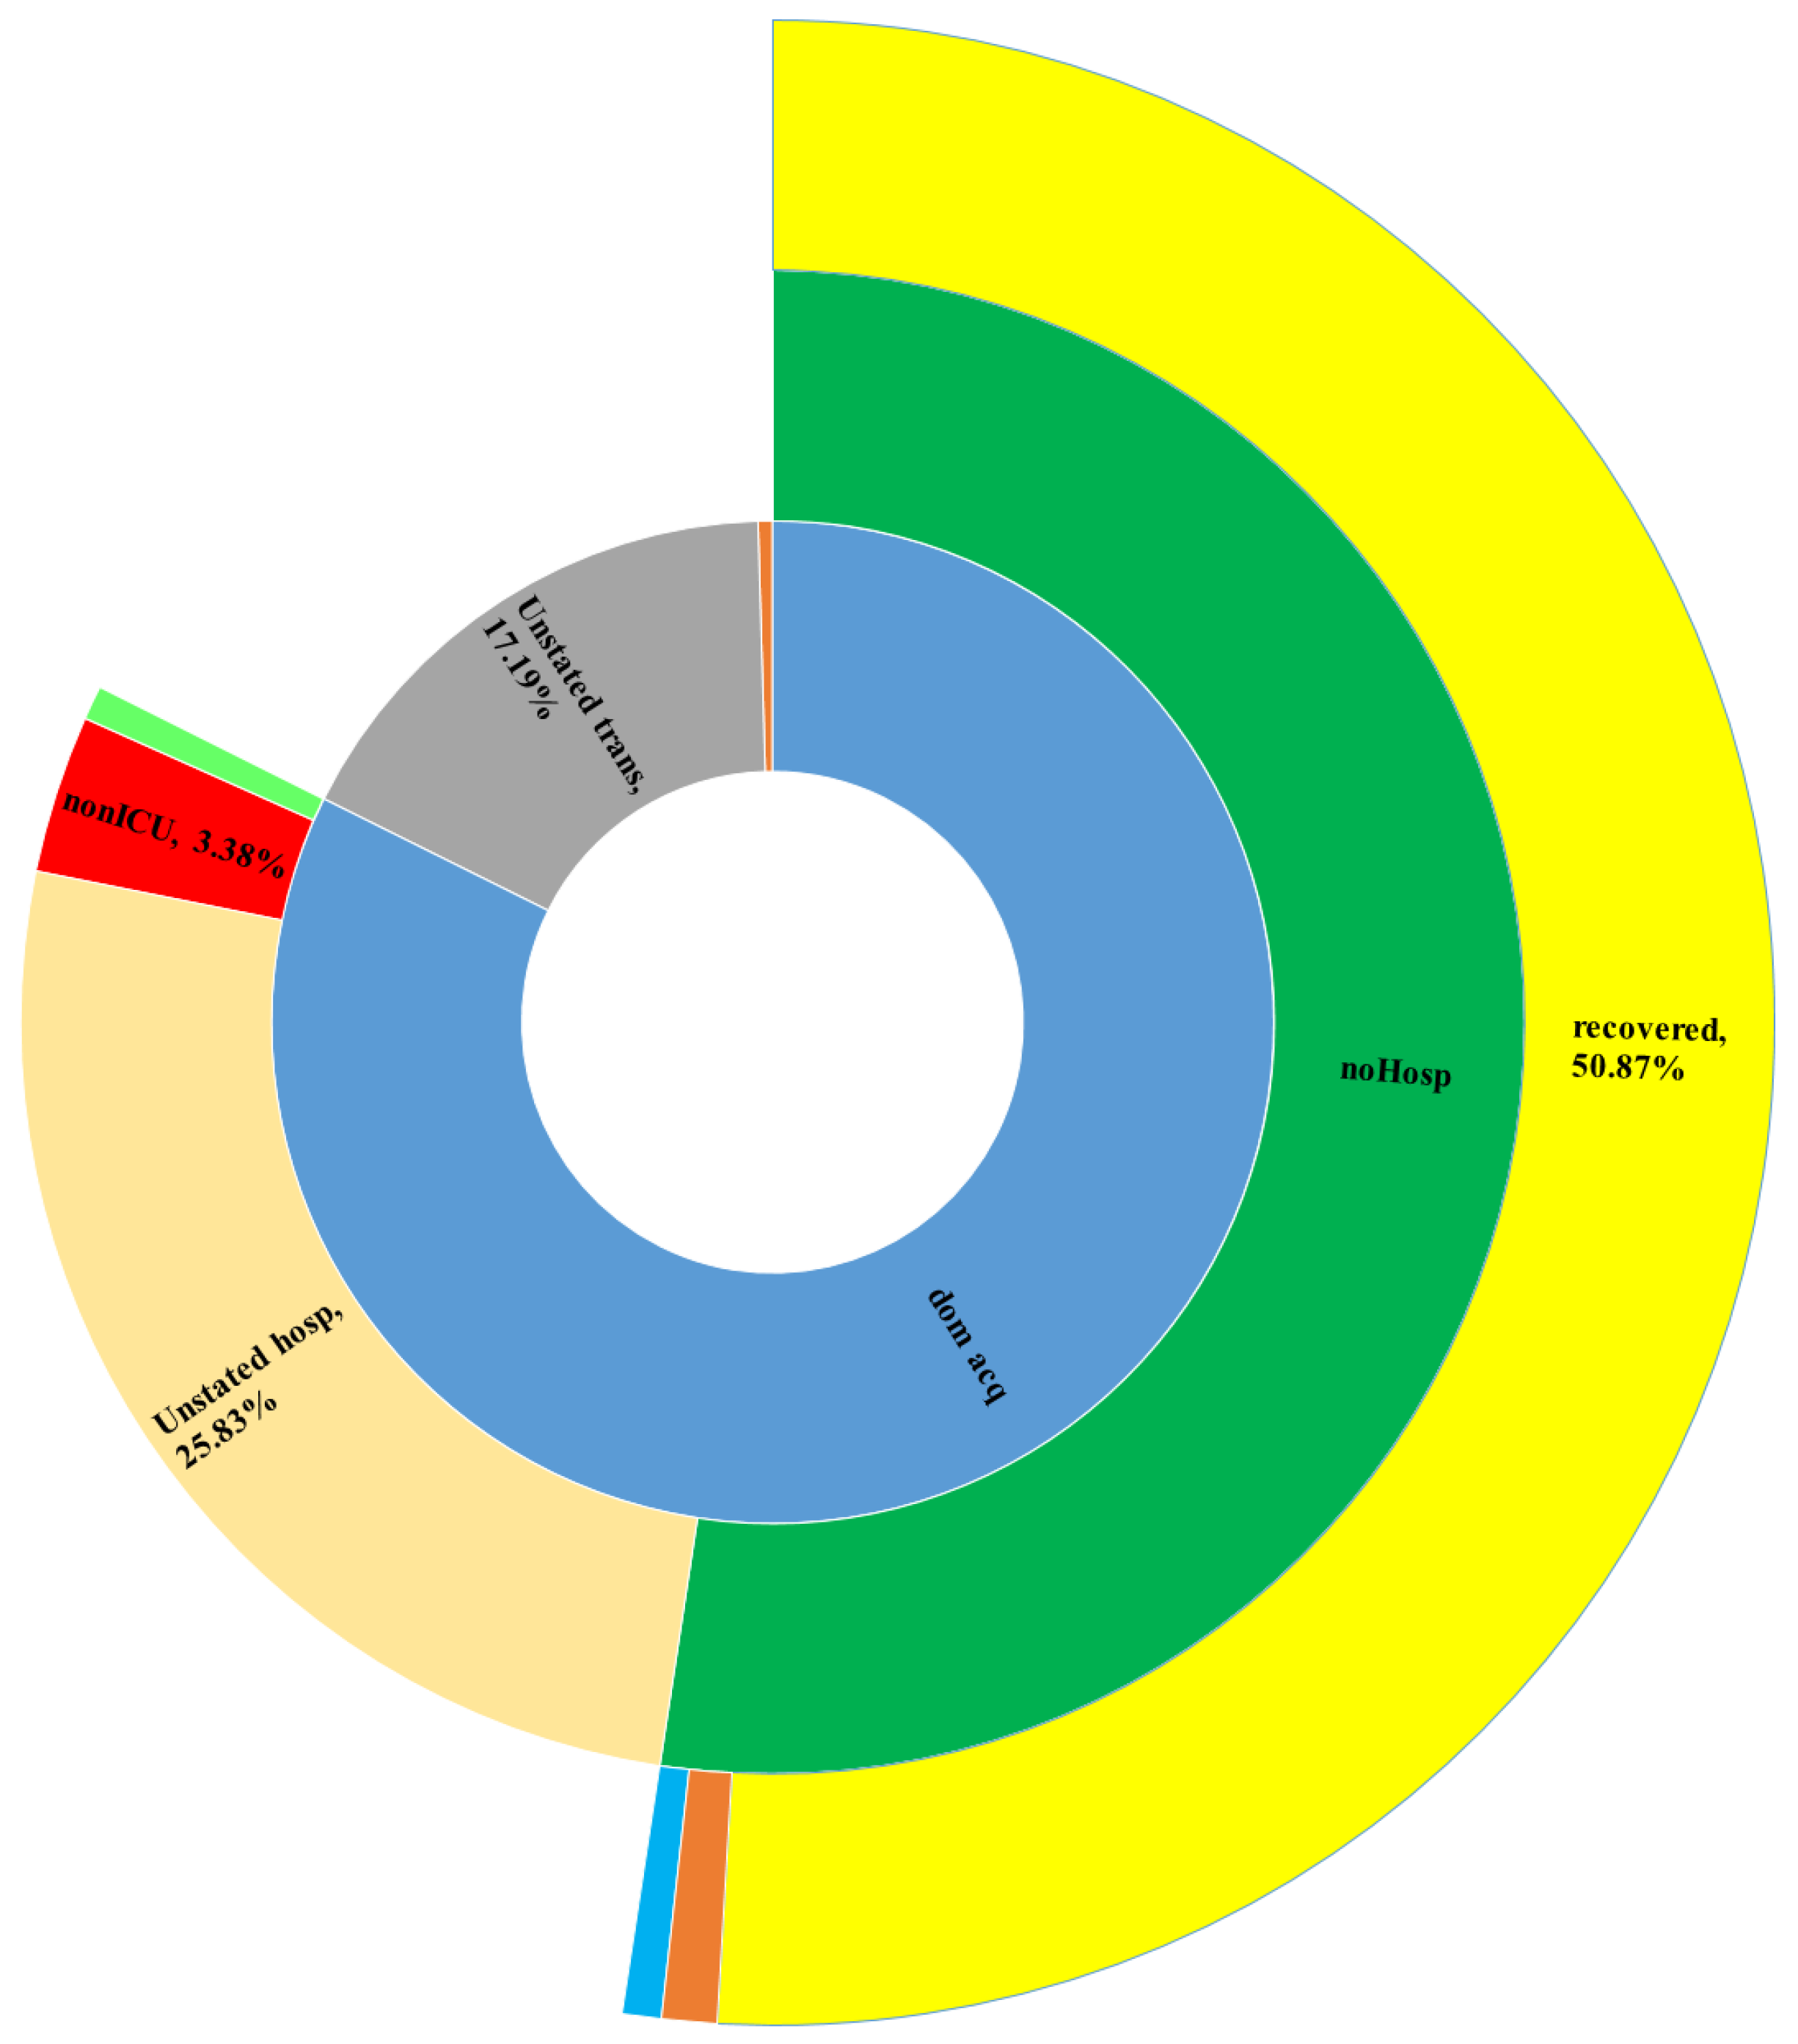
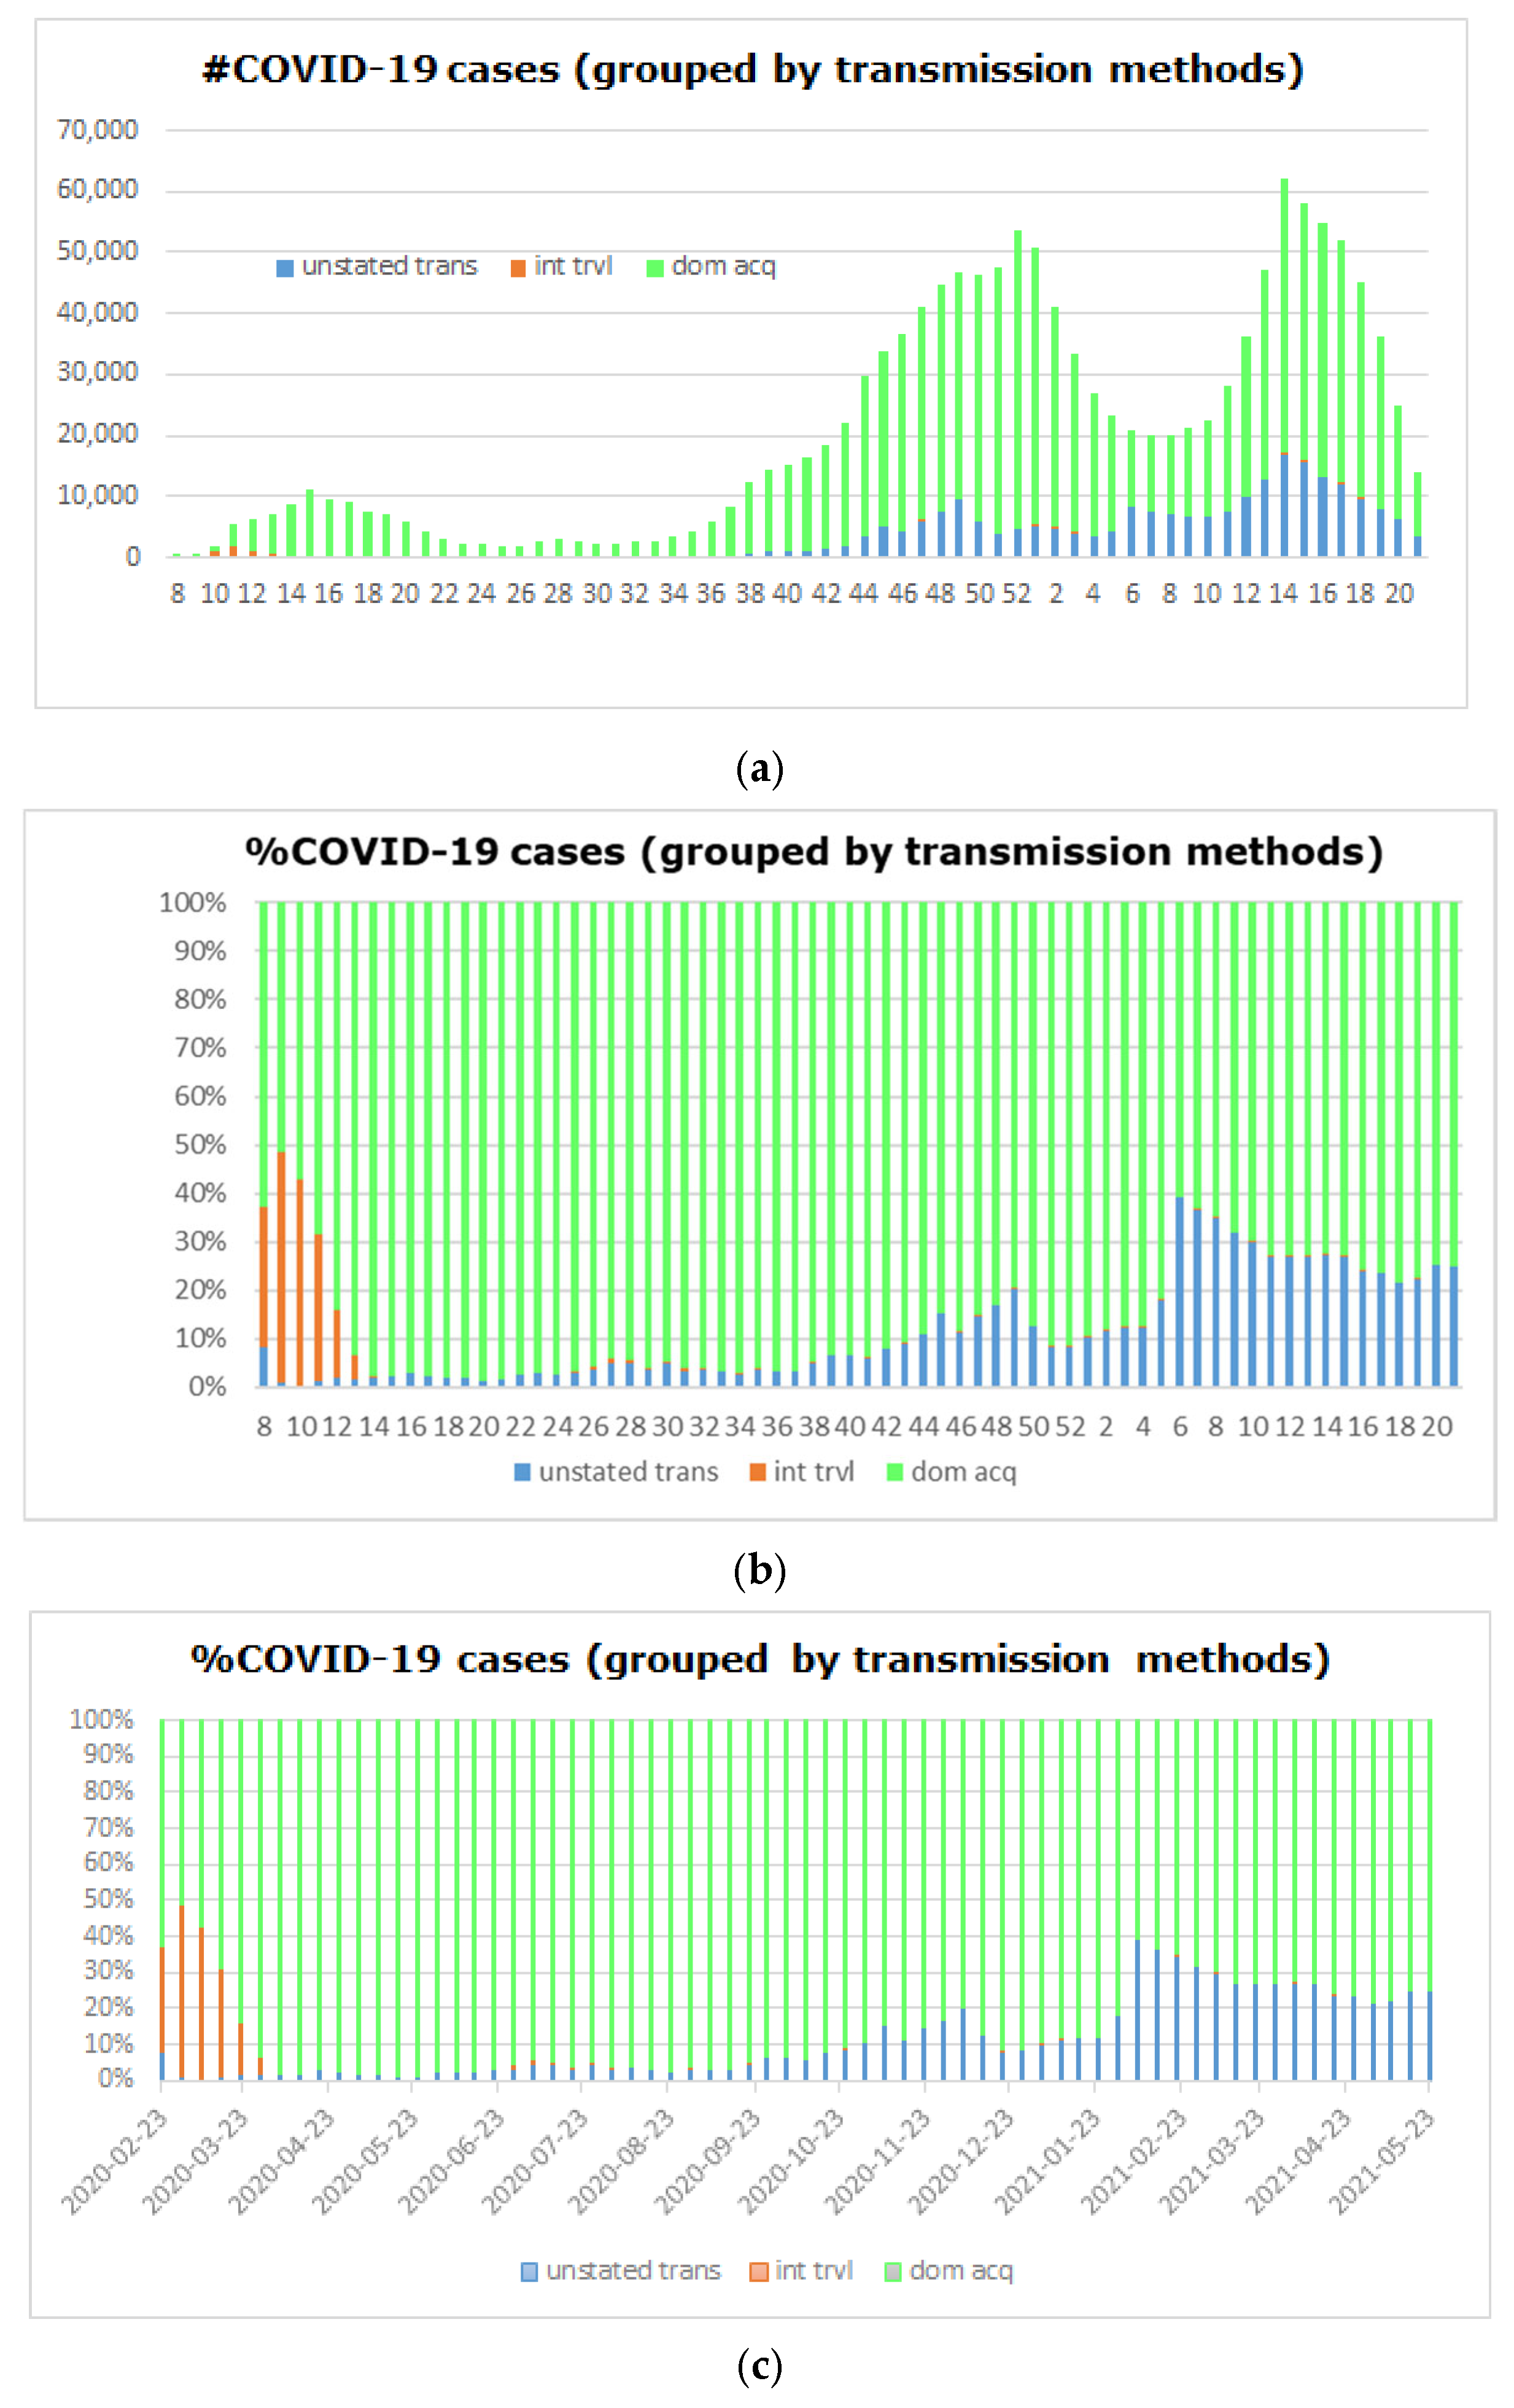
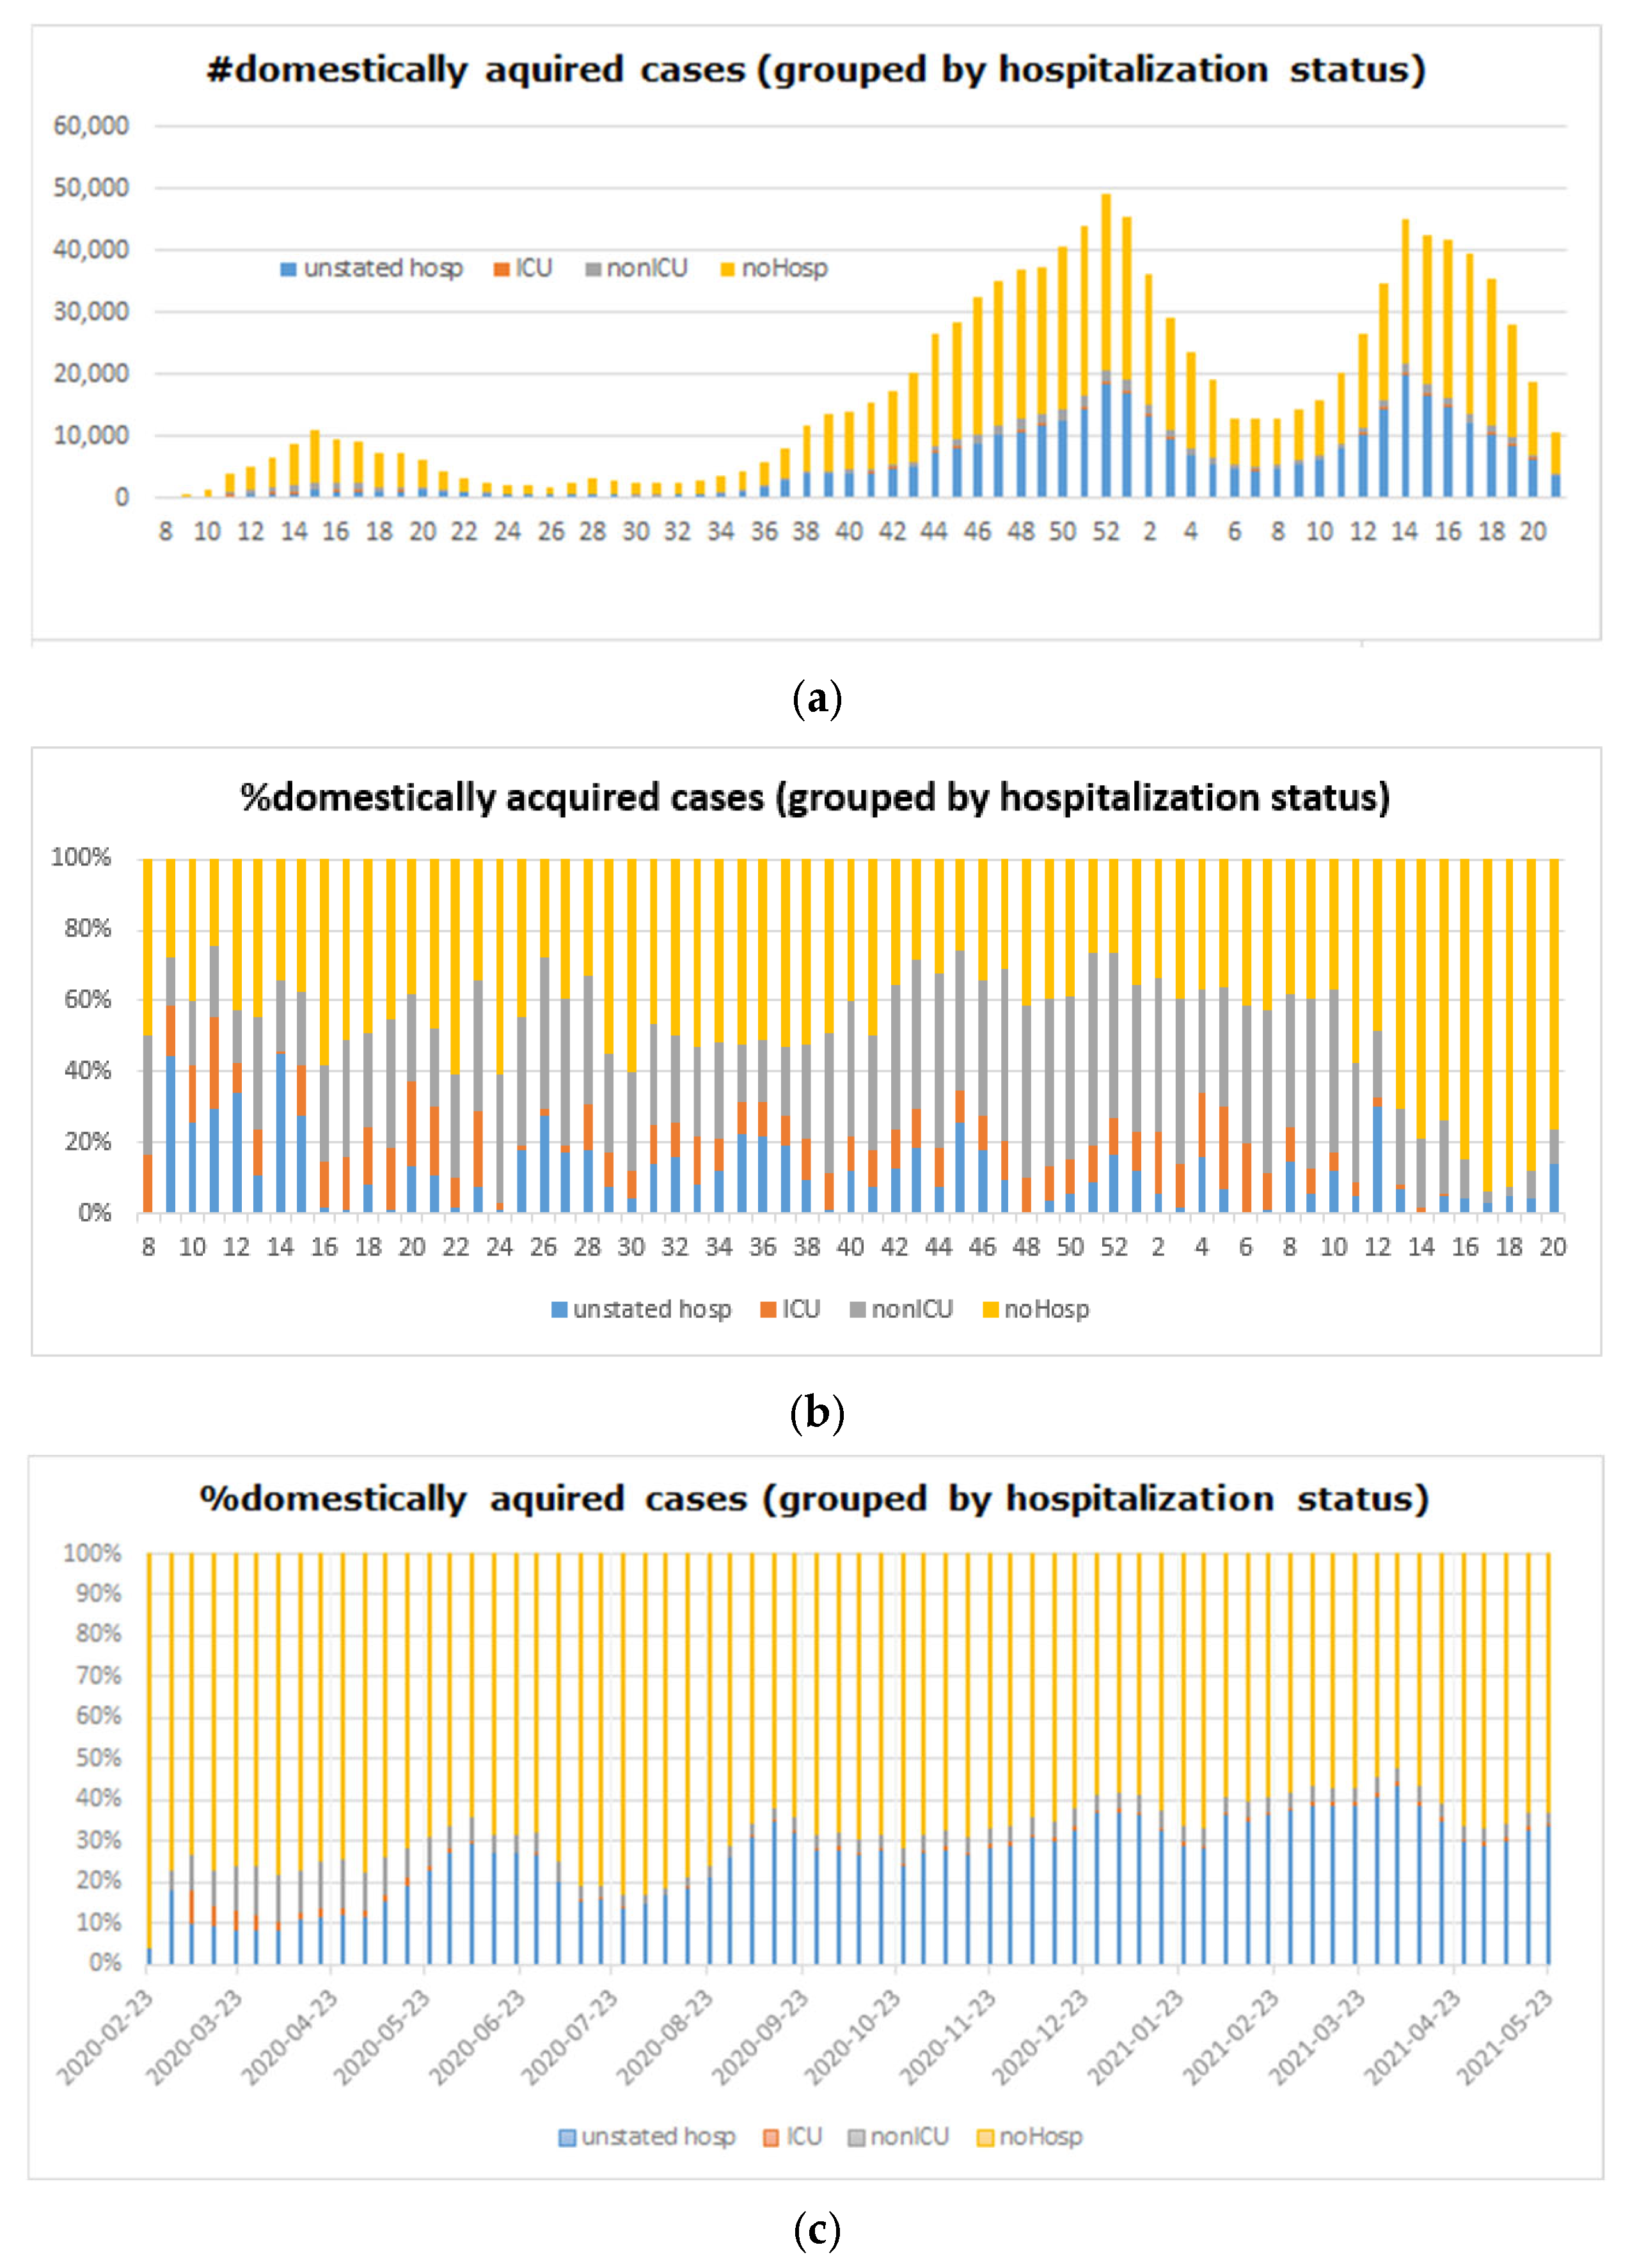
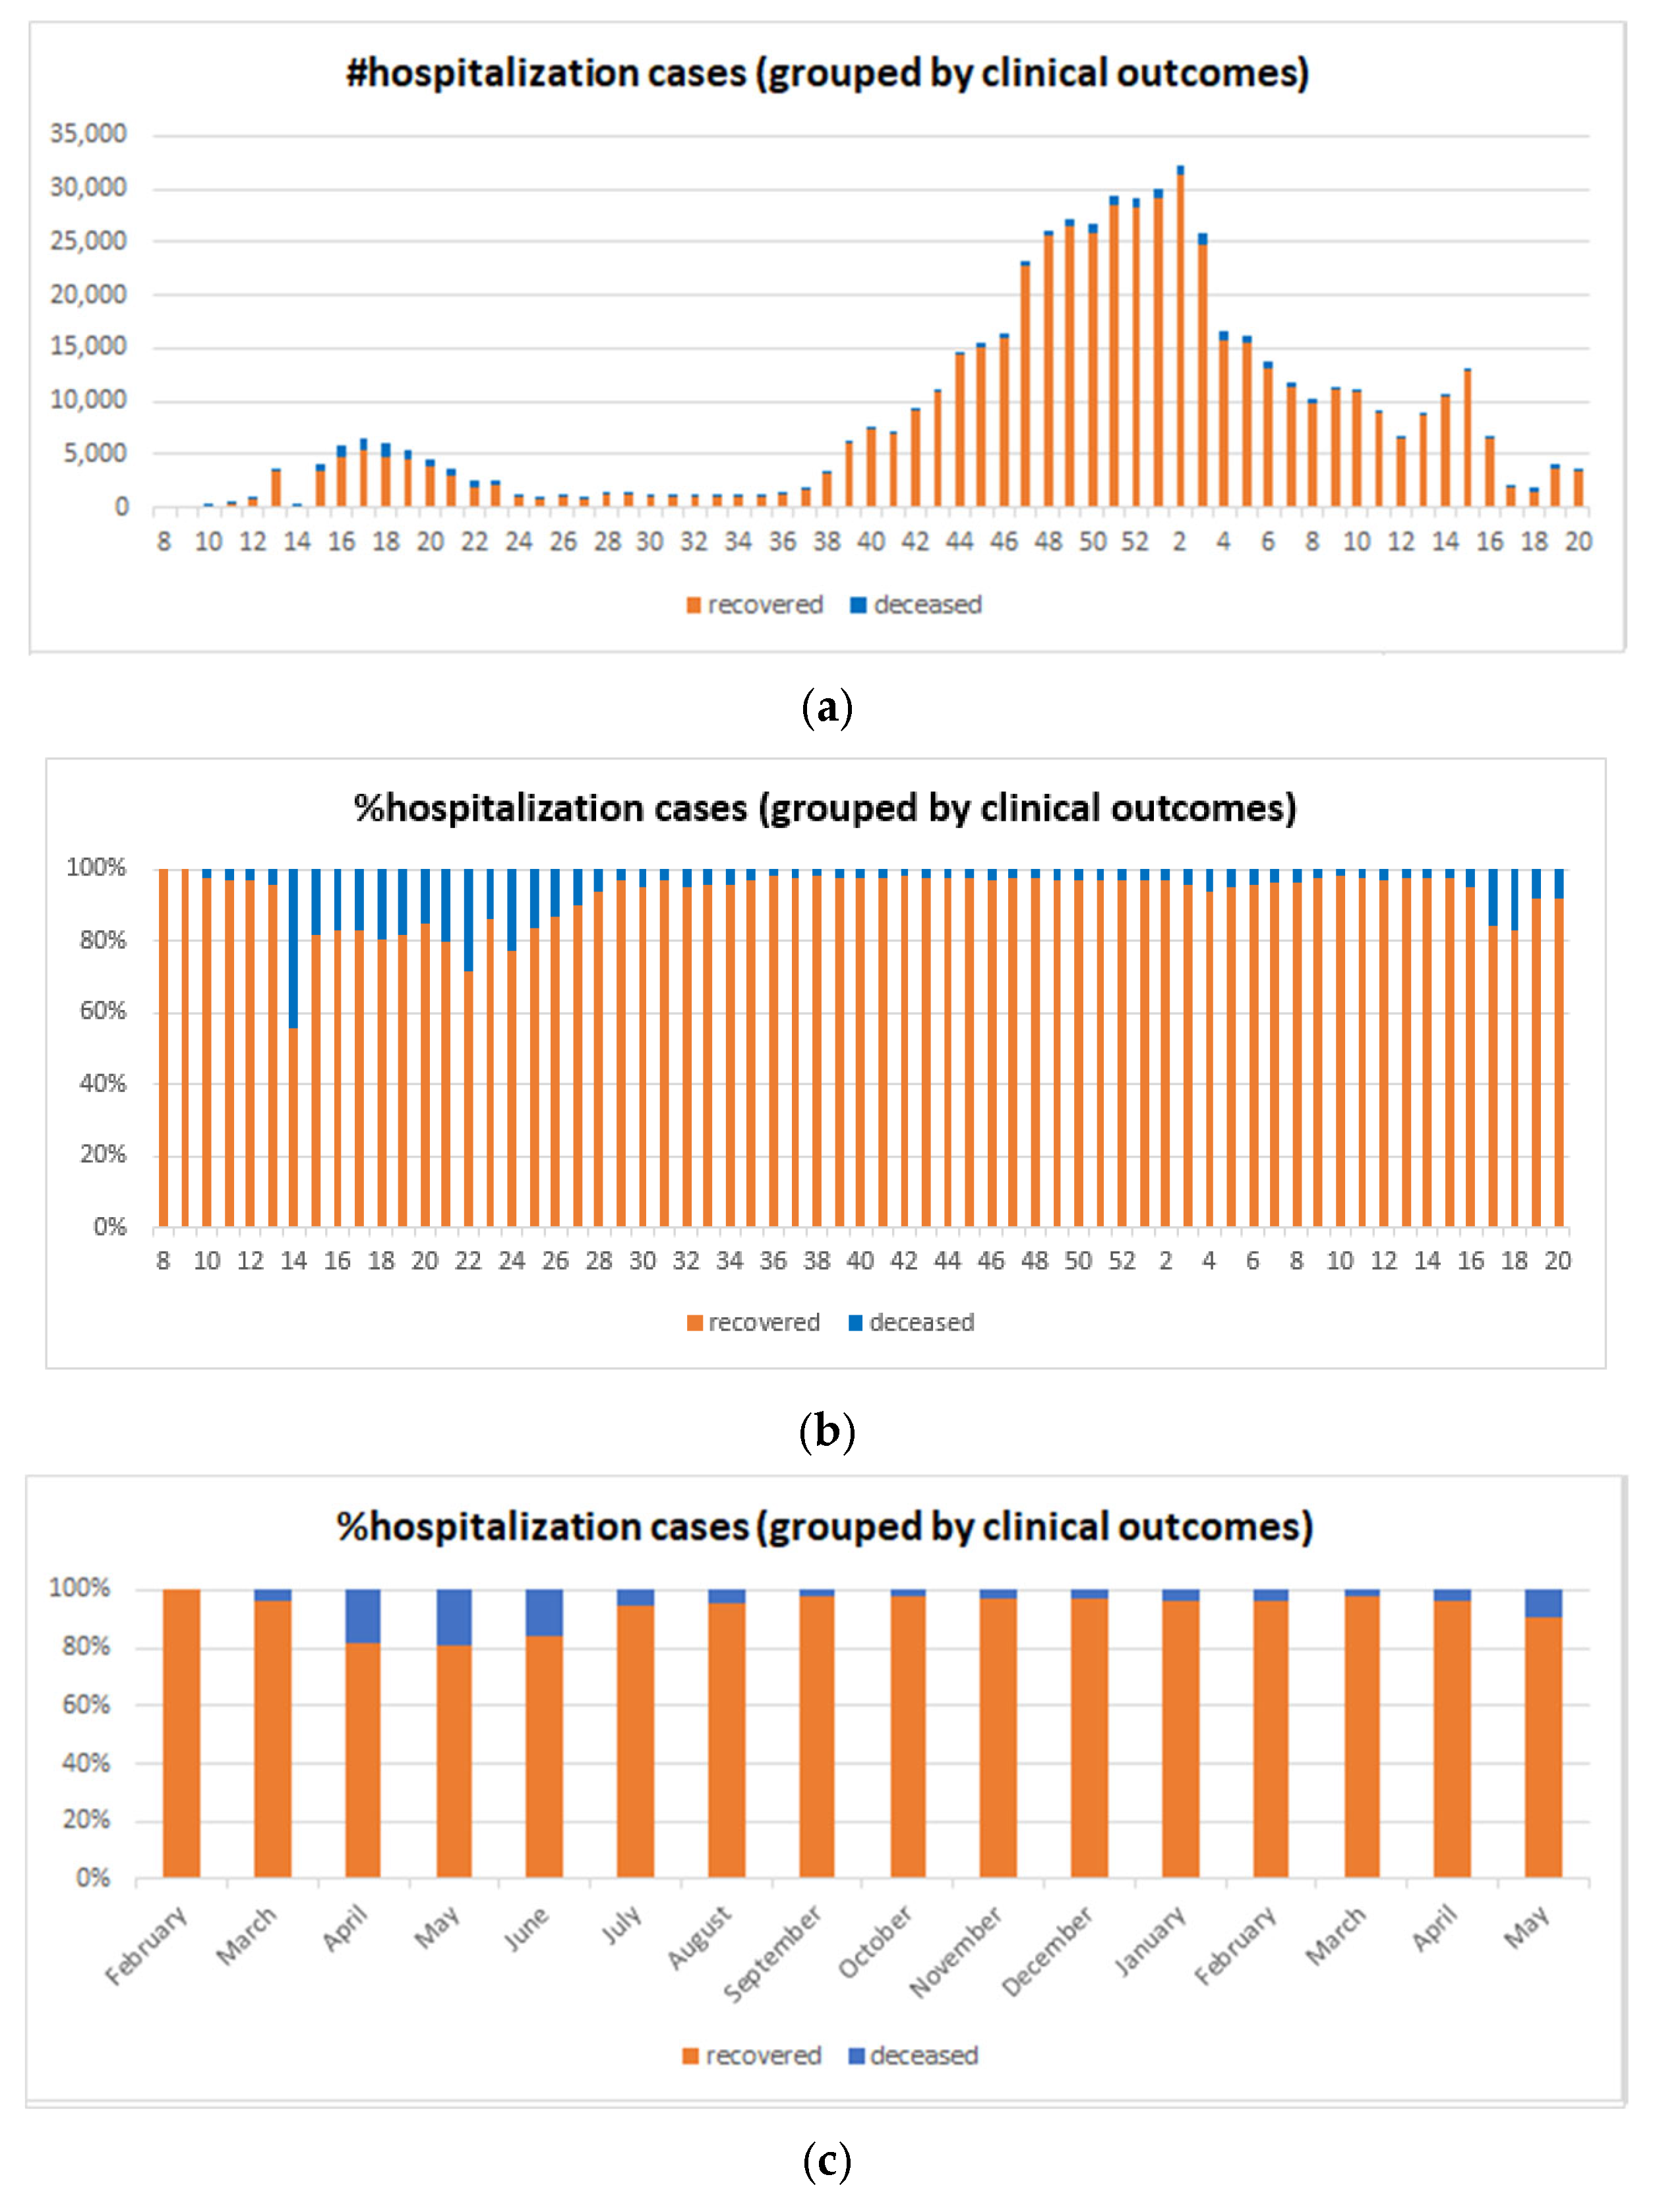
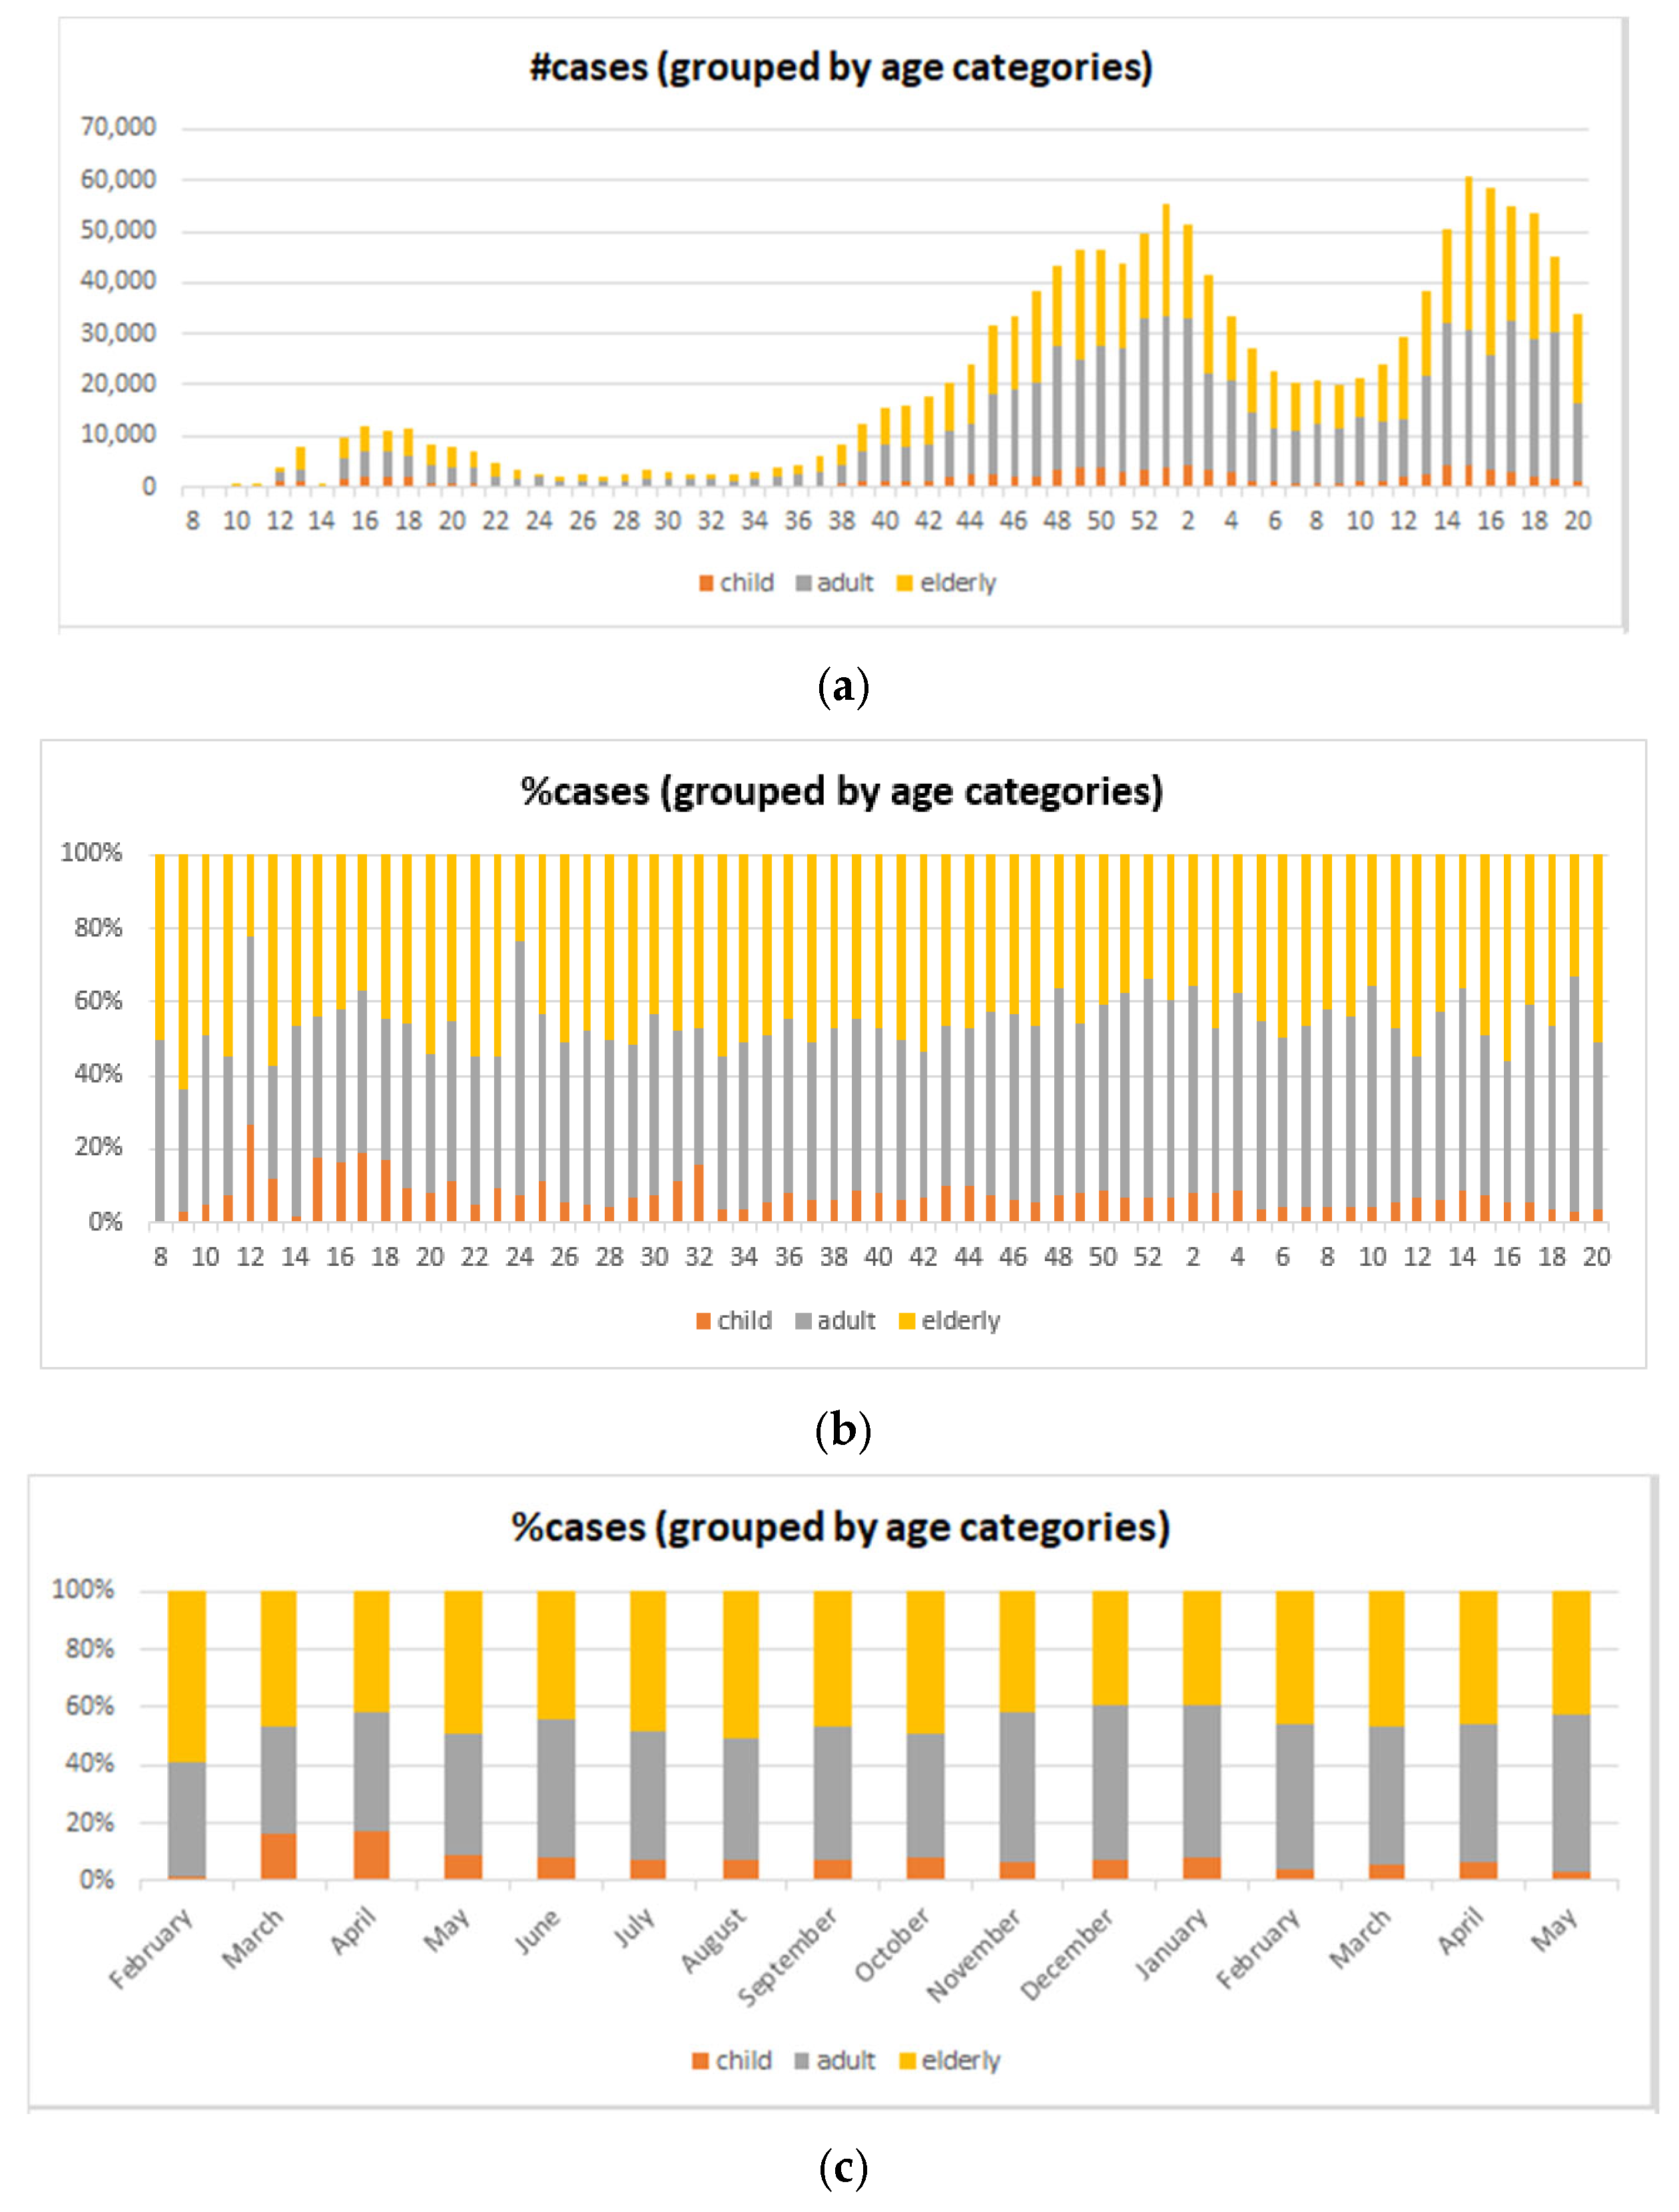
- RA1. Our visual data science framework combines multidimensional OLAP modeling, frequent pattern mining, and interactive visualization to analyze large-scale sequential epidemiological data. Specifically, our framework processes COVID-19 data to construct OLAP data cubes that support efficient aggregation across different hierarchies. It then mines frequent patterns over OLAP data cubes (e.g., co-occurrence of hospitalization status, transmission mode, and so forth) and visualizes these using intuitive charts such as stacked columns and 100% stacked bars. The case study using Canadian COVID-19 data shows the framework can uncover temporal trends, such as the decline in ICU deaths after vaccination and the shift from international to domestic transmission over time.
- RA2. In this research, we designed a modular, four-stage framework consisting of (i) Data Collection and Integration from heterogeneous sources; (ii) Preprocessing and Multidimensional OLAP Modeling to handle missing data, build temporal hierarchies, and generate data cubes; (iii) Frequent Pattern Mining using algorithms like Apriori or FP-growth adapted to multidimensional input; and (iv) Visualization and Interpretation through stacked column visualizations and sunburst diagrams to facilitate user interaction and interpretation.
- RA3. Our framework is domain-agnostic and designed to be generalized by relying on sequential, multidimensional data structures and frequent pattern mining, which are applicable in many domains beyond healthcare, such as (i) financial analytics; (ii) social media; (iii) environmental monitoring; and (iv) industrial IoT systems. The framework architecture, built on data integration, OLAP modeling, ML pattern mining, and visual analytics, can be adapted to the specific semantics and structures of other domains by changing the input dimensions and mining criteria.
- Cross-Domain Generalization: while our framework has been validated using COVID-19 data, it shows strong potential for generalization to other domains with sequential data, such as (i) Environmental monitoring (e.g., [164,165,166]); (ii) Financial analytics (e.g., [167,168]); and (iii) Industrial IoT (e.g., [169,170]).
8. Conclusions and Future Work
Author Contributions
Funding
Data Availability Statement
Acknowledgments
Conflicts of Interest
References
- Kang, Y.S.; Park, I.H.; Rhee, J.; Lee, Y.H. MongoDB-Based Repository Design for IoT-Generated RFID/Sensor Big Data. IEEE Sens. J. 2015, 16, 485–497. [Google Scholar] [CrossRef]
- Bellatreche, L.; Ordonez, C.; Méry, D.; Golfarelli, M.; Abdelwahed, E.H. The Central Role of Data Repositories and Data Models in Data Science and Advanced Analytics. Future Gener. Comput. Syst. 2022, 129, 13–17. [Google Scholar] [CrossRef]
- Ohno-Machado, L.; Sansone, S.A.; Alter, G.; Fore, I.; Grethe, J.; Xu, H.; Gonzalez-Beltran, A.; Rocca-Serra, P.; Gururaj, A.E.; Bell, E.; et al. Finding Useful Data across Multiple Biomedical Data Repositories using DataMed. Nat. Genet. 2017, 49, 816–819. [Google Scholar] [CrossRef]
- Novotný, P.; Wild, J. The Relational Modeling of Hierarchical Data in Biodiversity Databases. Databases 2024, 2024, baae107. [Google Scholar] [CrossRef]
- Diallo, A.H.; Camara, G.; Lo, M.; Diagne, I.; Lamy, J.B. Proportional Visualization of Genotypes and Phenotypes with Rainbow Boxes: Methods and Application to Sickle Cell Disease. In Proceedings of the 23rd IEEE International Conference on Information Visualisation, Paris, France, 2–5 July 2019; pp. 1–6. [Google Scholar]
- Hamdi, S.; Chaabane, N.; Bedoui, M.H. Intra and Inter Relationships between Biomedical Signals: A VAR Model Analysis. In Proceedings of the 23rd IEEE International Conference on Information Visualisation, Paris, France, 2–5 July 2019; pp. 411–416. [Google Scholar]
- Pellecchia, M.T.; Frasca, M.; Citarella, A.A.; Risi, M.; Francese, R.; Tortora, G.; De Marco, F. Identifying Correlations among Biomedical Data through Information Retrieval Techniques. In Proceedings of the 23rd IEEE International Conference on Information Visualisation, Paris, France, 2–5 July 2019; pp. 269–274. [Google Scholar]
- Genadek, K.R.; Alexander, J.T. The Missing Link: Data Capture Technology and the Making of a Longitudinal U.S. Census Infrastructure. IEEE Ann. Hist. Comput. 2022, 44, 57–66. [Google Scholar] [CrossRef]
- Jonker, D.; Brath, R.; Langevin, S. Industry-Driven Visual Analytics for Understanding Financial Timeseries Models. In Proceedings of the 23rd IEEE International Conference on Information Visualisation, Paris, France, 2–5 July 2019; pp. 210–215. [Google Scholar]
- Luong, N.N.T.; Milosevic, Z.; Berry, A.; Rabhi, F.A. A Visual Interactive Analytics Interface for Complex Event Processing and Machine Learning Processing of Financial Market Data. In Proceedings of the 24th IEEE International Conference on Information Visualisation, Melbourne, Australia, 7–11 September 2020; pp. 189–194. [Google Scholar]
- Prokofieva, M. Visualization of Financial Data in Teaching Financial Accounting. In Proceedings of the 24th IEEE International Conference on Information Visualisation, Melbourne, Australia, 7–11 September 2020; pp. 674–678. [Google Scholar]
- Li, T.; Ogihara, M.; Tzanetakis, G. Music Data Mining; CRC Press: Boca Raton, FL, USA, 2012. [Google Scholar]
- Schröder, M.; Muller, S.H.A.; Vradi, E.; Mielke, J.; Lim, Y.M.F.; Couvelard, F.; Mostert, M.; Koudstaal, S.; Eijkemans, M.J.C.; Gerlinger, C. Sharing Medical Big Data While Preserving Patient Confidentiality in Innovative Medicines Initiative: A Summary and Case Report from BigData@Heart. Big Data 2023, 11, 399–407. [Google Scholar] [CrossRef]
- Huang, M.L.; Zhao, R.; Hua, J.; Nguyen, Q.V.; Huang, W.; Wang, J. Designing Infographics/Visual Icons of Social Network by Referencing to the Design Concept of Ancient Oracle Bone Characters. In Proceedings of the 24th IEEE International Conference on Information Visualisation, Melbourne, Australia, 7–11 September 2020; pp. 694–699. [Google Scholar]
- Audu, A.A.; Cuzzocrea, A.; Leung, C.K.; MacLeod, K.A.; Ohin, N.I.; Pulgar-Vidal, N.C. An Intelligent Predictive Analytics System for Transportation Analytics on Open Data Towards the Development of a Smart City. In Proceedings of the 13th International Conference on Complex, Intelligent, and Software Intensive Systems, Sydney, Australia, 3–5 July 2019; pp. 224–236. [Google Scholar]
- Balbin, P.P.F.; Barker, J.C.R.; Leung, C.K.; Tran, M.; Wall, R.P.; Cuzzocrea, A. Predictive Analytics on Open Big Data for Supporting Smart Transportation Services. In Proceedings of the 24th International Conference on Knowledge-Based and Intelligent Information & Engineering Systems, Verona, Italy, 16–18 September 2020; pp. 3009–3018. [Google Scholar]
- Shawket, I.M.; El Khateeb, S. Redefining Urban Public Space’s Characters after COVID-19: Empirical Study on Egyptian Residential Spaces. In Proceedings of the 24th IEEE International Conference on Information Visualisation, Melbourne, Australia, 7–11 September 2020; pp. 614–619. [Google Scholar]
- Gahwera, T.A.; Eyobu, O.S.; Mugume, I. Analysis of Machine Learning Algorithms for Prediction of Short-Term Rainfall Amounts Using Uganda’s Lake Victoria Basin Weather Dataset. IEEE Access 2024, 12, 63361–63380. [Google Scholar] [CrossRef]
- Meroño-Peñuela, A.; Simperl, E.; Kurteva, A.; Reklos, I. KG.GOV: Knowledge Graphs as the Backbone of Data Governance in AI. J. Web Semant. 2025, 85, 100847. [Google Scholar] [CrossRef]
- Muñoz-Lago, P.; Usula, N.; Parada-Cabaleiro, E.; Torrente, A. Visualising the Structure of 18th Century Operas: A Multidisciplinary Data Science Approach. In Proceedings of the 24th IEEE International Conference on Information Visualisation, Melbourne, Australia, 7–11 September 2020; pp. 530–536. [Google Scholar]
- Von Richthofen, A.; Zeng, W.; Asada, S.; Burkhard, R.; Heisel, F.; Arisona, S.M.; Schubiger, S. Urban Mining: Visualizing the Availability of Construction Materials for Re-use in Future Cities. In Proceedings of the 21st IEEE International Conference on Information Visualisation, London, UK, 11–14 July 2017; pp. 306–311. [Google Scholar]
- Casalino, G.; Castellano, G.; Mencar, C. Incremental and Adaptive Fuzzy Clustering for Virtual Learning Environments Data Analysis. In Proceedings of the 23rd IEEE International Conference on Information Visualisation, Paris, France, 2–5 July 2019; pp. 382–387. [Google Scholar]
- Huang, M.L.; Yue, Z.; Nguyen, Q.V.; Liang, J.; Luo, Z. Stroke Data Analysis through a HVN Visual Mining Platform. In Proceedings of the 23rd IEEE International Conference on Information Visualisation, Paris, France, 2–5 July 2019; pp. 1–6. [Google Scholar]
- Afonso, A.P.; Ferreira, A.; Ferreira, L.; Vaz, R. RoseTrajVis: Visual Analytics of Trajectories with Rose Diagrams. In Proceedings of the 24th IEEE International Conference on Information Visualisation, Melbourne, Australia, 7–11 September 2020; pp. 378–384. [Google Scholar]
- Kaupp, L.; Nazemi, K.; Humm, B. An Industry 4.0-Ready Visual Analytics Model for Context-Aware Diagnosis in Smart Manufacturing. In Proceedings of the 24th IEEE International Conference on Information Visualisation, Melbourne, Australia, 7–11 September 2020; pp. 350–359. [Google Scholar]
- Leung, C.K.; Carmichael, C.L. FpVAT: A Visual Analytic Tool for Supporting Frequent Pattern Mining. ACM SIGKDD Explor. 2009, 11, 39–48. [Google Scholar] [CrossRef]
- Maçãs, C.; Polisciuc, E.; Machado, P. VaBank: Visual Analytics for Banking Transactions. In Proceedings of the 24th IEEE International Conference on Information Visualisation, Melbourne, Australia, 7–11 September 2020; pp. 336–343. [Google Scholar]
- Perrot, A.; Bourqui, R.; Hanusse, N.; Auber, D. HeatPipe: High Throughput, Low Latency Big Data Heatmap with Spark Streaming. In Proceedings of the 21st IEEE International Conference on Information Visualisation, London, UK, 11–14 July 2017; pp. 66–71. [Google Scholar]
- Ardakani, A.A.; Kanafi, A.R.; Acharya, U.R.; Khadem, N.; Mohammadi, A. Application of Deep Learning Technique to Manage COVID-19 in Routine Clinical Practice using CT Images: Results of 10 Convolutional Neural Networks. Comput. Biol. Med. 2020, 121, 103795. [Google Scholar] [CrossRef]
- Jamshidi, M.; Lalbakhsh, A.; Talla, J.; Peroutka, Z.; Hadjilooei, F.; Lalbakhsh, P.; Jamshidi, M.; La Spada, L.; Mirmozafari, M.; Dehghani, M.; et al. Artificial Intelligence and COVID-19: Deep Learning Approaches for Diagnosis and Treatment. IEEE Access 2020, 8, 109581–109595. [Google Scholar] [CrossRef] [PubMed]
- Robson, B. COVID-19 Coronavirus Spike Protein Analysis for Synthetic Vaccines, A Peptidomimetic Antagonist, and Therapeutic Drugs, and Analysis of a Proposed Achilles’ Heel Conserved Region to Minimize Probability of Escape Mutations and Drug Resistance. Comput. Biol. Med. 2020, 121, 103749. [Google Scholar] [CrossRef] [PubMed]
- Bishop, C.M.; Nasrabadi, N.M. Pattern Recognition and Machine Learning; Springer: New York, NY, USA, 2006. [Google Scholar]
- Leung, C.K.; Chen, Y.; Hoi, C.S.H.; Shang, S.; Wen, Y.; Cuzzocrea, A. Big Data Visualization and Visual Analytics of COVID-19 Data. In Proceedings of the 24th IEEE International Conference on Information Visualisation, Melbourne, Australia, 7–11 September 2020; pp. 415–420. [Google Scholar]
- Pleshakova, E.; Osipov, A.; Gataullin, S.; Gataullin, T.; Vasilakos, A. Next Gen Cybersecurity Paradigm Towards Artificial General Intelligence: Russian Market Challenges and Future Global Technological Trends. J. Comput. Virol. Hacking Tech. 2024, 20, 429–440. [Google Scholar] [CrossRef]
- Cuzzocrea, A. Innovative Paradigms for Supporting Privacy-Preserving Multidimensional Big Healthcare Data Management and Analytics: The Case of the EU H2020 QUALITOP Research Project. In Proceedings of the 4th International Workshop on Semantic Web Meets Health Data Management Co-Located with 20th International Semantic Web Conference, Virtual, 24 October 2021; pp. 1–7. [Google Scholar]
- Cuzzocrea, A.; Bringas, P.G. CORE-BCD-mAI: A Composite Framework for Representing, Querying, and Analyzing Big Clinical Data by Means of Multidimensional AI Tools. In Proceedings of the 17th International Conference on Hybrid Artificial Intelligent Systems, Salamanca, Spain, 5–7 September 2022; pp. 175–185. [Google Scholar]
- Cuzzocrea, A. Multidimensional Big Data Analytics over Big Web Knowledge Bases: Models, Issues, Research Trends, and a Reference Architecture. In Proceedings of the 8th IEEE International Conference on Multimedia Big Data, Naples, Italy, 5–7 December 2022; pp. 1–6. [Google Scholar]
- Cuzzocrea, A. A Reference Architecture for Supporting Multidimensional Big Data Analytics over Big Web Knowledge Bases: Definitions, Implementation, Case Studies. Int. J. Semant. Comput. 2023, 17, 545–568. [Google Scholar] [CrossRef]
- Cuzzocrea, A.; Sisara, M.A.; Leung, C.K.; Wen, Y.; Jiang, F. Effectively and Efficiently Supporting Visual Big Data Analytics over Big Sequential Data: An Innovative Data Science Approach. In Proceedings of the 22nd International Conference on Computational Science and Its Applications, Malaga, Spain, 4–7 July 2022; pp. 113–125. [Google Scholar]
- Lin, G.; Lin, A.; Cao, J. Multidimensional KNN Algorithm Based on EEMD and Complexity Measures in Financial Time Series Forecasting. Expert Syst. Appl. 2021, 168, 114443. [Google Scholar] [CrossRef]
- Jentner, W.; Keim, D.A. Visualization and Visual Analytic Techniques for Patterns. In High-Utility Pattern Mining; Springer: Cham, Switzerland, 2019; pp. 303–337. [Google Scholar]
- Liu, X.; Zhou, Y.; Wang, Z. Can the Development of a Patient’s Condition be Predicted through Intelligent Inquiry under the E-Health Business Mode? Sequential Feature Map-Based Disease Risk Prediction upon Features Selected from Cognitive Diagnosis Big Data. Int. J. Inf. Manag. 2020, 50, 463–486. [Google Scholar] [CrossRef]
- Carroll, L.N.; Au, A.P.; Detwiler, L.T.; Fu, T.C.; Painter, I.S.; Abernethy, N.F. Visualization and Analytics Tools for Infectious Disease Epidemiology: A Systematic Review. J. Biomed. Inform. 2014, 51, 287–298. [Google Scholar] [CrossRef]
- Ghouzali, S.; Bayoumi, S.; Larabi-Marie-Sainte, S.; Shaheen, S. COVID-19 in Saudi Arabia: A Pandemic Data Descriptive Analysis and Visualization. In Proceedings of the 7th ACM Annual International Conference on Arab Women in Computing, Sharjah, United Arab Emirates, 25–26 August 2021; pp. 1–5. [Google Scholar]
- Angelini, M.; Cazzetta, G. Progressive Visualization of Epidemiological Models for COVID-19 Visual Analysis. In Proceedings of the 2020 AVI Workshop on Big Data Applications, Ischia, Italy, 9 June 2020; pp. 163–173. [Google Scholar]
- Dey, S.K.; Rahman, M.M.; Siddiqi, U.R.; Howlader, A. Analyzing the Epidemiological Outbreak of COVID-19: A Visual Exploratory Data Analysis Approach. J. Med. Virol. 2020, 92, 632–638. [Google Scholar] [CrossRef]
- Milano, M.; Zucco, C.; Cannataro, M. COVID-19 Community Temporal Visualizer: A New Methodology for the Network-Based Analysis and Visualization of COVID-19 Data. Netw. Model. Anal. Health Inform. Bioinform. 2021, 10, 46. [Google Scholar] [CrossRef]
- Healey, C.G.; Simmons, S.J.; Manivannan, C.; Ro, Y. Visual Analytics for the Coronavirus COVID-19 Pandemic. Big Data 2022, 10, 95–114. [Google Scholar] [CrossRef]
- Liao, M.; Zhu, T. Applications of Artificial Intelligence and Big Data for COVID-19 Pandemic: A Review. In Proceedings of the 9th ACM International Conference on Biomedical and Bioinformatics Engineering, Kyoto, Japan, 10–13 September 2022; pp. 253–259. [Google Scholar]
- Cui, L.; Kong, W. Visualization Analysis of Spatiotemporal Data of COVID-19. In Proceedings of the 16th IEEE International Conference on Intelligent Systems and Knowledge Engineering, Chengdu, China, 26–28 November 2021; pp. 565–571. [Google Scholar]
- Ali, S.M.; Gupta, N.; Nayak, G.K.; Lenka, R.K. Big Data Visualization: Tools and Challenges. In Proceedings of the 2nd IEEE International Conference on Contemporary Computing and Informatics, Greater Noida, India, 14–17 December 2016; pp. 656–660. [Google Scholar]
- Delange, B.; Popoff, B.; Séité, T.; Lamer, A.; Parrot, A. LinkR: An Open Source, Low-Code and Collaborative Data Science Platform for Healthcare Data Analysis and Visualization. Int. J. Med. Inform. 2025, 199, 105876. [Google Scholar] [CrossRef] [PubMed]
- Basu, S. Machine Learning and Visualizations for Time-Series Healthcare Data. In Proceedings of the 11th IEEE International Conference on Healthcare Informatics, Houston, TX, USA, 26–29 June 2023; p. 485. [Google Scholar]
- Dixon, B.E.; Grannis, S.J.; Tachinardi, U.; Williams, J.L.; McAndrews, C.; Embí, P.J. Daily Visualization of Statewide COVID-19 Healthcare Data. In Proceedings of the 2020 IEEE Workshop on Visual Analytics in Healthcare, Virtual, 14–18 November 2020; pp. 1–3. [Google Scholar]
- Saravanan, V.; Pramod, A.; Poudel, L.; Paramasivam, P. Predictive Precision: LSTM-Based Analytics for Real-time Stock Market Visualization. In Proceedings of the 2023 IEEE International Conference on Big Data, Sorrento, Italy, 15–18 December 2023; pp. 1–6. [Google Scholar]
- Romero, O.; Abelló, A. A Survey of Multidimensional Modeling Methodologies. Int. J. Data Warehous. Min. 2009, 5, 1–23. [Google Scholar] [CrossRef]
- Malinowski, E.; Zimányi, E. Hierarchies in a Multidimensional Model: From Conceptual Modeling to Logical Representation. Data Knowl. Eng. 2006, 59, 348–377. [Google Scholar] [CrossRef]
- Gray, J.; Chaudhuri, S.; Bosworth, A.; Layman, A.; Reichart, D.; Venkatrao, M.; Pellow, F.; Pirahesh, H. Data Cube: A Relational Aggregation Operator Generalizing Group-by, Cross-Tab, and Sub Totals. Data Min. Knowl. Discov. 1997, 1, 29–53. [Google Scholar] [CrossRef]
- Yu, C.C.; Chen, Y.L. Mining Sequential Patterns from Multidimensional Sequence Data. IEEE Trans. Knowl. Data Eng. 2005, 17, 136–140. [Google Scholar]
- Tang, H.; Liao, S.S.; Sun, S.X. Mining Sequential Relations from Multidimensional Data Sequence for Prediction. In Proceedings of the 2008 International Conference on Information Systems, Paris, France, 14–17 December 2008; p. 197. [Google Scholar]
- Plantevit, M.; Laurent, A.; Laurent, D.; Teisseire, M.; Choong, Y.W. Mining Multidimensional and Multilevel Sequential Patterns. ACM Trans. Knowl. Discov. Data 2010, 4, 4. [Google Scholar] [CrossRef]
- Raïssi, C.; Plantevit, M. Mining Multidimensional Sequential Patterns over Data Streams. In Proceedings of the 10th International Conference on Data Warehousing and Knowledge Discovery, Turin, Italy, 2–5 September 2008; pp. 263–272. [Google Scholar]
- Cohen, A.; Merhav, N.; Weissman, T. Scanning and Sequential Decision Making for Multidimensional Data-Part I: The Noiseless Case. IEEE Trans. Inf. Theory 2007, 53, 3001–3020. [Google Scholar] [CrossRef]
- Cohen, A.; Weissman, T.; Merhav, N. Scanning and Sequential Decision Making for Multidimensional Data-Part II: The Noisy Case. IEEE Trans. Inf. Theory 2008, 54, 5609–5631. [Google Scholar] [CrossRef]
- Abdullah, P.Y.; Zeebaree, S.R.; Jacksi, K.; Zeabri, R.R. An HRM System for Small and Medium Enterprises (SME) Based on Cloud Computing Technology. Int. J. Res. 2020, 8, 56–64. [Google Scholar] [CrossRef]
- Haji, L.M.; Zeebaree, S.; Ahmed, O.M.; Sallow, A.B.; Jacksi, K.; Zeabri, R.R. Dynamic Resource Allocation for Distributed Systems and Cloud Computing. TEST Eng. Manag. 2020, 83, 22417–22426. [Google Scholar]
- Khalifa, I.A.; Zeebaree, S.R.; Ataş, M.; Khalifa, F.M. Image Steganalysis in Frequency Domain using Co-Occurrence Matrix and BPNN. Sci. J. Univ. Zakho 2019, 7, 27–32. [Google Scholar] [CrossRef]
- Chawla, G.; Bamal, S.; Khatana, R. Big Data Analytics for Data Visualization: Review of Techniques. Int. J. Comput. Appl. 2018, 182, 37–40. [Google Scholar] [CrossRef]
- Chen, C.P.; Zhang, C.Y. Data-Intensive Applications, Challenges, Techniques and Technologies: A Survey on Big Data. Inf. Sci. 2014, 275, 314–347. [Google Scholar] [CrossRef]
- Leung, C.K.; Braun, P.; Cuzzocrea, A. AI-Based Sensor Information Fusion for Supporting Deep Supervised Learning. Sensors 2019, 19, 1345. [Google Scholar] [CrossRef]
- Pereira, C.A.; Peixoto, R.C.R.; Kaster, M.P.; Grellert, M.; Carvalho, J.T. Using Data Mining Techniques to Understand Patterns of Suicide and Reattempt Rates in Southern Brazil. In Proceedings of the 17th International Joint Conference on Biomedical Engineering Systems and Technologies, Rome, Italy, 21–23 February 2024; pp. 385–392. [Google Scholar]
- Movahedi, F.; Zhang, Y.; Padman, R.; Antaki, J.F. Mining Temporal Patterns from Sequential Healthcare Data. In Proceedings of the 2018 IEEE International Conference on Healthcare Informatics, New York, NY, USA, 4–7 June 2018; pp. 461–462. [Google Scholar]
- Greene, N. Hierarchical Polygon Tiling with Coverage Masks. In Proceedings of the 23rd ACM Annual Conference on Computer Graphics and Interactive Techniques, New Orleans, LA, USA, 4–9 August 1996; pp. 65–74. [Google Scholar]
- Tedesco, J.; Dudko, R.; Sharma, A.; Farivar, R.; Campbell, R. Theius: A Streaming Visualization Suite for Hadoop Clusters. In Proceedings of the 2013 IEEE International Conference on Cloud Engineering, San Francisco, CA, USA, 25–27 March 2013; pp. 177–182. [Google Scholar]
- Tennekes, M.; de Jonge, E. Top-Down Data Analysis with Treemaps. In Proceedings of the 2011 International Conference on Information Visualization Theory and Applications, Algarve, Portugal, 5–7 March 2011; pp. 236–241. [Google Scholar]
- Johansson, J.; Forsell, C.; Lind, M.; Cooper, M. Perceiving Patterns in Parallel Coordinates: Determining Thresholds for Identification of Relationships. Inf. Vis. 2008, 7, 152–162. [Google Scholar] [CrossRef]
- Byron, L.; Wattenberg, M. Stacked Graphs–Geometry & Aesthetics. IEEE Trans. Vis. Comput. Graph. 2022, 14, 1245–1252. [Google Scholar]
- Bach, B.; Shi, C.; Heulot, N.; Madhyastha, T.M.; Grabowski, T.J.; Dragicevic, P. Time Curves: Folding Time to Visualize Patterns of Temporal Evolution in Data. IEEE Trans. Vis. Comput. Graph. 2016, 22, 559–568. [Google Scholar] [CrossRef]
- Wattenberg, M. Arc Diagrams: Visualizing Structure in Strings. In Proceedings of the 2002 IEEE Symposium on Information Visualization, Boston, MA, USA, 27 October–1 November 2002; pp. 110–116. [Google Scholar]
- Kargupta, H.; Park, B.H.; Pittie, S.; Liu, L.; Kushraj, D.; Sarkar, K. MobiMine: Monitoring the Stock Market from a PDA. SIGKDD Explor. 2002, 3, 37–46. [Google Scholar] [CrossRef]
- Olshannikova, E.; Ometov, A.; Koucheryavy, Y.; Olsson, T. Visualizing Big Data with Augmented and Virtual Reality: Challenges and Research Agenda. J. Big Data 2015, 2, 22. [Google Scholar] [CrossRef]
- Agrawal, R.; Kadadi, A.; Dai, X.; Andrès, F. Challenges and Opportunities with Big Data Visualization. In Proceedings of the 7th ACM International Conference on Management of Computational and Collective Intelligence in Digital Ecosystems, Caraguatatuba, Brazil, 25–29 October 2015; pp. 169–173. [Google Scholar]
- Childs, H.; Geveci, B.; Schroeder, W.J.; Meredith, J.S.; Moreland, K.; Sewell, C.M.; Kuhlen, T.W.; Wes Bethel, E. Research Challenges for Visualization Software. IEEE Comput. 2013, 46, 34–42. [Google Scholar] [CrossRef]
- Okada, K.; Itoh, T. Scatterplot Selection for Dimensionality Reduction in Multidimensional Data Visualization. J. Vis. 2025, 28, 205–221. [Google Scholar] [CrossRef]
- Wang, L.; Wang, G.; Alexander, C.A. Big Data and Visualization: Methods, Challenges and Technology Progress. Digit. Technol. 2015, 1, 33–38. [Google Scholar]
- Cai, L.; Guan, X.; Chi, P.; Chen, L.; Luo, J. Big Data Visualization Collaborative Filtering Algorithm Based on RHadoop. Int. J. Distrib. Sens. Netw. 2015, 11, 271253. [Google Scholar] [CrossRef]
- Freitag, B.; Maskey, M.; Barciauskas, A.; Solvsteen, J.; Colliander, J.; Munroe, J. The Visualization, Exploration, and Data Analysis (VEDA) Platform: A Modular, Open Platform Lowering the Barrier to Entry to Cloud Computing. In Proceedings of the 2024 IEEE International Geoscience and Remote Sensing Symposium, Athens, Greece, 7–12 July 2024; pp. 3736–3739. [Google Scholar]
- Gorodov, E.Y.E.; Gubarev, V.V.E. Analytical Review of Data Visualization Methods in Application to Big Data. J. Electr. Comput. Eng. 2013, 2013, 969458. [Google Scholar] [CrossRef]
- Rajeevan, S.; Ramachandran, S.; Poulose, A. Tableau-driven Data Analysis and Visualization of COVID-19 Cases in India. In Proceedings of the 5th IEEE International Conference on Innovative Trends in Information Technology, Kottayam, India, 15–16 March 2024; pp. 1–6. [Google Scholar]
- Singh, G.; Kumar, A.; Singh, J.; Kaur, J. Data visualization for developing effective performance dashboard with Power BI. In Proceedings of the 2023 IEEE International Conference on Innovative Data Communication Technologies and Application, Uttarakhand, India, 14–16 March 2023; pp. 968–973. [Google Scholar]
- Gorle, D.L.; Padala, A. The Impact of COVID-19 Deaths, Medical Analysis & Visualization Using Plotly. Int. J. Health Sci. 2022, 6, 11957–11971. [Google Scholar]
- Zhang, Y.; Sun, Y.; Gaggiano, J.D.; Kumar, N.; Andris, C.; Parker, A.G. Visualization Design Practices in a Crisis: Behind the Scenes with COVID-19 Dashboard Creators. IEEE Trans. Vis. Comput. Graph. 2023, 29, 1037–1047. [Google Scholar] [CrossRef]
- Bastian, M.; Heymann, S.; Jacomy, M. Gephi: An Open Source Software for Exploring and Manipulating Networks. In Proceedings of the 3rd International AAAI Conference on Weblogs and Social Media, San Jose, CA, USA, 17–20 May 2009; pp. 361–362. [Google Scholar]
- Cernile, G.; Heritage, T.; Sebire, N.J.; Gordon, B.; Schwering, T.; Kazemlou, S.; Borecki, Y. Network Graph Representation of COVID-19 Scientific Publications to Aid Knowledge Discovery. BMJ Health Care Inform. 2021, 28, 100254. [Google Scholar] [CrossRef]
- Alvarez, M.M.; González-González, E.; Trujillo-de Santiago, G. Modeling COVID-19 Epidemics in an Excel Spreadsheet to Enable First-Hand Accurate Predictions of the Pandemic Evolution in Urban Areas. Sci. Rep. 2021, 11, 4327. [Google Scholar] [CrossRef]
- Albahri, A.S.; Hamid, R.A.; Alwan, J.K.; Al-Qays, Z.T.; Zaidan, A.A.; Zaidan, B.B.; Albahri, O.S.; Al-Amoodi, A.H.; Khlaf, J.M.; Almahdi, E.M.; et al. Role of Biological Data Mining and Machine Learning Techniques in Detecting and Diagnosing the Novel Coronavirus (COVID-19): A Systematic Review. J. Med. Syst. 2020, 44, 122. [Google Scholar] [CrossRef]
- Johns Hopkins University & Medicine. COVID-19 Dashboard. Available online: https://coronavirus.jhu.edu/map.html (accessed on 20 December 2024).
- European Centre for Disease Prevention and Control. COVID-19 EU/EEA Daily Cases and Deaths Dashboard. Available online: https://qap.ecdc.europa.eu/public/extensions/COVID-19/COVID-19.html (accessed on 20 December 2024).
- Bothorel, G.; Serrurier, M.; Hurter, C. Visualization of Frequent Itemsets with Nested Circular Layout and Bundling Algorithm. In Proceedings of the 9th International Symposium on Advanced in Visual Computing, Rethymnon, Crete, Greece, 29–31 July 2013; pp. 396–405. [Google Scholar]
- Wong, P.C. Visual Data Mining. IEEE Comput. Graph. Appl. 1999, 19, 20–21. [Google Scholar] [CrossRef]
- Leung, C.K.; Irani, P.; Carmichael, C.L. FIsViz: A Frequent Itemset Visualizer. In Proceedings of the 12th Pacific-Asia Conference on Knowledge Discovery and Data Mining, Osaka, Japan, 20–23 May 2008; pp. 644–652. [Google Scholar]
- Leung, C.K.; Kononov, V.V.; Pazdor, A.G.M.; Jiang, F. PyramidViz: Visual Analytics and Big Data Visualization for Frequent Patterns. In Proceedings of the 14th IEEE DASC/PICom/DataCom/CyberSciTech, Auckland, New Zealand, 8–12 August 2016; pp. 913–916. [Google Scholar]
- Leung, C.K.; Jiang, F.; Irani, P.P. FpMapViz: A Space-Filling Visualization for Frequent Patterns. In Proceedings of the 11th IEEE International Conference on Data Mining Workshops, Vancouver, BC, Canada, 11 December 2011; pp. 804–811. [Google Scholar]
- Cappers, B.C.M.; Van Wijk, J.J. Exploring Multivariate Event Sequences using Rules, Aggregations, and Selections. IEEE Trans. Vis. Comput. Graph. 2018, 24, 532–541. [Google Scholar] [CrossRef] [PubMed]
- Zhao, J.; Liu, Z.; Dontcheva, M.; Hertzmann, A.; Wilson, A. MatrixWave: Visual Comparison of Event Sequence Data. In Proceedings of the 33rd Annual ACM Conference on Human Factors in Computing Systems, Seoul, Republic of Korea, 18–23 April 2015; pp. 259–268. [Google Scholar]
- Chen, Y.; Xu, P.; Ren, L. Sequence Synopsis: Optimize Visual Summary of Temporal Event Data. IEEE Trans. Vis. Comput. Graph. 2017, 24, 45–55. [Google Scholar] [CrossRef] [PubMed]
- Stolper, C.D.; Perer, A.; Gotz, D. Progressive Visual Analytics: User-Driven Visual Exploration of In-Progress Analytics. IEEE Trans. Vis. Comput. Graph. 2014, 20, 1653–1662. [Google Scholar] [CrossRef] [PubMed]
- Jentner, W.; El-Assady, M.; Gipp, B.; Keim, D.A. Feature Alignment for the Analysis of Verbatim Text Transcripts. In Proceedings of the 8th International EuroVis Workshop on Visual Analytics, Barcelona, Spain, 12–13 June 2017; pp. 13–17. [Google Scholar]
- Agrawal, R.; Srikant, R. Fast Algorithms for Mining Association Rules in Large Databases. In Proceedings of the 20th International Conference on Very Large Data Bases, Santiago de, Chile, Chile, 12–15 September 1994; pp. 487–499. [Google Scholar]
- Han, J.; Pei, J.; Yin, Y.; Mao, R. Mining Frequent Patterns without Candidate Generation: A Frequent-Pattern Tree Approach. Data Min. Knowl. Discov. 2004, 8, 53–87. [Google Scholar] [CrossRef]
- Imtiaz, S.A.; Shah, S.L. Treatment of Missing Values in Process Data Analysis. Can. J. Chem. Eng. 2008, 86, 838–858. [Google Scholar] [CrossRef]
- Nelson, P.R.C.; Taylor, P.A.; MacGregor, J.F. Missing Data Methods in PCA and PLS: Score Calculations with Incomplete Observations. Chemom. Intell. Lab. Syst. 1996, 35, 45–65. [Google Scholar] [CrossRef]
- Hashem, I.A.T.; Yaqoob, I.; Anuar, N.B.; Mokhtar, S.; Gani, A.; Khan, S.U. The Rise of “Big Data” on Cloud Computing: Review and Open Research Issues. Inf. Syst. 2015, 47, 98–115. [Google Scholar] [CrossRef]
- Batini, C.; Lenzerini, M.; Navathe, S.B. A Comparative Analysis of Methodologies for Database Schema Integration. ACM Comput. Surv. 1986, 18, 323–364. [Google Scholar] [CrossRef]
- Chen, M.; Mao, S.; Liu, Y. Big Data: A survey. Mob. Netw. Appl. 2014, 19, 171–209. [Google Scholar] [CrossRef]
- Jagadish, H.V.; Gehrke, J.; Labrinidis, A.; Papakonstantinou, Y.; Patel, J.M.; Ramakrishnan, R.; Shahabi, C. Big Data and its Technical Challenges. Commun. ACM 2014, 57, 86–94. [Google Scholar] [CrossRef]
- Naeem, M.A.; Mehmood, E.; Malik, M.A.; Jamil, N. Optimizing Semi-Stream CACHEJOIN for Near-Real-Time Data Warehousing. J. Database Manag. 2020, 31, 20–37. [Google Scholar] [CrossRef]
- Shi, P.; Cui, Y.; Xu, K.; Zhang, M.; Ding, L. Data Consistency Theory and Case Study for Scientific Big Data. Information 2019, 10, 137. [Google Scholar] [CrossRef]
- Rahm, E.; Do, H.H. Data Cleaning: Problems and Current Approaches. IEEE Data Eng. Bull. 2000, 23, 3–13. [Google Scholar]
- Chu, X.; Ilyas, I.F.; Krishnan, S.; Wang, J. Data Cleaning: Overview and Emerging Challenges. In Proceedings of the 2016 ACM International Conference on Management of Data, San Francisco, CA, USA, 26 June–1 July 2016; pp. 2201–2206. [Google Scholar]
- Adikaram, K.K.L.B.; Hussein, M.A.; Effenberger, M.; Becker, T. Data Transformation Technique to Improve the Outlier Detection Power of Grubbs’ Test for Data Expected to Follow Linear Relation. J. Appl. Math. 2015, 2015, 708948. [Google Scholar] [CrossRef]
- Jolai, F.; Ghanbari, A. Integrating Data Transformation Techniques with Hopfield Neural Networks for Solving Travelling Salesman Problem. Expert Syst. Appl. 2010, 37, 5331–5335. [Google Scholar] [CrossRef]
- Li, X.; Lee, J.; Rangarajan, A.; Ranka, S. Attention Based Machine Learning Methods for Data Reduction with Guaranteed Error Bounds. In Proceedings of the 2024 IEEE International Conference on Big Data, Washington, DC, USA, 15–18 December 2024; pp. 1039–1048. [Google Scholar]
- Li, S.; Marsaglia, L.; Garth, C.; Woodring, J.; Clyne, J.P.; Childs, H. Data Reduction Techniques for Simulation, Visualization and Data Analysis. Comput. Graph. Forum 2018, 37, 422–447. [Google Scholar] [CrossRef]
- Sorzano, C.O.S.; Vargas, J.; Pascual-Montano, A.D. A Survey of Dimensionality Reduction Techniques. arXiv 2014, arXiv:1403.2877. [Google Scholar]
- Abdi, H.; Williams, L.J. Principal Component Analysis. WIREs Comput. Stat. 2010, 2, 433–459. [Google Scholar] [CrossRef]
- Molina, L.C.; Belanche, L.; Nebot, À. Feature Selection Algorithms: A Survey and Experimental Evaluation. In Proceedings of the 2002 IEEE International Conference on Data Mining, Maebashi City, Japan, 9–12 December 2002; pp. 306–313. [Google Scholar]
- Yang, S.; Kim, J.K. Statistical Data Integration in Survey Sampling: A Review. Jpn. J. Stat. Data Sci. 2020, 3, 625–650. [Google Scholar] [CrossRef]
- Levy, A.Y. Logic-Based Techniques in Data Integration. In Logic-Based Artificial Intelligence; Springer: Boston, MA, USA, 2000; pp. 575–595. [Google Scholar]
- Dobre, C.; Xhafa, F. Parallel Programming Paradigms and Frameworks in Big Data Era. Int. J. Parallel Program. 2014, 42, 710–738. [Google Scholar] [CrossRef]
- Cuzzocrea, A. Improving Range-Sum Query Evaluation on Data Cubes via Polynomial Approximation. Data Knowl. Eng. 2006, 56, 85–121. [Google Scholar] [CrossRef]
- Cuzzocrea, A.; Moussa, R.; Xu, G. OLAP*: Effectively and Efficiently Supporting Parallel OLAP over Big Data. In Proceedings of the 3rd International Conference on Model and Data Engineering, Amantea, Italy, 25–27 September 2013; pp. 38–49. [Google Scholar]
- Chaudhuri, S.; Dayal, U. An Overview of Data Warehousing and OLAP Technology. SIGMOD Rec. 1997, 26, 65–74. [Google Scholar] [CrossRef]
- Cuzzocrea, A.; Furfaro, F.; Mazzeo, G.M.; Saccà, D. A Grid Framework for Approximate Aggregate Query Answering on Summarized Sensor Network Readings. In Proceedings of the 2004 OTM Confederated International Workshops on the Move to Meaningful Internet Systems, Agia Napa, Cyprus, 25–29 October 2004; pp. 144–153. [Google Scholar]
- Orji, F.A.; Vassileva, J. Using Machine Learning to Explore the Relation between Student Engagement and Student Performance. In Proceedings of the 24th IEEE International Conference on Information Visualisation, Melbourne, Australia, 7–11 September 2020; pp. 480–485. [Google Scholar]
- Alves, M.A.; Castro, G.Z.; Oliveira, B.A.S.; Ferreira, L.A.; Ramírez, J.A.; Silva, R.; Guimarães, F.G. Explaining Machine Learning Based Diagnosis of COVID-19 from Routine Blood Tests with Decision Trees and Criteria Graphs. Comput. Biol. Med. 2021, 132, 104335. [Google Scholar] [CrossRef]
- Gupta, V.K.; Gupta, A.; Kumar, D.K.; Sardana, A. Prediction of COVID-19 Confirmed, Death, and Cured Cases in India Using Random Forest Model. Big Data Min. Anal. 2021, 4, 116–123. [Google Scholar] [CrossRef]
- Dixit, A.; Mani, A.; Bansal, R. CoV2-Detect-Net: Design of COVID-19 Prediction Model Based on Hybrid DE-PSO with SVM Using Chest X-Ray Images. Inf. Sci. 2021, 571, 676–692. [Google Scholar] [CrossRef]
- Al-Aziz, S.N.; Albayati, B.; El-Bagoury, A.A.H.; Shafik, W. Clustering of COVID-19 Multi-Time Series-Based K-Means and PCA with Forecasting. Int. J. Data Warehous. Min. 2023, 19, 1–25. [Google Scholar] [CrossRef]
- Homayouni, H.; Ray, I.; Ghosh, S.; Gondalia, S.; Kahn, M.G. Anomaly Detection in COVID-19 Time-Series Data. SN Comput. Sci. 2021, 2, 279. [Google Scholar] [CrossRef]
- Liu, Z.; Shen, L. CECT: Controllable Ensemble CNN and Transformer for COVID-19 Image Classification. Comput. Biol. Med. 2024, 173, 108388. [Google Scholar] [CrossRef]
- Perez, C.; Karmakar, S. An NLP-Assisted Bayesian Time-Series Analysis for Prevalence of Twitter Cyberbullying During the COVID-19 Pandemic. Soc. Netw. Anal. Min. 2023, 13, 51. [Google Scholar] [CrossRef]
- Malviya, A.; Dixit, R.; Shukla, A.; Kushwaha, N. A Novel Approach to Detection of COVID-19 and Other Respiratory Diseases Using Autoencoder and LSTM. SN Comput. Sci. 2025, 6, 27. [Google Scholar] [CrossRef]
- Amin, S.U.; Taj, S.; Hussain, A.; Seo, S. An Automated Chest X-Ray Analysis for COVID-19, Tuberculosis, and Pneumonia Employing Ensemble Learning Approach. Biomed. Signal Process. Control 2024, 87, 105408. [Google Scholar] [CrossRef]
- Saleh, S.N. Enhancing Multilabel Classification for Unbalanced COVID-19 Vaccination Hesitancy Tweets Using Ensemble Learning. Comput. Biol. Med. 2025, 184, 109437. [Google Scholar] [CrossRef] [PubMed]
- Altarawneh, L.; Agarwal, A.; Yang, Y.; Jin, Y. A Multi-Source Window-Dependent Transfer Learning Approach for COVID-19 Vaccination Rate Prediction. Eng. Appl. Artif. Intell. 2024, 136, 109037. [Google Scholar] [CrossRef]
- Prabakaran, G.; Jayanthi, K. Efficient Deep Transfer Learning Based COVID-19 Detection and Classification Using CT Images. Int. J. Syst. Syst. Eng. 2024, 14, 174–189. [Google Scholar] [CrossRef]
- Song, B.; Wang, X.; Sun, P.; Boukerche, A. Robust COVID-19 Vaccination Control in a Multi-City Dynamic Transmission Network: A Novel Reinforcement Learning-Based Approach. J. Netw. Comput. Appl. 2023, 219, 103715. [Google Scholar] [CrossRef]
- Sarwar, A.; Almadani, A.; Agu, E.O. Early Time Series Classification Using Reinforcement Learning for Pre-Symptomatic Covid-19 Screening From Imbalanced Health Tracker Data. IEEE J. Biomed. Health Inform. 2025, 29, 2246–2256. [Google Scholar] [CrossRef]
- Nawrocki, P.; Smendowski, M. FinOps-Driven Optimization of Cloud Resource Usage for High-Performance Computing Using Machine Learning. J. Comput. Sci. 2024, 79, 102292. [Google Scholar] [CrossRef]
- Jamal, M.K.; Faisal, M. Machine Learning-Driven Implementation of Workflow Optimization in Cloud Computing for IoT Applications. Internet Technol. Lett. 2025, 8, e571. [Google Scholar] [CrossRef]
- Keim, D.A.; Mansmann, F.; Schneidewind, J.; Thomas, J.J.; Ziegler, H. Visual Analytics: Scope and Challenges. In Visual Data Mining; Springer: Berlin/Heidelberg, Germany, 2008; pp. 76–90. [Google Scholar]
- Heer, J.; Bostock, M.; Ogievetsky, V. A Tour Through the Visualization Zoo. Commun. ACM 2010, 53, 59–67. [Google Scholar] [CrossRef]
- Liu, D. Application of High-Dimensional Data Visualization and Visual Communication Technology in Virtual Reality Environment. Scalable Comput. Pract. Exp. 2024, 25, 2548–2557. [Google Scholar] [CrossRef]
- Fekete, J.D.; Van Wijk, J.J.; Stasko, J.T.; North, C. The Value of Information Visualization. In Information Visualization; Springer: Berlin/Heidelberg, Germany, 2008; pp. 1–18. [Google Scholar]
- Cuzzocrea, A.; Leung, C.K.; Soufargi, S.; Gallo, C.; Shang, S.; Chen, Y. OLAP over Big COVID-19 Data: A Real-Life Case Study. In Proceedings of the DASC/PiCom/CBDCom/CyberSciTech 2022, Falerna, Italy, 15–18 September 2022; pp. 1–6. [Google Scholar]
- Leung, C.K.; Chen, Y.; Hoi, C.S.H.; Shang, S.; Cuzzocrea, A. Machine Learning and OLAP on Big COVID-19 Data. In Proceedings of the 2020 IEEE International Conference on Big Data, Atlanta, GA, USA, 10–13 December 2020; pp. 5118–5127. [Google Scholar]
- Bukhari, A.H.; Raja, M.A.Z.; Sulaiman, M.; Islam, S.; Shoaib, M.; Kumam, P. Fractional Neuro-Sequential ARFIMA-LSTM for Financial Market Forecasting. IEEE Access 2020, 8, 71326–71338. [Google Scholar] [CrossRef]
- Dixit, K.K.; Aswal, U.S.; Muthuvel, S.K.; Chari, S.L.; Sararswat, M.; Srivastava, A. Sequential Data Analysis in Healthcare: Predicting Disease Progression with Long Short-Term Memory Networks. In Proceedings of the 2023 IEEE International Conference on Artificial Intelligence for Innovations in Healthcare Industries, Raipur, India, 29–30 December 2023; pp. 1–6. [Google Scholar]
- Safaei, A.A. Real-Time Processing of Streaming Big Data. Real-Time Syst. 2017, 53, 1–44. [Google Scholar] [CrossRef]
- Gürcan, F.; Berigel, M. Real-Time Processing of Big Data Streams: Lifecycle, Tools, Tasks, and Challenges. In Proceedings of the 2nd IEEE International Symposium on Multidisciplinary Studies and Innovative Technologies, Ankara, Turkey, 19–21 October 2018; pp. 1–6. [Google Scholar]
- Poulinakis, K.; Drikakis, D.; Kokkinakis, I.W.; Spottswood, S.M. Machine-Learning Methods on Noisy and Sparse Data. Mathematics 2023, 11, 236. [Google Scholar] [CrossRef]
- Sahoo, S.K.; Makur, A. Sparse Sequential Generalization of K-Means for Dictionary Training on Noisy Signals. Signal Process. 2016, 129, 62–66. [Google Scholar] [CrossRef]
- Hino, M.; Benami, E.; Brooks, N. Machine Learning for Environmental Monitoring. Nat. Sustain. 2018, 1, 583–588. [Google Scholar] [CrossRef]
- Ghannam, R.B.; Techtmann, S.M. Machine Learning Applications in Microbial Ecology, Human Microbiome Studies, and Environmental Monitoring. Comput. Struct. Biotechnol. J. 2021, 19, 1092–1107. [Google Scholar] [CrossRef]
- Himeur, Y.; Rimal, B.; Tiwary, A.; Amira, A. Using Artificial Intelligence and Data Fusion for Environmental Monitoring: A Review and Future Perspectives. Inf. Fusion 2022, 86, 44–75. [Google Scholar] [CrossRef]
- Wang, J.L.; Chan, S.H. Stock Market Trading Rule Discovery Using Pattern Recognition and Technical Analysis. Expert Syst. Appl. 2007, 33, 304–315. [Google Scholar] [CrossRef]
- Dorr, D.H.; Denton, A.M. Establishing Relationships among Patterns in Stock Market Data. Data Knowl. Eng. 2009, 68, 318–337. [Google Scholar] [CrossRef]
- Leukel, J.; González, J.; Riekert, M. Adoption of Machine Learning Technology for Failure Prediction in Industrial Maintenance: A Systematic Review. J. Manuf. Syst. 2021, 61, 87–96. [Google Scholar] [CrossRef]
- Olsen, C.R.; Mentz, R.J.; Anstrom, K.J.; Page, D.; Patel, P.A. Clinical Applications of Machine Learning in the Diagnosis, Classification, and Prediction of Heart Failure. Am. Heart J. 2020, 229, 1–17. [Google Scholar] [CrossRef] [PubMed]
- Xu, K.; Yue, H.; Guo, L.; Guo, Y.; Fang, Y. Privacy-Preserving Machine Learning Algorithms for Big Data Systems. In Proceedings of the 35th IEEE International Conference on Distributed Computing Systems, Columbus, OH, USA, 29 June–2 July 2015; pp. 318–327. [Google Scholar]
- Servin, C.; Kosheleva, O.; Kreinovich, V. Adversarial Teaching Approach to Cybersecurity: A Mathematical Model Explains Why It Works Well. In Proceedings of the 24th IEEE International Conference on Information Visualisation, Melbourne, Australia, 7–11 September 2020; pp. 313–316. [Google Scholar]
- Masum, M.; Shahriar, H.; Haddad, H.; Faruk, J.H.; Valero, M.; Khan, M.A.; Rahman, M.A.; Adnan, M.I.; Cuzzocrea, A.; Wu, F. Bayesian Hyperparameter Optimization for Deep Neural Network-based Network Intrusion Detection. In Proceedings of the 2021 IEEE International Conference on Big Data, Orlando, FL, USA, 15–18 December 2021; pp. 5413–5419. [Google Scholar]
- Faruk, M.J.H.; Shahriar, H.; Valero, M.; Barsha, F.L.; Sobhan, S.; Khan, M.A.; Whitman, M.E.; Cuzzocrea, A.; Lo, D.C.; Rahman, A.; et al. Malware Detection and Prevention using Artificial Intelligence Techniques. In Proceedings of the 2021 IEEE International Conference on Big Data, Orlando, FL, USA, 15–18 December 2021; pp. 5369–5377. [Google Scholar]
- De Abreu Araújo, I.; Hidaka Torres, R.; Neto, N.C.S. A Review of Framework for Machine Learning Interpretability. In Proceedings of the 16th International Conference on Human-Computer Interaction, Washington DC, USA, 29 June-4 July 2022; pp. 261–272. [Google Scholar]
- Mollas, I.; Bassiliades, N.; Tsoumakas, G. Truthful Meta-Explanations for Local Interpretability of Machine Learning Models. Appl. Intell. 2023, 53, 26927–26948. [Google Scholar] [CrossRef]
- Belle, V.; Papantonis, I. Principles and Practice of Explainable Machine Learning. Front. Big Data 2022, 4, 688969. [Google Scholar] [CrossRef] [PubMed]
- Blanco-Justicia, A.; Domingo-Ferrer, J. Machine Learning Explainability through Comprehensible Decision Trees. In Proceedings of the 3rd International Cross-Domain Conference on Machine Learning and Knowledge Extraction, Canterbury, UK, 26–29 August 2019; pp. 15–26. [Google Scholar]
Disclaimer/Publisher’s Note: The statements, opinions and data contained in all publications are solely those of the individual author(s) and contributor(s) and not of MDPI and/or the editor(s). MDPI and/or the editor(s) disclaim responsibility for any injury to people or property resulting from any ideas, methods, instructions or products referred to in the content. |
© 2025 by the authors. Licensee MDPI, Basel, Switzerland. This article is an open access article distributed under the terms and conditions of the Creative Commons Attribution (CC BY) license (https://creativecommons.org/licenses/by/4.0/).
Share and Cite
Cuzzocrea, A.; Belmerabet, I.; Hafsaoui, A.; Leung, C.K. A Machine-Learning-Based Data Science Framework for Effectively and Efficiently Processing, Managing, and Visualizing Big Sequential Data. Computers 2025, 14, 276. https://doi.org/10.3390/computers14070276
Cuzzocrea A, Belmerabet I, Hafsaoui A, Leung CK. A Machine-Learning-Based Data Science Framework for Effectively and Efficiently Processing, Managing, and Visualizing Big Sequential Data. Computers. 2025; 14(7):276. https://doi.org/10.3390/computers14070276
Chicago/Turabian StyleCuzzocrea, Alfredo, Islam Belmerabet, Abderraouf Hafsaoui, and Carson K. Leung. 2025. "A Machine-Learning-Based Data Science Framework for Effectively and Efficiently Processing, Managing, and Visualizing Big Sequential Data" Computers 14, no. 7: 276. https://doi.org/10.3390/computers14070276
APA StyleCuzzocrea, A., Belmerabet, I., Hafsaoui, A., & Leung, C. K. (2025). A Machine-Learning-Based Data Science Framework for Effectively and Efficiently Processing, Managing, and Visualizing Big Sequential Data. Computers, 14(7), 276. https://doi.org/10.3390/computers14070276