
Performance Evaluation and Analysis of Urban-Suburban 5G Cellular Networks


Abstract
1. Introduction
- A.
- 5G Characteristics
- B.
- 5G Standards
- C.
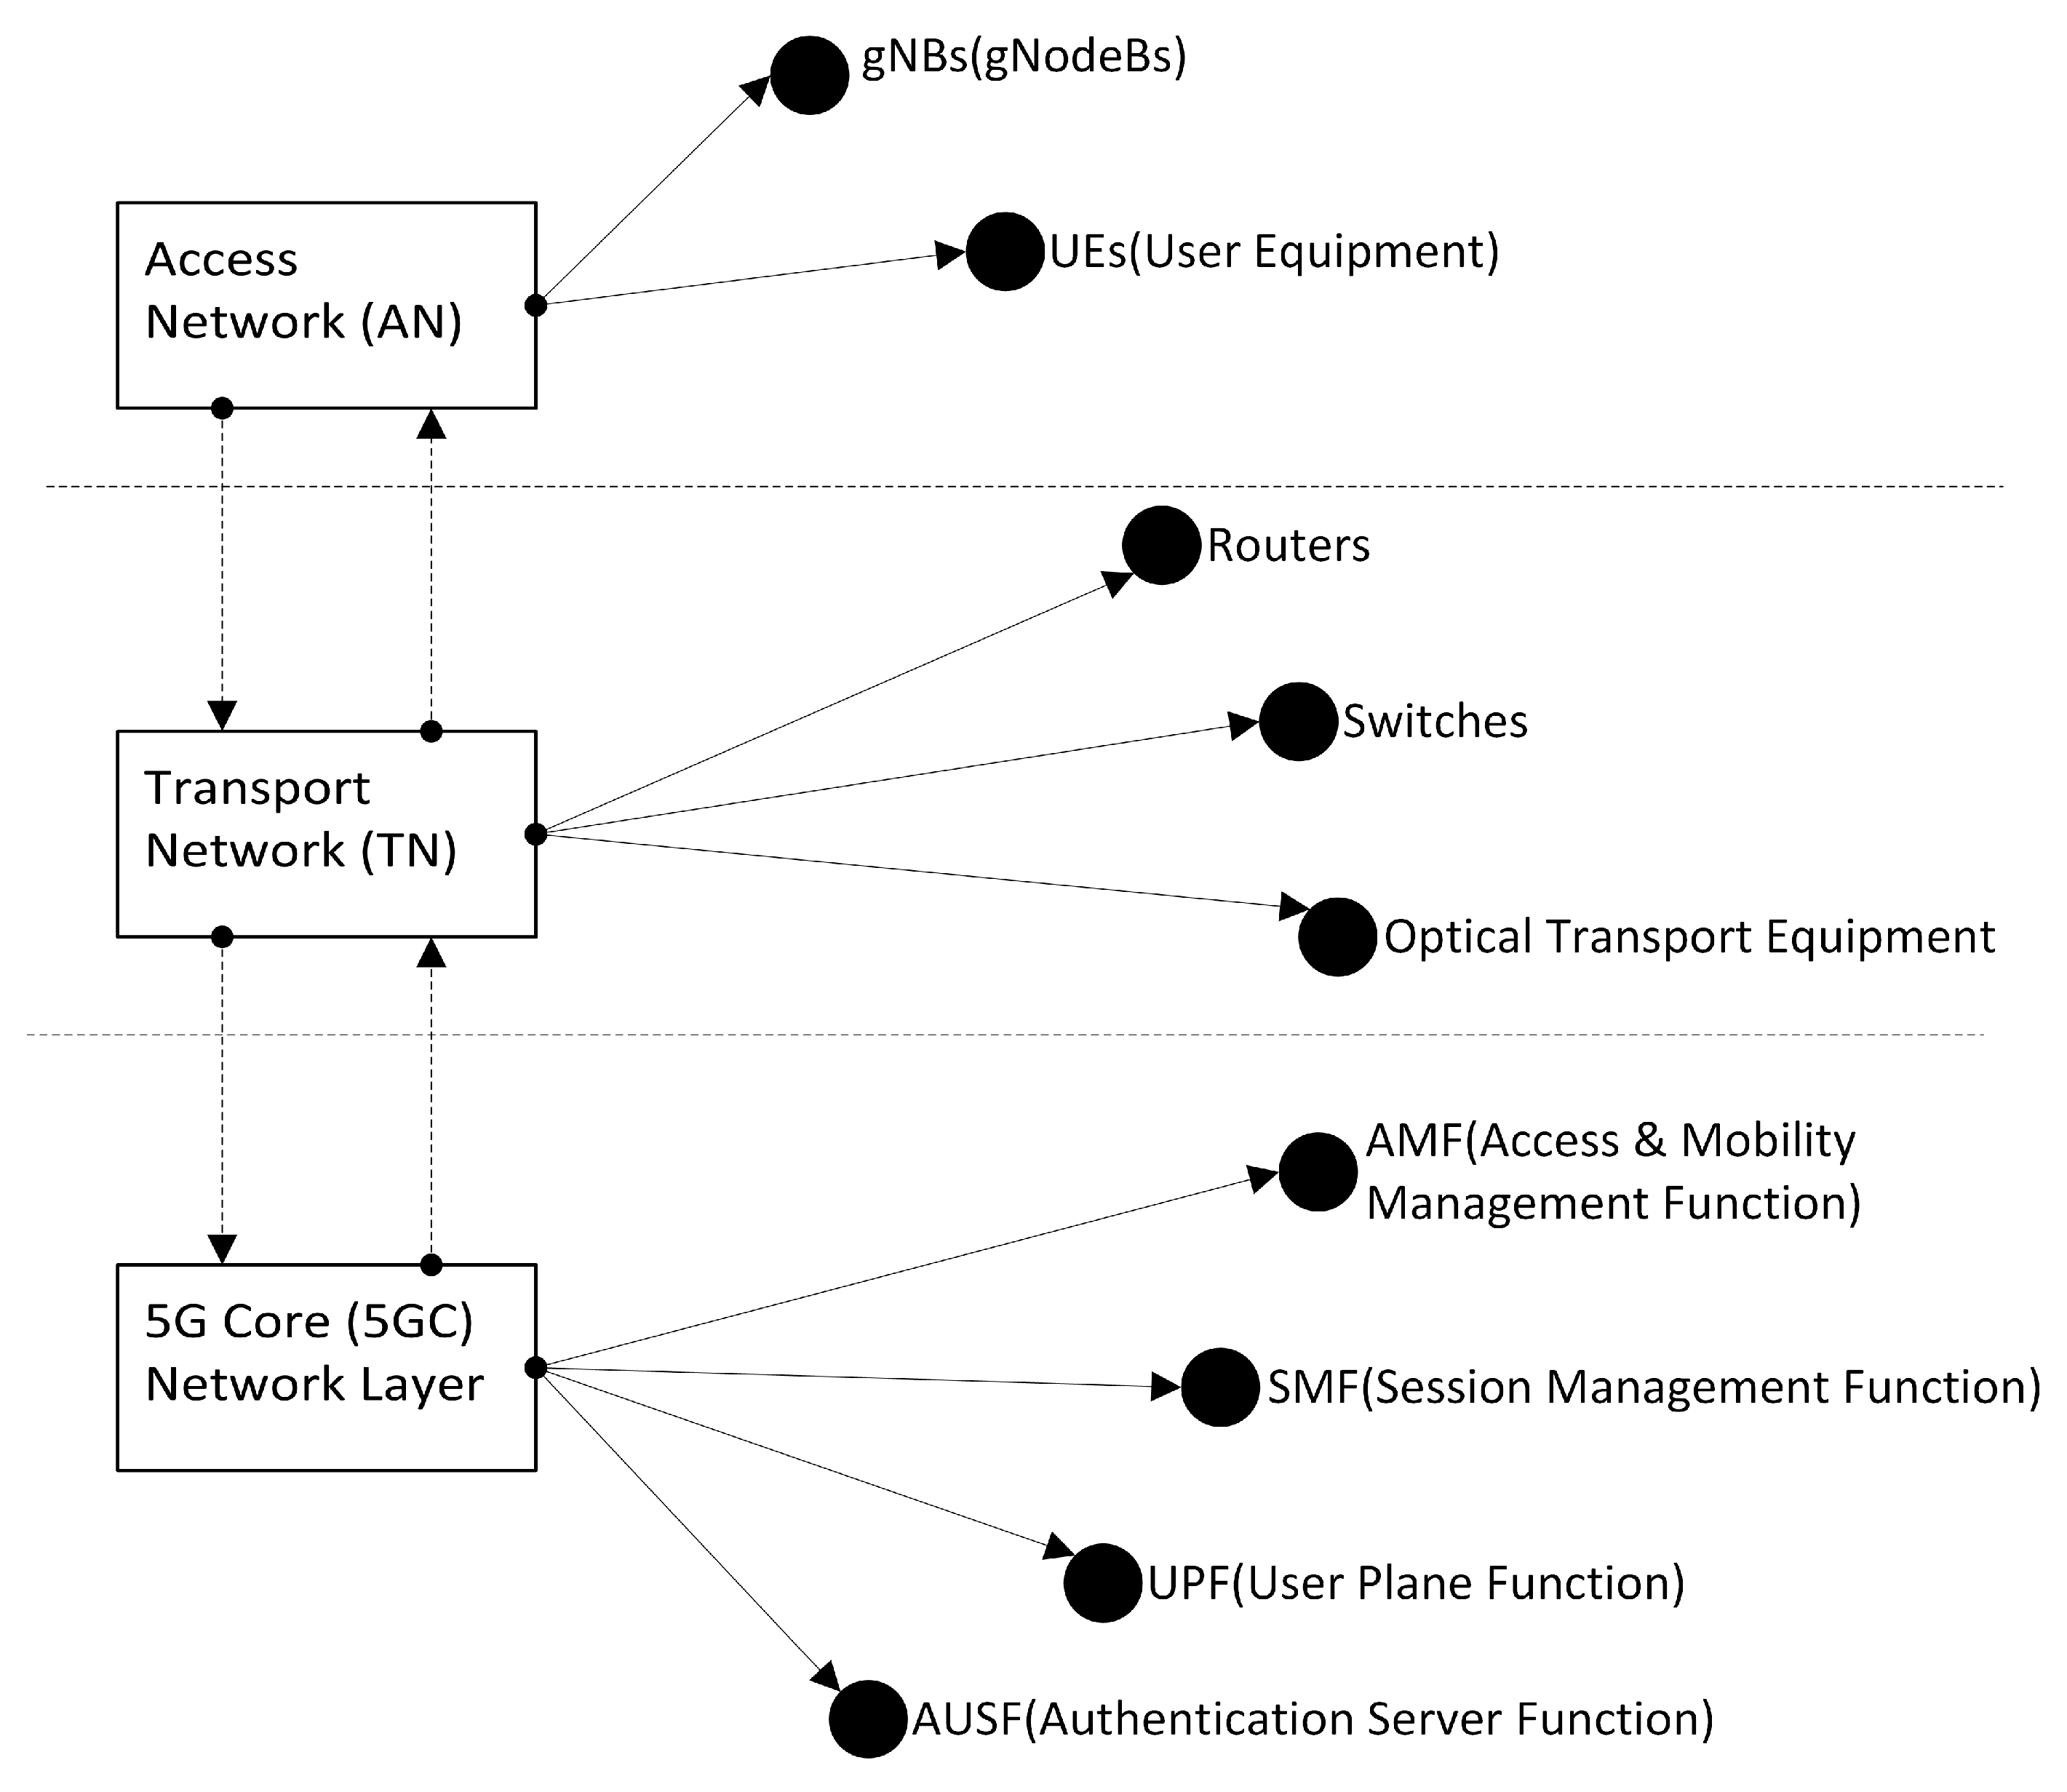
- 5G Architecture
Data Flow
2. Related Work
- The suggested urban-suburban model is new concerning the 5G application. The performance of the 5G network is studied concerning different parameters that affect the performance such as the non-orthogonality factor, the height of the mobile, the height of the base station, and the effect of load concentration. Moreover, comparative results are conducted to compare the realistic urban-suburban network with the non-realistic ideal free-space network.
- The main outcome and contribution of this work can be formulated as follows:
- ○
- The main goal of this research is to study the effect of different performance indicators on 5G performance and capacity. These indicators can be introduced to mobile operators to be considered as planning factors in the design of 5G network. Therefore, with the proposed model in this research, the end-user can have continuous connectivity under different propagation environments.
- ○
- It is shown in this research that studying 5G networks in more realistic environments degrades the network performance in areas where the load is concentrated. Therefore, a proper network-level call admission control algorithm that balances the load and manages the network resources is strongly needed. This is a very important issue to be considered by the research community while studying such systems.
- ○
- The introduced urban/suburban model in this research is very important because firstly, the real capacity of 5G is based on areas where the load and the density of the traffic is high. Secondly, the infrastructure of 5G which is based on mmWave can cover only short distances. Therefore, to ensure that networks provide connections with high-data throughput, low latency and other features already guaranteed by 5G, the focus will be on realistic small cell base stations.
- ○
- This research work also demonstrated the effect of the distance between base stations on the network capacity since capacity is a very critical issue in 5G. This issue is considered an optimization factor regarding cost performance and must be considered in the planning of 5G design and infrastructure.
- Different traffic scenarios and distributions should be considered in future work such as uniform and on-uniform traffic distribution over the network.
- To study the model in a more realistic status, the mobility model can be integrated into the model considering the seamless soft-handover principle of 5G between the target cell and the neighboring cells.
- I did not find any similar model scenario in the literature, otherwise, the results of the proposed model can be compared with other people’s work.
3. The Proposed Model
3.1. Modeling Assumptions
- The arrival process of the session over the whole network is assumed to be a Poisson process.
- The traffic is assumed to be uniformly distributed over the coverage area of each Node B.
- The service time is modeled by a Pareto random variable to represent the WWW nature of the traffic. The service time is modelled as a Pareto random variable which represents the self-similar behavior of WWW traffic. During a packet call, several packets may be generated, which means that the packet call establishes a burst sequence of packets. After the document has entirely arrived at the terminal, the user consumes a certain amount of time to study the information. This time interval is called reading time (s). Pareto parameters are obtained from the 3GPP standard [38] and given in Table 2.
- Two traffic scenarios are assumed: Homogeneous and Hotspot. In the homogeneous case, the load is equal for all cells. In the hotspot scenario, we assign twice as many calls to the central cell than each of the other six border cells.
- The mobile station is assumed to be stationary. Mobility is not considered in the current analysis.
- All cells are assumed to be the same size.
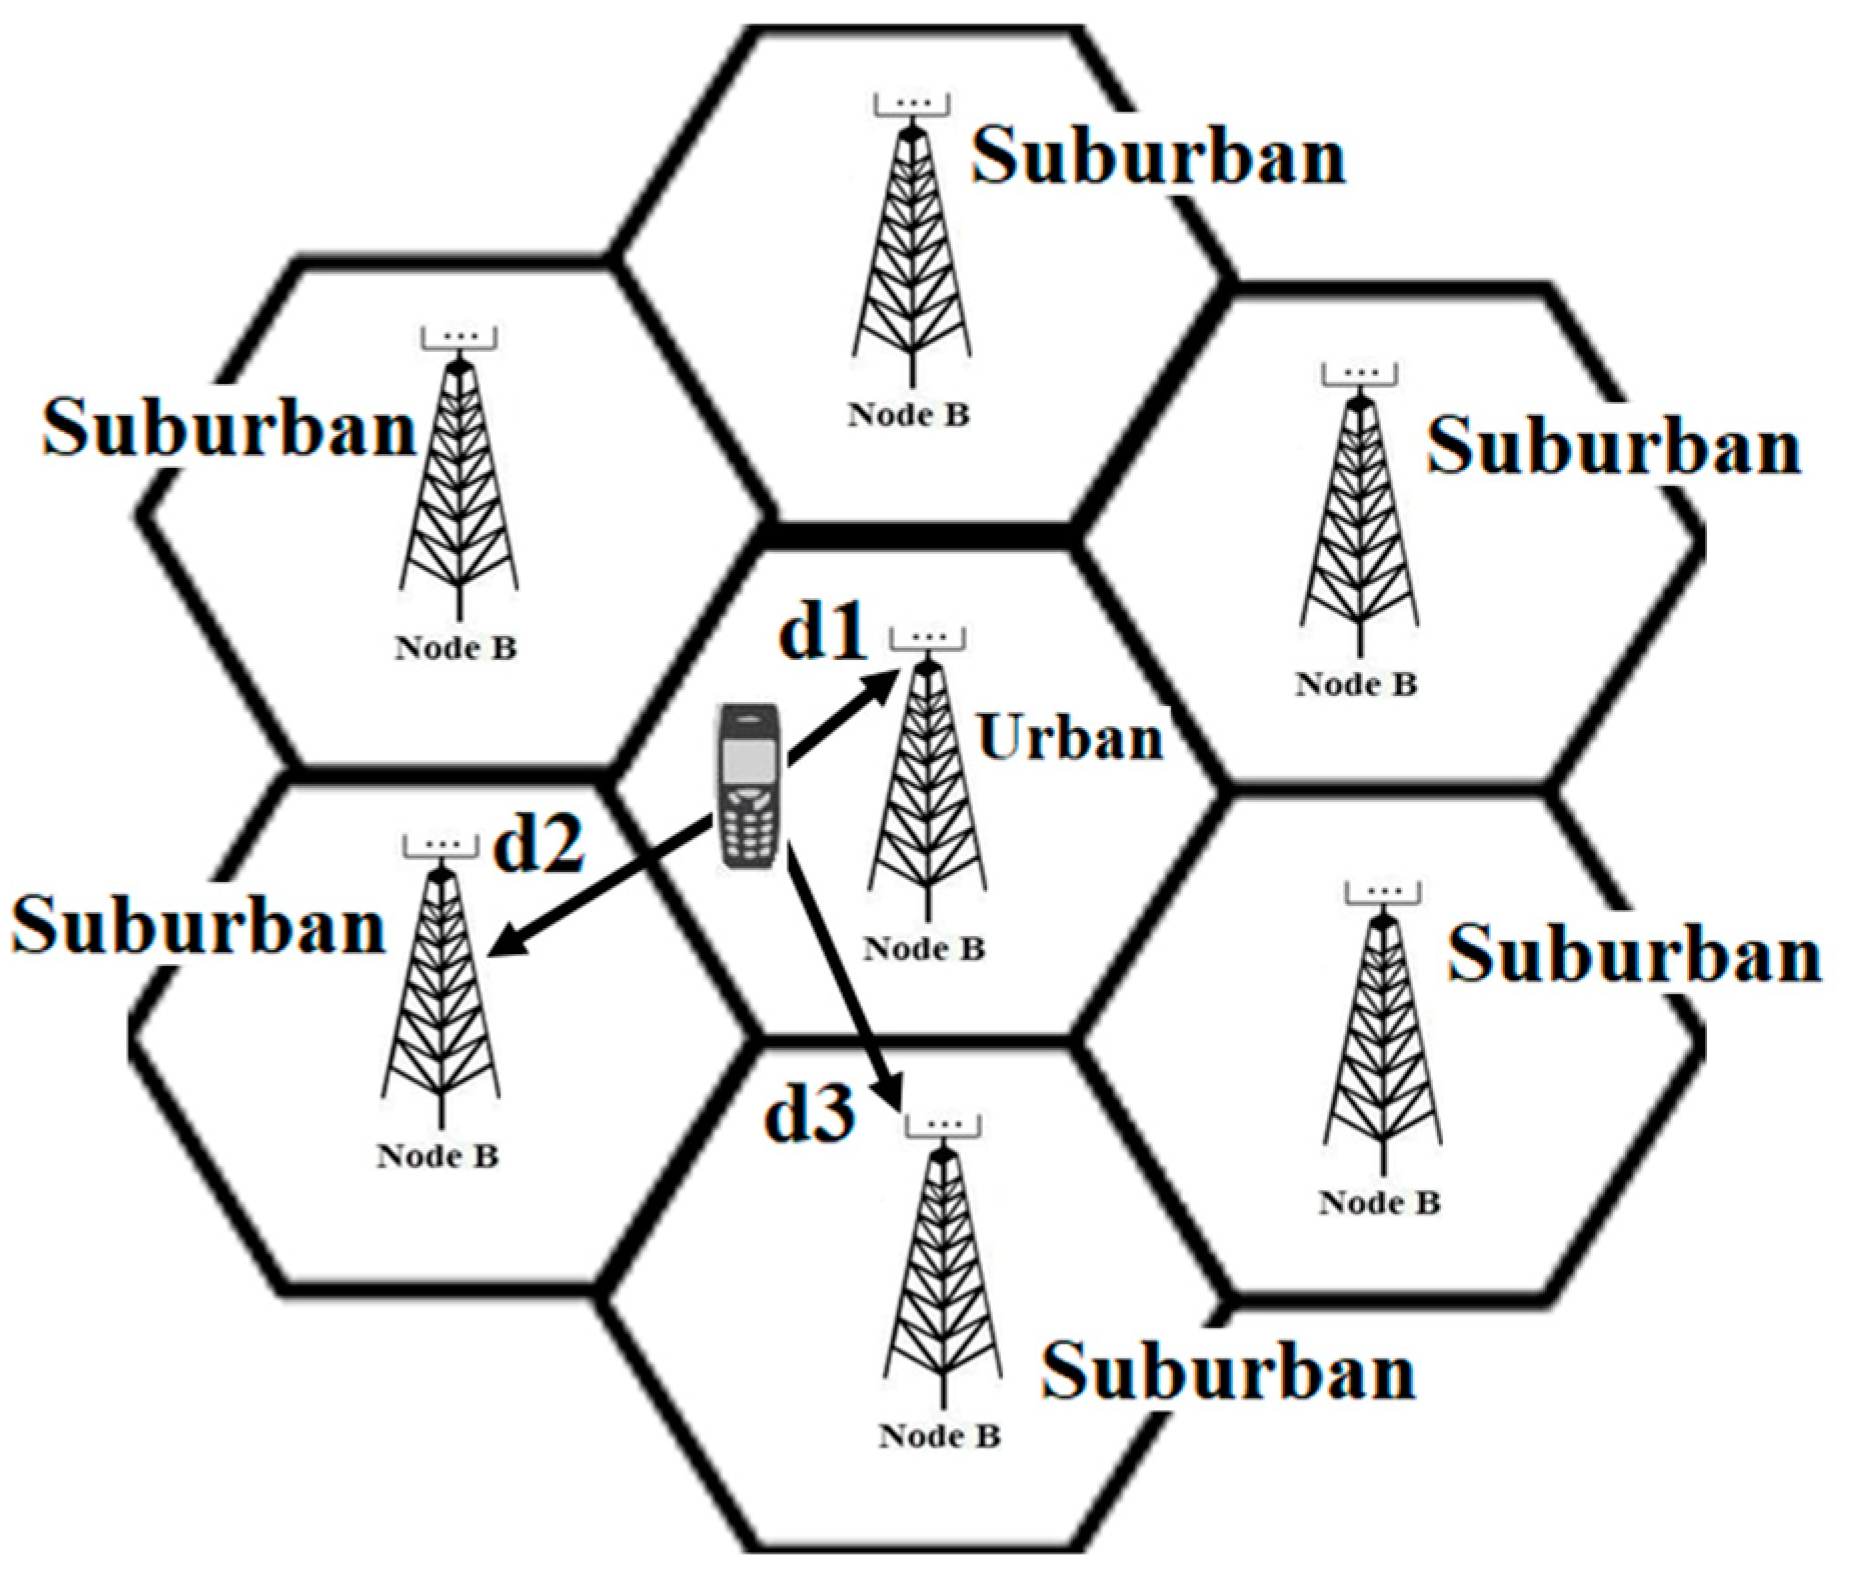
- The call admission control algorithm (CACA) proposed in [39] is applied in this study. The analysis is based on the soft handover principle in 5G networks, which allows the user equipment (UE) to connect gently with many Node Bs at the same time, as illustrated in Figure 4. Given that the signals will be conveyed, no resources will be granted until the UE meets the admission requirements defined by Node B, which are characterized in our model as the minimum bit rate threshold and minimum distance. This research effort assumes multi-cell deployment, as indicated in Figure 3, where the user equipment (UE) is softly connected with more than one Node B at the same time, However, during the soft handover process, UE will only be linked to one Node B based on the strongest signal, which is computed in the model using a threshold of minimum bit rate, minimum distance, and interference levels between the cell and other surrounding cells. The two parameters needed for the CACA are the maximum distance, dmax and the maximum number of active users, nmax. Note that all symbols and associated descriptions used in the following equations are listed in Table 1.

| Parameter | Value |
|---|---|
| Average Packet size | 480 bytes |
| Average requested file size (25 × 480 bytes) | 12 Kbytes |
| The average number of packet calls within a session | 5 |
| Average reading time between packet calls | 412 s |
| The average amount of packets within a packet call | 25 |
| Average inter-arrival time between packets | 0.0625 s |
| Wavelength,λ | 0.15 m |
| Signal-to-Noise Ratio, SNR | 2 dB |
| Thermal Noise, N0 | −103 dBm |
| Distance between Nodes B, d | 1000 m, 4000, 7000 m |
| Number of codes, N | 64 |
| Frequency, f | 20 GHz |
| Height of the mobile, hm | 2 m, 5 m |
| Height of the base station, hb | 50 m, 100 m |
| Service Factor, S(SF/SINR) | 16, 32, 64, 128 |
| Cell radius, r | 1, 7 km |
| Spreading factor, SF | 32, 64, 128, 256 chips/symbol |
| Maximum transmission power, Psmax | 125 W |
| Non-orthogonality factor,ε | 0.30, 0.40, 0.50 |
| Traffic intensity over the network (Erlang), λ/µ | 200, 250, …, 450 |
- λ is the wavelength
- PSmax is the maximum transmission power of the UE
- N0 is the thermal noise.
- S is the spreading factor (the ratio between the bandwidth of the user signal and the transmitted bandwidth) = Spreading factor (SF)/Signal-to-Noise ratio (SNR).
- ε is the non-orthogonality factor (interference factor).
- Assuming that the cell coverage is defined by a radius, r then the maximum number of active users in the cell can be defined as:
3.2. Model Solution by MOSEL-2
- First, the high-level system description is created using the MOSEL-2 tool in a simple C-like language. The model description is saved as “filename.mos”, which specifies the intended performance measures. Without programmer intervention, the described model is transferred to the assessment environment, where all subsequent steps are carried out.
- Second, the model is turned into a tool for creating input files using MOSEL-2 environment. This tool can be either C-based Stochastic Petri Net (C-Based SPNP) or TimeNet. After selecting a specific tool, the MOSEL-2 environment will invoke the tool.
- Third, the utility handles the input file in the following two ways, depending on options given in the command-line arguments.
- (a).
- Numerical analysis: during this analysis, the entire state space of the system is produced using the modeling language’s semantic rules. The obtained semantic model is linked to the stochastic process. The stochastic process will then be solved using the numerical solution algorithms that are accessible.
- (b).
- Simulation: the tool will evaluate the model using discrete event simulation, eliminating the need to construct the state space.
- The obtained results from discrete event simulation or numerical solutions are saved in a file with the tool structure.
3.3. Capacity Bounds Derivation
- where,
- is a propagation loss in environment of type E, in dB. E is 1 for urban and 2 for suburban.
- is the correction factor for each environment, E: E = 0 for urban and suburban models.
- f is the frequency of the transmission in MHz.
- hb is the height of base station or transmitter in meters.
- hm is the height of the mobile or receiver in meters.
- d is the distance between the transmitter and the receiver in kilometers.
- a (hm) is the mobile antenna correction factor.
- Therefore,
- 1.
- The propagation model for the urban environment is given as:
- where
- for the urban environment.
- 2.
- The propagation model for the urban environment is given as:
- where,
- is the transmitted power and is the received power.
- Moving the fraction to the left hand side, (7) can be rewritten as:
- where,
- is a function of the height of the mobile, hm, the height of the base station, hb and the frequency, f.
- is the correction parameter for each type of environment, E, which is a function based on the height of the mobile, hb, is given as:To be used for each environment (i.e., E is equal to 1 for urban and 2 for suburban)
- By introducing the distance, d, (12) can be rewritten as:
- For urban model:
- For suburban model:
4. Simulation Results with Discussion
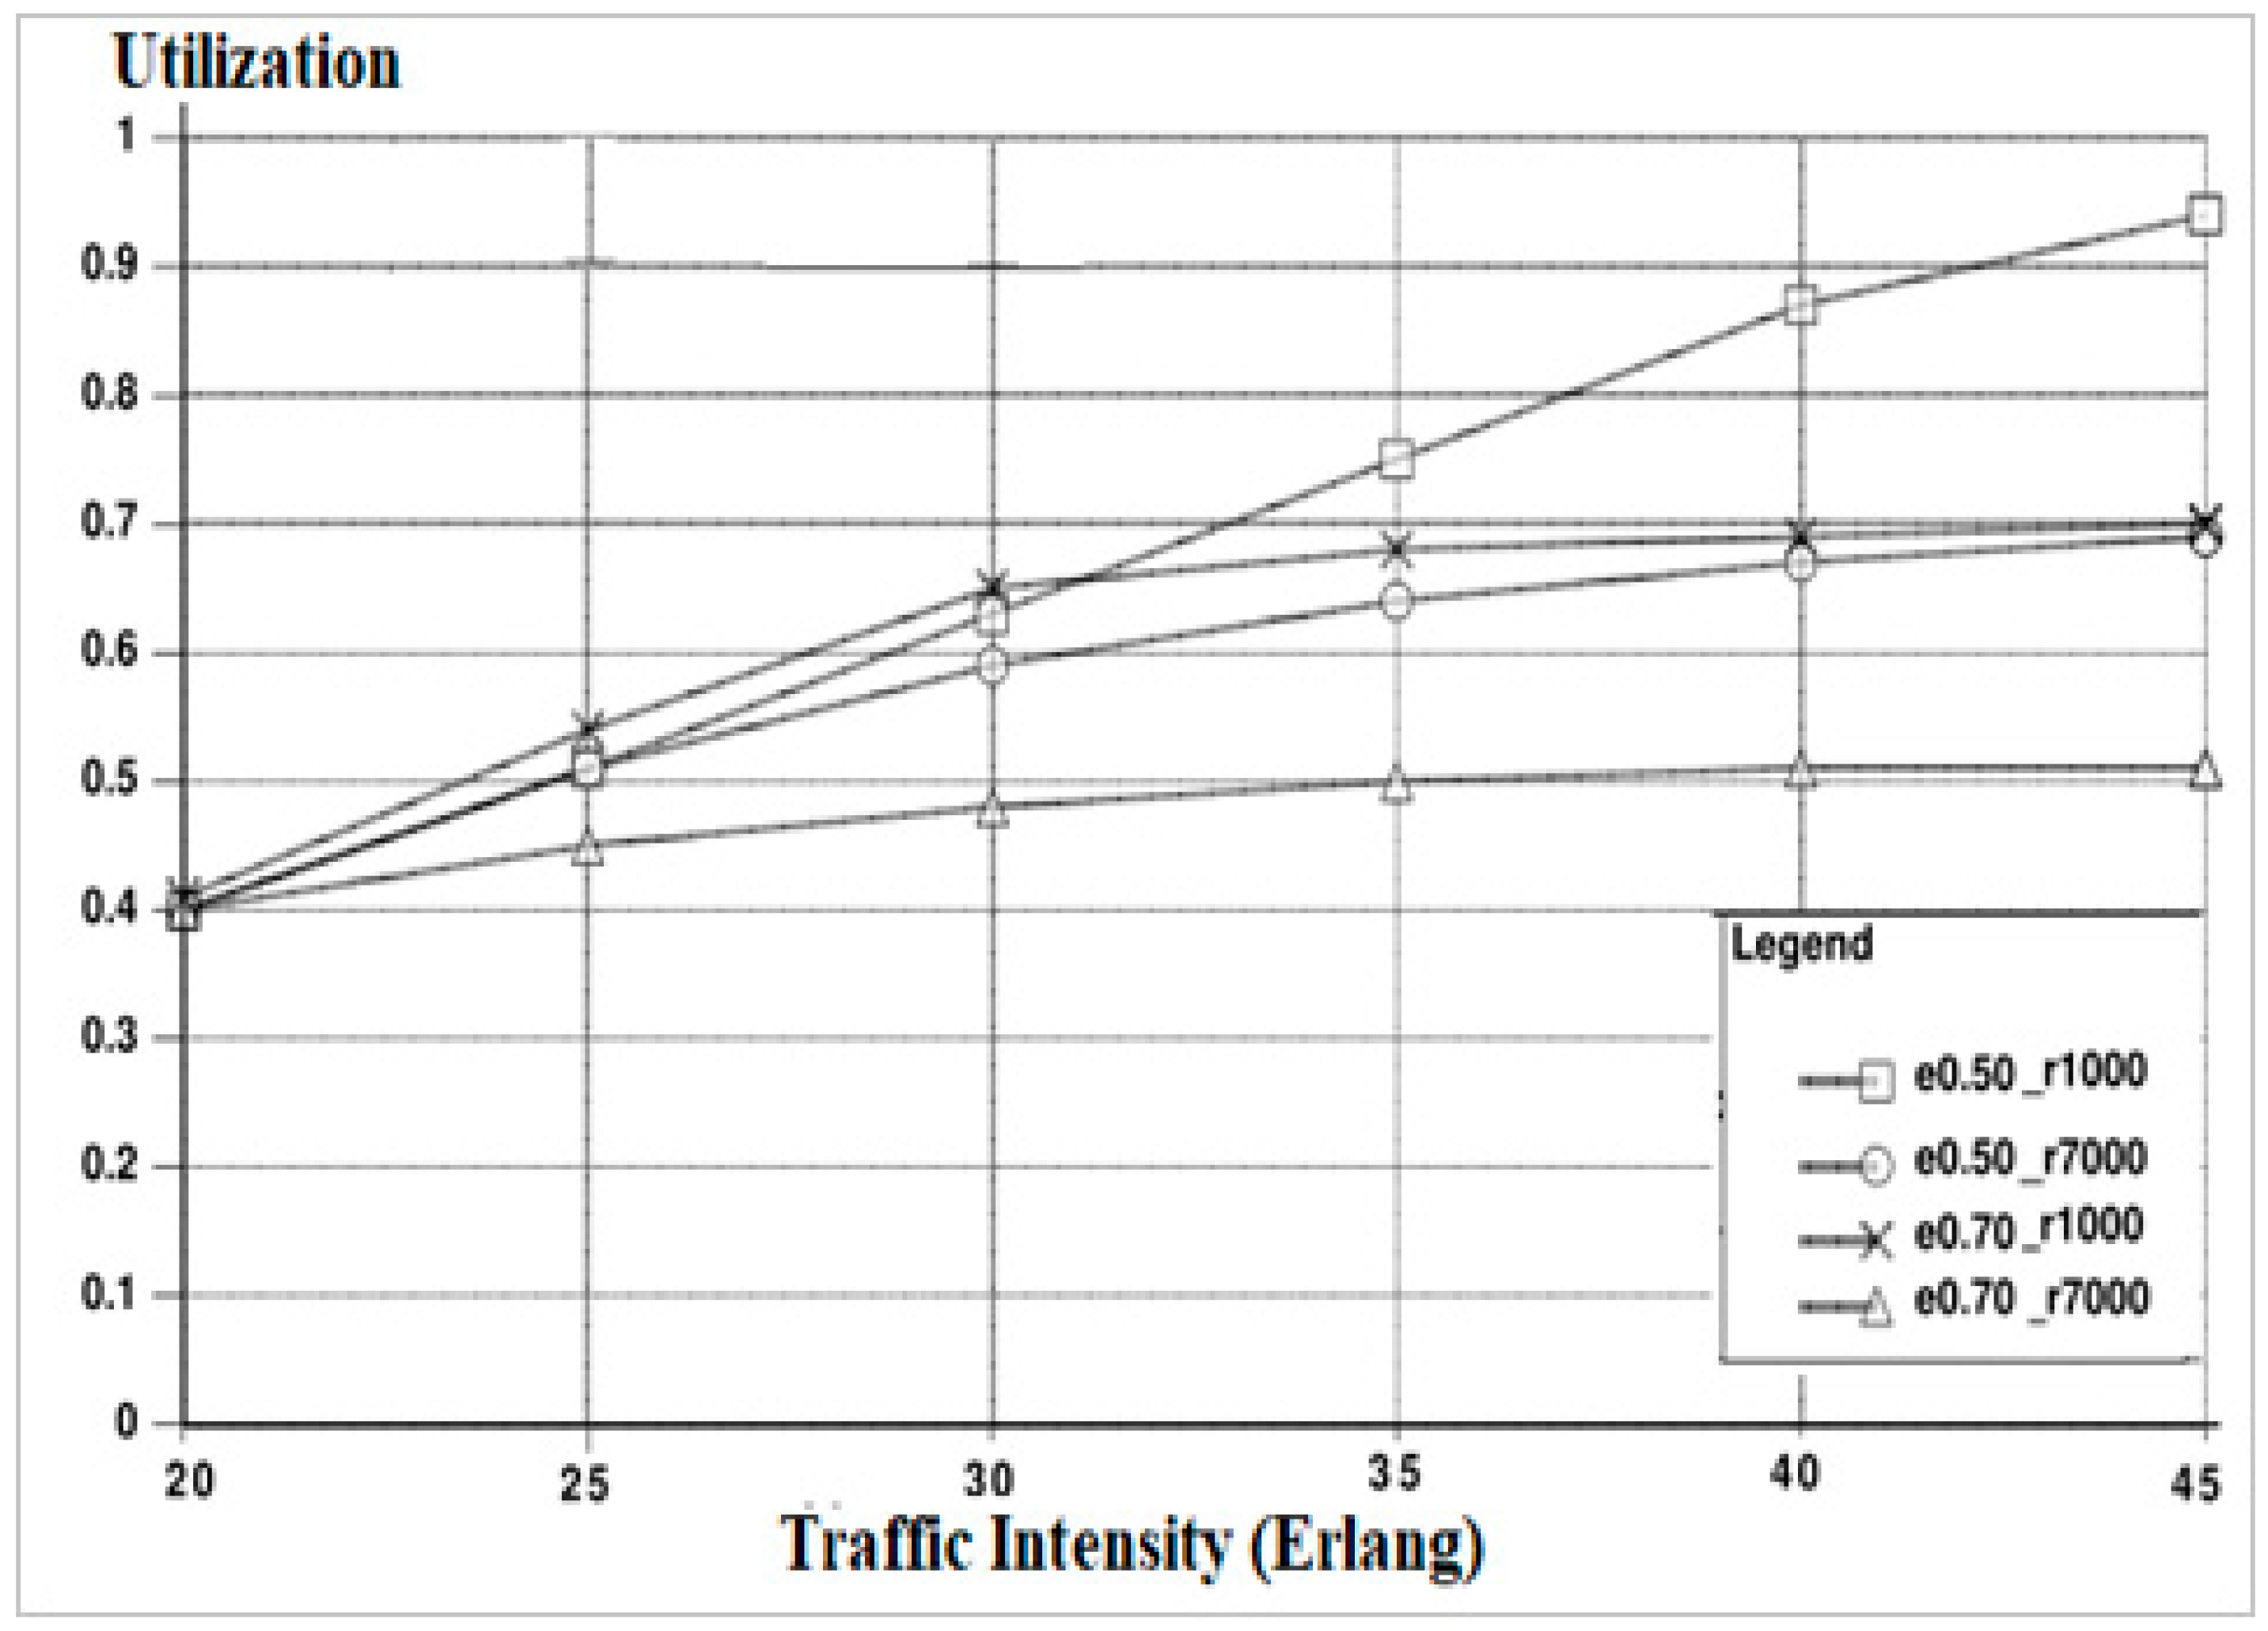
4.1. Effect of Non-Orthogonality Factor, ε
4.2. Effect of Load Concentration on the Inner Cell
4.3. Effect of Load Concentration on the Outer Cells
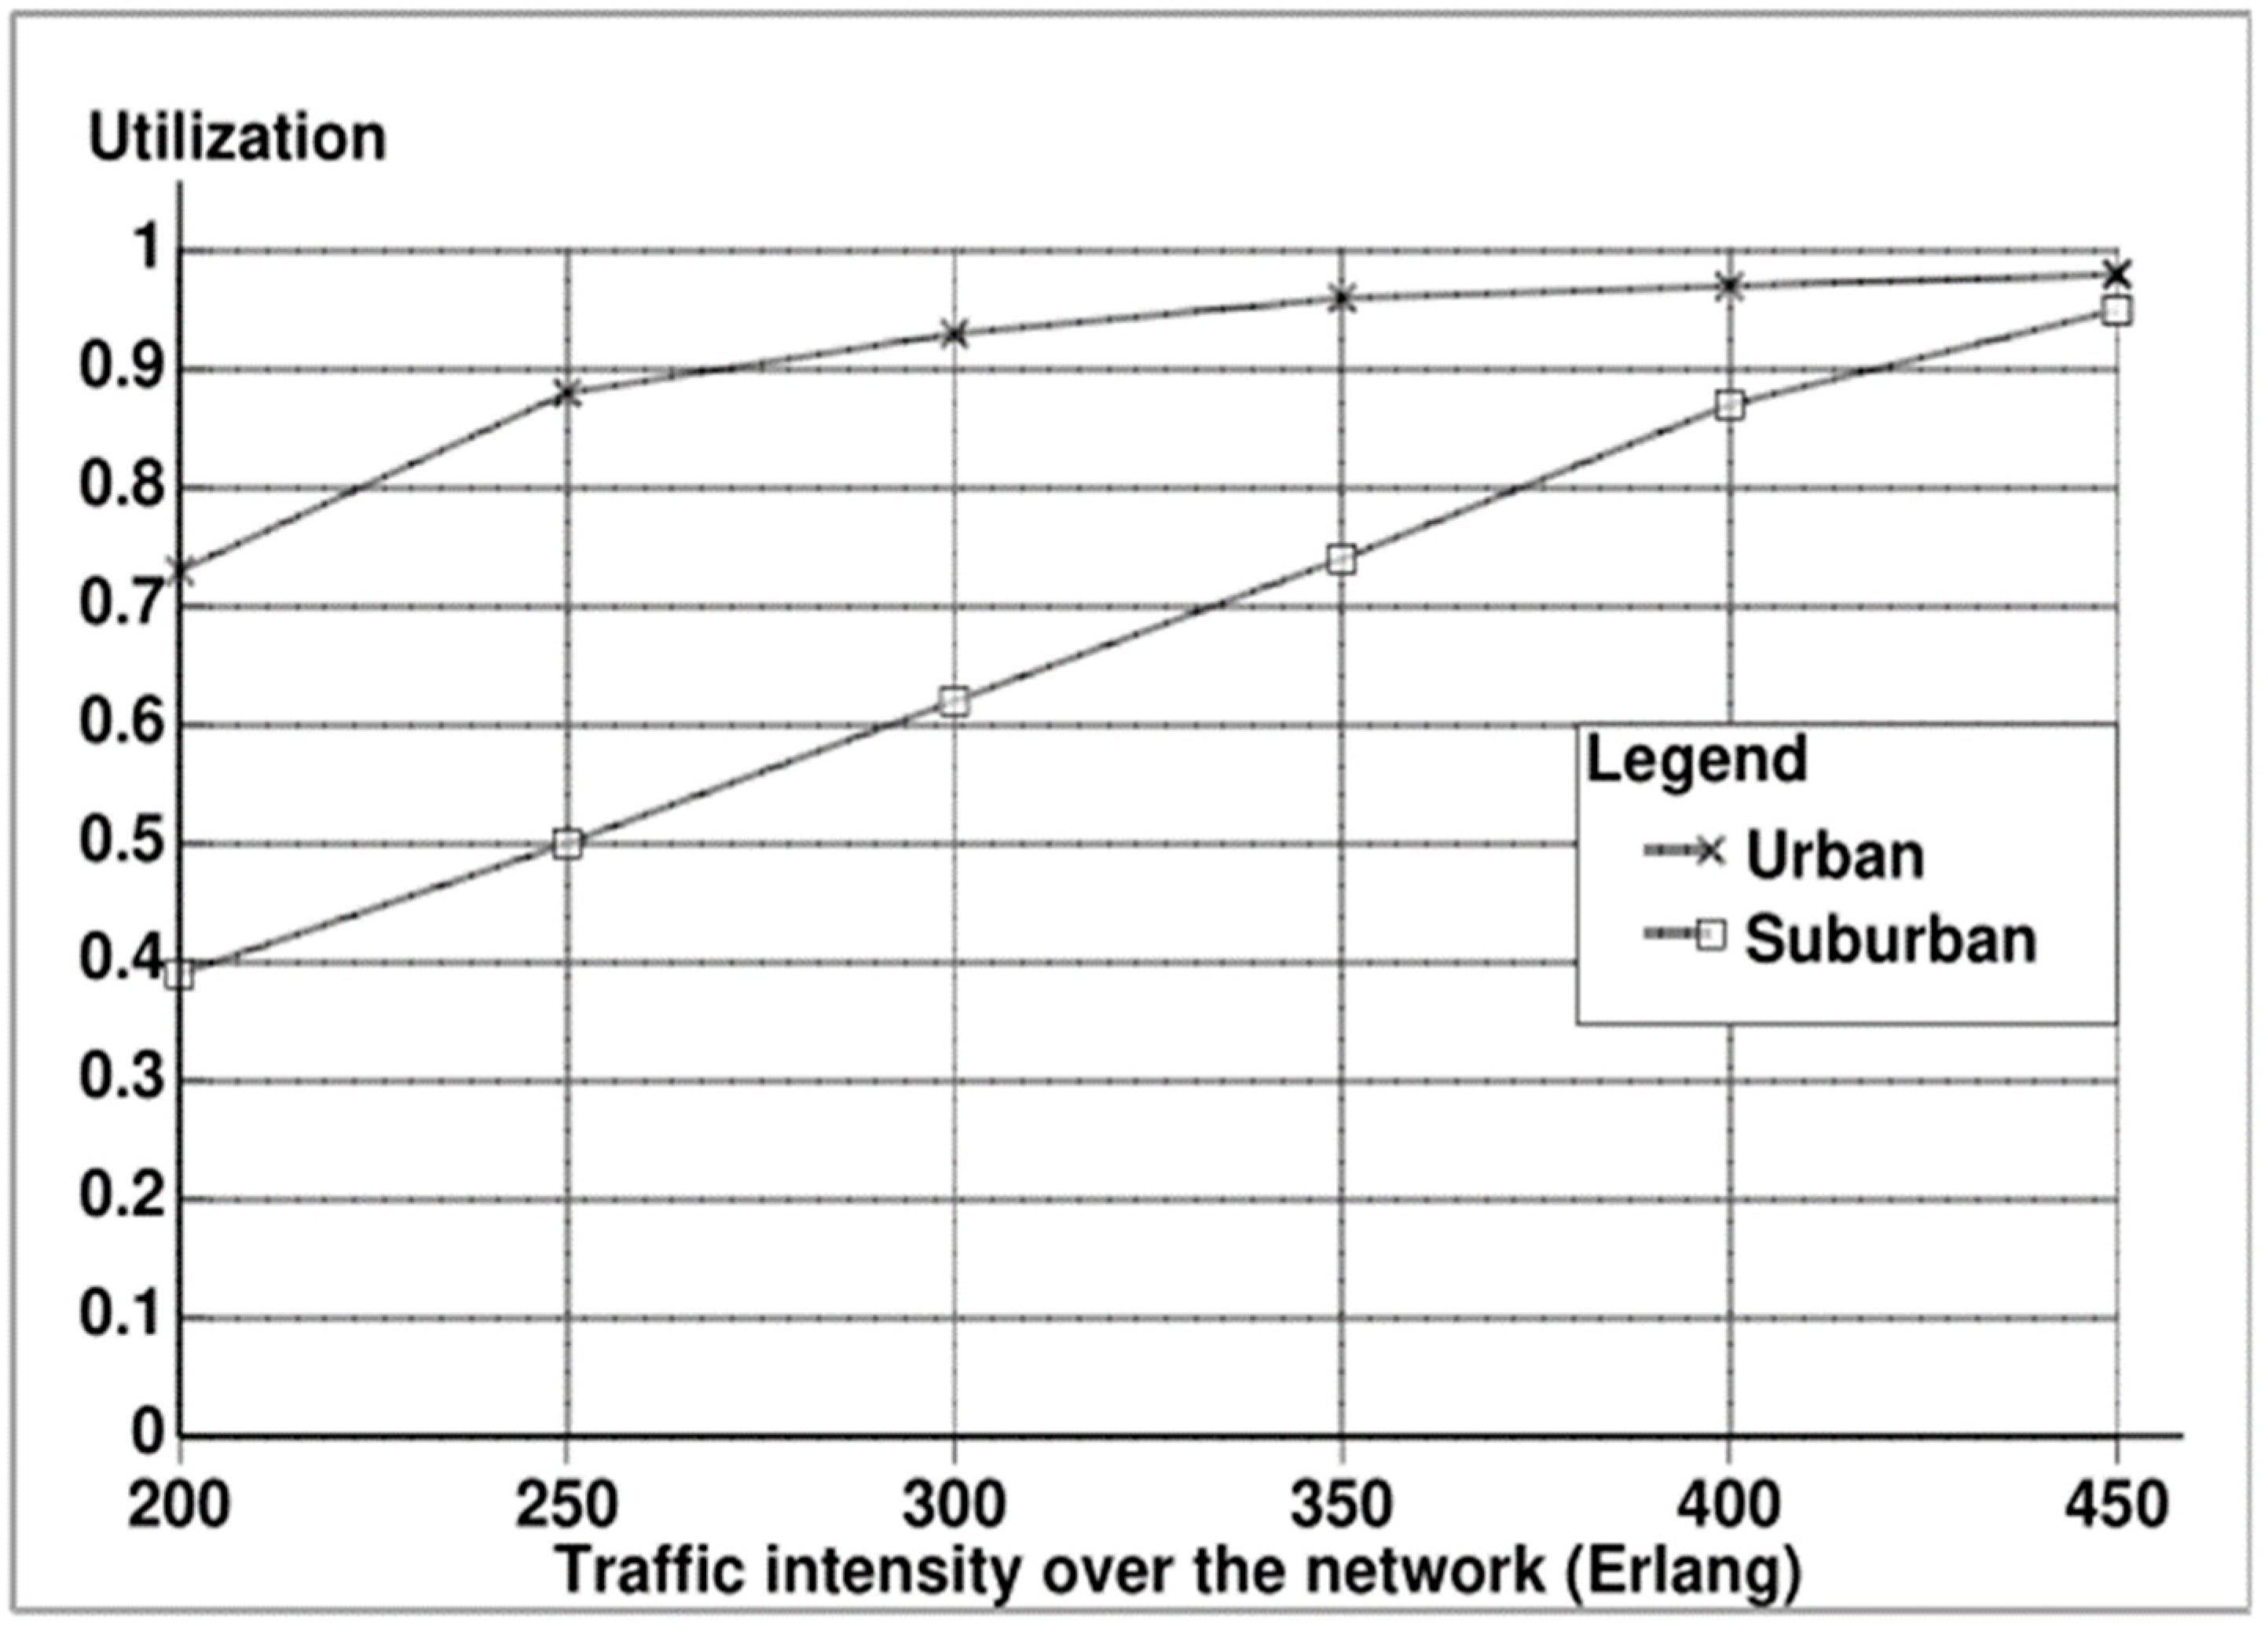
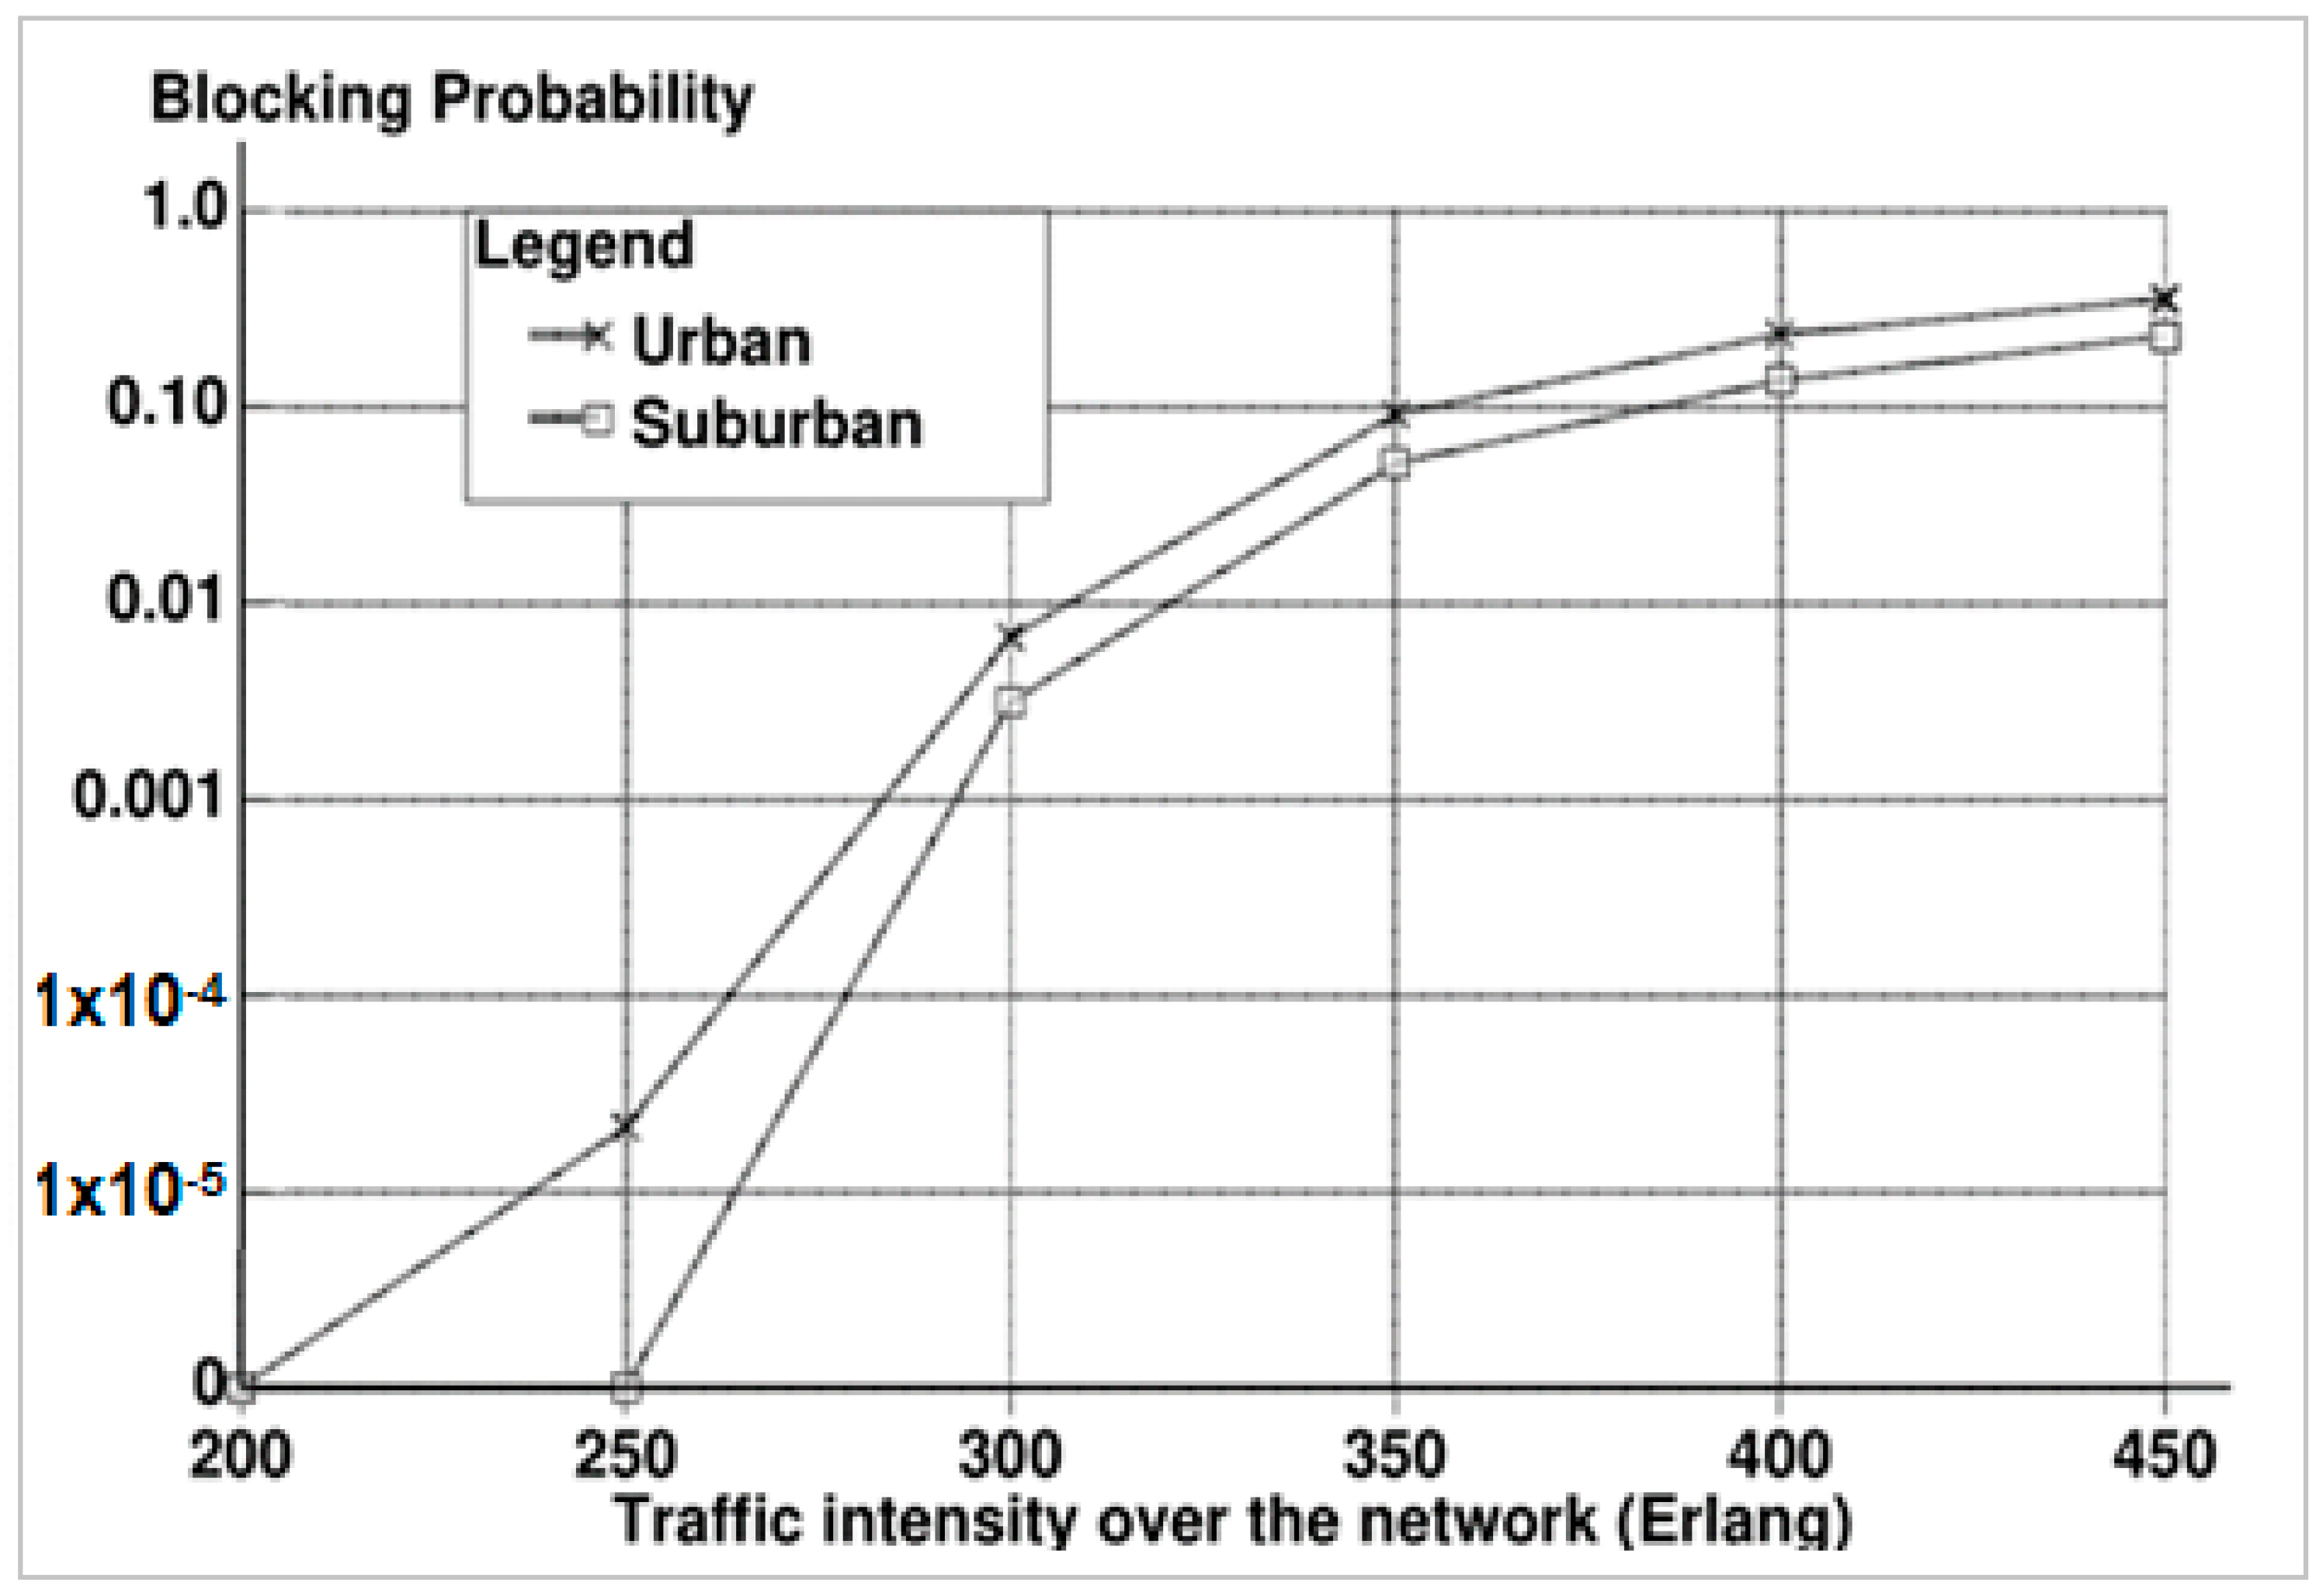
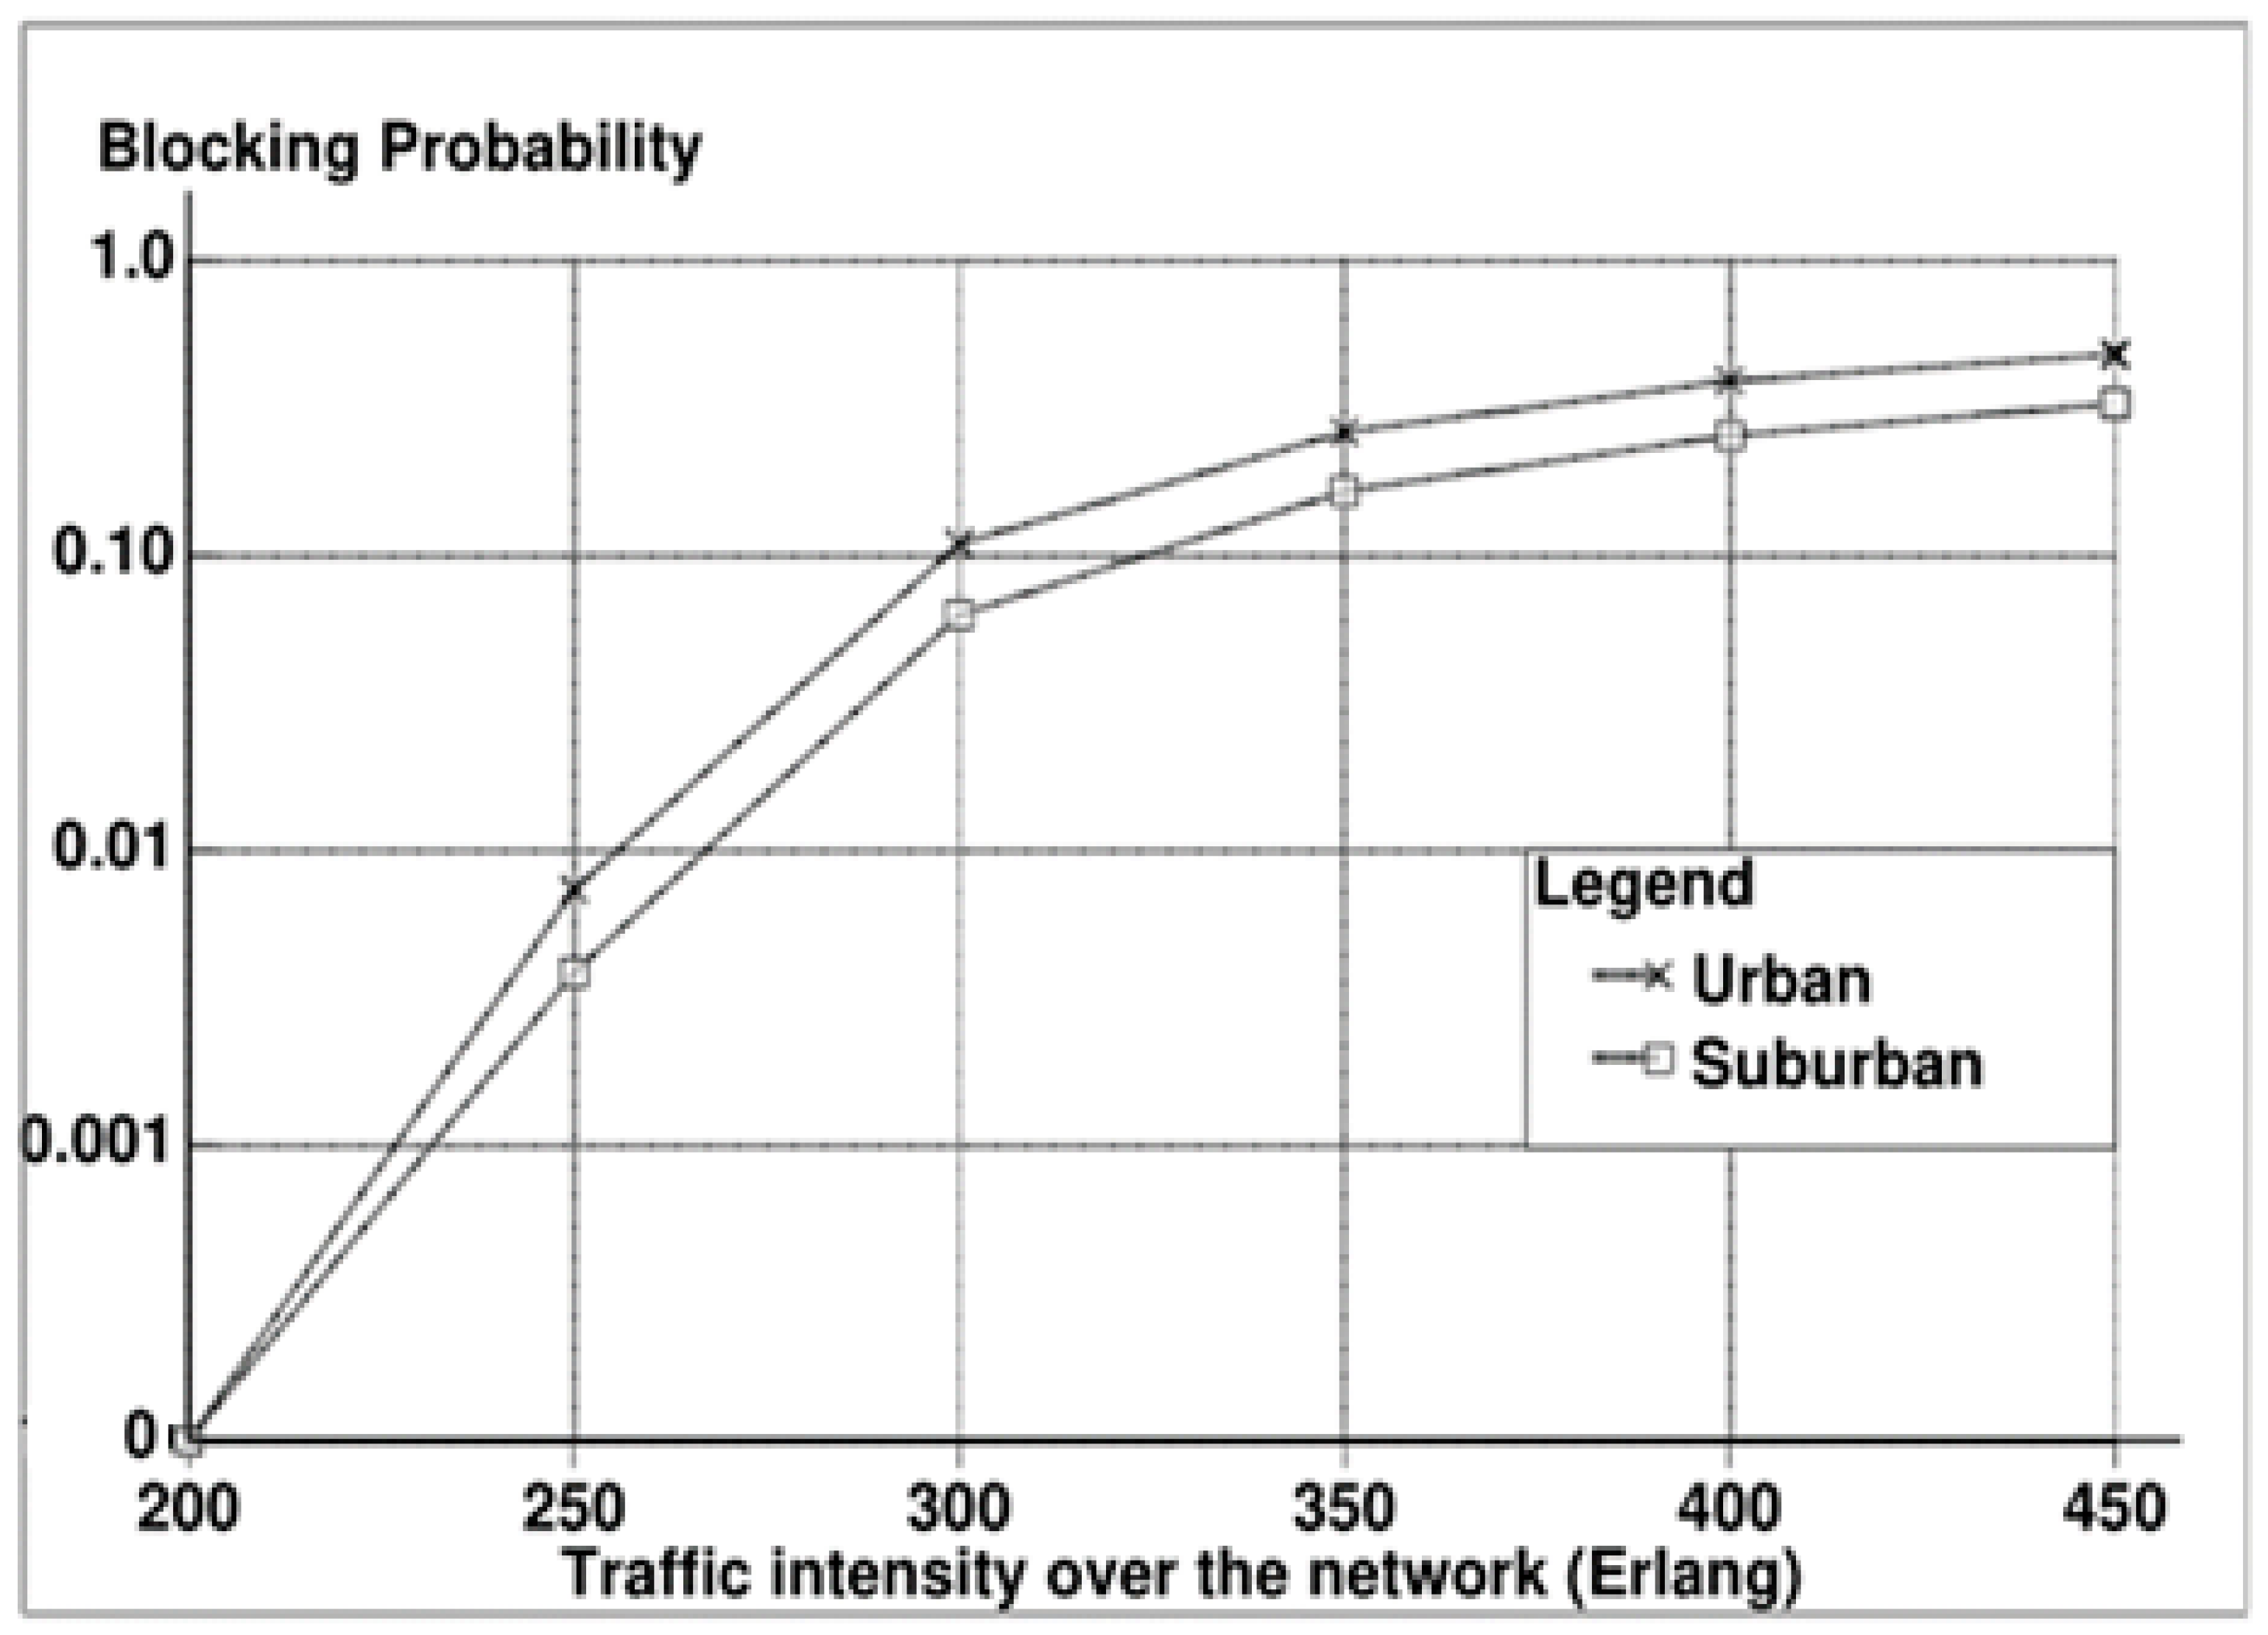
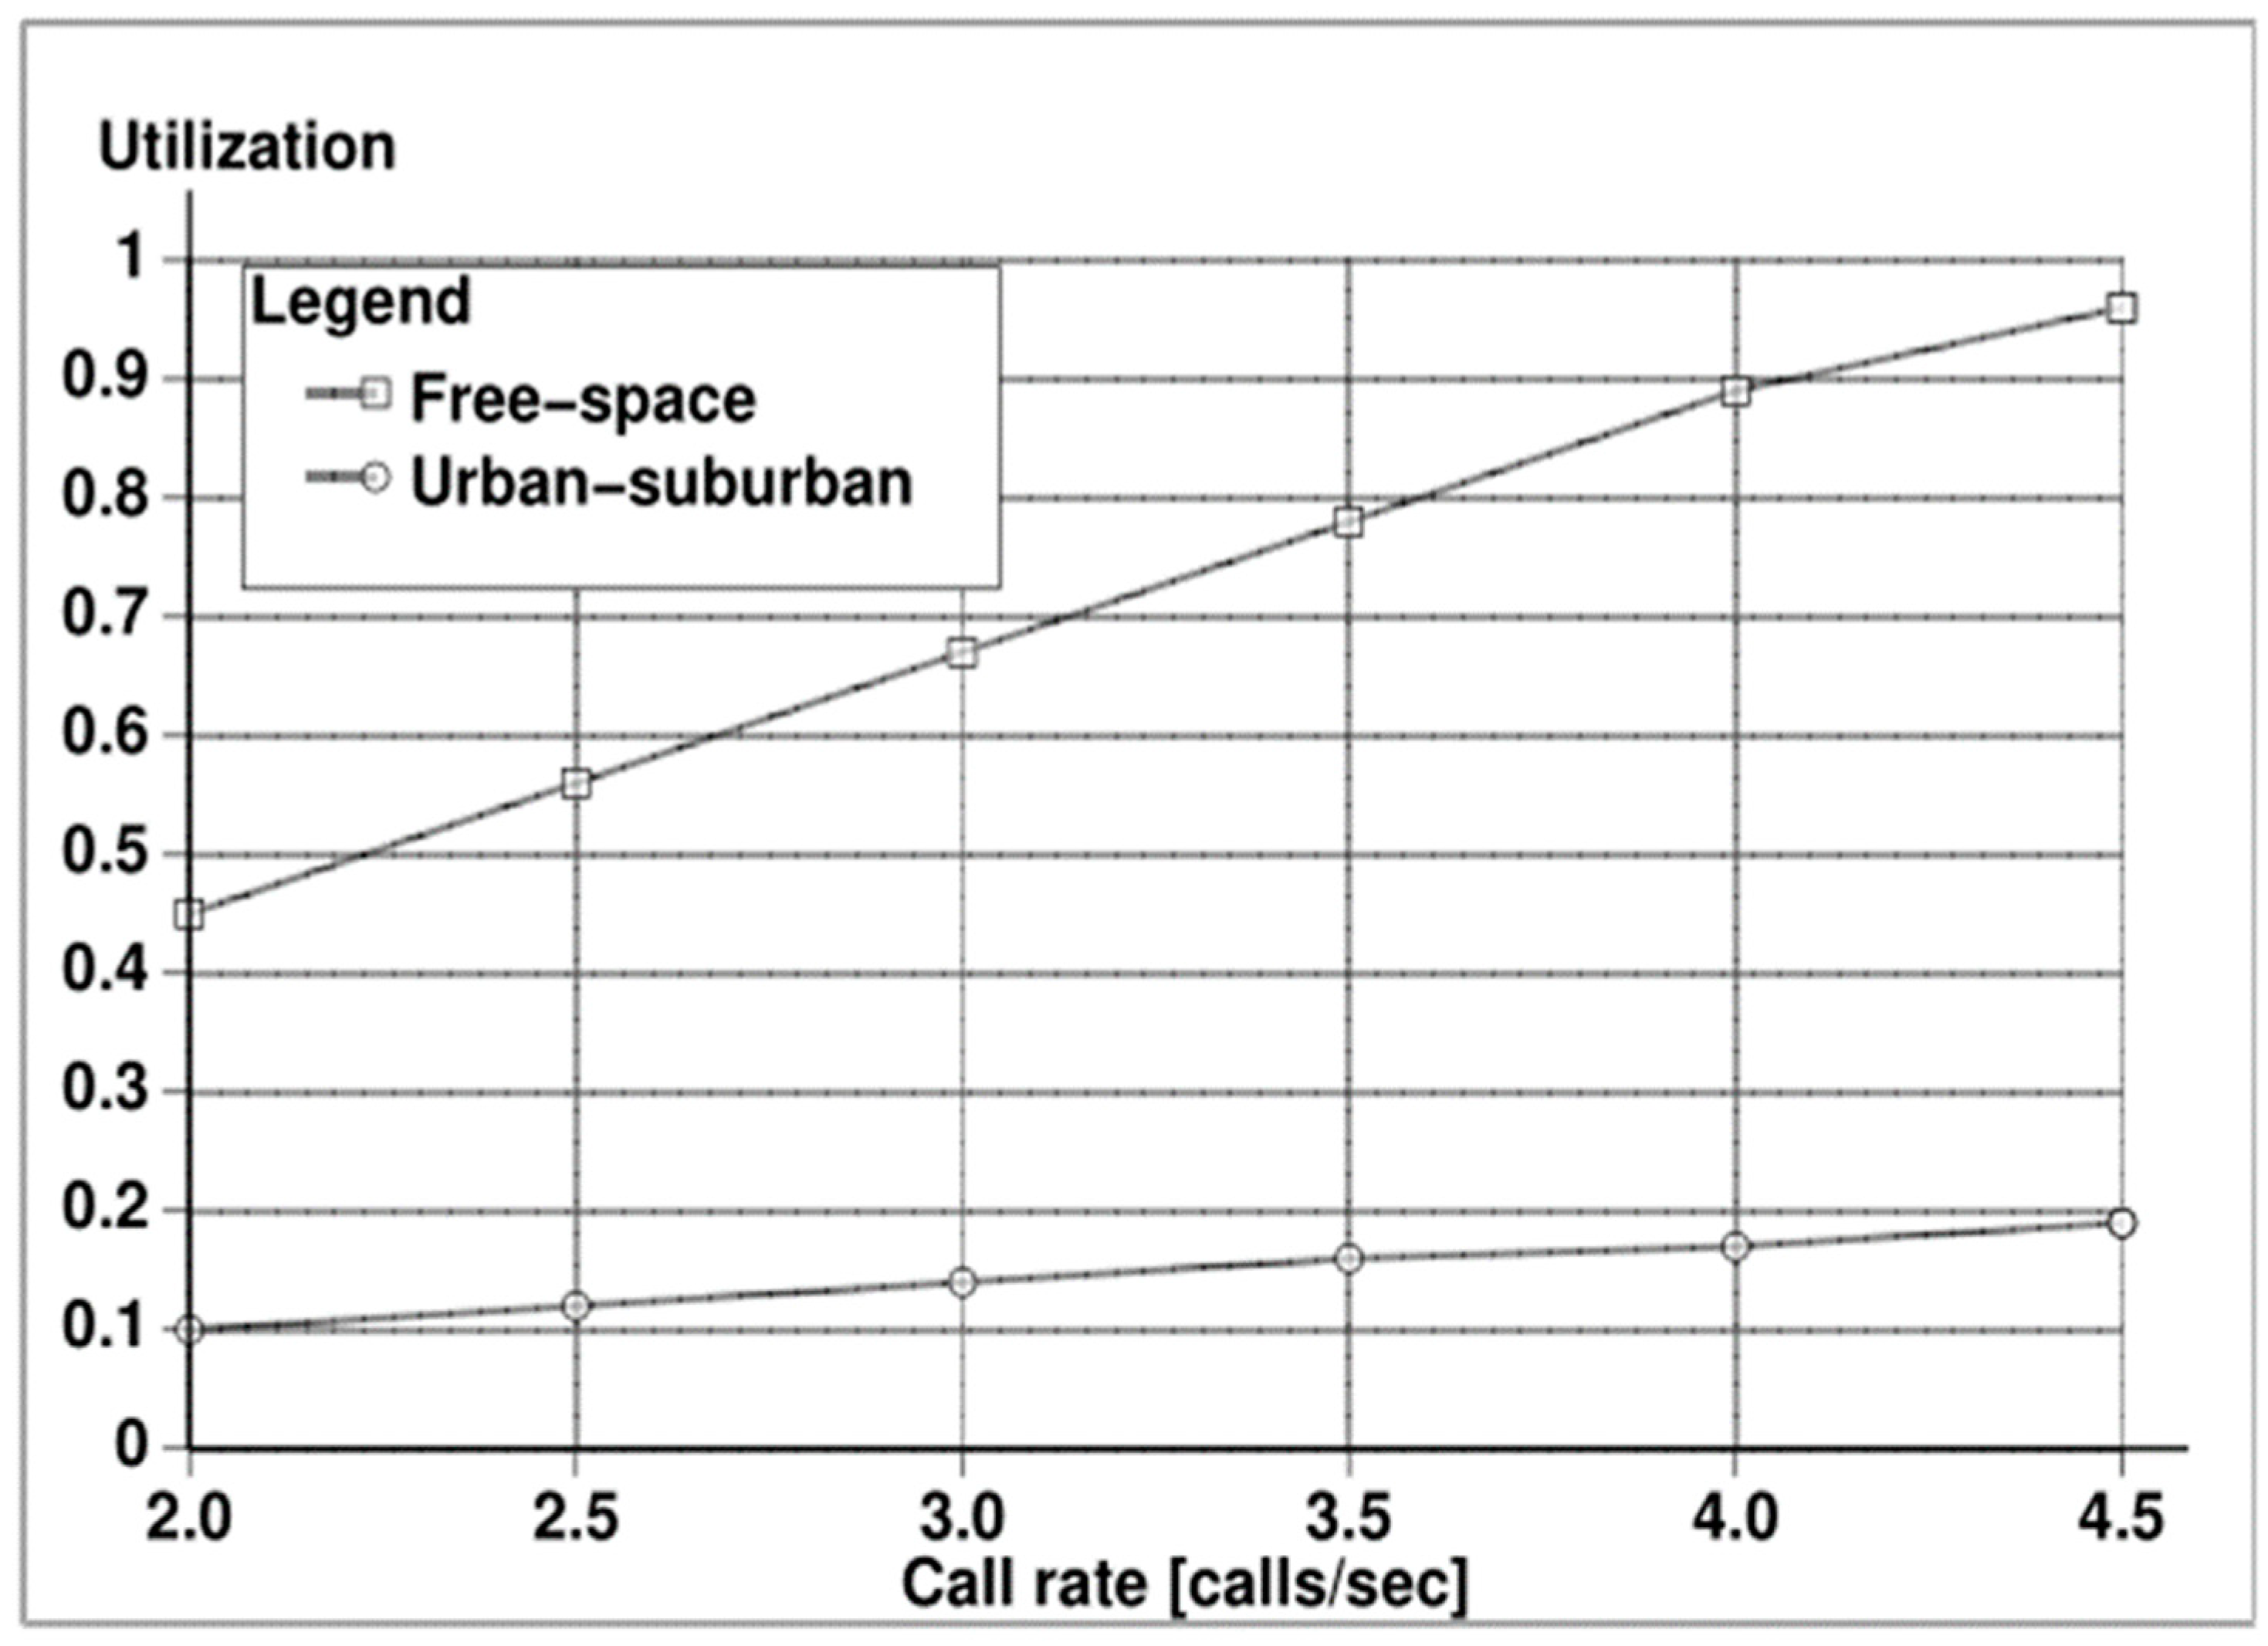
4.4. Comparative Results
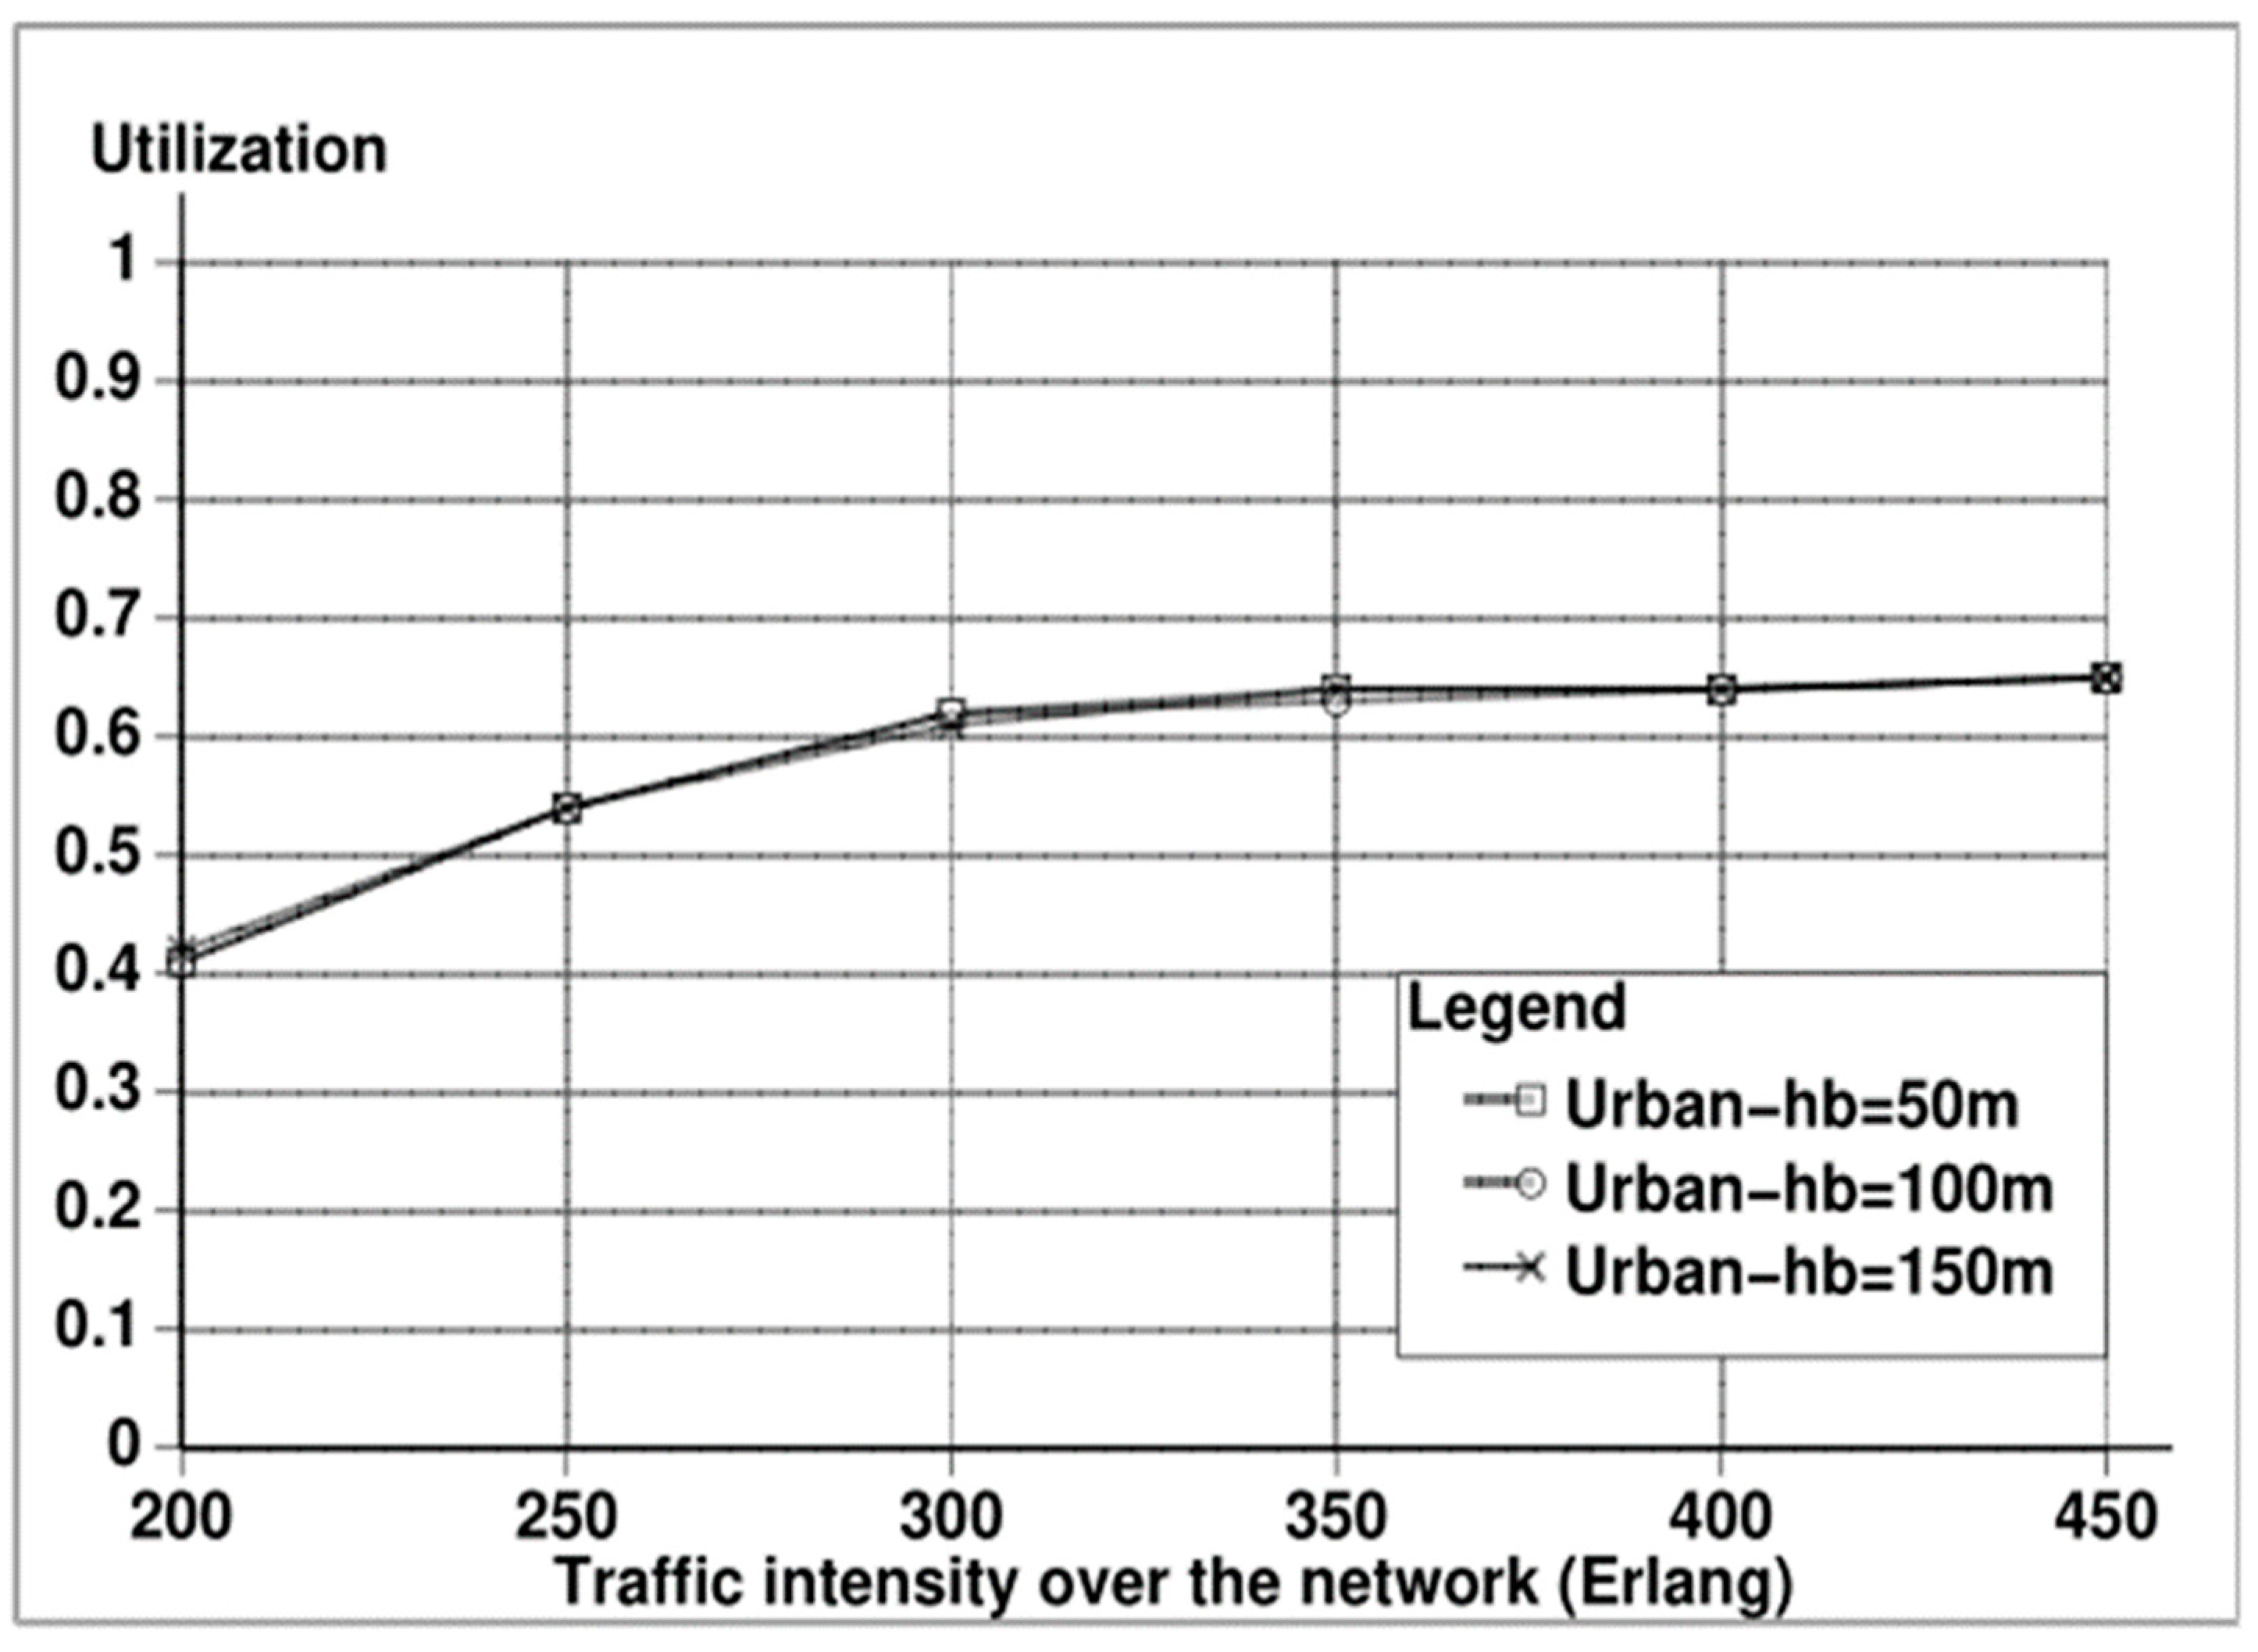
4.5. Effect of the Height of the Mobile, hm and the Height of the Base Station, hb
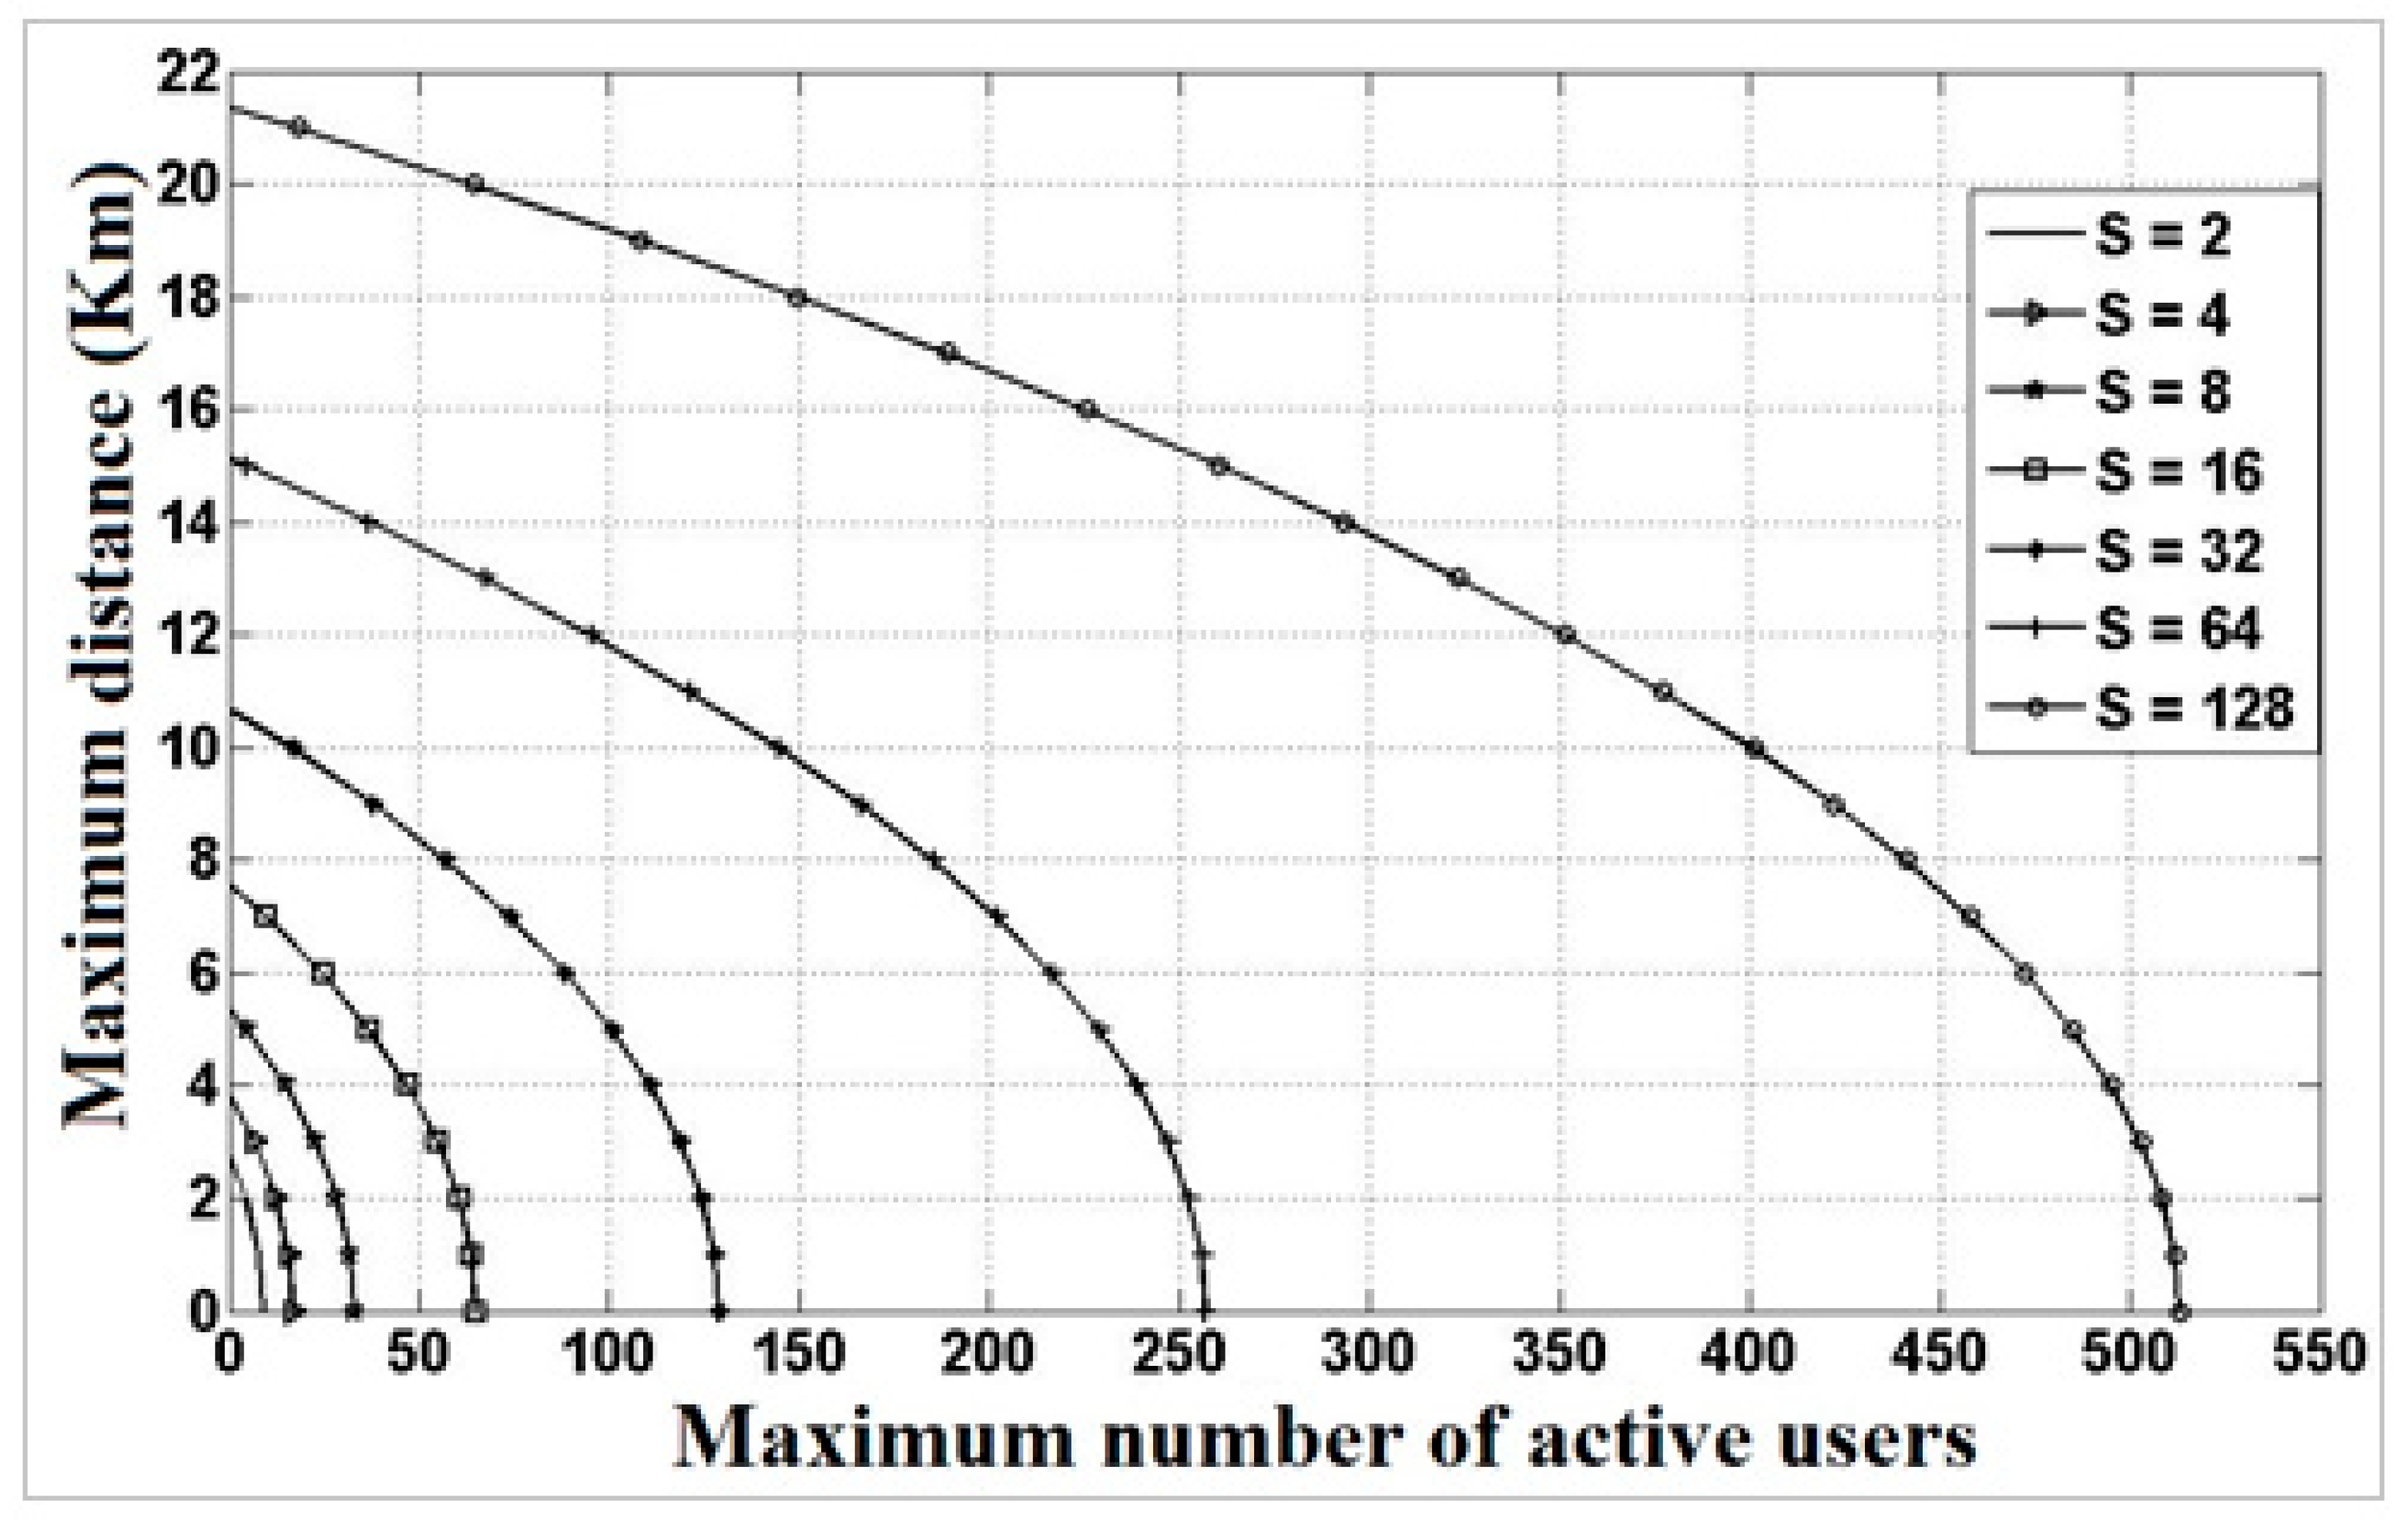
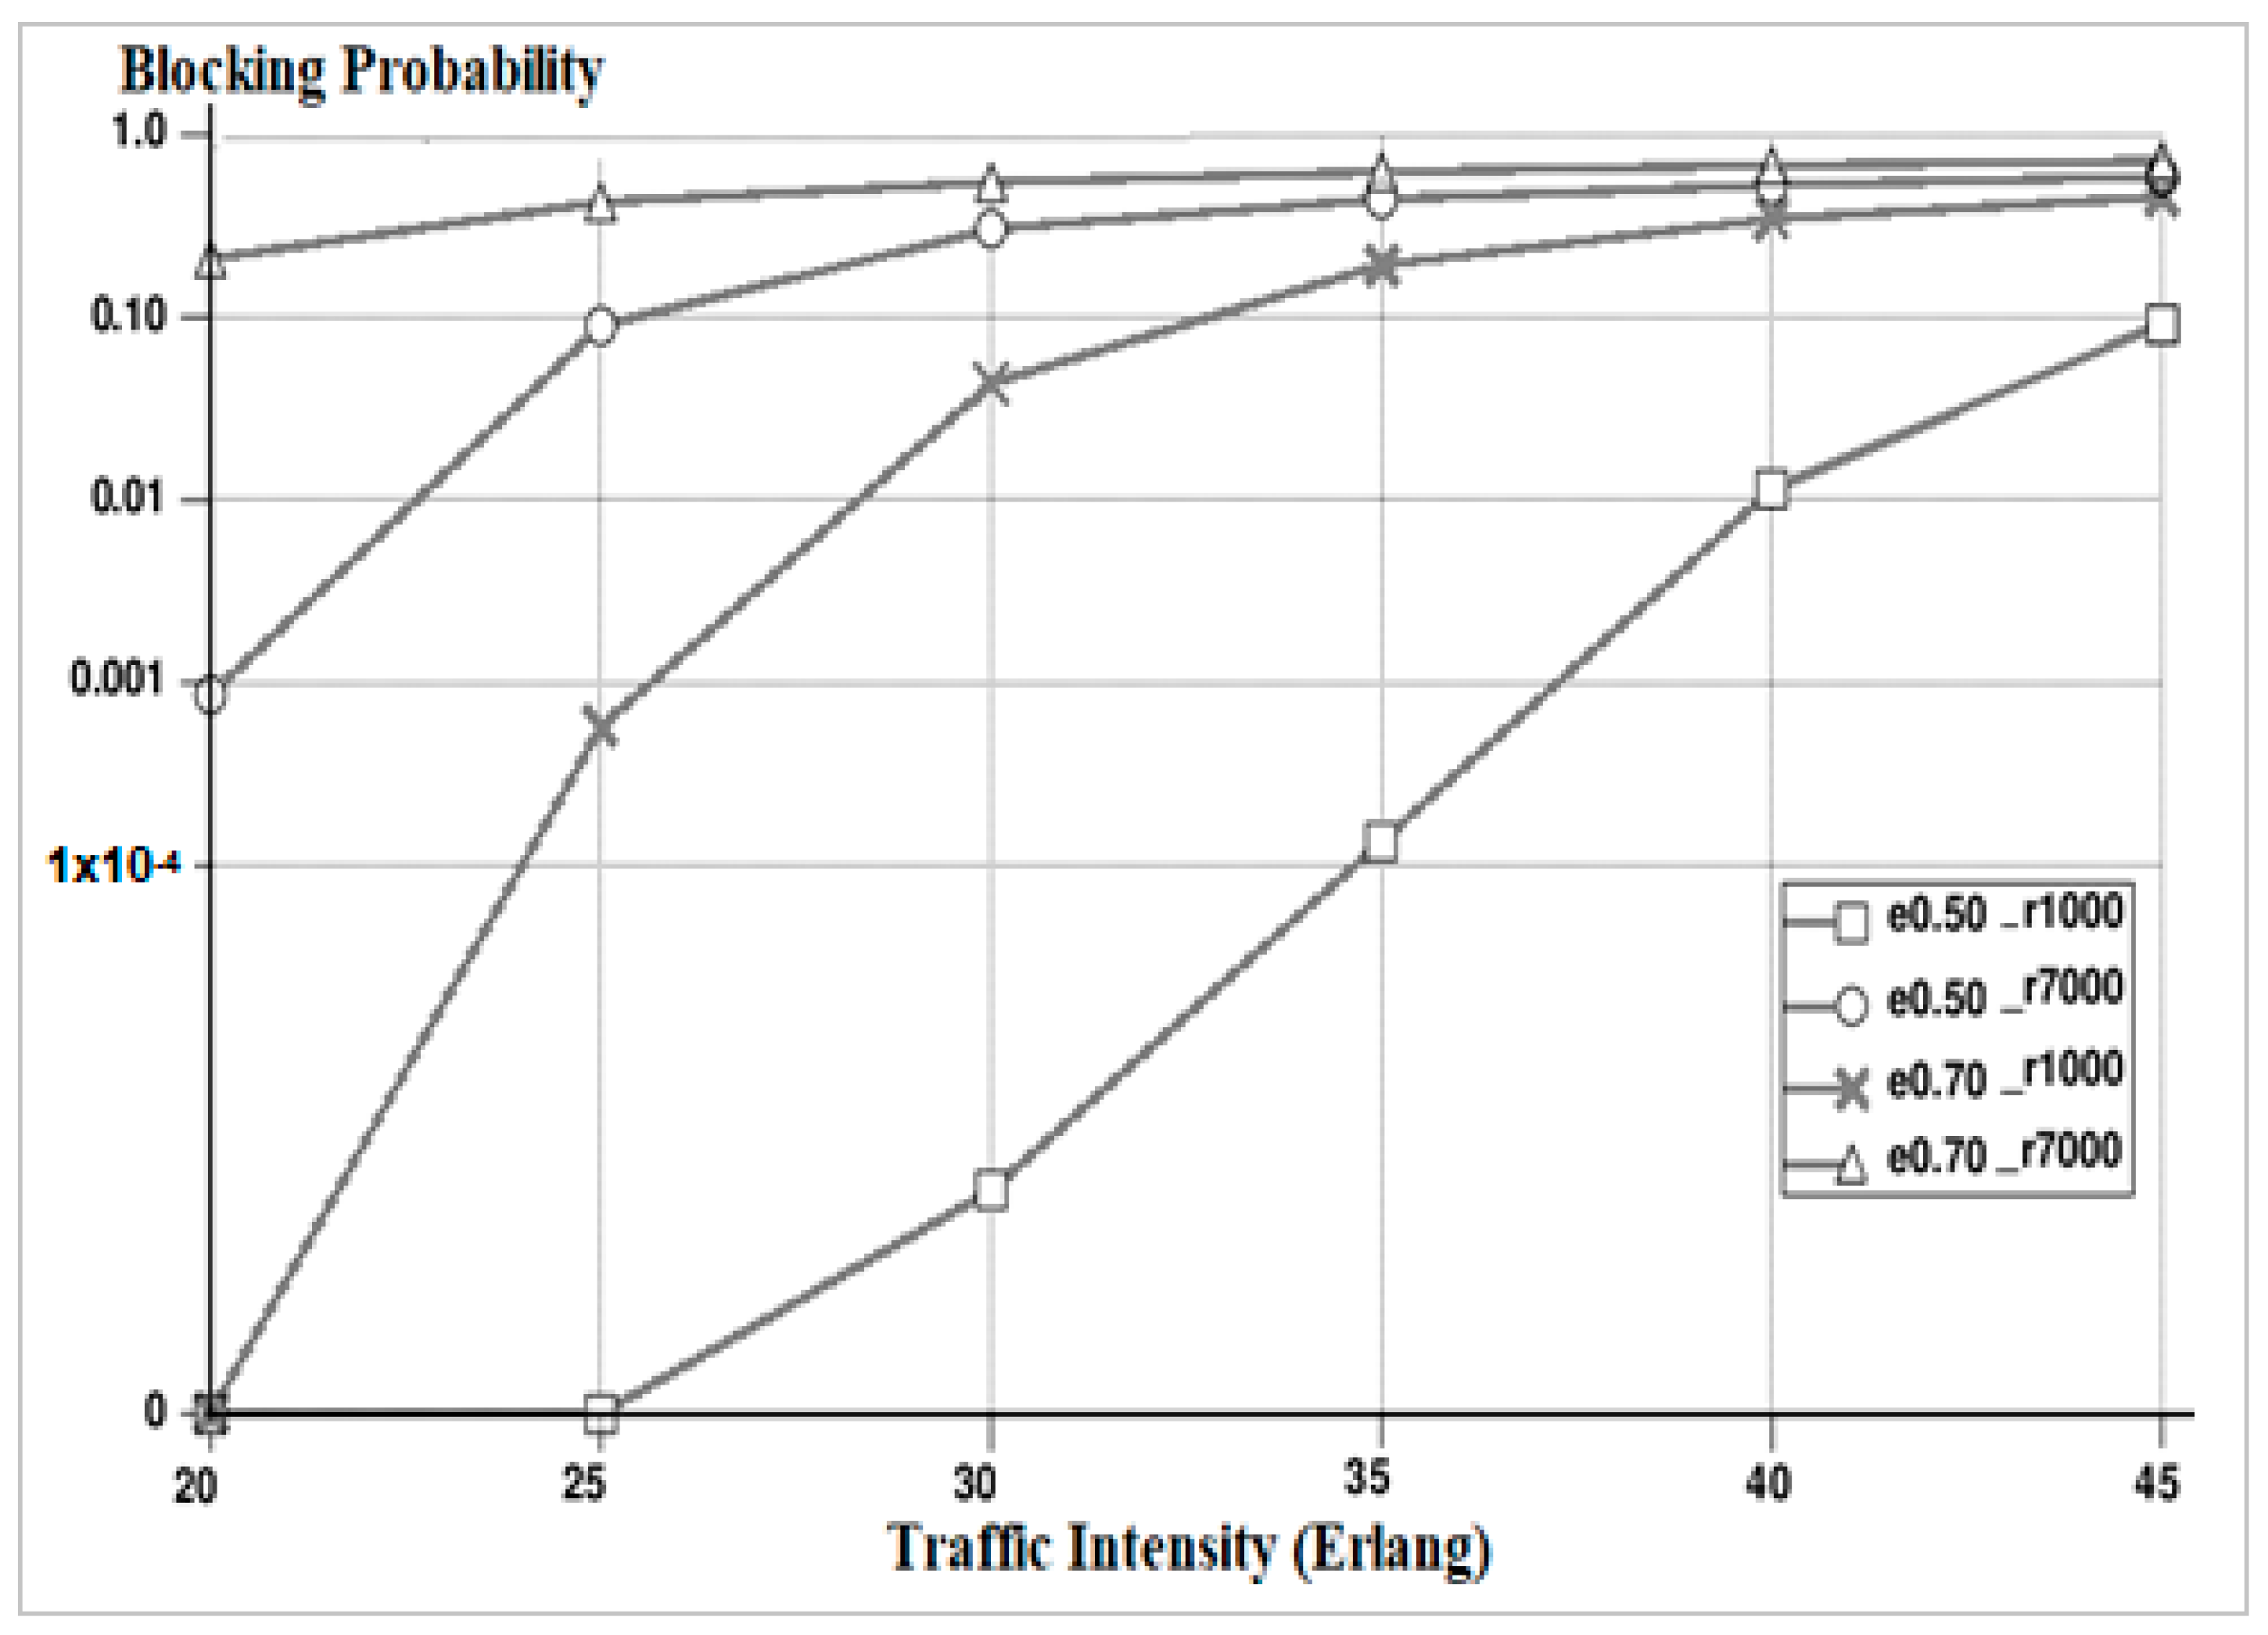
4.6. Effect of the Cell Raduis, r on the Network Performance
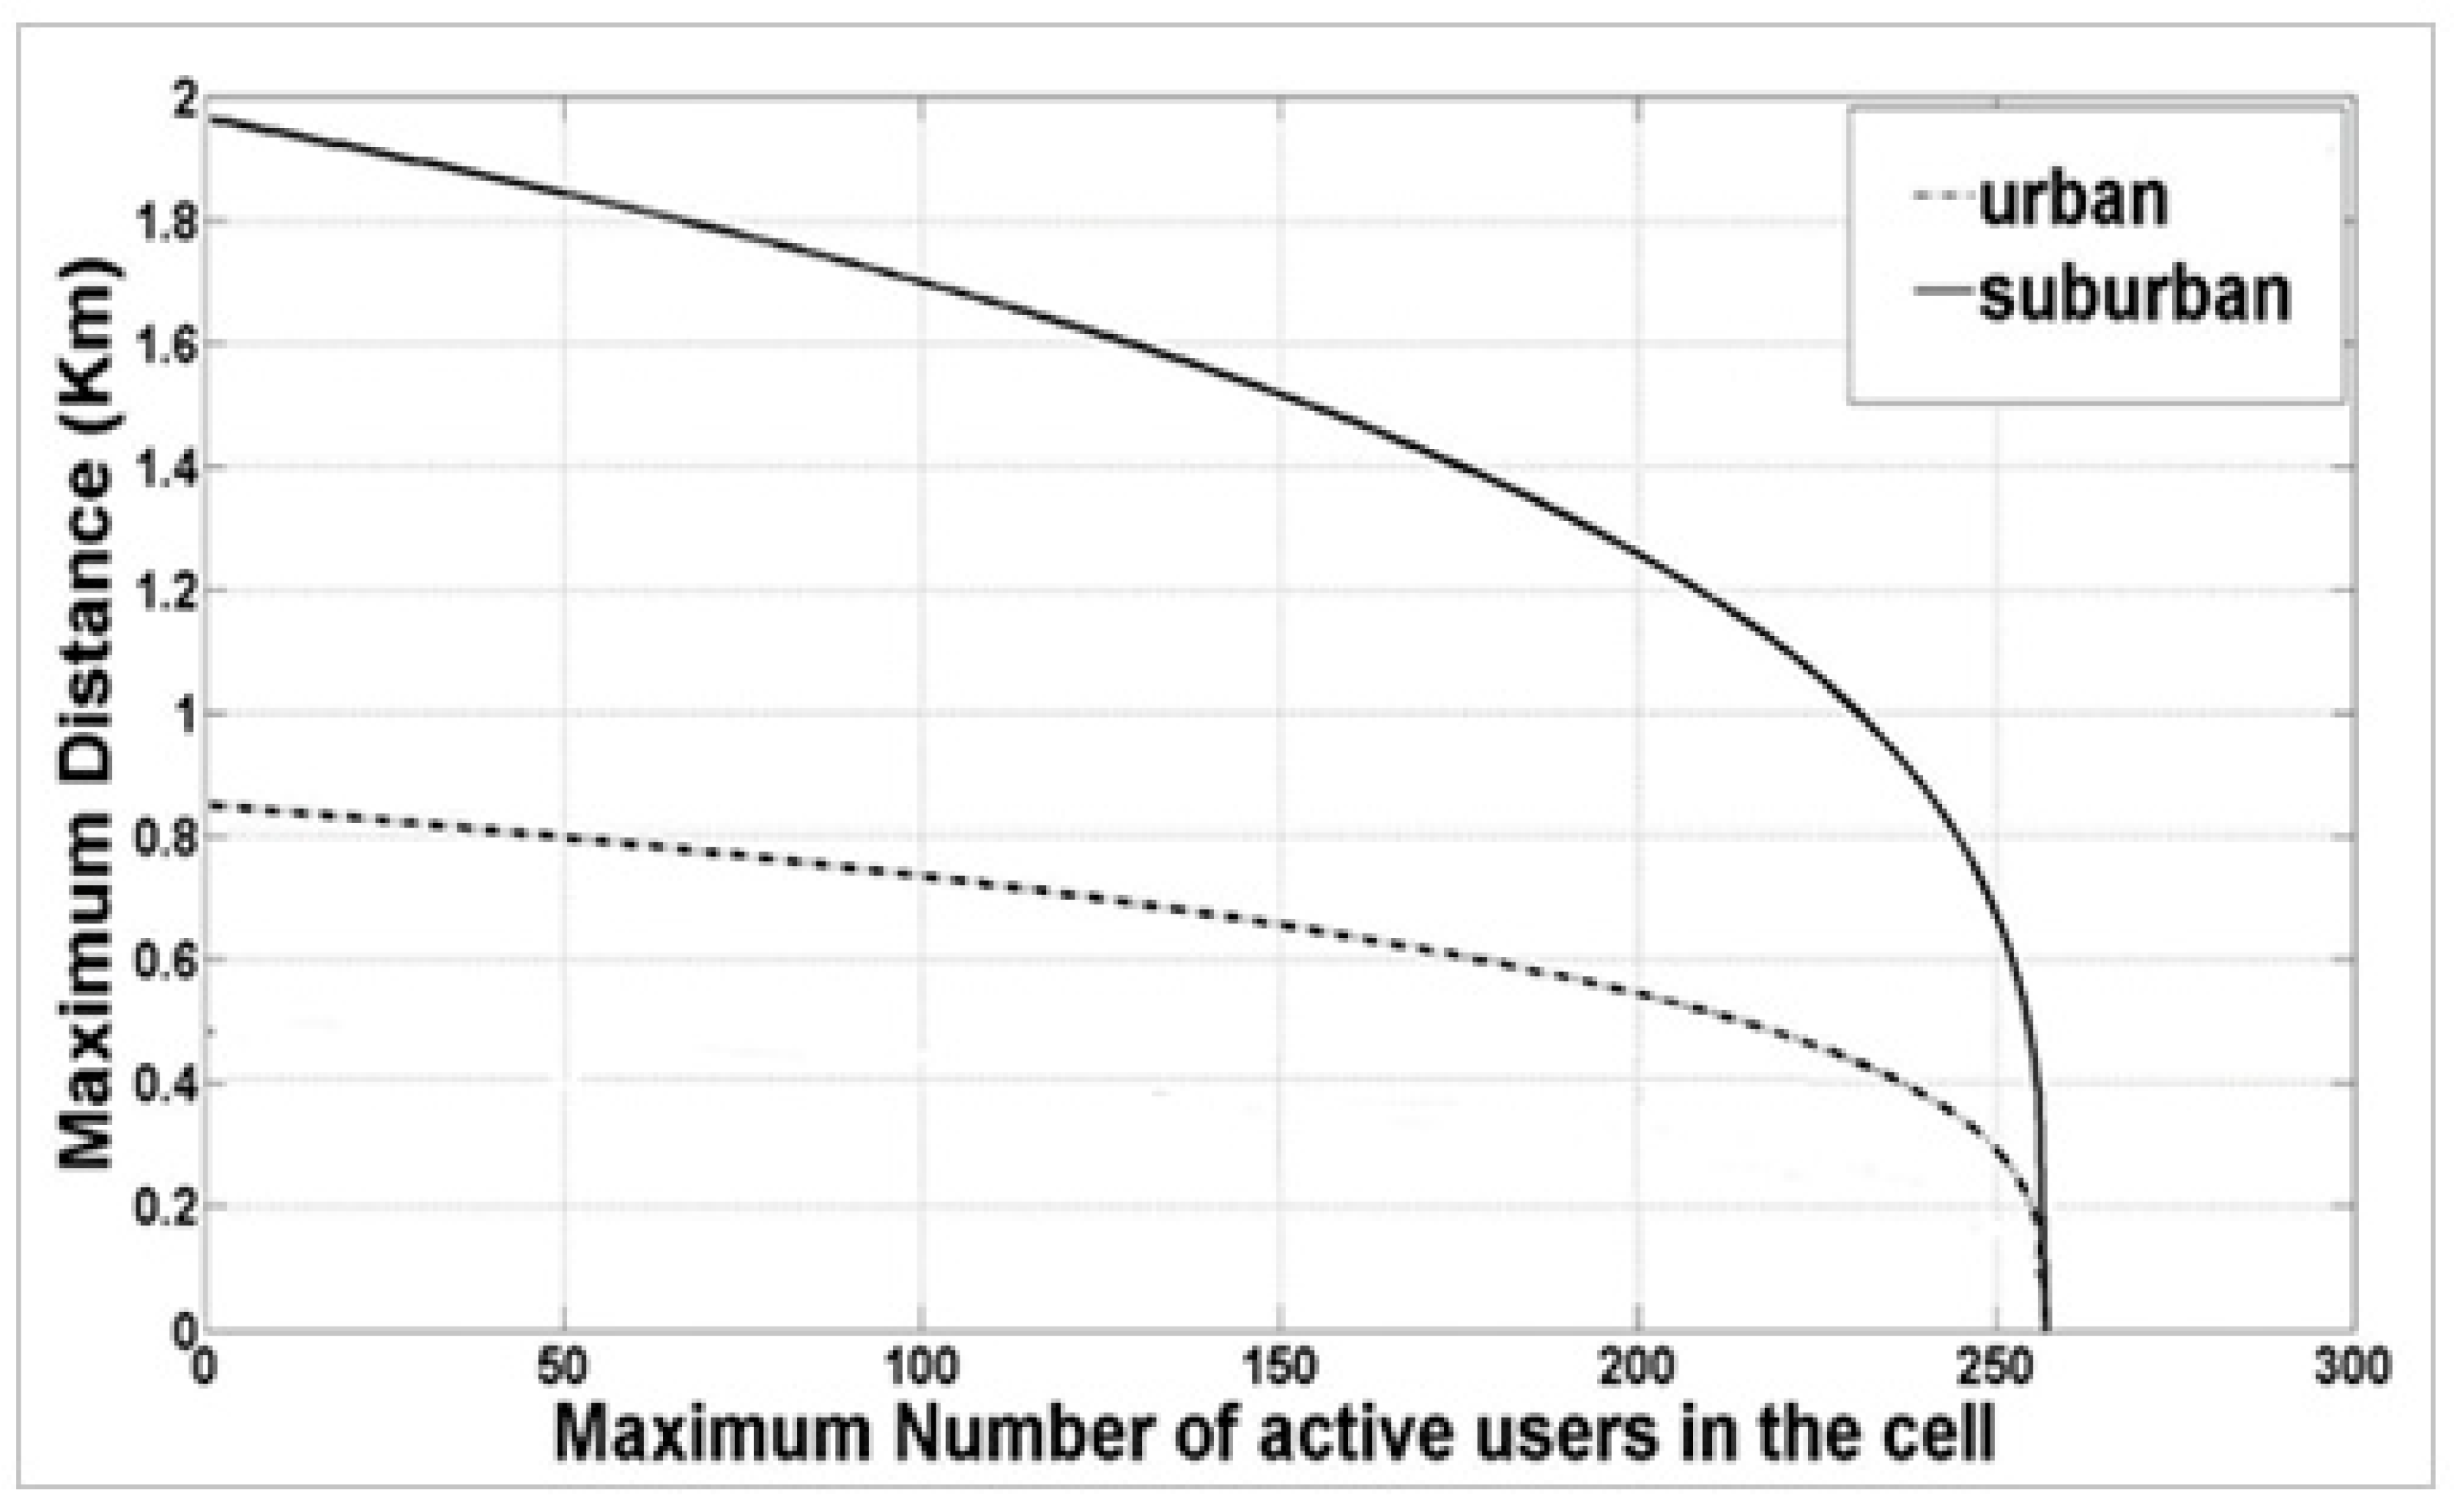
4.7. Effect of the Maximu Distance, dmax on the Network Performance
5. Conclusions and Future Work
Author Contributions
Funding
Data Availability Statement
Conflicts of Interest
References
- Shehab, M.J.; Kassem, I.; Kutty, A.A.; Kucukvar, M.; Onat, N.; Khattab, T. 5G Networks Towards Smart and Sustainable Cities: A Review of Recent Developments, Applications and Future Perspectives. IEEE Access 2021, 10, 2987–3006. [Google Scholar] [CrossRef]
- Sanchez, J.M. Mobile revolution: From 2G to 5G. In Proceedings of the 2021 IEEE Colombian Conference on Communications and Computing (COLCOM), Cali, Colombia, 26–28 May 2021; pp. 1–6. [Google Scholar] [CrossRef]
- Nanda, I.; Dey, R. An Analysis of 5G Wireless Networks. Information Management and Computer Science (IMCS). Inf. Manag. Comput. Sci. 2022, 5, 38–40. [Google Scholar] [CrossRef]
- Li, B.; Zhao, Q.; Jiao, S.; Liu, X. DroidPerf: Profiling Memory Objects on Android Devices. In Proceedings of the 29th Annual International Conference on Mobile Computing and Networking. Association for Computing Machinery, Madrid, Spain, 2–6 October 2023; Article 6. pp. 1–15. [Google Scholar] [CrossRef]
- He, L.; Guo, Q.; Zhong, J.; Wang, X. 5G Network Performance Analysis and Verification Based on Ubiquitous Electricity Internet of Things. In Proceedings of the 2020 IEEE 4th Information Technology, Networking, Electronic and Automation Control Conference (ITNEC), Chongqing, China, 12–14 June 2020; pp. 1–6. [Google Scholar] [CrossRef]
- MMalekzadeh, M. Performance prediction and enhancement of 5G networks based on linear regression machine learning. EURASIP J. Wirel. Commun. Netw. 2023, 2023, 74. [Google Scholar] [CrossRef]
- Bhardwaj, K.; Singh, A.; Sachan, V.K. 5G: An overview of Channels characteristics and modelling techniques. In Proceedings of the 2018 Fifth International Conference on Parallel, Distributed and Grid Computing (PDGC), Solan, India, 20–22 December 2018; pp. 400–405. [Google Scholar] [CrossRef]
- Akhpashev, R.V.; Drozdova, V.G. The Realistic 5G New Radio Coverage Analysis for Urban Area. In Proceedings of the 2022 Ural-Siberian Conference on Biomedical Engineering, Radioelectronics and Information Technology (USBEREIT), Yekaterinburg, Russia, 19–21 September 2022; pp. 145–147. [Google Scholar] [CrossRef]
- Lazar, R.G.; Militaru, A.V.; Caruntu, C.F.; Patachia–Sultanoiu, C. Performance analysis of 5G communication based on distance evaluation using the SIM8200EA-M2 module. In Proceedings of the 2022 26th International Conference on System Theory, Control and Computing (ICSTCC), Sinaia, Romania, 19–21 October 2022; pp. 37–42. [Google Scholar] [CrossRef]
- Nwajana, A.O. 5G Internet of Things and Changing Standards for Computing and Electronic Systems; IGI Global: Hershey, PA, USA, 2022. [Google Scholar] [CrossRef]
- 3rd Generation Partnership Project (3GPP). 5G System Overview. Available online: https://www.3gpp.org/technologies/5g-system-overview (accessed on 18 February 2024).
- Parkvall, S.; Dahlman, E.; Furuskar, A.; Frenne, M. NR: The New 5G Radio Access Technology. IEEE Commun. Stand. Mag. 2017, 1, 24–30. [Google Scholar] [CrossRef]
- Marsch, P.; Da Silva, I.; Bulakci, O.; Tesanovic, M.; El Ayoubi, S.E.; Rosowski, T.; Kaloxylos, A.; Boldi, M. 5G Radio Access Network Architecture: Design Guidelines and Key Considerations. IEEE Commun. Mag. 2016, 54, 24–32. [Google Scholar] [CrossRef]
- Jing, S.; Wang, H. Design and Implementation of a 5G Network Architecture Based on Software Defined Network. In Proceedings of the 2023 IEEE 3rd International Conference on Electronic Technology, Communication and Information (ICETCI), Changchun, China, 26–28 May 2023; pp. 1444–1449. [Google Scholar] [CrossRef]
- Khan, S.K.; Naseem, U.; Sattar, A.; Waheed, N.; Mir, A.; Qazi, A.; Ismail, M. UAV-aided 5G Network in Suburban, Urban, Dense Urban, and High-rise Urban Environments. In Proceedings of the 2020 IEEE 19th International Symposium on Network Computing and Applications (NCA), Cambridge, MA, USA, 24–27 November 2020; pp. 1–4. [Google Scholar] [CrossRef]
- Gharib, M.; Hopkins, B.; Murrin, J.; Koka, A.; Afghah, F. 5G Wings: Investigating 5G-Connected Drones Performance in Non-Urban Areas. In Proceedings of the 2023 IEEE 34th Annual International Symposium on Personal, Indoor and Mobile Radio Communications (PIMRC), Toronto, ON, Canada, 5–8 September 2023; pp. 1–6. [Google Scholar] [CrossRef]
- Matos, R.L.S.; Luján, E.; Mocskos, E.E. Performance of D2D/NB-IOT Communications in Urban and Suburban Environments. In Proceedings of the 2021 Winter Simulation Conference (WSC), Phoenix, AZ, USA, 12–15 December 2021; pp. 1–12. [Google Scholar] [CrossRef]
- Gonsioroski, L.; Da Silva Mello, L.; Santos, A.B.D. Measurements and Modeling of the Mobile Wireless Channel at 2.4 GHz in Urban and Suburban Areas. In Proceedings of the 2021 IEEE 32nd Annual International Symposium on Personal, Indoor and Mobile Radio Communications (PIMRC), Helsinki, Finland, 13–16 September 2021; pp. 873–879. [Google Scholar] [CrossRef]
- Huang, J.; Wang, C.-X.; Yang, Y.; Liu, Y.; Sun, J.; Zhang, W. Channel Measurements and Modeling for 400–600-MHz Bands in Urban and Suburban Scenarios. IEEE Internet Things J. 2021, 8, 5531–5543. [Google Scholar] [CrossRef]
- Huttunen, J.; Parssinen, M.; Heikkila, T.; Salmela, O.; Manner, J.; Pongracz, E. Base Station Energy Use in Dense Urban and Suburban Areas. IEEE Access 2023, 11, 2863–2874. [Google Scholar] [CrossRef]
- Hassan, S.A.; Omar, M.S.; Imran, M.A.; Qadir, J.; Jayakody, D.N.K. Universal Access in 5G Networks: Potential Challenges and Opportunities for Urban and Rural Environments. In 5G Networks: Fundamental Requirements, Enabling Technologies, and Operations Management; John Wiley & Sons: Hoboken, NJ, USA, 2018; pp. 299–326. [Google Scholar] [CrossRef]
- Hassan, S.A.; Omar, M.S.; Imran, M.A.; Qadir, J.; Jayako, D. Performance Enhancement of 5G Networks Using AI-Driven Techniques. Int. J. Appl. Res. Technol. 2023, 12, 64–70. [Google Scholar]
- Al-Dabbagh, R.K.; Al-Raweshidy, H.S.; Al-Aboody, N.A. Performance comparison of exploiting different millimetre-wave bands in 5G cellular networks. In Proceedings of the 2017 International Conference on Performance Evaluation and Modeling in Wired and Wireless Networks (PEMWN), Paris, France, 28–30 November 2017; pp. 1–6. [Google Scholar] [CrossRef]
- Mallikarjun, S.B.; Schellenberger, C.; Hobelsberger, C.; Schotten, H.D. Performance Analysis of a Private 5G SA Campus Network. Mobile Communication—Technologies and Applications. In Proceedings of the 26th ITG-Symposium, Osnabrueck, Germany, 18–19 May 2022; pp. 1–5. Available online: https://ieeexplore.ieee.org/document/9861872 (accessed on 18 February 2024).
- Cainelli, G.; Donga, M.; Rauchhaupt, L.; Underberg, L. Performance evaluation of a 5G device in a nonpublic network. In Proceedings of the 2021 IEEE 4th 5G World Forum (5GWF), Montreal, QC, Canada, 13–15 October 2021; pp. 334–339. [Google Scholar] [CrossRef]
- Yoshioka, S.; Inoue, Y.; Suyama, S.; Kishiyama, Y.; Okumura, Y.; Kepler, J.; Cudak, M. Field experimental evaluation of beamtracking and latency performance for 5G mm Wave radio access in outdoor mobile environment. In Proceedings of the 2016 IEEE 27th Annual International Symposium on Personal, Indoor, and Mobile Radio Communications (PIMRC), Valencia, Spain, 4–8 September 2016; pp. 1–6. [Google Scholar] [CrossRef]
- Erunkulu, O.O.; Zungeru, A.M.; Lebekwe, C.K.; Mosalaosi, M.; Chuma, J.M. 5G Mobile Communication Applications: A Survey and Comparison of Use Cases. IEEE Access 2021, 9, 97251–97295. [Google Scholar] [CrossRef]
- Perna, G.; Rosmaninho, R.; Sampaio, H.; Rito, P.; Luís, M.; Sargento, S. On the Performance of 5G for Cloud- and Edge-based Emergency Services in Smart Cities. In Proceedings of the 2021 12th International Conference on Network of the Future (NoF), Coimbra, Portugal, 6–8 October 2021; pp. 1–5. [Google Scholar] [CrossRef]
- Chen, H.; Liang, Y. Analysis of 5G Wireless Network Performance Index and Network Performance Optimization. In Proceedings of the 2023 IEEE 11th Joint International Information Technology and Artificial Intelligence Conference (ITAIC), Chongqing, China, 8–10 December 2023; pp. 1232–1235. [Google Scholar] [CrossRef]
- Li, W.; Yan, M.; Chan, C.A.; Wang, C.; Cai, Q. An Area Restriction Scheme Based on TAC Control Policy for 5G Private Network. In Proceedings of the 2023 IEEE 11th International Conference on Computer Science and Network Technology (ICCSNT), Dalian, China, 21–22 October 2023; pp. 85–89. [Google Scholar] [CrossRef]
- Arendt, C.; Böcker, S.; Bektas, C.; Wietfeld, C. Better Safe Than Sorry: Distributed Testbed for Performance Evaluation of Private Networks. In Proceedings of the 2022 IEEE Future Networks World Forum (FNWF), Montreal, QC, Canada, 10–14 October 2022; pp. 190–196. [Google Scholar] [CrossRef]
- Lin, P.; Yu, J.; Zhang, Z. Research and Trials of 5G SA Network Performance. In Proceedings of the 2022 5th International Conference on Information Communication and Signal Processing (ICICSP), Shenzhen, China, 26–28 November 2022; pp. 1–5. [Google Scholar] [CrossRef]
- Shurman, M.; Taqieddin, E.; Oudat, O.; Al-Qurran, R.; Nounou, A.A.A. Performance Enhancement in 5G Cellular Networks Using Priorities in Network Slicing. In Proceedings of the 2019 IEEE Jordan International Joint Conference on Electrical Engineering and Information Technology (JEEIT), Amman, Jordan, 9–11 April 2019; pp. 822–826. [Google Scholar] [CrossRef]
- Mohamed, R.; Zemouri, S.; Verikoukis, C. Performance Evaluation and Comparison between SA and NSA 5G Networks in Indoor Environment. In Proceedings of the 2021 IEEE International Mediterranean Conference on Communications and Networking (MeditCom), Athens, Greece, 7–10 September 2021; pp. 112–116. [Google Scholar] [CrossRef]
- Bhavana, D.; Chaudhari, S. Performance Evaluation of Openairinterface’s Scheduling Algorithms for 5G Networks. In Proceedings of the 2023 4th International Conference for Emerging Technology (INCET), Belgaum, India, 26–28 May 2023; pp. 1–4. [Google Scholar] [CrossRef]
- OpenSignal. The U.S. Rural-Urban Gap Has Narrowed for 5G Speeds but Widened for 5G Availability. OpenSignal. 14 September 2023. Available online: https://www.opensignal.com/2023/09/14/the-us-rural-urban-gap-has-narrowed-for-5g-speeds-but-widened-for-5g-availability (accessed on 18 February 2024).
- Dangi, R.; Lalwani, P.; Choudhary, G.; You, I.; Pau, G. Study and Investigation on 5G Technology: A Systematic Review. Sensors 2023, 22, 26. [Google Scholar] [CrossRef] [PubMed]
- 3GPP Specification for Pareto Distribution. Available online: https://www.3gpp.org/ftp/TSG_RAN/WG1_RL1/TSGR1_06/Docs/Pdfs/r1-99818.pdf (accessed on 3 December 2023).
- Zreikat, A.I. Load balancing call admission control algorithm (CACA) based on soft-handover in 5G Networks. In Proceedings of the 2022 IEEE 12th Annual Computing and Communication Workshop and Conference (CCWC), Las Vegas, NV, USA, 26–29 January 2022; pp. 863–869. [Google Scholar] [CrossRef]
- MOSEL Home Page. 2003. Available online: https://www4.cs.fau.de/Projects/MOSEL/ (accessed on 3 December 2023).
- Zreikat, A.I. Capacity Bounds Analysis of 5G networks in different propagation environments. In Proceedings of the 2023 IEEE 13th Annual Computing and Communication Workshop and Conference (CCWC), Las Vegas, NV, USA, 8–11 March 2023; pp. 988–993. [Google Scholar] [CrossRef]
- Parsons, J.D.; Parsons, P.J. The Mobile Radio Propagation Channel, 2nd ed.; John Wiley & Sons: Hoboken, NJ, USA, 2000; pp. 16–17+75–77+116–118. [Google Scholar]
- Zreikat, A.I.; Alabed, S. Performance Modeling and Analysis of LTE/Wi-Fi Coexistence. Electronics 2022, 11, 1035. [Google Scholar] [CrossRef]


| Symbol | Description |
|---|---|
| PLE | The path loss model for Environment E (1 for urban, 2 for suburban) |
| f | The frequency in MHz |
| hb | The height of the base station or transmitter in meters |
| hm | The height of the mobile or receiver in meters |
| d | The distance between transmitter and receiver in kilometers, km |
| a(hm) | The correction factor for the mobile antenna. |
| PS | The transmitted power |
| PR | The received power at Node B. |
| CFE | The correction factor for each environment E |
| mmWave | Millimeter waves |
| KE (hm, hb, f) | The function of hm, the height of the mobile and hb, the height of the base station, and the frequency, f. |
| IoT | Internet-of-things |
| NR 5G | 5G new radio |
| 3GPP | Third Generation Partnership Project |
| MIMO | Multiple input multiple output |
| gNBs | gNodeB |
| AN | Access Network Layer |
| AMF | Access and Mobility Management Function |
| OAI | Open Air Interface |
| AUSF | Authentication Server Function |
| SMF | Session Management Function |
| URLLC | Ultra-reliable low-latency communication |
| UPF | User Plane Function |
| TN layer | Transport network layer |
| TAC | Tracking Area Code |
| SLAs | Service Level Agreements |
| 5G SA | 5G standalone |
| mMTC | Massive machine-type communication |
Disclaimer/Publisher’s Note: The statements, opinions and data contained in all publications are solely those of the individual author(s) and contributor(s) and not of MDPI and/or the editor(s). MDPI and/or the editor(s) disclaim responsibility for any injury to people or property resulting from any ideas, methods, instructions or products referred to in the content. |
© 2024 by the authors. Licensee MDPI, Basel, Switzerland. This article is an open access article distributed under the terms and conditions of the Creative Commons Attribution (CC BY) license (https://creativecommons.org/licenses/by/4.0/).
Share and Cite
Zreikat, A.I.; Mathew, S. Performance Evaluation and Analysis of Urban-Suburban 5G Cellular Networks. Computers 2024, 13, 108. https://doi.org/10.3390/computers13040108
Zreikat AI, Mathew S. Performance Evaluation and Analysis of Urban-Suburban 5G Cellular Networks. Computers. 2024; 13(4):108. https://doi.org/10.3390/computers13040108
Chicago/Turabian StyleZreikat, Aymen I., and Shinu Mathew. 2024. "Performance Evaluation and Analysis of Urban-Suburban 5G Cellular Networks" Computers 13, no. 4: 108. https://doi.org/10.3390/computers13040108
APA StyleZreikat, A. I., & Mathew, S. (2024). Performance Evaluation and Analysis of Urban-Suburban 5G Cellular Networks. Computers, 13(4), 108. https://doi.org/10.3390/computers13040108