

Comparative GIS Analysis of Public Transport Accessibility in Metropolitan Areas


1
Faculty of Information Technology, Monash University, Clayton, VIC 3800, Australia
2
Department of Computer Science and Information Technology, La Trobe University, Bundoora, VIC 3086, Australia
*
Author to whom correspondence should be addressed.
Computers 2023, 12(12), 260; https://doi.org/10.3390/computers12120260
Submission received: 11 October 2023
/
Revised: 20 November 2023
/
Accepted: 24 November 2023
/
Published: 15 December 2023
(This article belongs to the Special Issue Selected Papers from the 23rd International Conference on Computational Science and Its Applications (ICCSA 2023))
Abstract
:With urban areas facing rapid population growth, public transport plays a key role to provide efficient and economic accessibility to the residents. It reduces the use of personal vehicles leading to reduced traffic congestion on roads and reduced pollution. To assess the performance of these transport systems, prior studies have taken into consideration the blank spot areas, population density, and stop access density; however, very little research has been performed to compare the accessibility between cities using a GIS-based approach. This paper compares the access and performance of public transport across Melbourne and Sydney, two cities with a similar size, population, and economy. The methodology uses spatial PostGIS queries to focus on accessibility-based approach for each residential mesh block and aggregates the blank spots, and the number of services offered by time of day and the frequency of services at the local government area (LGA) level. The results of the study reveal an interesting trend: that with increase in distance of LGA from city centre, the blank spot percentage increases while the frequency of services and stops offering weekend/night services declines. The results conclude that while Sydney exhibits a lower percentage of blank spots and has better coverage, performance in terms of accessibility by service time and frequency is better for Melbourne’s LGAs, even as the distance increases from the city centre.
1. Introduction
Efficient public transport in metropolitan cities leads to a significant reduction in air/noise pollution [1,2], lower congestion rates [3,4], and a lower demand for parking spaces [5]. Not only does this help in terms of environmental benefits [6,7,8] and reducing congestion, but it also boosts accessibility across all socio-economic backgrounds for cost-effective means of travel [9,10]. It reduces the average travel time [11] for the residents utilizing the service [12], promotes greater use of the services among residents because of the faster travel times [13], and has indirect health benefits as it promotes people to walk/cycle to the nearest public transport stop [14]. Well-planned transit systems can encourage economic development by increasing access to job opportunities, connecting businesses to a larger labour pool, and attracting investments [15]. It enables cohesion in societies and communities which would otherwise likely be unconnected [16].
Existing studies of public transport accessibility have been detailed in Section 2. They help to highlight the key factors that influence the accessibility of public transport in metropolitan areas such as population, population density, area of the region, and walking distance to the nearest public transport stops. While there exists studies that have compared the public transport systems between cities, they have not been compared using the blank spot technique. A blank spot can be defined as the smallest statistical mesh block area with no nearby public transport stop in a walkable distance. We wish to explore this gap in existing literature by comparing the performance of public transport systems across the metropolitan areas of similar population, size, and economy. The study uses GIS-based spatial queries to define the catchments of walkable distance for each public transport stop to aggregate these results to identify the blank spots across the cities. This study compares the accessibility using these blank spots and additionally, the frequency of travel and number of travel options between cities. The results are finally aggregated to the local government are (LGA) level and then compared between the two cities. Thus, it encourages the respective governing bodies to identify areas in which they excel or need further improvement from the set benchmark.
This study compares the current state of public transport systems and accessibility differences for residents of the two largest Australian cities, Melbourne, the capital of the state of Victoria, and Sydney, the capital of the state of New South Wales. As of 2021, Melbourne has a population of 4,917,750 (https://www.abs.gov.au/census/find-census-data/quickstats/2021/2GMEL accessed on 26 September 2023) with an area of 9900 sqkm and a yearly GDP of USD 369 billion as of 2019 (https://www.statista.com/statistics/1169423/australia-contribution-to-national-gdp-from-cities/ accessed on 26 September 2023) while Sydney supports a population of 5,231,147 as of 2021 (https://abs.gov.au/census/find-census-data/quickstats/2021/1GSYD accessed on 26 September 2023) covering 12,368 sqkm and a GDP of USD 460 billion as of 2019. With similar population counts, geographical areas, and economies, Melbourne and Sydney make good choices for the study of a comparative analysis of public transport access.
This paper concludes that Melbourne has a higher share of blank spots and that share increases with residential blocks being further from the city centre. However, the residents of Melbourne have a much more stable access to public transport across the times of the day and week even if the population density drops or if the area is further from the city centre, unlike in Sydney where these values show a downward trend.
We start this report by analysing the related works in Section 2 followed by Section 3 to understand the public transport systems. Section 4 reviews the datasets, its processing techniques and the methodology used to identify spatial catchments and blank spots. Section 5 reviews the results from the study while Section 6 discusses the findings and identifies the similarities and differences in accessibility between Melbourne and Sydney. Section 7 concludes the paper and highlights the future direction of this study.
2. Related Works
Saif et al. [17] performed a deep dive into various literature to conclude that accessibility is an important factor in designing public transport infrastructures. The connection between public transport accessibility and different aspects of transportation systems including mobility and sustainability or aspects of human life including employment rates, public health, and social exclusion are significant. In their paper, Saghapour et al. [18] proposed a new approach to measuring public transport accessibility in metropolitan areas that incorporates population density, hence stressing the importance of using population density as a metric to assess accessibility. The paper ran a simulation on Melbourne’s Statistical Area 1 (SA1) and concluded that 0.4% of residents do not have access to public transport. The simulation considered the maximum walking distance for buses and trams as 800 m and 1200 m for trains.
A GIS-based indexing model was developed in [19], which was used by the researchers to identify areas of high and low public transport accessibility in Gold Coast LGA, Australia. The Land Use and Public Transport Accessibility Indexing (LUPTAI) model was developed using a set of GIS-based spatial analytical techniques as an origin-based accessibility model which included the network analysis as a core component by segmenting accessibility in buckets of high, medium, low, and poor based on the distance required to access a public transport stop and the service frequencies. Ford et al. (2015) [20] presented a GIS-based tool for assessing transport accessibility in London, UK, which was designed based on generalized cost to measure the transport expenses across networks including the component of distance. The tool identified that the outer suburbs and suburbs with lower population densities of London faced accessibility challenges. Alamri et al. [21] measured the accessibility and performance of the public transport system of Melbourne, Australia, using the parameter of spatial blank spots, that is, those residential regions where people do not have access to public transport stops. The paper also established the variability of services by different times (daylight hours on weekdays, evenings, nights, weekends, or 24 h) with the area of LGA and its population densities, and established that LGAs with high population densities had better coverage and access to public transport while larger LGAs tended to have a higher share of blank spots.
Limited studies have compared public transport between cities, especially when we factor in accessibility. A large-scale study among six European cities was conducted in Ingvardson et al. [22]. The paper concluded that high accessibility and lower perceived travel costs boost satisfaction scores. This paper compared the satisfaction of public transport usage across the cities hence it directly did not assess the regions or fraction of population without access to public transport. Similarly, Osman et al. [23] also compared public transport systems between two similar cities in Europe but the focus of the study was on urban time and time policies for chrono-urbanism, i.e., breaking the barrier of long distances. The paper analysed the distributions of public transport connections of both the cities by varying the sections of the weeks, modes of travel, or time of day. However, the paper considered the cities as one unified block and not comprising smaller mesh blocks or LGAs. Ceder, A. (Avi) et al. [24] also compared public transport connectivity across major cities in New Zealand using eleven attributes that influence people’s choice of public transport over other available modes. The study identified the Auckland central business district (CBD) to have better connectivity scores than Wellington and Christchurch. The study was focused only on the CBD areas of the city and only assessed the connectivity, not accessibility. Table 1 highlights the limitations in the related works.
3. Case Study Area
Public transport in Melbourne and Sydney are managed by their respective state governments. Melbourne’s public transport is managed by Public Transport Victoria (PTV) which has its independent bodies governing vendors operating tram, train, and bus services, while in Sydney, public transport is managed by the body Transport for NSW. Before we review the distribution of the network and its statistics, we will identify residential clusters and population densities for each LGA.
3.1. LGAs in Melbourne and Sydney
Greater Melbourne covers 31 LGAs (Figure 1a) while Greater Sydney covers 33 LGAs (Figure 1b). Even though each of these cities have many LGAs which are significantly larger in terms of area, the distribution of residential areas is not uniform. For this reason, it is important to review the localities in which there are clusters of mesh blocks present which are used for residential purposes.
Figure 2a and Figure 3a map all the statistical mesh blocks for residential meshes. We can observe that, for both the cities, the clusters of the residential mesh blocks reduce as the radial distance increases from the city centres. This, however, does not reflect the number of people residing in the mesh blocks as some localities can be more dense than others.
Figure 2b and Figure 3b show the population densities classified in buckets of five of each LGA across respective cities. For Sydney, we can observe that, as we move radially outward of the city centre, the population density decreases, and the same can be observed with Melbourne but Melbourne’s western boundary LGAs are closer to the city centre than the eastern boundary LGAs and have higher population densities. Both Melbourne and Sydney have train, tram, bus, and ferry services; however, for this paper, we will only review land-based services.
3.2. Tram Network
Both cities have their tram networks primarily near the city centre. However, Sydney has a much smaller tram network. Melbourne has the world’s longest tram network with over 250 km of double-track network (https://yarratrams.com.au/facts-figures accessed on 26 September 2023), 200+ million trips per annum and over 1700 stops. In comparison, Sydney only has 24 km of double track, 32 million trips per annum, and 42 stops. Figure 4 shows the stops in the tram networks in Melbourne and Sydney (https://www.transport.nsw.gov.au/projects/current-projects/cbd-and-south-east-light-rail accessed on 26 September 2023).
3.3. Train Network
The metro train network is a key player in public transport as it enables mobility to a large pool of people across longer distances efficiently as it does not share any track with personal vehicles unlike trams which operate on motorways. These play a significant role in building the economy of the neighbourhood of their stop locations and the city in general. Melbourne’s train is run by metro trains and serves 17 lines, 219 stations, and over 998 km of track with 450,000 patrons every day (https://www.metrotrains.com.au/who-we-are/ accessed on 26 September 2023). Sydney trains cover 813 km of track with 8 lines and 170 stations with over 370 million passenger journeys (https://www.transport.nsw.gov.au/sites/default/files/media/documents/2017/Train%20Statistics%202014.pdf accessed on 26 September 2023). Figure 5 shows the metro train stops in the network of Melbourne and Sydney. While Melbourne has a higher count of lines, stations and track length, Sydney has the highest ridership of any public transport mode in Australia.
3.4. Bus Network
Buses are an important mode of public transport as they often connect residential neighbourhoods with points of interest such as metro stops, hospitals, schools, and shopping malls. They also have the largest fleet of vehicles and largest number of stops amongst all public transport modes in both Melbourne and Sydney. Unlike Melbourne, where bus services have the least patronage, the bus network has the second highest patronage in Sydney with a 41% share of ridership (https://www.transport.nsw.gov.au/data-and-research/data-and-insights/public-transport-trips-all-modes accessed on 26 September 2023). Figure 6 shows the stops in the bus networks of Melbourne and Sydney. We see that Sydney has much denser clusters in terms of bus stops as compared to Melbourne and follows a similar distribution to the residential mesh blocks.
4. Data and Methodology
4.1. General Transit Feed Specification Data
General transit feed specification (GTFS) defines a common format for public transportation schedules and associated geographic information (https://gtfs.org/schedule/reference/ accessed on 26 September 2023). These data can be used either as a static file or with an API for real-time updates. PTV and NSW Transport provide these data through their official websites or using a decentralized website (https://opendata.transport.nsw.gov.au/dataset/timetables-complete-gtfs/resource/67974f14-01bf-47b7-bfa5-c7f2f8a950ca accessed on 17 August 2023) for Sydney and (https://transitfeeds.com/p/ptv/497 accessed on 10 August 2023) for Melbourne. The structures of the GTFS data for both cities are very similar; however, slight differences exist in the fields of some files. Figure 7 shows the GTFS structure of Sydney while Figure 4 in Alamri et al. [21] shows the GTFS structure of Melbourne.
4.2. ABS Boundary Data
The Australian Bureau of Statistics (ABS) provides ESRI shape files which contains multi-polygon coordinates for various bounded regions such as mesh blocks (MBs), Statistical Area 1 (SA1), LGA, and state. Mesh blocks are the smallest bounded regions for census and statistics reporting, and the top five classifications include residential, parkland, primary production, commercial and educational. The 2021 shape file was used for the analysis (https://www.abs.gov.au/statistics/standards/australian-statistical-geography-standard-asgs-edition-3/jul2021-jun2026/access-and-downloads/digital-boundary-files accessed on 10 August 2023) which has 368,286 mesh blocks in Australia, among which 66% (242,943) are residential, which was used for the analysis. Mesh block IDs can be used to extract any census-based statistics. For this study, the population was extracted from the Excel file (https://www.abs.gov.au/census/guide-census-data/mesh-block-counts/latest-release accessed on 10 August 2023). The average population count in Melbourne’s residential mesh block is 102, while it is 111 in Sydney.
4.3. Methodology
The development of the process flow was inspired from [21]. The first stage is setting up data to make them ready for analysis by loading, cleaning, and preprocessing them in the desired format. The next stage is to define catchments for each stop and execute spatial search queries [25,26,27], which enable one to gather the residential mesh blocks of Melbourne and Sydney mapped with the stop catchments which spatially overlap with mesh blocks. Next, we evaluate all blank spots (mesh blocks without public transport access) and processes stop_times.txt to format in an interpretable way. The final stage is query aggregation, in which we aggregate all statistics at the LGA level. To accomplish this analysis, PostgreSQL v14.7 with PostGIS was used while the spatial plots were generated with QGIS 3.28.3 with the system specifications of Windows 11 Pro, and 11th Gen Intel(R) Core(TM) i7-1165G7 16 GB RAM was used.
4.3.1. Data Setup
This is the first stage of the analysis where all input data are transformed to SQL tables which would be used for query processing and aggregation. The data components include (a) ABS mesh block shapes [.shp format]; (b) ABS mesh block population (.xlsx format); (c) ABS LGA (.shp format); (d) GTFS data (.txt format) which were loaded in separate SQL schemas for Melbourne and Sydney. The ABS mesh block shapes file (a) contains the identifiers of mesh blocks in mb_code21 and their corresponding multi-polygon coordinates in the field wkb_geometry representing the bounded area of the meshes. The file has the field mb_cat21 which identifies the type of mesh; this field is filtered for `Residential’ as we will assess the accessibility for residential mesh blocks. The field gcc_name21 helps identify the greater capital city statistical area; hence, it is filtered for `Greater Sydney’ and `Melbourne’ for the respective schemas. It is important to have consistent geodetic coordinate system for the entire spatial analysis, and hence the spatial reference identifier (SRID) is set to 4326, which translates to WGS84, a widely used reference system for coordinates. Figure 8 shows the process involved in the setup of the data. From the GTFS data files, it is important to extract all stops with coordinates inside the mesh blocks present inside Melbourne and Sydney. The further processing is performed in the next phase.
4.3.2. Query Processing
This is the second phase in the methodology pipeline where the majority of the spatial operations such as joins and intersections take place. We combine the files (a), (b), and (c) at the mb_code21 level so that we have our organised data. The SQL code in Listing 1 achieves this task for public transport stops in Sydney.
| Listing 1. PostGIS query to extract details of public transport for Sydney. |
 |
For each stop, it is important to define the catchment area of a stop, that is, how many mesh blocks and its residents have access to a particular public transport stop. Alamri et al. [21] discussed the importance of designing public transport stops considering walking distance since it is a key element in establishing fair access to public transport. The proximity of these stops determine the limits to which people are ready to walk to those facilities to avail services. A walking distance of 400 m for tram and bus stops while 800 m for train stops was considered since people are committed to walk further for train stops. This was adopted in query processing to define the catchments to keep the analysis consistent with [21]. This paper looked into multiple studies for the ideal walking distance. For example, Saghapour et al. [18] considered a maximum walk time for buses and trams as 10 min or a distance of 800 m and the maximum walking time for trains was considered to be 15 min or a distance of 1200 m. This showed that people are committed to walk further for heavy-rail-based transit. Matthew et al. [28] reported the results from multiple surveys to estimate the walking distances depending on the purpose of the walk. It stated that, in Brisbane, Australia, the median walk distance to bus stops is 440 m, while that to train stations is 890 m.
The catchments of each public transport stop were defined by drawing a spatial circle/buffer of 400 m or 800 m (depending on the tram/bus or train stop) using SQL queries. The following SQL query Listing 2 implements catchments for Sydney. It implements the PostGIS spatial function ST_BUFFER which enables to create a collection of coordinates which defines catchment for each public transport stop centred at the coordinate of each stop_id represented by ’geom’. The following query defines the catchments for Sydney depending on the route_type, which indicates whether a stop is for tram, bus, or train.
| Listing 2. PostGIS query to create catchments of public transport stops in Sydney. |
 |
Figure 9a shows an example of a catchment of a bus stop ID: ’213223’ in Croydon, Sydney, and all the residential mesh blocks intersecting with the catchment area. In simple terms, the methodology will consider all residents of these mesh blocks to have access to this bus stop. Figure 9b shows all the catchments in Sydney. We can see the green dots with a larger catchment size of 800 m radius smaller in the count compared to the blue dots representing a catchment size of a radius of 200 m because of the large count of bus stops. Once the catchments have been defined, a spatial join has to be performed to match all the residential blocks that intersect with none or many catchments. Figure 9c shows an example of mb_code21 where 12 catchments intersect with the mesh block, meaning that the residents of the mesh block `10142841000’ have access to 12 bus tops within 400 m. mesh blocks that do not intersect with any catchment would be categorized as blank spots, that is, the residents of these mesh blocks do not have walkable access to public transport in the radius of 400/800 m. Figure 9d shows an example of the mesh block `10048902000’, which does not have any catchments intersecting with its boundary.
4.3.3. Aggregation
Aggregation is the last phase of the methodology where all the tables generated until the query processing phase will be aggregated at the LGA level. Statistics such as the area, population density, number of stops and number of blank residential meshes were aggregated at the LGA level. The queries in Listing 3 implemented the aggregation of the above metrics at the LGA level. The field wkb_geometry is a multi-polygon object containing all coordinates that defines the boundary of LGAs. The PostGIS spatial function ST_CONTAINS in the WHERE clause ensures that all stops present inside each LGA are aggregated for counts.
The GTFS data stop_times.txt contain the departure and arrival times at each stop. The hour component of this departure time can help classify the service time classification of each stop, that is, if the stop is active in morning (3 a.m.–9 a.m.), day (9 a.m.–6 p.m.), evening (6 p.m.–9 p.m.), or night (9 p.m.–3 a.m.). The GTFS data contain a 32 h format data, meaning that the following day is represented in the same 24 h with the addition of time. Hence, for the departure and arrival time exceeding 24 h, 24 h have to be deducted in the timestamp to ensure compliant processing. A stop containing all hours between 0 and 23 helps establish whether a stop operates 24 h a day which later enables to count the number of stops per LGA offering 24 h services.
| Listing 3. PostGIS query to aggregate multiple metrics for LGAs in Sydney. |
 |
From this stop_time data, the average wait times can be calculated by finding the difference of the arrival_time and the consecutive departure_time. The average wait times for each stop are then classified as (a) w5 (less than 5 min); (b) w15 (between 5 and 15 min); (c) w30 (between 15 and 30 min); and (d) w30+ (greater than 30 min). Finally, each stop classification of the frequency can be aggregated at the LGA level to evaluate the number of stops per LGA per frequency classification.
Similarly, the GTFS data calendar.txt contain details of the days of the week that a service operates. In the query processing phase, we generated a table for stop_details, which contains service_id. This is joined on a calendar to extract the days during which a service operates so that the count of the distinct stops offering weekday or weekend services is aggregated at the LGA level.
4.3.4. Distance Calculation
Since the analysis focuses on the variability of the access to public transport by different sets of parameters, it is important to decide the approach to be used to calculate how far each LGA is from the city centre.
There can be many approaches to evaluate the centre of each LGA and its distance from the city centre; however, each of the approach would have its own advantages and challenges. The easiest method is to find the geographical centroid of each LGA and use either a Euclidean or Haversine distance to find the distances. The advantages of the method include the ease of understanding and the ease of implementation. However, this method is not suitable for a real-world setting as a drivable distance between two points may be higher than a point-to-point straight line distance and the centroid may represent a coordinate which is far away from where the residents of that LGA live. For example, the northern most LGA in Sydney (Hawkesbury) is the largest LGA but its residents are concentrated in the southern region of the LGA. Hence, using a centroid approach would force the coordinates to shift far north of the desired outcome.
Therefore, to keep the analysis consistent, the coordinates of the LGAs were set to the coordinates of their respective council offices. To evaluate the distances, Google’s distance matrix API in Python was used so that the distances closely represent the real-world distances.
5. Results
We split this section into three parts in which we will explore the results of blank spots, uncovered population share, and variability in access by time of day/week and average wait times.
5.1. Blank Spot Distribution
Upon executing the stage of query processing and aggregation, the residential mesh blocks without access to public transport stops were mapped to understand their spatial distribution in Figure 10a,b for both Melbourne and Sydney. We can visually observe that Melbourne has a much higher density of blank spots compared to Sydney. Additionally, there are more blank spots in the LGAs which are further from the city centre, for instance, the highest count of blank spots in Melbourne is the LGA Mornington Peninsula with 658 blank spots, while in Sydney, it is in the LGA Liverpool with only 59 blank spots. Along with the counts, an important metric to check is the ratio of mesh blocks which do not have access to public transport for each LGA of both cities, which is displayed in Figure 11. It can be observed that the LGAs furthest away from the city centre have a higher share of blank spots within residential mesh blocks. Melbourne’s Mornington Peninsula has the highest share with 29.1% of the residential mesh blocks with no access to public transport, while Sydney’s highest is the LGA Wollondilly with 11.2%.
We then assessed the similarities and differences of public transport coverage and access between Melbourne and Sydney by varying the distance of the LGA from the city centre area of the LGA and its population density. Figure 12 explores this variability for blank spots per LGA. In Figure 12a,b, we see that, for both the cities, as the distance of the LGA or its area increases, the percentage of residential mesh blocks becoming a blank spot increases. Hence, a larger LGA or a greater distance between the LGA and the city centre is correlated with a higher percentage of residential areas not having access to public transport. Figure 12c plots the variability with respect to population density of each LGA. As the population density increases, the percentage of mesh blocks that are blank spots decreases. We observe that, if the number of people per square kilometre exceeds 3000, less than 5% of mesh blocks in the LGAs are blank spots. In all three plots, Melbourne has steeper curves. This is because the LGAs in Melbourne have a higher percentage of blank spots compared to Sydney, indicating that Sydney performs better to ensure the coverage of a larger population of residents.
5.2. Uncovered Population Distribution
While the counts and percentages of blank spots in each LGA help depict the regions where residents need public transport, it fails to capture the number of people in those blank spots. Figure 13 addresses this gap to show what percentage of the population in each LGA are uncovered. We can see that, in the Melbourne LGAs Mornington Peninsula and Casey, over 20% of residents do not have access to public transport, while no such LGA exists in Sydney, where 9.8% of residents in Wollondilly are uncovered.
5.3. Temporal Variability Distribution
Blank spots helped to highlight the difference in the coverage of public transport between the cities; however, this does not indicate the quality of the service in terms of availability or frequency. Offering the availability of public transport across night time, offering 24 h services, and services over the weekend provide better connectivity between residents and helps boost the local economy [29]. Figure 14 shows the percentage of stops in each LGA that offer night time services where night services are identified by stops having at least one departure between 9 p.m. and 3 a.m. Melbourne offers better night time services, and all its LGAs have at least 50% of their stops served by a night time service, while Sydney only has 3. Figure 15 shows the distribution of the percentage of stops in each LGA to offer a 24 h service. Again, LGAs in Melbourne perform better than Sydney to offer 24 h service. The majority of the LGAs in Sydney did not have more than 10% of stops that operate 24 h a day, while 49% of stops in Melbourne’s inner LGA Yaraa have 24 h services.
Figure 16 shows the percentage of stops in each LGA offering weekend services. Melbourne’s western LGAs have good accessibility in terms of weekend services while less than 70% of the stops the eastern-most LGAs have access to public transport during the weekend. In Sydney, over 75% stops in the inner LGAs have weekend services, but the outer LGAs have lower percentages, e.g., the Hawkesbury LGA has the lowest value, with 53% of stops having weekend services.
Further comparisons were performed to assess the performance of public transport services by time of day, showing how this is impacted by varying distances, areas, and LGA population densities. Figure 17 plots this variation by the distance of the LGA from the city centre for the different service times of the day where plot (a) was for Melbourne and (b) represents Sydney, whilst Figure 18 plots this variation by area of LGA.
We observe that the percentage of stops offering morning, day, and weekday services remains stable even if the distance between the LGA and the city centre increases or if their area increases. The residents of the outer suburbs of both cities have similar accessibilities in terms of service. However, Sydney’s evening, night, and weekend services show a decreasing trend with increases in the distance or the area of LGA. This means that, while Melbourne has a lower coverage than Sydney, especially in outer suburbs, it performs better than Sydney to ensure a more equitable distribution by service time, regardless of whether the distance or area of the LGA increases. The 24 h service showed no definitive trends, and on average, the values in Melbourne where higher than Sydney.
Similar plots were made to assess the variability of the service quality by the population density in Figure 19. This followed an inverse trend, where the percentage of public transport stops in Sydney’s LGA offered evening, night, and weekend services, which increased with the increasing population density, while for Melbourne, it showed no such trend. Morning, day, weekday, and 24 h services did not consistently increase or decrease, even if the population density increased for both cities.
5.4. Waiting Time Distribution
Figure 20 shows the percentages of stops with their average wait times for services exceeding 30 min. Melbourne has a significantly larger LGA count which offer services with average wait times of less than 30 min, while the majority of Sydney’s LGAs have over 20% of stops with over 30 min of wait time. In the LGA of Wollondilly in Sydney’s, 92% of the stops have waiting times of over 30 min.
Finally, each stop was classified as , , , and , indicating stops with average wait times of less than 5 min, 5–15 min, 15–30 min, and over 30 min. The percentages of stops by wait time categories were assessed by the varying distances in Figure 21, areas in Figure 22, and population densities of LGAs Figure 23 in Melbourne and Sydney. It was observed that increasing the LGA area or distance between an LGA and the city centre increased the percentage of stops with wait times over 30 min for both cities; however, Sydney showed a much larger change. For example, Melbourne’s Mornington Peninsula is the furthest LGA from the city centre and has 32% of its stops classified as , while Sydney’s LGA Blue Mountains is also the furthest from the city centre but has 67% of its stops classified as . With the increase in the area or distance of LGA, the percentage of stops classified as keep decreasing and go below 10% once the distance of the LGA from the city centre exceeds 20 km.
Both cities show an increase in the percentages of stops offering services as the population density increases. Compared to Melbourne, the LGAs in Sydney show a sharp decline in the percentages of stops offering services with the increase in population density. This goes to show that Melbourne has a much equitable access to public transport, and the residents of lower-density suburbs are not impacted by longer average wait times.
6. Discussion
This study performed an extensive yet replicable analysis of public transport accessibility across metropolitan areas using a spatial query approach to map public transport stop catchment and residential mesh blocks to identify those that were blank spots. The study uniquely considers varying parameters such as the distance between the LGA and the city centre, the population density, and the area of the LGA to compare the performances of public transport accessibility in Melbourne and Sydney, the two largest metropolitan cities of Australia of comparable socio-economic statistics.
Alamri et al. [21] presented the variation of blank spot percentage in Melbourne by the size of LGA and the population and population density of LGA. In our paper, we extended this to check the variation of the blank spot percentage of an LGA by its distance from city centre. This is important because it shows whether the public transport system is equally accessible for the entire metropolitan areas. The results showed us that both cities show better access near the city centre while the blank spot percentage generally increases as we move further away from the city centre. This can be verified in Figure 10 and Figure 11 and Tables in Appendix A and Appendix B. In our case study, Melbourne was reported to have a higher share of blank spots and percentages than Sydney, suggesting that Melbourne’s planning authorities need to benchmark from Sydney on how they need to improve accessibility for their residents. This is also further validated from Figure 13, where we observe that it is not just about the number of blank spots, but the share of residents impacted. Even in the outer fringes of Sydney, the residents enjoy equitable access to public transport stops, while the residents in Melbourne’s outer fringes such as Casey have as high as 26.5% of their residents residing in blank spots. An interesting take on this would be to check how many people in areas with low access are aged over 65 years old, since this would reduce their dependence on public transport [30,31]. In Figure 24, we plot the distribution of residents aged over 65 years old in Melbourne and Sydney and we observe that most LGAs in the outer fringes have a higher share of residents aged over 65 years. This signifies that Melbourne would have to implement policy changes to ensure that LGAs such as Casey and Mornington Peninsula improve their residents’ access to public transport, considering their high shares of residents aged over 65 years.
While prior studies [18,19,22] evaluated accessibility using their own methodologies, they did not incorporate temporal variability. Alamri et al. [21] did incorporate temporal variability but this was restricted to one city and did not incorporate the distance measure. The importance of temporal variability stems from the need for equitable access to public transport across different times of day [32] or different days of the week, meaning that the residents of outer fringes should have access to public transport to the same degree of availability as residents in the inner city. Our results indicate that Melbourne performs better than Sydney in terms of providing equitable access to public transport with temporal variability. Residents in the outer LGAs of Melbourne have a marginally low dip in services offered during evening/night or services during the weekend. Sydney, in comparison, has shown a significant dip in services with temporal variability, suggesting a gap in the equitable access to public transport services. This also extends to the average wait times of the stops, i.e., the frequency of services at a stop, as the outer LGAs in Sydney have a much higher ratio of stops with over 30 min wait times than Melbourne, meaning that residents in Sydney’s outer suburbs will have more difficulty in being connected, even though Sydney has a lower share of blank spots. This suggests that Sydney’s governing bodies need to consider policy changes in favour of the residents for a more equitable public transport system that does not compromise as the distance between the LGA or residential mesh block from city centre increases.
7. Conclusions
Public transport in a city plays an important role in developing societies and ensures an economic mode of transit, which enables the ease of access of its residents and promotes the local economy, reduces pollution, reduces parking demand and road traffic, encourages physical activity among residents, and helps develop social cohesion. The objective of this study was to compare the accessibility performance of public transport in metropolitan areas by visualizing the spatial regions containing residential mesh blocks. Those residential mesh blocks that did not have any overlapping catchments of a public transport stop were deemed as blank spots where the catchment was defined by the walkable distance to a public transport stop. The blank spot analysis revealed that Sydney offers better coverage of its public transport services and Melbourne had a higher uncovered population. However, the further analysis of the service time and the stop’s average waiting periods revealed that, if the distance between the LGA and the city centre or the size of LGA increases in Sydney, the services were reduced, whereas in Melbourne the change was not that significant. This indicated that Melbourne offers more equitable access to public transport than Sydney, even if it has lower coverage.
Recommendations to reduce blank spots would be providing more bus/train stops as per the spatial distribution of residential mesh blocks, while recommendations to make the public transport system more equitable considering temporal variations would be to increase services and test the change in patronage over time. While this study analysed the spatial distributions of blank spots and compared the access performances of two Australian cities, there are a few limitations to the approach used. Firstly, no socio-economic/demographic factors such as age, disability, income, profession, and ethnicity were considered, which other studies [20,22,24] successfully implemented. Secondly, this study did not consider node-to-node access, as in how easy or hard it would be for residents to travel to and from a specific location. Finally, the catchments were designed in the methodology, assuming a walking distance of 400 m/800 m for public transport stops; however, in reality, residents can either use a bicycle/car to reach their nearest stop. It is recommended that future studies consider these limitations in their design and create a modified index to better assess public transport accessibility.
Author Contributions
Conceptualization, D.T.; methodology, K.A.; validation, D.T. and K.A.; formal analysis, A.B.; investigation, A.B.; resources, K.A. and A.B.; data curation, A.B.; writing—original draft preparation, A.B.; writing—review and editing, A.B., D.T., and K.A.; visualization, A.B. All authors have read and agreed to the published version of the manuscript.
Funding
This research received no external funding.
Data Availability Statement
Data are contained within the article.
Conflicts of Interest
The authors declare no conflict of interest.
Appendix A
The tables below display data on the LGAs of greater Melbourne and Sydney. Each row represents an LGA, and the other columns depict the land area of the LGA in square kilometres (sqkm), population (Pop), population density (Psqkm), number of residential mesh blocks (MBR), number of blank spots (BL), percentage of blank spots (MBBl), and the percentage of the population in blank spots (PB).

Table A1.
LGA populations and blank spot details of Melbourne.
| LGA | sqkm | Pop | Psqkm | MBR | BL | MBBl | PB |
|---|---|---|---|---|---|---|---|
| Banyule | 62.54 | 125,282 | 2003 | 1302 | 45 | 3.5% | 3.5% |
| Bayside (Vic.) | 37.21 | 100,172 | 2692 | 1019 | 7 | 0.7% | 0.6% |
| Boroondara | 60.18 | 164,178 | 2728 | 1793 | 11 | 0.6% | 0.5% |
| Brimbank | 123.40 | 193,118 | 1565 | 1710 | 70 | 4.1% | 4.3% |
| Cardinia | 1282.57 | 103,446 | 81 | 945 | 250 | 26.5% | 26.5% |
| Casey | 409.43 | 360,576 | 881 | 3007 | 294 | 9.8% | 9.0% |
| Darebin | 53.47 | 146,238 | 2735 | 1582 | 4 | 0.3% | 0.3% |
| Frankston | 129.60 | 137,873 | 1064 | 1485 | 100 | 6.7% | 7.8% |
| Glen Eira | 38.69 | 147,124 | 3803 | 1553 | 1 | 0.1% | 0.1% |
| Greater Dandenong | 129.55 | 156,922 | 1211 | 1447 | 29 | 2.0% | 2.2% |
| Hobsons Bay | 64.24 | 90,853 | 1414 | 906 | 23 | 2.5% | 2.6% |
| Hume | 503.85 | 240,150 | 477 | 2078 | 210 | 10.1% | 8.6% |
| Kingston (Vic.) | 91.37 | 155,869 | 1706 | 1686 | 43 | 2.6% | 2.9% |
| Knox | 113.91 | 157,039 | 1379 | 1414 | 58 | 4.1% | 4.2% |
| Manningham | 113.35 | 122,505 | 1081 | 1167 | 34 | 2.9% | 2.8% |
| Maribyrnong | 31.23 | 83,558 | 2676 | 884 | 8 | 0.9% | 0.8% |
| Maroondah | 61.41 | 114,568 | 1866 | 1156 | 57 | 4.9% | 5.4% |
| Melbourne | 37.55 | 130,785 | 3483 | 852 | 0 | 0.0% | |
| Melton | 527.54 | 174,364 | 331 | 1482 | 300 | 20.2% | 17.7% |
| Merri-bek | 50.95 | 168,291 | 3303 | 1704 | 2 | 0.1% | 0.1% |
| Monash | 81.48 | 185,883 | 2281 | 1789 | 90 | 5.0% | 5.2% |
| Moonee Valley | 43.14 | 117,397 | 2721 | 1210 | 12 | 1.0% | 1.1% |
| Mornington Peninsula | 723.99 | 159,447 | 220 | 2261 | 658 | 29.1% | 30.7% |
| Nillumbik | 432.34 | 54,622 | 126 | 502 | 60 | 12.0% | 10.4% |
| Port Phillip | 20.61 | 98,346 | 4771 | 1252 | 0 | 0.0% | |
| Stonnington | 25.65 | 101,150 | 3943 | 1272 | 1 | 0.1% | 0.1% |
| Whitehorse | 64.28 | 167,301 | 2603 | 1633 | 34 | 2.1% | 2.0% |
| Whittlesea | 489.69 | 225,999 | 462 | 2051 | 162 | 7.9% | 7.0% |
| Wyndham | 542.09 | 290,070 | 535 | 2577 | 373 | 14.5% | 11.7% |
| Yarra | 19.54 | 83,119 | 4253 | 914 | 0 | 0.0% | |
| Yarra Ranges | 2468.21 | 137,169 | 56 | 1298 | 193 | 14.9% | 15.0% |
Table A2.
LGA populations and blank spot details of Sydney.
| LGA | sqkm | Pop | Psqkm | MBR | BL | MBBl | PB |
|---|---|---|---|---|---|---|---|
| Bayside (NSW) | 50.62 | 170,854 | 3375 | 1521 | 0 | 0.0% | |
| Blacktown | 238.85 | 390,474 | 1635 | 2906 | 41 | 1.4% | 1.4% |
| Blue Mountains | 1431.14 | 75,860 | 53 | 891 | 32 | 3.6% | 1.8% |
| Burwood | 7.13 | 39,431 | 5532 | 361 | 0 | 0.0% | |
| Camden | 201.53 | 118,008 | 586 | 943 | 54 | 5.7% | 5.3% |
| Campbelltown (NSW) | 311.41 | 173,825 | 558 | 1467 | 42 | 2.9% | 3.8% |
| Canada Bay | 19.92 | 88,003 | 4417 | 806 | 3 | 0.4% | 0.3% |
| Canterbury-Bankstown | 110.24 | 365,826 | 3319 | 3092 | 3 | 0.1% | 0.1% |
| Cumberland | 72.75 | 233,432 | 3209 | 1903 | 0 | 0.0% | |
| Fairfield | 101.51 | 206,290 | 2032 | 1702 | 13 | 0.8% | 0.7% |
| Georges River | 38.34 | 147,783 | 3855 | 1427 | 4 | 0.3% | 0.3% |
| Hawkesbury | 2775.14 | 47,273 | 17 | 473 | 27 | 5.7% | 4.7% |
| Hornsby | 455.04 | 146,581 | 322 | 1234 | 20 | 1.6% | 0.8% |
| Hunters Hill | 5.72 | 13,243 | 2316 | 130 | 0 | 0.0% | |
| Inner West | 35.21 | 179,367 | 5094 | 2027 | 0 | 0.0% | |
| Ku-ring-gai | 85.41 | 123,244 | 1443 | 1105 | 7 | 0.6% | 0.5% |
| Lane Cove | 10.48 | 38,087 | 3635 | 403 | 0 | 0.0% | |
| Liverpool | 305.74 | 231,084 | 756 | 1709 | 59 | 3.5% | 3.3% |
| Mosman | 8.65 | 27,786 | 3212 | 359 | 0 | 0.0% | |
| North Sydney | 10.49 | 67,440 | 6428 | 907 | 0 | 0.0% | |
| Northern Beaches | 254.21 | 260,811 | 1026 | 2571 | 43 | 1.7% | 1.7% |
| Parramatta | 83.83 | 248,965 | 2970 | 2119 | 3 | 0.1% | 0.1% |
| Penrith | 404.70 | 204,621 | 506 | 1773 | 10 | 0.6% | 0.5% |
| Randwick | 36.33 | 131,196 | 3611 | 1413 | 0 | 0.0% | |
| Ryde | 40.47 | 127,027 | 3138 | 1159 | 2 | 0.2% | 0.1% |
| Strathfield | 14.00 | 45,130 | 3223 | 356 | 0 | 0.0% | |
| Sutherland | 333.58 | 228,220 | 684 | 2147 | 4 | 0.2% | 0.1% |
| Sydney | 26.68 | 201,622 | 7558 | 1707 | 0 | 0.0% | |
| The Hills | 386.16 | 182,632 | 473 | 1462 | 8 | 0.5% | 0.3% |
| Waverley | 9.35 | 67,519 | 7221 | 836 | 0 | 0.0% | |
| Willoughby | 22.43 | 73,142 | 3262 | 733 | 1 | 0.1% | 0.1% |
| Wollondilly | 2555.43 | 38,765 | 15 | 347 | 39 | 11.2% | 9.8% |
| Woollahra | 12.26 | 51,589 | 4208 | 692 | 8 | 1.2% | 1.0% |
Appendix B
The following table displays the service details of the number of public transport stops by time of day and frequency for the LGAs of Melbourne and Sydney. represents the total number of stops in the corresponding LGA, D represents the stops operating during the day time. Similarly, , , , and 24 h represent the number of stops operating during the night, weekday, weekend, and for 24 h of the day, respectively. The columns , , , and represent the numbers of stops that have average wait times of five, five to fifteen, fifteen to thirty, and over thirty minutes.
Table A3.
Public transport service details of Melbourne’s LGAs.
| LGA | D | 24 h | |||||||||
|---|---|---|---|---|---|---|---|---|---|---|---|
| Banyule | 566 | 566 | 565 | 433 | 566 | 521 | 55 | 28 | 353 | 175 | 10 |
| Bayside (Vic.) | 475 | 475 | 475 | 401 | 475 | 457 | 54 | 9 | 269 | 179 | 18 |
| Boroondara | 692 | 690 | 681 | 455 | 692 | 678 | 193 | 206 | 223 | 253 | 10 |
| Brimbank | 821 | 820 | 812 | 725 | 821 | 806 | 119 | 29 | 451 | 313 | 28 |
| Cardinia | 292 | 290 | 263 | 237 | 292 | 270 | 4 | 5 | 63 | 135 | 89 |
| Casey | 1264 | 1254 | 1203 | 1129 | 1264 | 1206 | 6 | 32 | 543 | 583 | 106 |
| Darebin | 843 | 843 | 790 | 732 | 843 | 792 | 128 | 123 | 580 | 114 | 26 |
| Frankston | 624 | 623 | 596 | 502 | 624 | 587 | 105 | 9 | 190 | 331 | 94 |
| Glen Eira | 641 | 641 | 640 | 603 | 641 | 634 | 143 | 76 | 355 | 204 | 6 |
| Greater Dandenong | 746 | 745 | 726 | 588 | 746 | 714 | 31 | 18 | 278 | 352 | 98 |
| Hobsons Bay | 436 | 436 | 430 | 356 | 436 | 434 | 25 | 6 | 242 | 181 | 7 |
| Hume | 1018 | 1006 | 991 | 874 | 1018 | 988 | 25 | 26 | 489 | 441 | 62 |
| Kingston (Vic.) | 797 | 796 | 718 | 624 | 797 | 696 | 36 | 20 | 371 | 242 | 164 |
| Knox | 791 | 787 | 736 | 607 | 791 | 692 | 82 | 19 | 354 | 221 | 197 |
| Manningham | 628 | 628 | 575 | 416 | 628 | 602 | 158 | 55 | 333 | 214 | 26 |
| Maribyrnong | 450 | 450 | 449 | 399 | 450 | 449 | 93 | 49 | 301 | 99 | 1 |
| Maroondah | 530 | 529 | 523 | 467 | 530 | 528 | 66 | 8 | 183 | 316 | 23 |
| Melbourne | 551 | 534 | 546 | 513 | 551 | 520 | 209 | 339 | 171 | 35 | 6 |
| Melton | 526 | 519 | 515 | 472 | 526 | 518 | 23 | 2 | 141 | 300 | 83 |
| Merri-bek | 790 | 788 | 776 | 570 | 790 | 776 | 72 | 143 | 362 | 254 | 31 |
| Monash | 862 | 862 | 852 | 776 | 862 | 855 | 190 | 36 | 508 | 317 | 1 |
| Moonee Valley | 575 | 571 | 565 | 468 | 575 | 567 | 40 | 144 | 365 | 41 | 25 |
| Mornington Peninsula | 685 | 685 | 534 | 524 | 685 | 658 | 218 | 0 | 130 | 335 | 220 |
| Nillumbik | 238 | 238 | 234 | 178 | 238 | 219 | 4 | 5 | 122 | 108 | 3 |
| Port Phillip | 372 | 372 | 372 | 310 | 372 | 367 | 69 | 110 | 185 | 72 | 5 |
| Stonnington | 431 | 431 | 416 | 324 | 431 | 400 | 15 | 163 | 193 | 44 | 31 |
| Whitehorse | 898 | 896 | 879 | 764 | 898 | 851 | 118 | 76 | 600 | 173 | 49 |
| Whittlesea | 909 | 909 | 907 | 845 | 909 | 889 | 121 | 20 | 561 | 308 | 20 |
| Wyndham | 927 | 927 | 925 | 776 | 927 | 916 | 144 | 3 | 206 | 683 | 35 |
| Yarra | 287 | 287 | 287 | 261 | 287 | 261 | 141 | 130 | 113 | 35 | 9 |
| Yarra Ranges | 781 | 779 | 673 | 431 | 780 | 706 | 23 | 7 | 121 | 406 | 247 |
Table A4.
Public transport service details of Sydney’s LGAs.
| LGA | D | 24 h | |||||||||
|---|---|---|---|---|---|---|---|---|---|---|---|
| Bayside (NSW) | 724 | 718 | 639 | 493 | 723 | 636 | 50 | 56 | 360 | 229 | 79 |
| Blacktown | 2088 | 2043 | 1762 | 1565 | 2087 | 1730 | 23 | 107 | 1017 | 603 | 361 |
| Blue Mountains | 886 | 846 | 212 | 62 | 884 | 587 | 0 | 6 | 46 | 236 | 598 |
| Burwood | 141 | 137 | 127 | 123 | 139 | 133 | 12 | 39 | 82 | 11 | 9 |
| Camden | 605 | 587 | 423 | 306 | 605 | 415 | 1 | 14 | 303 | 75 | 213 |
| Campbelltown (NSW) | 1186 | 1125 | 806 | 637 | 1185 | 839 | 6 | 29 | 404 | 344 | 409 |
| Canada Bay | 352 | 345 | 292 | 268 | 350 | 286 | 47 | 76 | 196 | 25 | 55 |
| Canterbury-Bankstown | 2035 | 1962 | 1562 | 1054 | 2035 | 1611 | 45 | 119 | 848 | 668 | 400 |
| Cumberland | 1371 | 1311 | 1060 | 498 | 1370 | 1077 | 7 | 42 | 543 | 480 | 306 |
| Fairfield | 1204 | 1167 | 926 | 591 | 1204 | 912 | 1 | 24 | 578 | 298 | 304 |
| Georges River | 747 | 737 | 651 | 477 | 746 | 680 | 4 | 39 | 349 | 278 | 81 |
| Hawkesbury | 570 | 534 | 284 | 76 | 570 | 304 | 1 | 5 | 36 | 154 | 375 |
| Hornsby | 1099 | 1082 | 820 | 687 | 1097 | 906 | 52 | 88 | 368 | 287 | 356 |
| Hunters Hill | 101 | 93 | 74 | 43 | 101 | 82 | 12 | 5 | 42 | 38 | 16 |
| Inner West | 591 | 573 | 540 | 486 | 587 | 549 | 97 | 169 | 338 | 60 | 24 |
| Ku-ring-gai | 834 | 806 | 664 | 453 | 834 | 631 | 10 | 25 | 258 | 333 | 218 |
| Lane Cove | 240 | 237 | 206 | 119 | 240 | 203 | 15 | 21 | 126 | 52 | 41 |
| Liverpool | 1217 | 1183 | 969 | 757 | 1217 | 962 | 3 | 61 | 508 | 382 | 266 |
| Mosman | 205 | 183 | 157 | 67 | 205 | 127 | 16 | 30 | 54 | 52 | 69 |
| North Sydney | 252 | 248 | 224 | 143 | 252 | 224 | 36 | 66 | 79 | 80 | 27 |
| Northern Beaches | 1634 | 1604 | 1212 | 1069 | 1633 | 1211 | 179 | 135 | 638 | 413 | 448 |
| Parramatta | 1176 | 1134 | 950 | 671 | 1166 | 874 | 145 | 116 | 387 | 407 | 266 |
| Penrith | 1482 | 1437 | 1188 | 818 | 1482 | 1232 | 4 | 32 | 558 | 524 | 368 |
| Randwick | 608 | 599 | 520 | 517 | 608 | 524 | 200 | 163 | 316 | 70 | 59 |
| Ryde | 709 | 691 | 574 | 459 | 707 | 575 | 75 | 95 | 328 | 164 | 122 |
| Strathfield | 229 | 227 | 179 | 115 | 224 | 206 | 0 | 13 | 99 | 83 | 34 |
| Sutherland | 1420 | 1375 | 901 | 392 | 1418 | 981 | 5 | 29 | 298 | 475 | 618 |
| Sydney | 667 | 649 | 630 | 586 | 664 | 621 | 195 | 267 | 302 | 55 | 43 |
| The Hills | 1425 | 1394 | 1029 | 846 | 1425 | 966 | 64 | 141 | 561 | 293 | 430 |
| Waverley | 244 | 239 | 220 | 215 | 244 | 215 | 47 | 56 | 154 | 16 | 18 |
| Willoughby | 372 | 367 | 284 | 177 | 372 | 310 | 4 | 69 | 101 | 75 | 127 |
| Wollondilly | 408 | 391 | 225 | 11 | 403 | 280 | 0 | 0 | 2 | 31 | 375 |
| Woollahra | 271 | 265 | 252 | 237 | 271 | 251 | 73 | 24 | 157 | 77 | 13 |
References
- Borck, R. Public transport and urban pollution. Reg. Sci. Urban Econ. 2019, 77, 356–366. [Google Scholar] [CrossRef]
- Sun, L.; Zhang, T.; Liu, S.; Wang, K.; Rogers, T.; Yao, L.; Zhao, P. Reducing energy consumption and pollution in the urban transportation sector: A review of policies and regulations in Beijing. J. Clean. Prod. 2021, 285, 125339. [Google Scholar] [CrossRef]
- Nguyen, P.; Currie, G.; Young, B. Public transport congestion relief measurement: A new framework and its impacts. In Proceedings of the 37th Australasian Transport Research Forum (ATRF), Sydney, NSW, Australia, 30 September–2 October 2015. [Google Scholar]
- Aftabuzzaman, M.; Currie, G.; Sarvi, M. Evaluating the congestion relief impacts of public transport in monetary terms. J. Public Transp. 2010, 13, 1–24. [Google Scholar] [CrossRef]
- De Gruyter, C.; Truong, L.T.; Taylor, E.J. Can high quality public transport support reduced car parking requirements for new residential apartments? J. Transp. Geogr. 2020, 82, 102627. [Google Scholar] [CrossRef]
- Ding, X.; Chen, Y.; Li, M.; Liu, N. Booster or killer? Research on undertaking transferred industries and residents’ well-being improvements. Int. J. Environ. Res. Public Health 2022, 19, 15422. [Google Scholar] [CrossRef]
- Ding, X.; Cai, Z.; Fu, Z. Does the new-type urbanization construction improve the efficiency of agricultural green water utilization in the Yangtze River Economic Belt? Environ. Sci. Pollut. Res. 2021, 28, 64103–64112. [Google Scholar] [CrossRef]
- Yang, G.; Zhang, J.; Zhang, J. Can central and local forces promote green innovation of heavily polluting enterprises? evidence from China. Front. Energy Res. 2023, 11, 1194543. [Google Scholar]
- Vigren, A. Cost efficiency in Swedish public transport. Res. Transp. Econ. 2016, 59, 123–132. [Google Scholar] [CrossRef]
- Foth, N.; Manaugh, K.; El-Geneidy, A.M. Towards equitable transit: Examining transit accessibility and social need in Toronto, Canada, 1996–2006. J. Transp. Geogr. 2013, 29, 1–10. [Google Scholar] [CrossRef]
- Adhinugraha, K.; Taniar, D.; Phan, T.; Beare, R. Predicting travel time within catchment area using Time Travel Voronoi Diagram (TTVD) and crowdsource map features. Inf. Process. Manag. 2022, 59, 102922. [Google Scholar] [CrossRef]
- Chowdhury, S.; Ceder, A.A.; Schwalger, B. The effects of travel time and cost savings on commuters’ decision to travel on public transport routes involving transfers. J. Transp. Geogr. 2015, 43, 151–159. [Google Scholar] [CrossRef]
- Chakrabarti, S. How can public transit get people out of their cars? An analysis of transit mode choice for commute trips in Los Angeles. Transp. Policy 2017, 54, 80–89. [Google Scholar] [CrossRef]
- Litman, T. Evaluating Public Transportation Health Benefits; Victoria Transport Policy Institute: Victoria, BC, Canada, 2012. [Google Scholar]
- Tilahun, N.; Fan, Y. Transit and job accessibility: An empirical study of access to competitive clusters and regional growth strategies for enhancing transit accessibility. Transp. Policy 2014, 33, 17–25. [Google Scholar] [CrossRef]
- Makhubu, A. A democratic city? The impact of public transport networks on social cohesion. Int. Plan. Hist. Soc. Proc. 2016, 17, 223–234. [Google Scholar]
- Saif, M.A.; Zefreh, M.M.; Torok, A. Public transport accessibility: A literature review. Periodica Polytechnica Transportation Engineering 2019, 47, 36–43. [Google Scholar] [CrossRef]
- Saghapour, T.; Moridpour, S.; Thompson, R.G. Public transport accessibility in metropolitan areas: A new approach incorporating population density. J. Transp. Geogr. 2016, 54, 273–285. [Google Scholar] [CrossRef]
- Yigitcanlar, T.; Sipe, N.; Evans, R.; Pitot, M. A GIS-based land use and public transport accessibility indexing model. Aust. Plan. 2007, 44, 30–37. [Google Scholar] [CrossRef]
- Ford, A.C.; Barr, S.L.; Dawson, R.J.; James, P. Transport accessibility analysis using GIS: Assessing sustainable transport in London. ISPRS Int. J. Geo-Inf. 2015, 4, 124–149. [Google Scholar] [CrossRef]
- Alamri, S.; Adhinugraha, K.; Allheeib, N.; Taniar, D. GIS Analysis of Adequate Accessibility to Public Transportation in Metropolitan Areas. ISPRS Int. J. Geo-Inf. 2023, 12, 180. [Google Scholar] [CrossRef]
- Ingvardson, J.B.; Nielsen, O.A. The relationship between norms, satisfaction and public transport use: A comparison across six European cities using structural equation modelling. Transp. Res. Part A Policy Pract. 2019, 126, 37–57. [Google Scholar] [CrossRef]
- Osman, R.; Ira, V.; Trojan, J. A tale of two cities: The comparative chrono-urbanism of Brno and Bratislava public transport systems. Morav. Geogr. Rep. 2020, 28, 269–282. [Google Scholar] [CrossRef]
- Ceder, A.; Teh, C.S. Comparing public transport connectivity measures of major New Zealand cities. Transp. Res. Rec. 2010, 2143, 24–33. [Google Scholar] [CrossRef]
- Islam, M.S.; Shen, B.; Wang, C.; Taniar, D.; Wang, J. Efficient processing of reverse nearest neighborhood queries in spatial databases. Inf. Syst. 2020, 92, 101530. [Google Scholar] [CrossRef]
- Allheeib, N.; Islam, M.S.; Taniar, D.; Shao, Z.; Cheema, M.A. Density-based reverse nearest neighbourhood search in spatial databases. J. Ambient. Intell. Humaniz. Comput. 2021, 12, 4335–4346. [Google Scholar] [CrossRef]
- Allheeib, N.; Adhinugraha, K.; Taniar, D.; Islam, M.S. Computing reverse nearest neighbourhood on road maps. In World Wide Web; Springer: Cham, Switzerland, 2022; pp. 1–32. [Google Scholar]
- Burke, M.; Brown, A. Distances people walk for transport. Road Transp. Res. A J. Aust. N. Z. Res. Pract. 2007, 16, 16–29. [Google Scholar]
- Curtis, A.; Droste, N.; Coomber, K.; Guadagno, B.; Mayshak, R.; Hyder, S.; Hayley, A.; Miller, P. Off the rails—Evaluating the nightlife impact of Melbourne, Australia’s 24-h public transport trial. Int. J. Drug Policy 2019, 63, 39–46. [Google Scholar] [CrossRef]
- Wong, R.; Szeto, W.; Yang, L.; Li, Y.; Wong, S. Public transport policy measures for improving elderly mobility. Transp. Policy 2018, 63, 73–79. [Google Scholar] [CrossRef]
- Cui, J.; Loo, B.P.; Lin, D. Travel behaviour and mobility needs of older adults in an ageing and car-dependent society. Int. J. Urban Sci. 2017, 21, 109–128. [Google Scholar] [CrossRef]
- Stępniak, M.; Goliszek, S. Spatio-temporal variation of accessibility by public transport—The equity perspective. In The Rise of Big Spatial Data; Springer: Cham, Switzerland, 2017; pp. 241–261. [Google Scholar]
Figure 1.
(a) Melbourne’s local government areas; (b) Sydney’s local government areas.

Figure 2.
Melbourne’s (a) residential mesh blocks by LGA; and (b) population density by LGA.

Figure 3.
Sydney’s (a) residential mesh blocks by LGA; and (b) population density by LGA.

Figure 4.
Tram stops in (a) Melbourne; and (b) Sydney.

Figure 5.
Train stops in (a) Melbourne; and (b) Sydney.

Figure 6.
Bus stops in (a) Melbourne; and (b) Sydney.

Figure 7.
GTFS structure of Sydney.
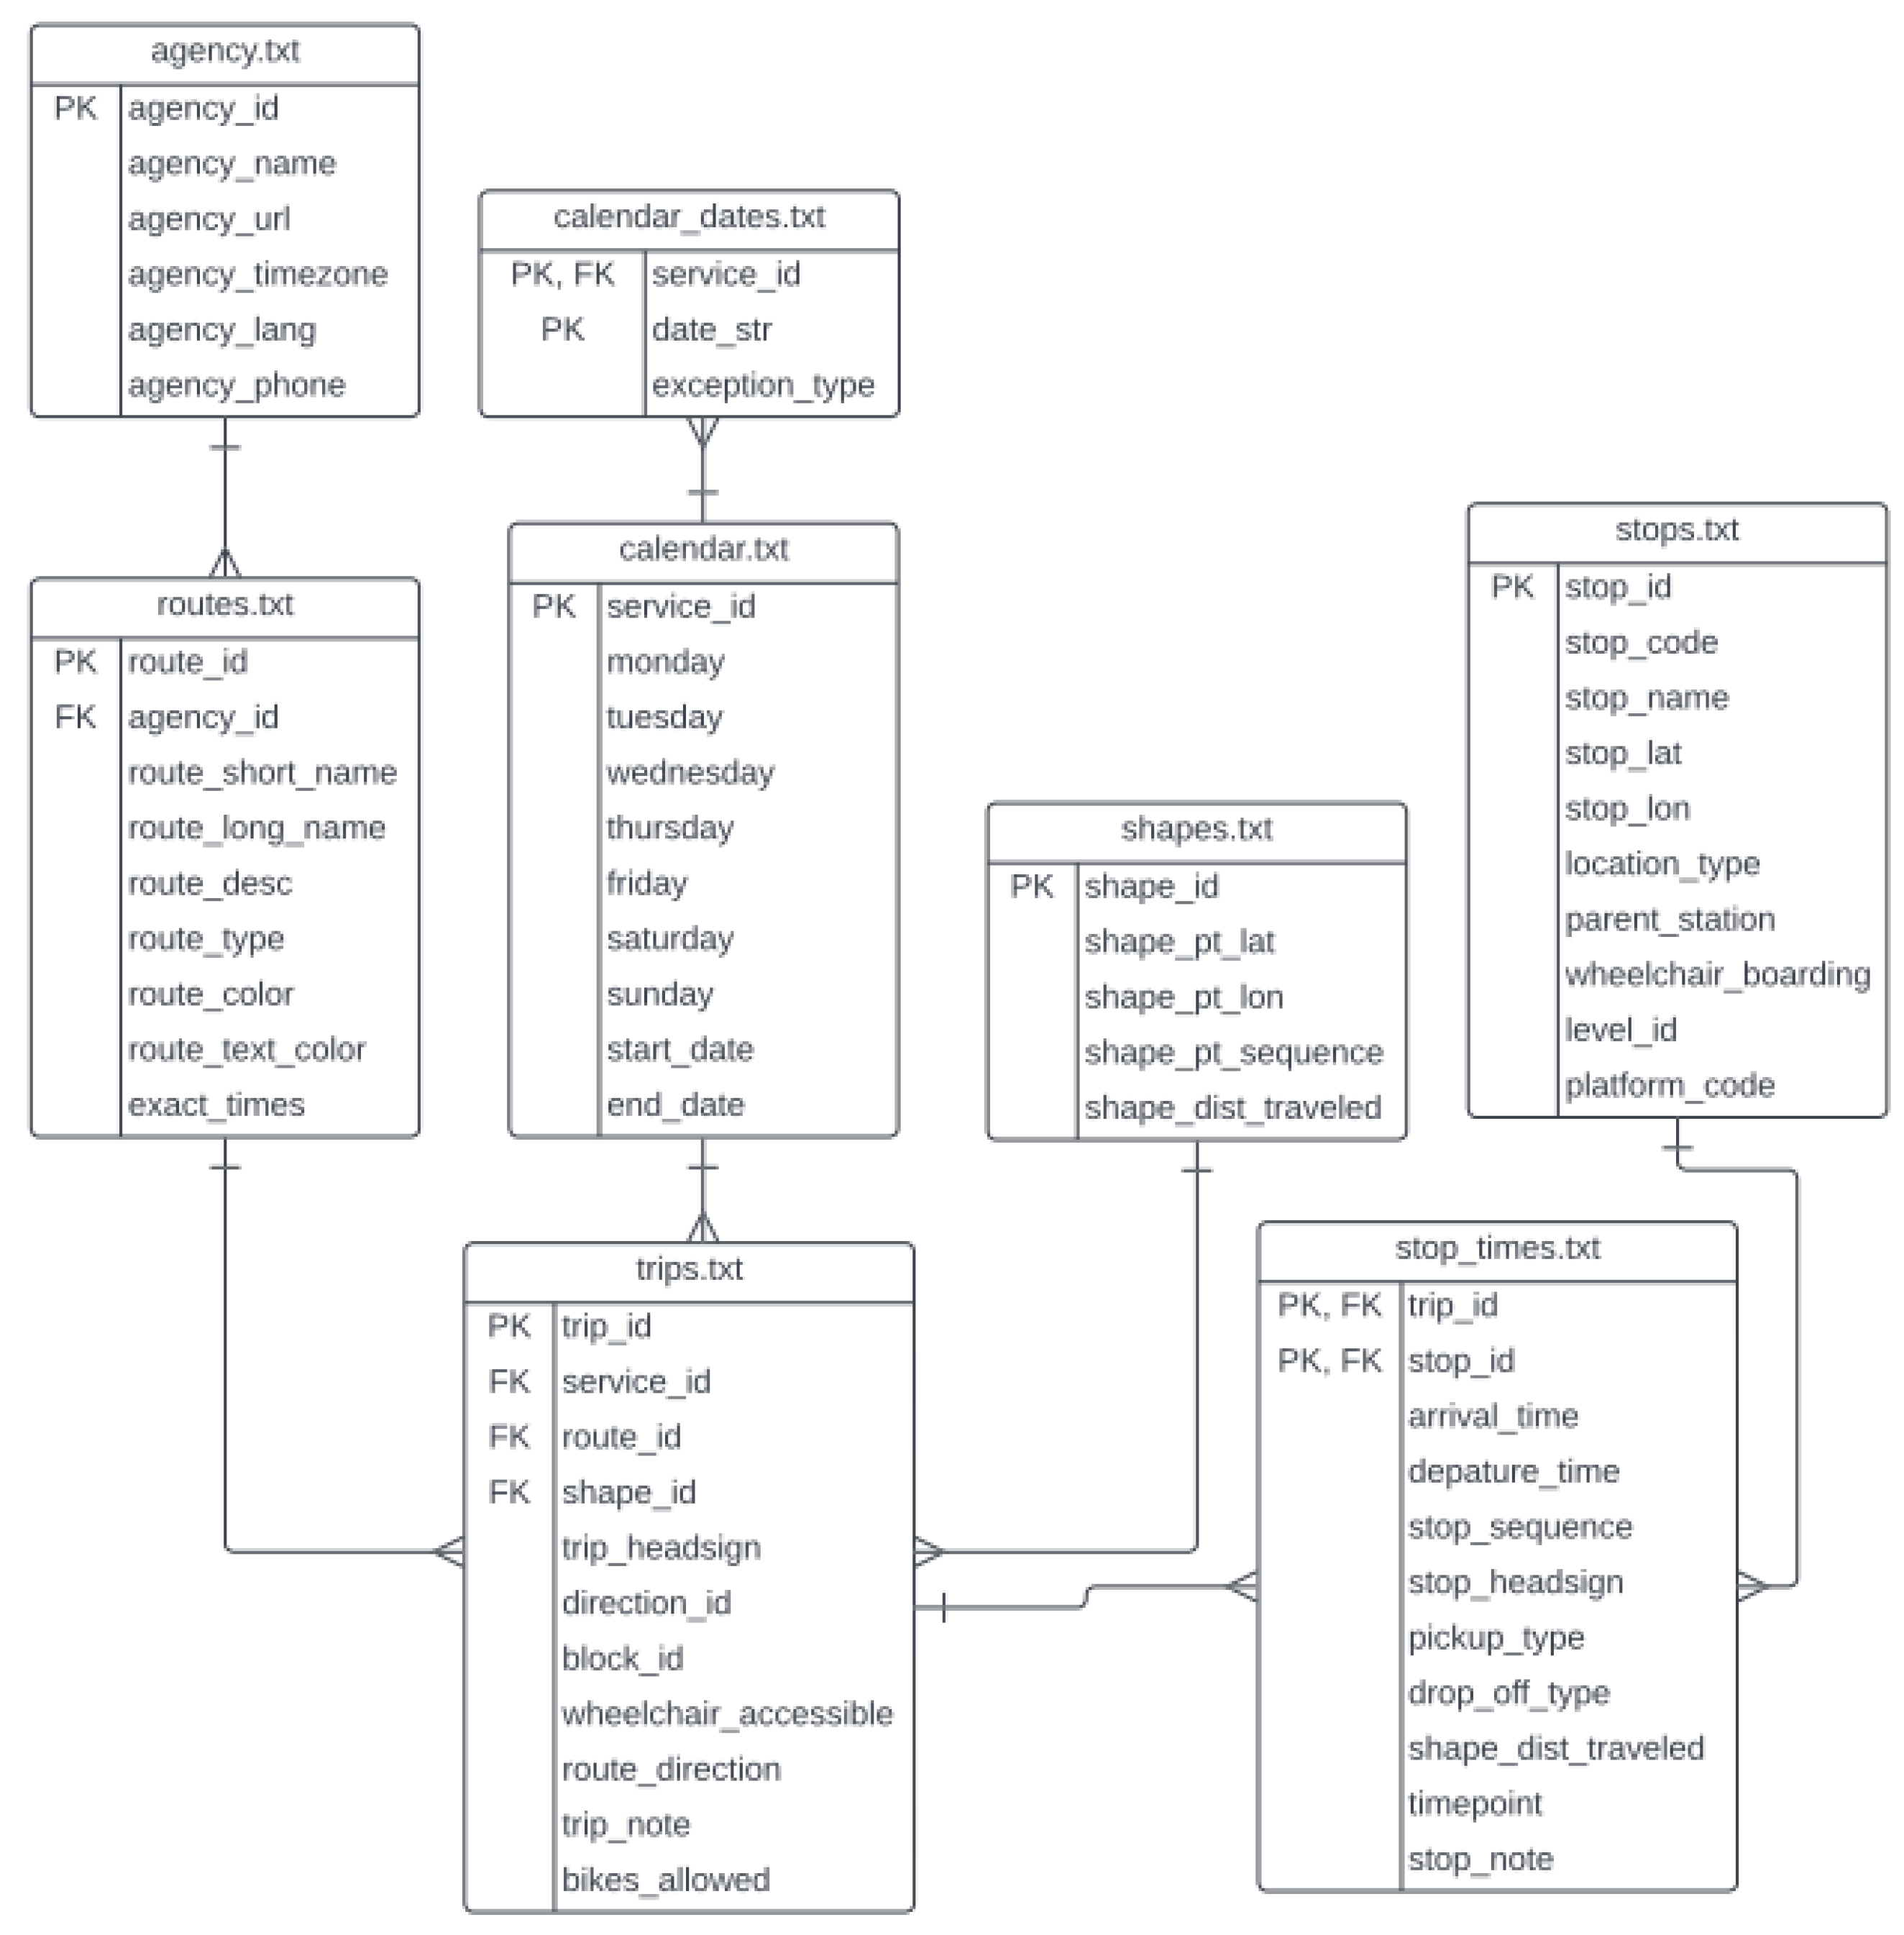
Figure 8.
Process map for the study.

Figure 9.
(a) Catchment of bus stop ID: `213223’ in Croydon, Sydney; (b) all catchments in Sydney with a 400 m radius are in blue and all catchments in Sydney with a 800 m radius are in green (c) 12 overlapping catchments for mb_code21: `10142841000’ in Croydon, Sydney; and (d) Blank spot mb_code21: `10048902000’ in Sydney.

Figure 10.
Blank spots in (a) Melbourne; and (b) Sydney.

Figure 11.
Percentages of residential mesh blocks with no access to public transport in (a) Melbourne; and (b) Sydney.
Figure 11.
Percentages of residential mesh blocks with no access to public transport in (a) Melbourne; and (b) Sydney.

Figure 12.
Varying % of residential mesh blocks per LGA that are blank spots by (a) distance from the city centre; (b) the area of LGA; and (c) the population density of LGA.
Figure 12.
Varying % of residential mesh blocks per LGA that are blank spots by (a) distance from the city centre; (b) the area of LGA; and (c) the population density of LGA.


Figure 13.
Uncovered populations in (a) Melbourne; and (b) Sydney.

Figure 14.
Percentages of stops that offer night time services in (a) Melbourne; and (b) Sydney.

Figure 15.
Percentages of stops offering 24 h services in (a) Melbourne; and (b) Sydney.

Figure 16.
Percentages of stops offering weekend services in (a) Melbourne; and (b) Sydney.

Figure 17.
Percentages of stops offering services per LGA, varying by distance, in (a) Melbourne; and (b) Sydney.
Figure 17.
Percentages of stops offering services per LGA, varying by distance, in (a) Melbourne; and (b) Sydney.

Figure 18.
Percentages of stops offering services per LGA, varying by area, in (a) Melbourne; and (b) Sydney.
Figure 18.
Percentages of stops offering services per LGA, varying by area, in (a) Melbourne; and (b) Sydney.

Figure 19.
Percentages of stops offering services per LGA, varying by population density, in (a) Melbourne; and (b) Sydney.
Figure 19.
Percentages of stops offering services per LGA, varying by population density, in (a) Melbourne; and (b) Sydney.

Figure 20.
Percentages of stops with average waiting times over 30 mins in (a) Melbourne; and (b) Sydney.
Figure 20.
Percentages of stops with average waiting times over 30 mins in (a) Melbourne; and (b) Sydney.

Figure 21.
Percentages of stops with a frequency classification varying by LGA and distance in (a) Melbourne; and (b) Sydney.
Figure 21.
Percentages of stops with a frequency classification varying by LGA and distance in (a) Melbourne; and (b) Sydney.

Figure 22.
Percentages of stops with frequency classification varying by LGA and area in (a) Melbourne; and (b) Sydney.
Figure 22.
Percentages of stops with frequency classification varying by LGA and area in (a) Melbourne; and (b) Sydney.

Figure 23.
Percentages of stops with a frequency classification varying by LGA and population density in (a) Melbourne; and (b) Sydney.
Figure 23.
Percentages of stops with a frequency classification varying by LGA and population density in (a) Melbourne; and (b) Sydney.

Figure 24.
Distribution of residents over the age 65 by LGA in (a) Melbourne; and (b) Sydney.

Table 1.
Limitations in the existing literature.
| Reference | Method | Geography Scope | Metrics Used | PT Mode | Gap/Limitations |
|---|---|---|---|---|---|
| Saif et al. [17] | Literature review | Not applicable | Not applicable | Bus, train, trams | This article summarised seven papers on public transport accessibility. The review highlighted different indicators and methodologies used such as the index for public transport need, provision and gaps, perceived accessibility, employment rate, sustainability, walking time, spatial efficiency, and mobility. However, the papers did not factor in the variability of the service quality with the distance or population of the LGA. |
| Saghapour et al. [18] | GIS-based indexing model | Melbourne, Australia | Walking distance to stops, population density | Bus, train, trams | The study explored the usage of population density to create the Public Transport Accessibility Index (PTAI) of each Statistical Area 1 of Melbourne. While this approach helped identify areas of low access, it did not factor in temporal variability. |
| Yigitcanlar et al. [19] | GIS-based indexing model | Gold Coast, Australia | Centres of employment, health, shopping, financial, and education | Bus, train | The study created a GIS-based index called the Land Use and Public Transport Accessibility Indexing Model (LUPTAI) which seeks to quantify the ability to access common land use destinations by walking and/or public transport. This model is limited by temporal variability and the absence of population density. |
| Ford et al. [20] | Generalised cost model | London, United Kingdom | Walking distance, travel distance and time, vehicle operating cost, waiting time | Bus, train, trams, roads, cycling | The paper enabled the rapid characterisation of transport costs and accessibility over large spatial domains using a generalised cost model of time to travel between two nodes. The study was limited to employment accessibility to and from a node. Additionally, variability in service quality with distance or time of day or day of week cannot be grasped. |
| Alamri et al. [21] | GIS-based spatial blank spots | Melbourne, Australia | Population density, population, area of LGA | Bus, train, trams | The study used GIS-based spatial queries to identify residential mesh blocks with no access to public transport. Additionally, the variability of service quality was measured with population, density and area of LGA. However, the study did not measure the variability with the distance of LGA from the city centre. Additionally, the study was not a comparative analysis of two or more cities, rather it only considered Melbourne as a case study. |
| Ingvardson et al. [22] | Structural equation modelling (comparative) | Six European cities | network coverage, perceived costs, perceived societal and environmental importance | Bus, train | The study compared the satisfaction scores of people surveyed from six European cities factoring the different metrics for various socio-economic pools. While the study is a comparative analysis of public transport between multiple cities, it directly does not quantify accessibility baseline levels that a city/LGAs need to maintain and does not capture temporal variability. |
| Osman et al. [23] | Comparative chrono-urbanism | Two European cities | Urban time, time policies | Bus, trams | The paper compared the chrono-urbanism (breaking the barrier of long distances) with varying times of day and days of the week. While this was a comparative study of the public transport system between two cities, it did not report accessibility counts. Additionally, the methodology did not consider the smaller residential mesh blocks of the cities, rather the cities were considered in their entirety. |
| Ceder et al. [24] | Quantitative origin and destination connectivity (Comparative) | Three cities of New Zealand | Walking time, waiting time, headway, connectivity | Bus, trains, ferries | The study compared the public transport connectivity across major cities in New Zealand using attributes that influence people’s choice of public transport over other available modes. The limitation of the study was that it was restricted to the CBD areas of the city and only assessed connectivity, not accessibility. |
Disclaimer/Publisher’s Note: The statements, opinions and data contained in all publications are solely those of the individual author(s) and contributor(s) and not of MDPI and/or the editor(s). MDPI and/or the editor(s) disclaim responsibility for any injury to people or property resulting from any ideas, methods, instructions or products referred to in the content. |
© 2023 by the authors. Licensee MDPI, Basel, Switzerland. This article is an open access article distributed under the terms and conditions of the Creative Commons Attribution (CC BY) license (https://creativecommons.org/licenses/by/4.0/).
Share and Cite
MDPI and ACS Style
Biswas, A.; Adhinugraha, K.; Taniar, D. Comparative GIS Analysis of Public Transport Accessibility in Metropolitan Areas. Computers 2023, 12, 260. https://doi.org/10.3390/computers12120260
AMA Style
Biswas A, Adhinugraha K, Taniar D. Comparative GIS Analysis of Public Transport Accessibility in Metropolitan Areas. Computers. 2023; 12(12):260. https://doi.org/10.3390/computers12120260
Chicago/Turabian StyleBiswas, Arnab, Kiki Adhinugraha, and David Taniar. 2023. "Comparative GIS Analysis of Public Transport Accessibility in Metropolitan Areas" Computers 12, no. 12: 260. https://doi.org/10.3390/computers12120260
Note that from the first issue of 2016, this journal uses article numbers instead of page numbers. See further details here.