
Sports Analytics and Text Mining NBA Data to Assess Recovery from Injuries and Their Economic Impact


Abstract
:
1. Introduction
2. Data and Methods
2.1. Research Questions/Hypothesis
- Is it possible, using text mining, to distinguish patterns and relationships between references to injuries of anatomical sub-areas and changes in advanced performance indicators across different series, such as 2-game, 5-game, and 10-game series? (RQ1)
- Which types of injuries take longer for athletes to recover from before they can return to action? (RQ2)
- How do the different injury types vary in correlation with advanced basketball performance metrics? (RQ3)
- How does an injury affect the economic data of a team based on basketball analytics? (RQ4)
2.2. Methodology
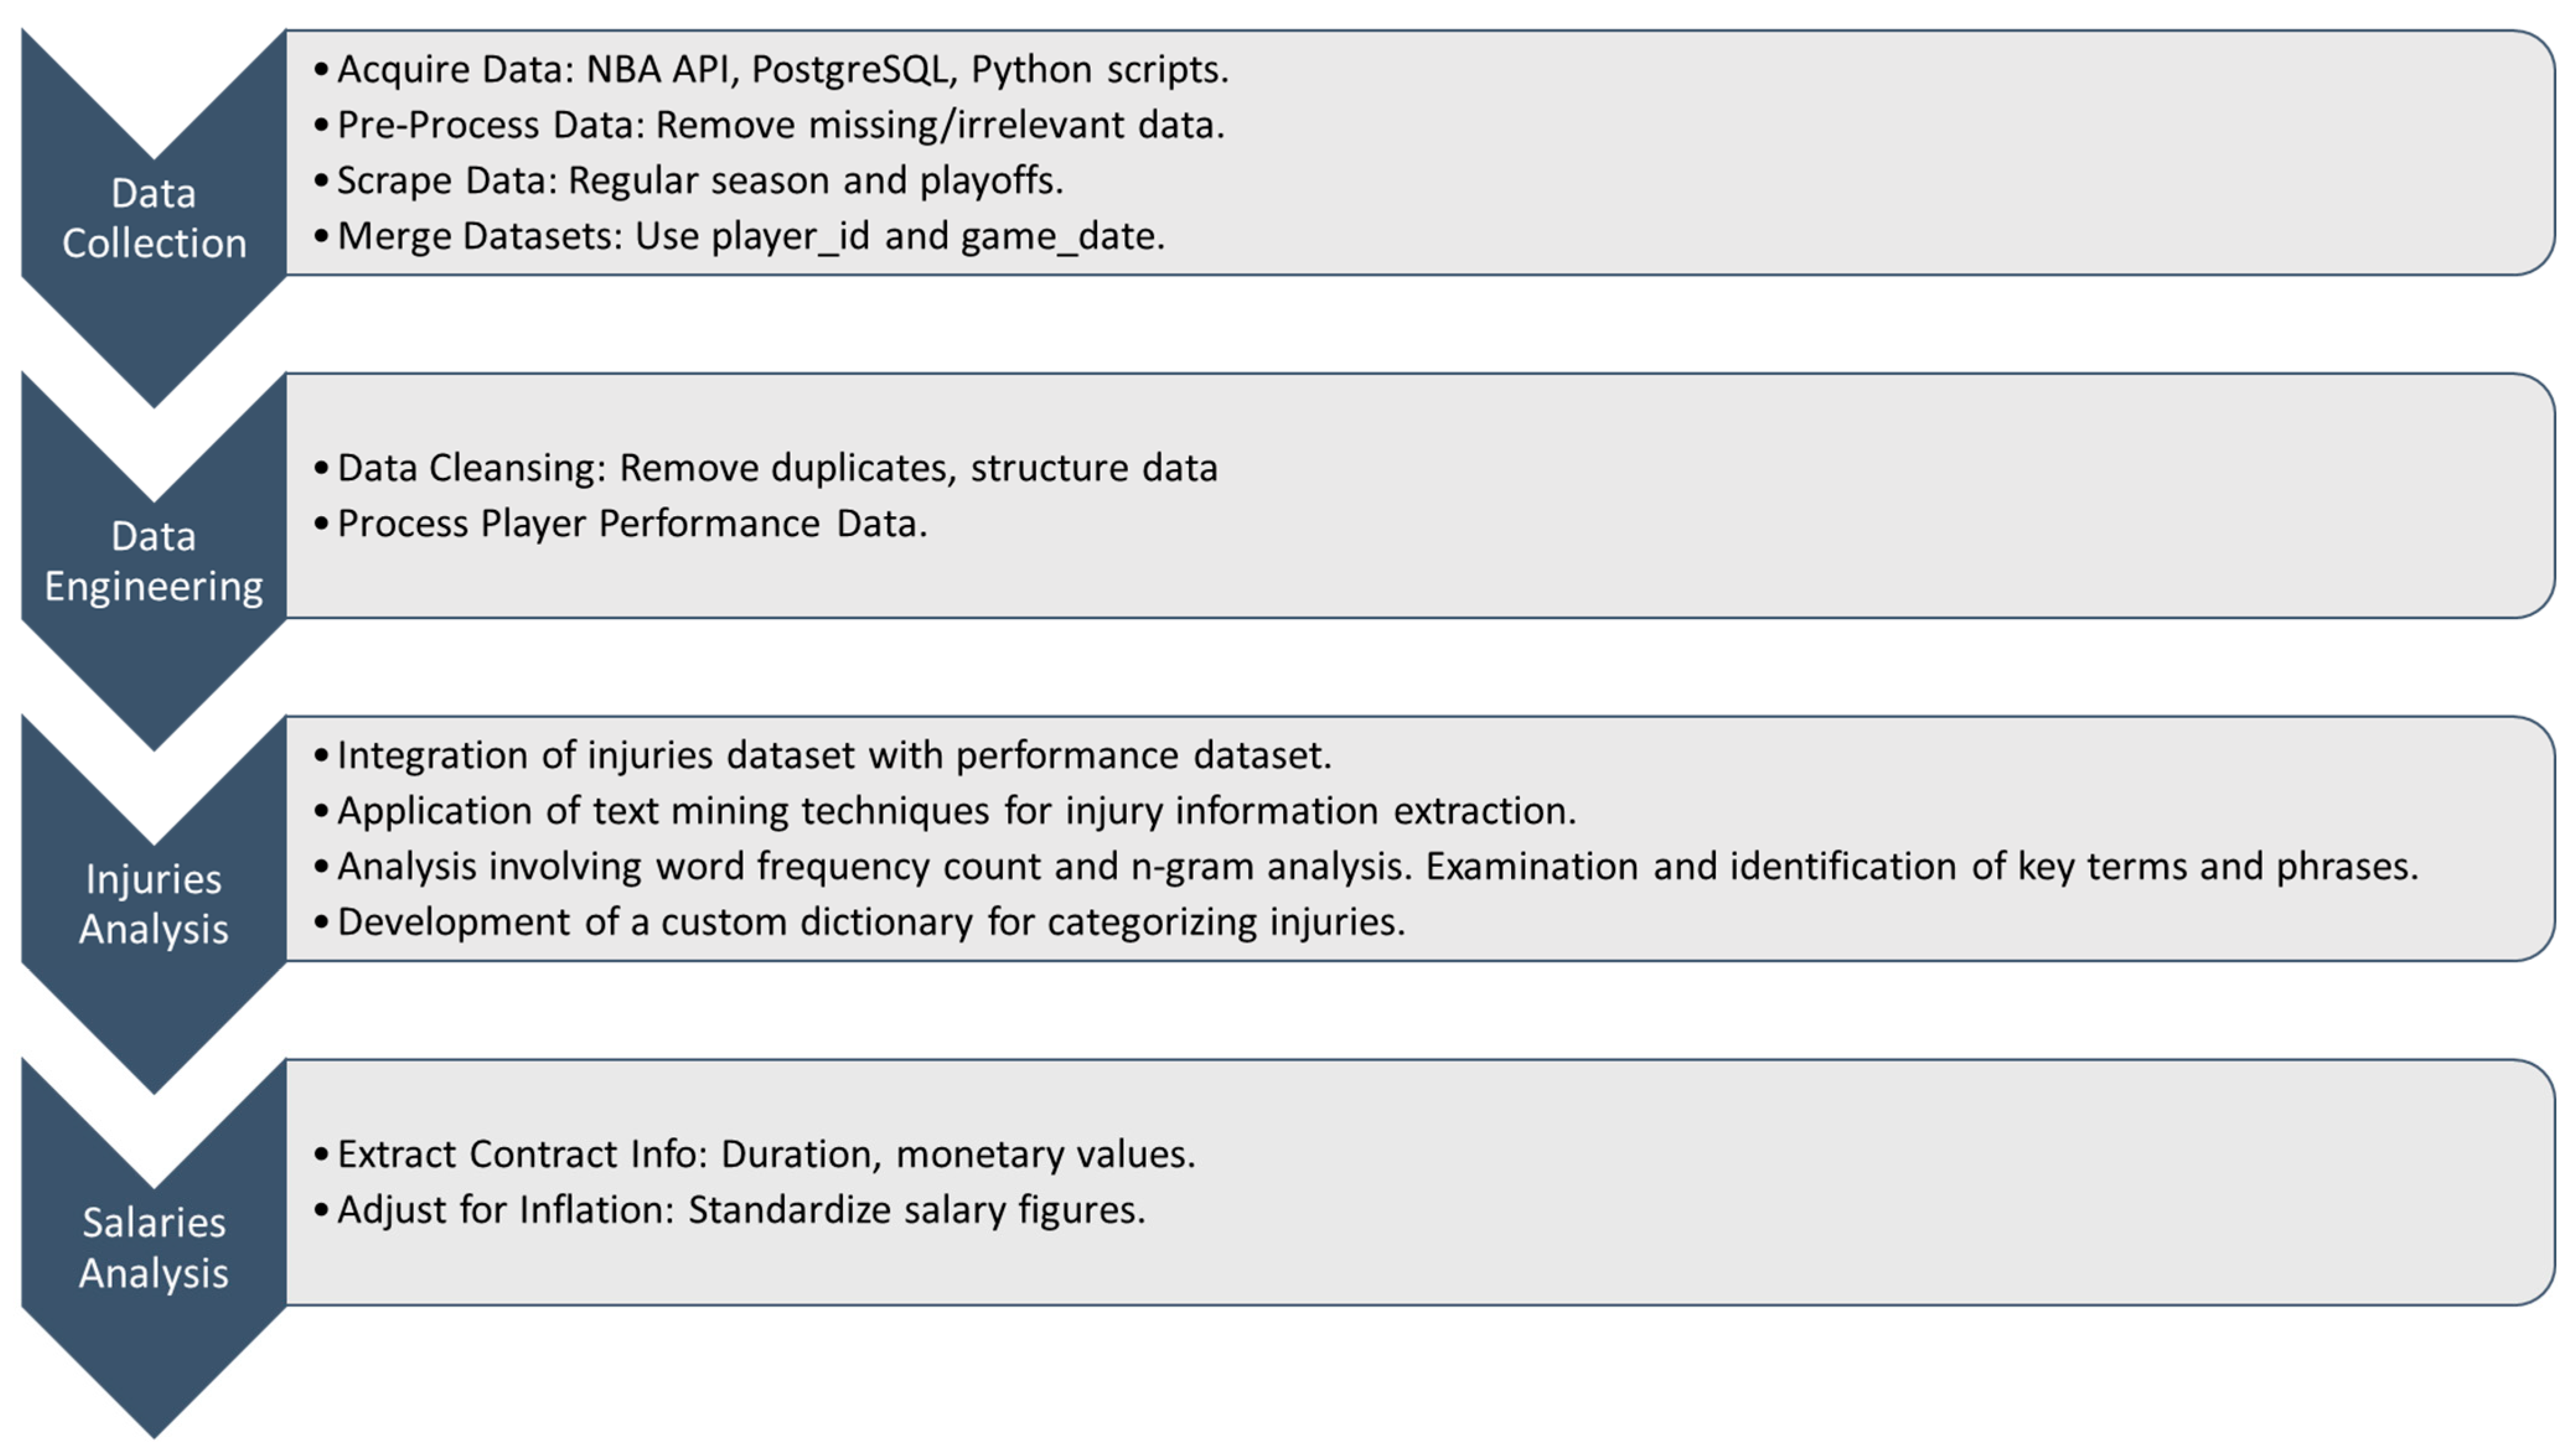
2.2.1. Data Collection
2.2.2. Data Engineering
- Preprocessing Player Performance Data
- Injuries Text Mining and Categorization (RQ1)
- Salaries-Data Transformation (RQ2)
2.2.3. Data Analysis
- Primary Data Structure
- Performance: Data with non-null game dates and performance metrics.
- Injury: Data with non-null injury dates.
- Statistical Evaluations
- Paired Sample t-test: Compared pre- and post-injury performance means were compared, providing t-statistics and p-values for each performance metric.
- Effect Size Estimation: Cohen’s D was used to measure differences between pre- and post-injury performance metrics.
- Summary of Statistics
- Unique Players: Determined the number of total unique players and those meeting the analysis criteria.
- Non-NA Records: Counted non-null data points for pre- and post-injury performance metrics.
- Injury Incidence and criteria metrics: Total injuries were calculated for those meeting specific criteria.
3. Results
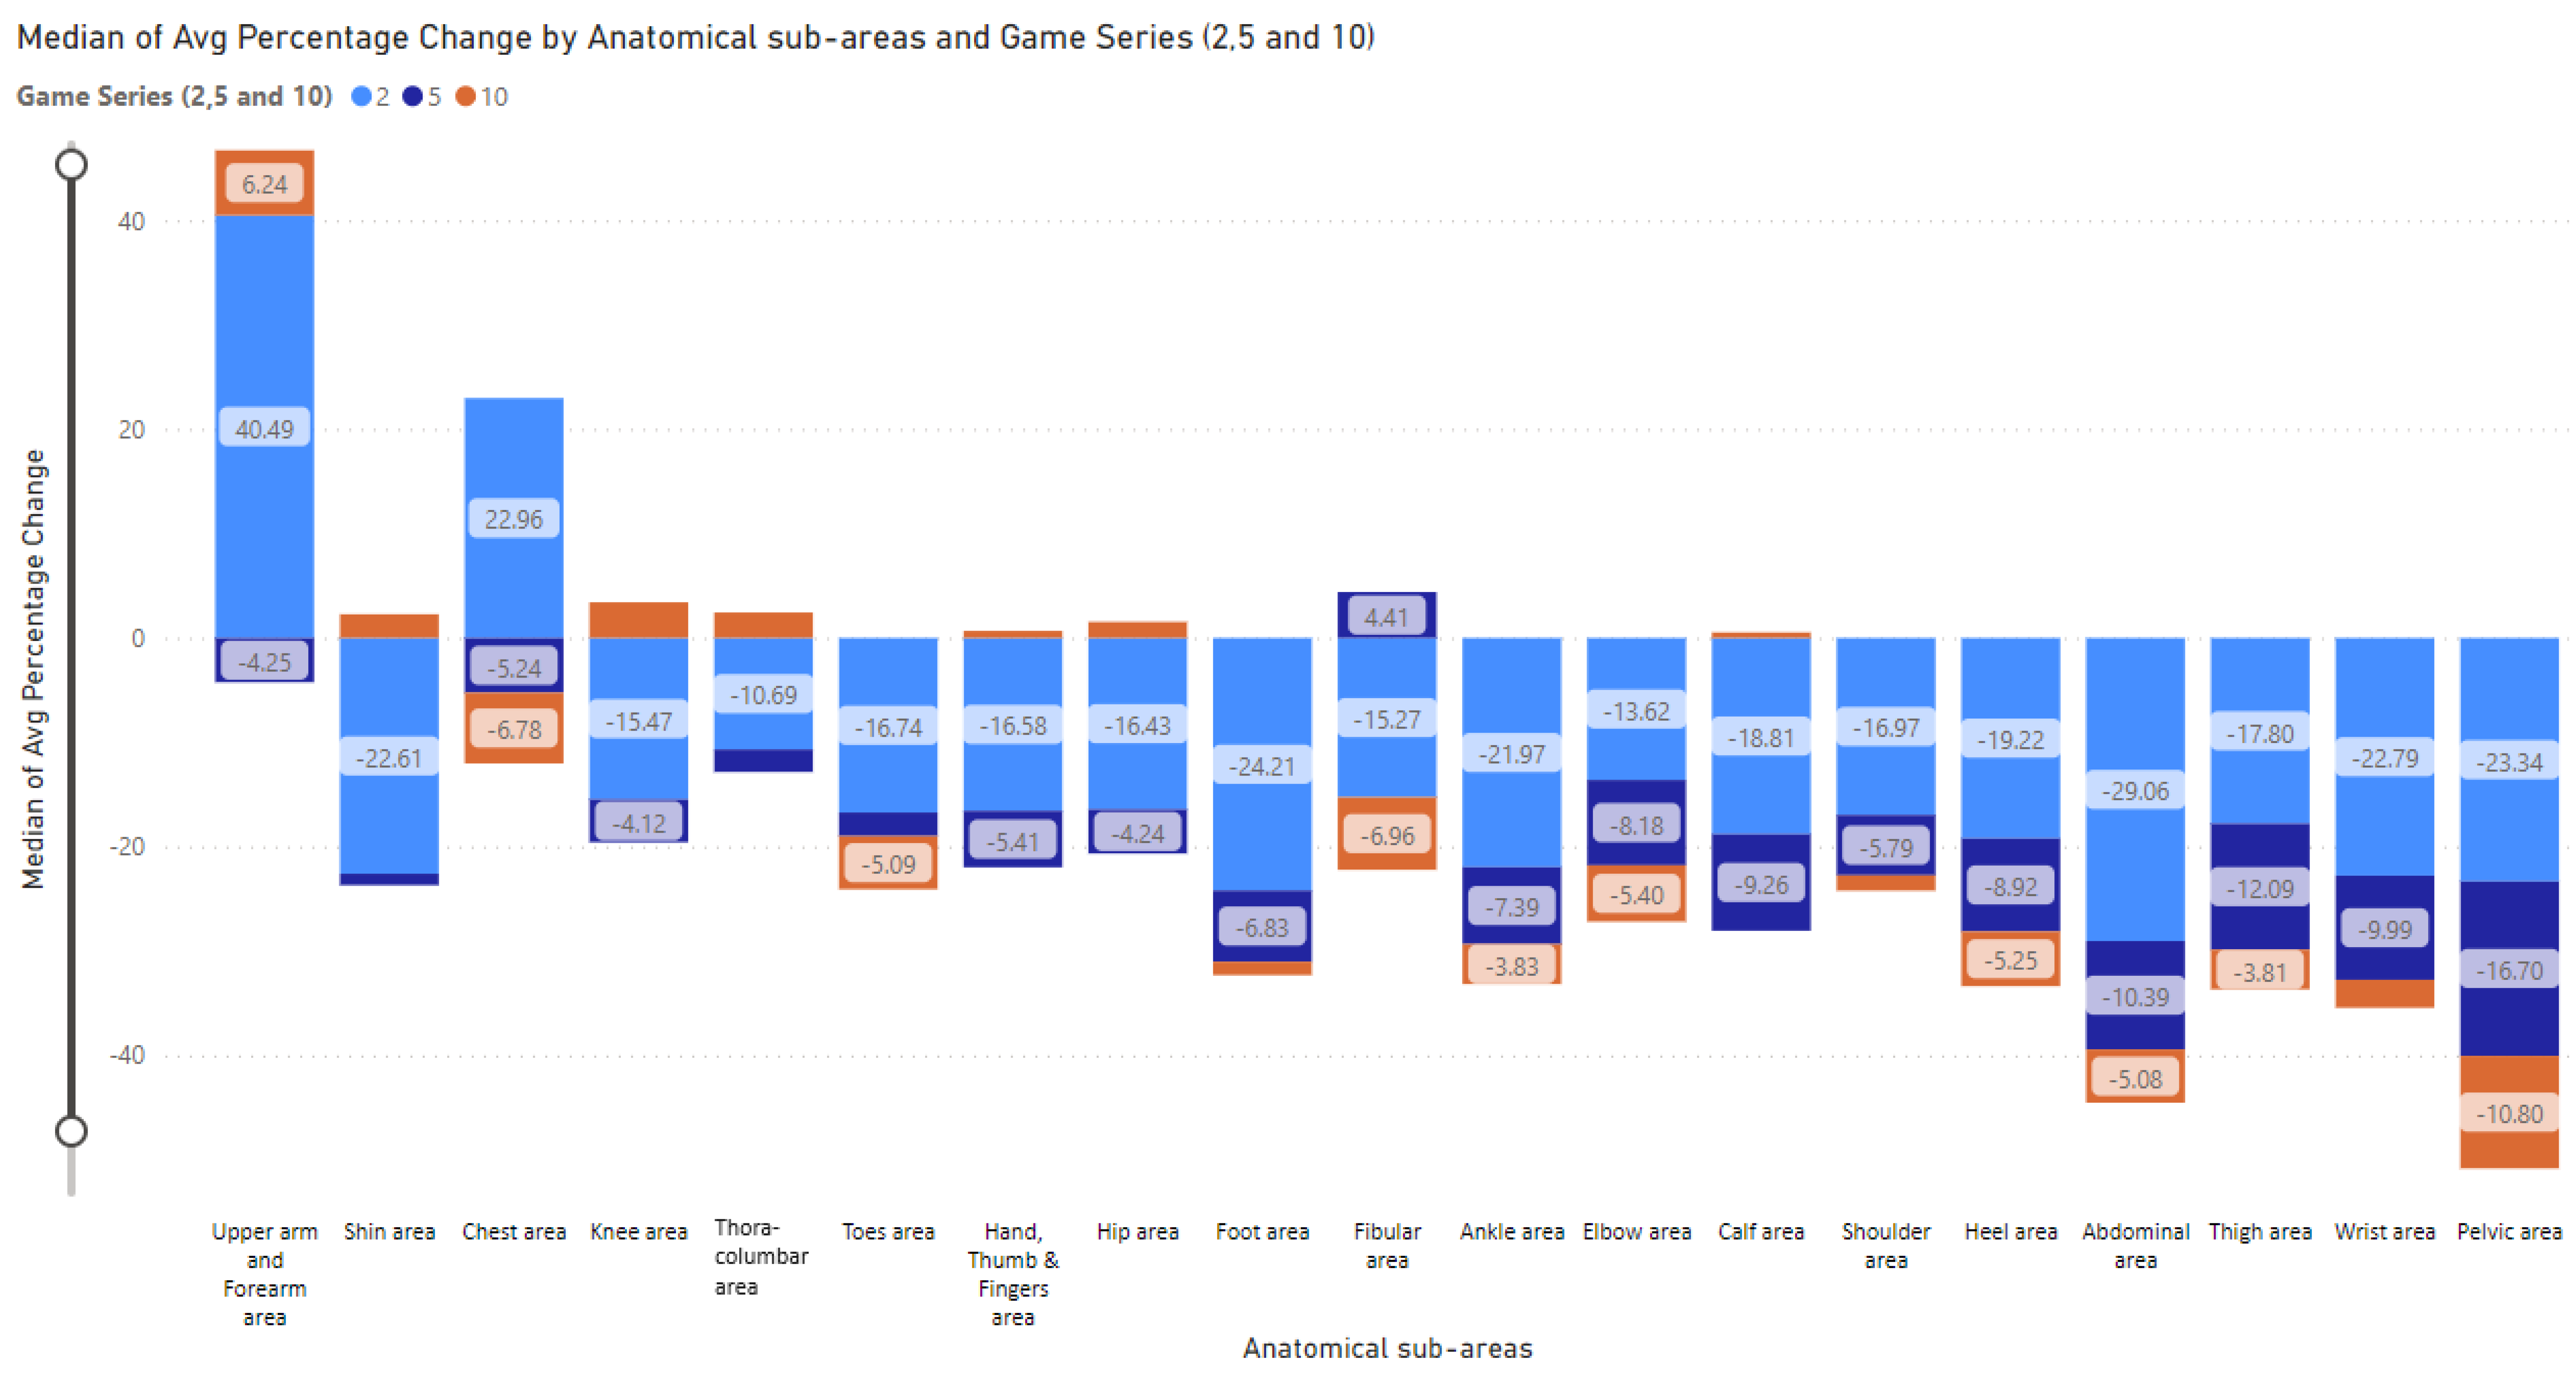
- The anatomical sub-areas that had statistically significant impacts (p-values less than 0.05) included the ankle, knee, thigh, and abdominal areas and many others, totaling 18 different areas.
- Cohen’s–D and t-statistic:
- Large Effect (>0.8): No areas with a large effect size were identified.
- Medium Effect (0.5–0.8): No areas with a medium effect size were identified.
- Small Effect (0.2–0.5): The upper arm and forearm area was the only area with a small effect size.
- Most Impacted: The abdominal area experienced the most significant average percentage change, suggesting a considerable decrease in performance metrics post-injury.
- Least Impacted: The chest area was the least impacted based on the average percentage change, indicating a less substantial decrease in performance.
- The areas of concern due to significant p-values, but smaller effect sizes included the ankle, knee, and thigh areas and several others, highlighting the need for careful consideration of both statistical significance and effect size.
- Cohen’s D and t-statistic:
- Large Effect (>0.8): No areas fell under this category.
- Medium Effect (0.5–0.8): No areas with a medium effect size were identified.
- Small Effect (0.2–0.5): No areas with a small effect size were identified.
- Percentage Change:
- Most impacted: The upper arm–forearm area was identified as the most impacted area based on the average percentage change, indicating a considerable decrease in performance post-injury.
- Least impacted: The shin area was identified as the least impacted area, suggesting a relatively small decrease in performance.
- Areas of Concern:
- Areas of concern with significant p-values but without a strong effect size included the ankle, knee, thigh, thoracolumbar, and foot areas, among others. These areas may require further attention due to this statistical significance.
- Cohen’s D and t-statistic:
- Large Effect (>0.8): No areas fell under this category.
- Medium Effect (0.5–0.8): No areas with a medium effect size were identified in the latest dataset.
- Small Effect (0.2–0.5): No areas with a small effect size are identified. This finding suggested that either the effect sizes were less than 0.2 or that the criteria for categorization may need adjustment based on the dataset specifics.
- Percentage Change:
- Most impacted: The chest area is identified as the most impacted area based on the average percentage change, suggesting a notable decrease in performance metrics post-injury.
- Least impacted: The upper arm–forearm area is identified as the least impacted area, which may suggest a relatively small change in performance.
- Areas of Concern:
- Areas of concern with significant p-values but without a corresponding large or medium effect size included the ankle, knee, thigh, thoracolumbar, and foot areas, among several others.
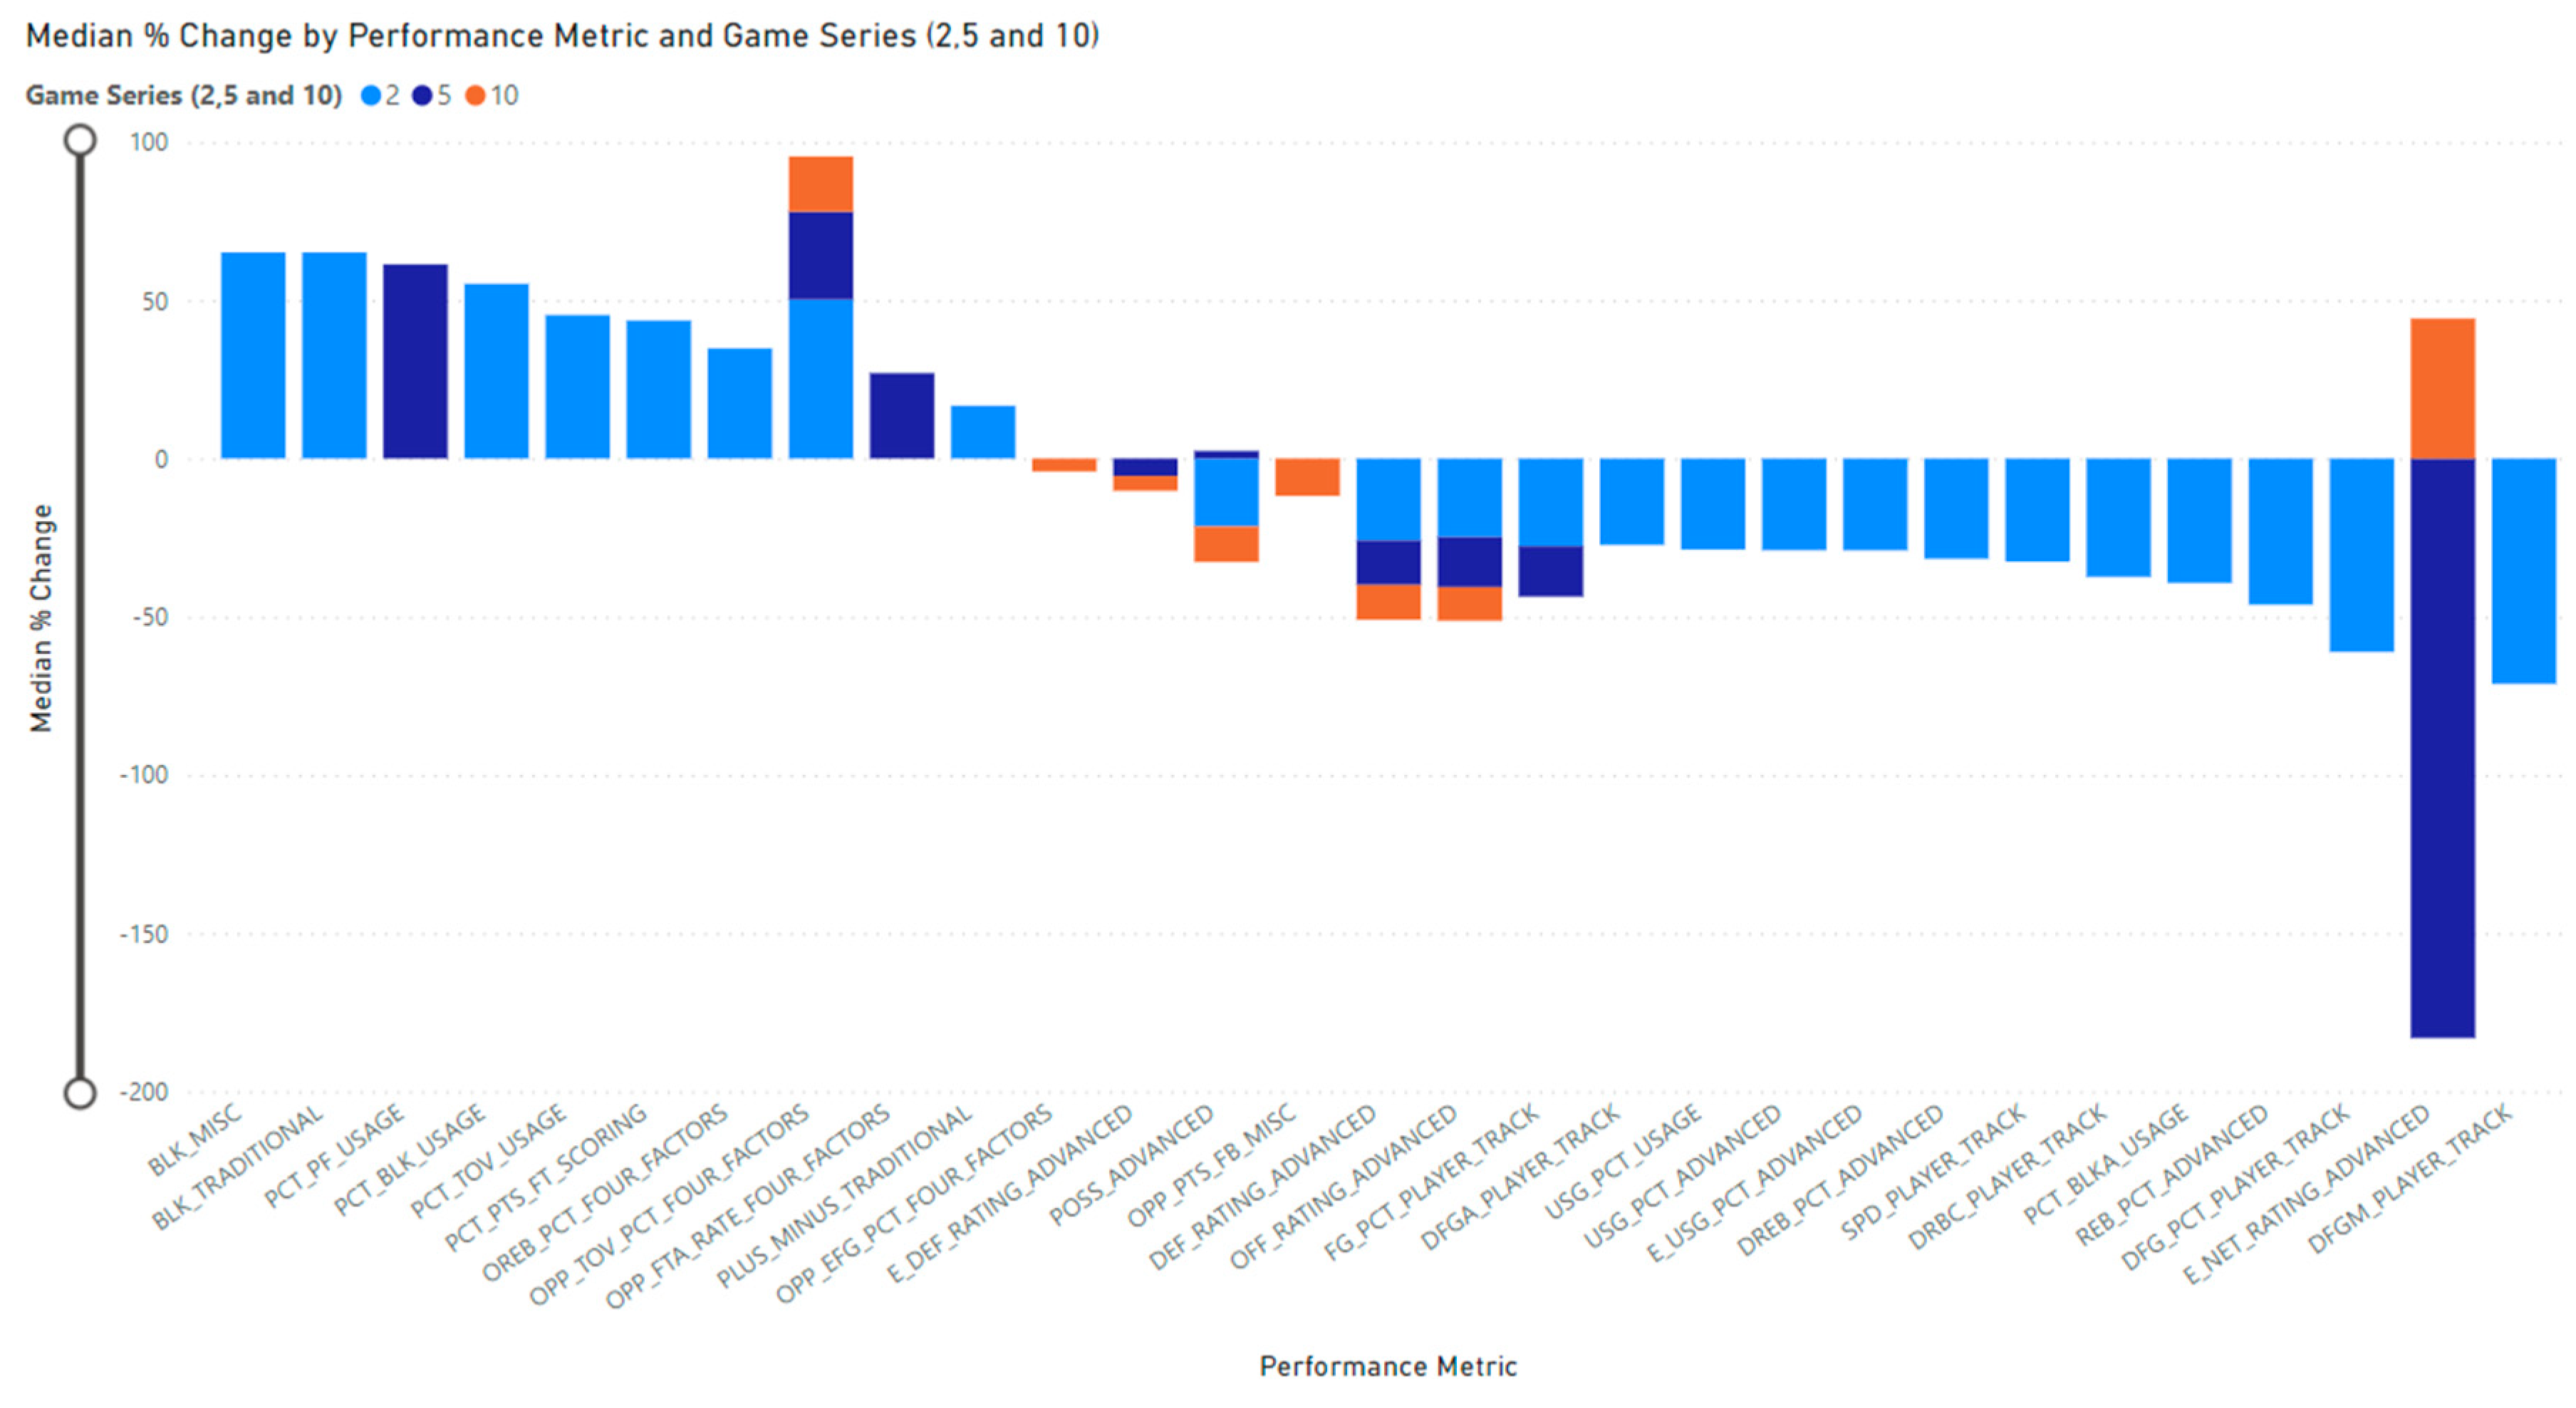
- Metrics such as POSS_ADVANCED, OFF_RATING_ADVANCED, DEF_RATING_ADVANCED, and others had average p-values less than 0.05, indicating significant impacts in these areas.
- Cohen’s D and t-statistic:
- Large Effect: No metrics displayed a large effect size (Cohen’s D > 0.8).
- Medium Effect: Metrics such as PLUS_MINUS_TRADITIONAL, PCT_BLK_USAGE, and BLK_TRADITIONAL had medium effect sizes (Cohen’s D between 0.5 and 0.8).
- Small Effect: PCT_TOV_USAGE was the only metric with a small effect size (Cohen’s D between 0.2 and 0.5).
- Percentage Change:
- Most Impacted: DFGM_PLAYER_TRACK was the metric with the most significant average percentage change, indicating a considerable decrease in performance metrics post-injury.
- Least Impacted: BLK_TRADITIONAL was the metric with the least average percentage change, suggesting a small change in performance.
- Areas of Concern: Metrics such as POSS_ADVANCED, OFF_RATING_ADVANCED, and DEF_RATING_ADVANCED had significant p-values with Cohen’s D <= 0.2, which may indicate areas of concern despite their statistical significance.
- Cohen’s D and t-statistic:
- Large Effect: None.
- Medium Effect (0.5–0.8): Metrics such as ‘OPP_FTA_RATE_FOUR_FACTORS’, ‘PCT_PF_USAGE’, ‘E_NET_RATING_ADVANCED’, and ‘OPP_TOV_PCT_FOUR_FACTORS’ fell into this category.
- Small Effect (0.2–0.5): No metrics fell into the small effect category.
- Percentage Change:
- Most impacted: ‘E_NET_RATING_ADVANCED’ was the most impacted metric, with the highest median average percentage change.
- Notably Positive: Metrics, including ‘POSS_ADVANCED’, ‘OPP_FTA_RATE_FOUR_FACTORS’, ‘PCT_PF_USAGE’, and ‘OPP_TOV_PCT_FOUR_FACTORS’ showed notably positive changes.
- Metrics of Concern: Metrics such as ‘POSS_ADVANCED’, ‘FG_PCT_PLAYER_TRACK’, ‘OFF_RATING_ADVANCED’, ‘DEF_RATING_ADVANCED’, and ‘E_DEF_RATING_ADVANCED’ were of concern due to their negative Cohen’s D values.
- Cohen’s D and t-statistic:
- Large Effect (>0.8): None.
- Medium Effect (0.5–0.8): ‘OPP_TOV_PCT_FOUR_FACTORS’ and ‘E_NET_RATING_ADVANCED’ were identified in this category.
- Small Effect (0.2–0.5): Most of the other metrics fell into this category.
- Percentage Change:
- The most impacted genes, ‘OPP_TOV_PCT_FOUR_FACTORS’ and ‘E_NET_RATING_ADVANCED’, were identified in this category.
- Notably Negative: ‘OPP_TOV_PCT_FOUR_FACTORS’ and ‘E_NET_RATING_ADVANCED’ showed notable positive changes.
- Metrics of Concern: Metrics such as ‘OPP_PTS_FB_MISC’, ‘DEF_RATING_ADVANCED’, ‘OFF_RATING_ADVANCED’, ‘E_DEF_RATING_ADVANCED’, ‘POSS_ADVANCED’, and ‘OPP_EFG_PCT_FOUR_FACTORS’ were of concern due to their negative Cohen’s D values.
4. Discussion
- For two games before/after the injury.
- Inconclusive Areas:
- Inconclusive areas, such as the ankle, knee, and thigh areas, included those with significant p-values but were not the most or least impacted.
- Notable Observations.
- The Negative Cohen’s D, many areas, including the ankle, knee, and thigh areas, had negative Cohen’s D values, suggesting a decrease in performance post-injury across these areas.
- Contrast Areas: There are no areas that had a positive average Cohen’s D but a significant p-value, which suggests that all significant areas had a negative impact on performance.
- Percentage Change Insight: Many areas showed a negative average percentage change, indicating a decrease in performance post-injury. The significant areas with a negative change in performance cover a broad range, from the ankle area to the respiratory area, suggesting widespread impacts of injuries.
- For five games before/after the injury.
- Inconclusive Areas:
- Inconclusive areas with significant p-values that were neither most nor least impacted included the ankle, knee, thigh, thoracolumbar, foot, abdominal, and other areas. These areas exhibited significant statistical findings but did not show the extremities of impact, warranting a more nuanced interpretation.
- Notable Observations.
- Negative Cohen’s D: Several areas showed a negative Cohen’s D, suggesting that injuries in these areas, such as the ankle, knee, and thigh areas and several others, generally lead to a decrease in performance post-injury.
- Percentage Change Insight: The analysis showed that most of the significant areas had a negative average percentage change, indicating a general decrease in performance post-injury across various anatomical sub-areas.
- For ten games before/after the injury.
- Inconclusive Areas:
- Inconclusive areas with significant p-values that were neither most nor least impacted included the ankle, knee, thigh, thoracolumbar, foot, abdominal, and other areas. The impact in these areas is significant but does not show extremes, which could warrant further investigation or a more detailed analysis.
- Notable Observations.
- Negative Cohen’s D: Several areas exhibited a negative Cohen’s D, indicating a general trend toward decreased performance post-injury. This includes the ankle, knee, thigh, thoracolumbar, foot, and additional areas.
- Percentage Change Insight: A range of areas showed a negative average percentage change, denoting a decrease in performance post-injury. These included the ankle, thigh, abdominal, heel, toes, elbow, chest, pelvic, and fibular areas.
- For two games before/after the injury—Basketball Performance Analytics.
- Notable Observations.
- Negative Cohen’s D: Not explicitly listed; however, metrics with a negative Cohen’s D indicate a decrease in performance post-injury.
- Percentage Change Insight: The most significant percentage change was found for DFGM_PLAYER_TRACK, with a change of −71.23%, and the least significant change was a 65.15% change for BLK_TRADITIONAL. This insight highlights the metrics that have undergone the most and least changes in terms of performance.
- For five games before/after the injury—Basketball Performance Analytics.
- Notable Observations.
- Negative Cohen’s D: A significant number of performance metrics had negative values for Cohen’s D, indicating that, on average, post-injury performance tends to be lower than pre-injury performance.
- Percentage Change Insight: ‘PCT_PF_USAGE’ stands out as the most impacted metric. The highest positive change observed was 61.32% (in ‘PCT_PF_USAGE’). The most significant negative change was −183.09% (in ‘E_NET_RATING_ADVANCED’).
- For ten games before/after the injury—Basketball Performance Analytics.
- Notable Observations.
- Negative Cohen’s D: The same metrics listed as ‘Metrics of Concern’ also feature here, indicating their potential negative impact.
- Percentage Change Insight: ‘E_NET_RATING_ADVANCED’ was the most impacted metric, with the highest positive change of 44.24%. The most significant negative change was −11.83% in ‘OPP_PTS_FB_MISC’.
- Team Performance: Longer recovery times could either indicate a more thorough recovery protocol, potentially leading to better long-term team performance, or could be a sign of more severe injuries. The data alone do not clarify this relationship.
- Economic Impact: An injury’s economic impact (sum of team losses) does not have a clear connection with recovery time. This could be due to a multitude of factors not accounted for in this dataset, such as the nature of the sport, insurance policies, revenue streams of each team, or the impact of star players’ injuries.
- Frequency of Injuries: Certain areas, such as the hand–thumb–finger and knee areas, may be more prone to injuries that are both severe and frequent, leading to longer recovery times and higher costs.
- Economic Impact: This variable is proportional to recovery time, which suggests that some injuries, even those that are less frequent or have shorter recovery times, may still incur significant costs. This could be due to factors such as the player’s position, the importance of the player to the team, or medical expenses specific to certain types of injuries.
- Implications for Player Health: Respiratory issues, while having a shorter average recovery time, have a high financial impact, possibly due to the COVID-19 pandemic’s effects, as shown by the separate listing of COVID-19 with a very high recovery time (76.44 days) and associated costs.
- Injury distribution: A greater frequency of injuries in the pelvic and fibular areas might indicate that these regions are either more vulnerable during play or that the nature of the sport involves more activities that put these areas at risk.
- Contextual Classification: The predominance of injuries in the miscellaneous category could suggest either a wide variety of other non-classifiable injuries or a potential issue with the classification system itself.
- Offensive vs. Defensive Injuries: The data might reflect the different types of stresses placed on the body during offensive and defensive plays, with certain areas being more affected by offensive maneuvers and others by defensive actions.
- Implications for Prevention and Treatment: Understanding which anatomical areas are most at risk and in which context can help in developing targeted injury prevention and rehabilitation programs.
5. Conclusions and Future Work
Author Contributions
Funding
Data Availability Statement
Conflicts of Interest
Appendix A
- Rating: Measures overall player efficiency and impact on the game. Advanced metrics that normalize performance to account for pace and playing time, such as NET_RATING_ADVANCED and PACE_PER40_ADVANCED, are included. Usage percentages such as USG_PCT highlight a player’s involvement in game plays.
- Offensive: Quantifies scoring, playmaking, and efficiency of the offense. Traditional statistics such as FGM and FGA track shot-making, whereas advanced statistics such as OFF_RATING_ADVANCED measure offensive efficiency. Scoring percentages associated with specific play types, such as PCT_PTS_2PT_SCORING or PCT_PTS_3PT_SCORING, indicate where a player or team excels in scoring.
- Defensive: Evaluates a player’s or team’s defensive effectiveness. DREB_PCT_ADVANCED could indicate a player’s ability to rebound on the defensive end. Steal-related statistics such as STL_TRADITIONAL and PCT_STL_USAGE measure defensive playmaking.
- Miscellaneous: Captures diverse aspects of the game not strictly classified as offensive or defensive. PTS_FB_MISC and PTS_PAINT_MISC provide insight into how teams score in transition and in the paint. Player-tracking data, as indicated by metrics with “_PLAYER_TRACK”, offer a detailed look into player movements and actions. PFD_MISC and SAST_PLAYER_TRACK can indicate a player’s influence on the game beyond primary scoring and assists.

| Rating | Misc | Offensive | Defensive |
|---|---|---|---|
| AST_PCT_ADVANCED: Percentage of team field goals a player assisted while on court | BLK_MISC: Miscellaneous block statistics not fitting traditional or advanced categories | AST_TRADITIONAL: Traditional count of assists made by a player. | DREB_PCT_ADVANCED: Advanced metric measuring the percentage of available defensive rebounds a player grabbed while on the court. |
| AST_RATIO_ADVANCED: Assists per 100 possessions used by a player | BLKA_MISC: Miscellaneous statistics for shots blocked by opponents | E_OFF_RATING_ADVANCED: Advanced metric evaluating a player or team’s offensive efficiency. | DEF_RATING_ADVANCED: An advanced metric that estimates a player’s overall defensive impact per 100 possessions. |
| AST_TOV_ADVANCED: Ratio of a player’s assists to turnovers | OPP_PTS_2ND_CHANCE_MISC: Points scored by opponents on second-chance opportunities | FG_PCT_TRADITIONAL: Traditional field goal percentage, measuring overall shooting success. | DREB_TRADITIONAL: Traditional count of defensive rebounds grabbed by a player. |
| E_NET_RATING_ADVANCED: Player’s net impact on team’s offensive and defensive efficiency | OPP_PTS_FB_MISC: Points scored by opponents on fast breaks | FG3_PCT_TRADITIONAL: Traditional three-point field goal percentage. | E_DEF_RATING_ADVANCED: Enhanced defensive rating, offering a more comprehensive view of a player’s defensive efficiency. |
| E_PACE_ADVANCED: Estimate of the pace at which a player plays (possessions per 48 min) | OPP_PTS_OFF_TOV_MISC: Points scored by opponents off turnovers | FG3A_TRADITIONAL: Traditional count of three-point field goal attempts by a player. | BLK_TRADITIONAL: Traditional count of shots blocked by a player. |
| E_USG_PCT_ADVANCED: Usage rate, measuring the percentage of team plays involving a player while on court | OPP_PTS_PAINT_MISC: Points scored by opponents in the paint | FG3M_TRADITIONAL: Traditional count of three-point field goals made. | REB_PCT_ADVANCED: Advanced metric measuring the percentage of total rebounds (offensive and defensive) a player grabbed while on the court. |
| EFG_PCT_ADVANCED: Effective field goal percentage, accounting for 3-point field goals | PF_MISC: Personal fouls count in miscellaneous situations | FGA_TRADITIONAL: Traditional count of total field goal attempts. | REB_TRADITIONAL: Traditional count of total rebounds (both offensive and defensive) grabbed by a player. |
| EFG_PCT_FOUR_FACTORS: Part of the ‘Four Factors’ of basketball success, measuring effective shooting efficiency | PFD_MISC: Count of personal fouls drawn in various scenarios | FGM_TRADITIONAL: Traditional count of total field goals made. | STL_TRADITIONAL: Traditional count of steals made by a player. |
| FTA_RATE_FOUR_FACTORS: Free-throw attempt rate in the context of the ‘Four Factors’ | PTS_2ND_CHANCE_MISC: Points scored on second-chance opportunities | FT_PCT_TRADITIONAL: Traditional free-throw percentage. | PCT_STL_USAGE: Percentage of a player’s steals relative to their overall on-court engagement and usage. |
| FTA_TRADITIONAL: Traditional count of a player’s free-throw attempts | PTS_FB_MISC: Points scored on fast breaks | OFF_RATING_ADVANCED: Advanced metric for assessing a player’s or team’s offensive performance per 100 possessions. | |
| FTM_TRADITIONAL: Traditional count of a player’s successful free throws | PTS_OFF_TOV_MISC: Points scored off turnovers | OREB_PCT_ADVANCED: Advanced metric measuring the percentage of available offensive rebounds a player grabbed while on the court. | |
| MIN_ADVANCED: Minutes played, an advanced metric considering various factors | PTS_PAINT_MISC: Points scored in the paint | OREB_PCT_FOUR_FACTORS: Offensive rebound percentage as part of the ‘Four Factors’ in basketball analysis. | |
| NET_RATING_ADVANCED: Team’s point differential per 100 possessions while the player is on the court | AST_PLAYER_TRACK: Assists tracked in specific player tracking scenarios | OREB_TRADITIONAL: Traditional count of offensive rebounds grabbed by a player. | |
| OPP_EFG_PCT_FOUR_FACTORS: Opponent’s effective field goal percentage, a defensive metric | CFG_PCT_PLAYER_TRACK: Player’s catch-and-shoot field goal percentage in player tracking | PCT_AST_2PM_SCORING: Percentage of two-point field goals made that were assisted. | |
| OPP_FTA_RATE_FOUR_FACTORS: Opponent’s free-throw attempt rate, indicating defensive efficiency | CFGA_PLAYER_TRACK: Player’s catch-and-shoot field goal attempts in player tracking | PCT_AST_3PM_SCORING: Percentage of three-point field goals made that were assisted. | |
| OPP_OREB_PCT_FOUR_FACTORS: Opponent’s offensive rebound percentage, a defensive metric | CFGM_PLAYER_TRACK: Player’s catch-and-shoot field goals made in player tracking | PCT_AST_FGM_SCORING: Overall percentage of field goals made that were assisted. | |
| OPP_TOV_PCT_FOUR_FACTORS: Opponent’s turnover percentage, a part of defensive metrics | DFG_PCT_PLAYER_TRACK: Player’s defense against field goal percentage in player tracking | PCT_PTS_2PT_MR_SCORING: Percentage of points scored from mid-range two-point shots. | |
| PACE_ADVANCED: The pace factor, estimating the number of possessions per 48 min | DFGA_PLAYER_TRACK: Player’s defense against field goal attempts in player tracking | PCT_PTS_2PT_SCORING: Percentage of points scored from all two-point field goals. | |
| PACE_PER40_ADVANCED: Similar to pace factor but calculated per 40 min | DFGM_PLAYER_TRACK: Player’s defense against field goals made in player tracking | PCT_PTS_3PT_SCORING: Percentage of points scored from three-point field goals. | |
| PCT_AST_USAGE: Percentage of team’s assists for which a player accounts while playing | FTAST_PLAYER_TRACK: Free-throw assists tracked in player tracking scenarios | PCT_PTS_PAINT_SCORING: Percentage of points scored in the paint. | |
| PCT_BLK_USAGE: Percentage of team’s blocks for which a player accounts while playing | ORBC_PLAYER_TRACK: Offensive rebounds captured in player tracking | PCT_UAST_2PM_SCORING: Percentage of two-point field goals made without an assist. | |
| PCT_BLKA_USAGE: Percentage of a player’s shots that are blocked by opponents | PASS_PLAYER_TRACK: Passes made tracked in player tracking scenarios | PCT_UAST_3PM_SCORING: Percentage of three-point field goals made without an assist. | |
| PCT_DREB_USAGE: Percentage of available defensive rebounds a player gets | RBC_PLAYER_TRACK: Rebounds captured in player tracking | PCT_UAST_FGM_SCORING: Overall percentage of field goals made without an assist. | |
| PCT_FG3A_USAGE: Percentage of a team’s three-point attempts taken by a player | SAST_PLAYER_TRACK: Secondary assists tracked in player-tracking scenarios | PCT_FGA_2PT_SCORING: Percentage of total field goal attempts that are two-point shots. | |
| PCT_FG3M_USAGE: Percentage of a team’s three-point makes attributed to a player | SPD_PLAYER_TRACK: Speed of the player during play, tracked in player-tracking scenarios | PCT_FGA_3PT_SCORING: Percentage of total field goal attempts that are three-point shots. | |
| PCT_FGA_USAGE: Percentage of team’s field goal attempts taken by a player | TCHS_PLAYER_TRACK: Touches of the ball by the player tracked in player tracking | PTS_TRADITIONAL: Traditional count of total points scored by a player. | |
| PCT_FGM_USAGE: Percentage of team’s field goals made by a player | UFG_PCT_PLAYER_TRACK: Player’s unguarded field goal percentage in player tracking | PCT_OREB_USAGE: Percentage of team’s offensive rebounds a player accounts for while on the court. | |
| PCT_FTA_USAGE: Percentage of team’s free-throw attempts taken by a player | UFGA_PLAYER_TRACK: Player’s unguarded field goal attempts in player tracking | PCT_PTS_USAGE: Percentage of team’s points for which a player accounts while on the court. | |
| PCT_FTM_USAGE: Percentage of team’s free throws made by a player | UFGM_PLAYER_TRACK: Player’s unguarded field goals made in player tracking | PCT_PTS_FB_SCORING: Percentage of points scored from fast breaks. | |
| PCT_REB_USAGE: Percentage of team’s total rebounds grabbed by a player | PCT_TOV_USAGE: Percentage of a player’s turnovers relative to their usage rate | PCT_PTS_FT_SCORING: Percentage of points scored from free throws. | |
| PIE_ADVANCED: Player Impact Estimate, a measure of a player’s overall statistical contribution | DIST_PLAYER_TRACK: Distance covered by the player during play, tracked in player tracking | PCT_PTS_OFF_TOV_SCORING: Percentage of points scored off turnovers. | |
| PLUS_MINUS_TRADITIONAL: The point differential when the player is on and off the court | DRBC_PLAYER_TRACK: Defensive rebounds captured in player tracking | ||
| POSS_ADVANCED: The number of possessions a player is involved in | FG_PCT_PLAYER_TRACK: Player’s overall field goal percentage in player tracking | ||
| TM_TOV_PCT_ADVANCED: Team’s turnover percentage while a player is on the court | PF_TRADITIONAL: Traditional count of personal fouls committed by a player | ||
| TM_TOV_PCT_FOUR_FACTORS: Team’s turnover percentage as a part of the ‘Four Factors’ | TO_TRADITIONAL: Traditional count of turnovers committed by a player | ||
| TS_PCT_ADVANCED: True shooting percentage, measuring shooting efficiency (including free throws) | PCT_PF_USAGE: Percentage of a player’s personal fouls relative to their usage rate | ||
| USG_PCT_ADVANCED: Usage percentage, indicating the proportion of team plays used by a player | PCT_PFD_USAGE: Percentage of a player’s personal fouls drawn relative to their usage rate | ||
| USG_PCT_USAGE: Similar to usage percentage, a measure of how involved a player is in team plays |
References
- Sarlis, V.; Tjortjis, C. Sports analytics—Evaluation of basketball players and team performance. Inf. Syst. 2020, 93, 101562. [Google Scholar] [CrossRef]
- Cohan, A.; Schuster, J.; Fernandez, J. A deep learning approach to injury forecasting in NBA basketball. J. Sports Anal. 2021, 7, 277–289. [Google Scholar] [CrossRef]
- Malamatinos, M.-C.; Vrochidou, E.; Papakostas, G.A. On Predicting Soccer Outcomes in the Greek League Using Machine Learning. Computers 2022, 11, 133. [Google Scholar] [CrossRef]
- Cortez, A.; Trigo, A.; Loureiro, N. Football Match Line-Up Prediction Based on Physiological Variables: A Machine Learning Approach. Computers 2022, 11, 40. [Google Scholar] [CrossRef]
- Bullock, G.S.; Ferguson, T.; Arundale, A.H.; Martin, C.L.; Collins, G.S.; Kluzek, S. Return to performance following severe ankle, knee, and hip injuries in National Basketball Association players. PNAS Nexus 2022, 1, pgac176. [Google Scholar] [CrossRef] [PubMed]
- Cole, B.; Arundale, A.J.H.; Bytomski, J.; Amendola, A. Basketball Sports Medicine and Science; Springer: Berlin/Heidelberg, Germany, 2020. [Google Scholar] [CrossRef]
- Mateus, N.; Esteves, P.; Gonçalves, B.; Torres, I.; Gomez, M.A.; Arede, J.; Leite, N. Clustering performance in the European Basketball according to players’ characteristics and contextual variables. Int. J. Sport. Sci. Coach. 2020, 15, 405–411. [Google Scholar] [CrossRef]
- Nakase, J.; Kitaoka, K.; Shima, Y.; Oshima, T.; Sakurai, G.; Tsuchiya, H. Risk factors for noncontact anterior cruciate ligament injury in female high school basketball and handball players: A prospective 3-year cohort study. Asia-Pacific J. Sport. Med. Arthrosc. Rehabil. Technol. 2020, 22, 34–38. [Google Scholar] [CrossRef]
- Jauhiainen, S.; Kauppi, J.-P.; Leppänen, M.; Pasanen, K.; Parkkari, J.; Vasankari, T.; Kannus, P.; Äyrämö, S. New Machine Learning Approach for Detection of Injury Risk Factors in Young Team Sport Athletes. Int. J. Sports Med. 2021, 42, 175–182. [Google Scholar] [CrossRef]
- Kaplan, S. The Economic Value of Popularity: Evidence from Superstars in the National Basketball Association. SSRN Electron. J. 2020, 50. [Google Scholar] [CrossRef]
- Sarlis, V.; Chatziilias, V.; Tjortjis, C.; Mandalidis, D. A Data Science approach analysing the Impact of Injuries on Basketball Player and Team Performance. Inf. Syst. 2021, 99, 101750. [Google Scholar] [CrossRef]
- Sikka, R.S.; Baer, M.; Raja, A.; Stuart, M.; Tompkins, M. Analytics in sports medicine: Implications and responsibilities that accompany the era of big data. J. Bone Jt. Surg. Am. 2019, 101, 276–283. [Google Scholar] [CrossRef] [PubMed]
- Marks, D.L.; Vinegoni, C.; Bredfeldt, J.S.; Boppart, S.A. Methods, systems and software programs for enhanced sports analytics and applications. Appl. Phys. Lett. 2004, 85, 5787–5789. [Google Scholar] [CrossRef]
- McKeag, D.B. Handbook of Sports Medicine and Science; CRC Press: Boca Raton, FL, USA, 2020. [Google Scholar] [CrossRef]
- Krosshaug, T.; Nakamae, A.; Boden, B.P.; Engebretsen, L.; Smith, G.; Slauterbeck, J.R.; Hewett, T.E.; Bahr, R. Mechanisms of anterior cruciate ligament injury in basketball: Video analysis of 39 cases. Am. J. Sports Med. 2007, 35, 359–367. [Google Scholar] [CrossRef] [PubMed]
- Li, B.; Xu, X. Application of Artificial Intelligence in Basketball Sport. J. Educ. Health Sport 2021, 11, 54–67. [Google Scholar] [CrossRef]
- Terner, Z.; Franks, A. Modeling player and team performance in basketball. Annu. Rev. Stat. Its Appl. 2021, 8, 1–23. [Google Scholar] [CrossRef]
- Torres-Ronda, L.; Gámez, I.; Robertson, S.; Fernández, J. Epidemiology and injury trends in the National Basketball Association: Pre- and perCOVID-19 (2017–2021). PLoS ONE 2022, 17, e0263354. [Google Scholar] [CrossRef] [PubMed]
- NVaudreuil, N.J.; van Eck, C.F.; Lombardo, S.J.; Kharrazi, F.D. Economic and Performance Impact of Anterior Cruciate Ligament Injury in National Basketball Association Players. Orthop. J. Sports Med. 2021, 9, 1–6. [Google Scholar] [CrossRef]
- Franco, D. Sports Performance Measurement and Analytics: The Science of Assessing Performance, Predicting Future Outcomes, Interpreting Statistical Models, and Evaluating the Market Value of Athletes. Pearson Education LTD. Ric. di Mat. 2007, 56, 285–296. [Google Scholar] [CrossRef]
- Nagarajan, R.; Li, L. Optimizing NBA player selection strategies based on salary and statistics analysis. In Proceedings of the 2017 IEEE 15th Intl Conf on Dependable, Autonomic and Secure Computing, 15th Intl Conf on Pervasive Intelligence and Computing, 3rd Intl Conf on Big Data Intelligence and Computing and Cyber Science and Technology Congress(DASC/PiCom/DataCom/CyberSciTech), Orlando, FL, USA, 6–10 November 2017; pp. 1076–1083. [Google Scholar] [CrossRef]
- Louw, Q.; Grimmer, K.; Vaughan, C. Knee movement patterns of injured and uninjured adolescent basketball players when landing from a jump: A case-control study. BMC Musculoskelet. Disord. 2006, 7, 22. [Google Scholar] [CrossRef]
- Neilson, V.; Ward, S.; Hume, P.; Lewis, G.; McDaid, A. Effects of augmented feedback on training jump landing tasks for ACL injury prevention: A systematic review and meta-analysis. Phys. Ther. Sport 2019, 39, 126–135. [Google Scholar] [CrossRef]
- Afara, I.O.; Sarin, J.K.; Ojanen, S.; Finnilä, M.A.J.; Herzog, W.; Saarakkala, S.; Korhonen, R.K.; Töyräs, J. Machine Learning Classification of Articular Cartilage Integrity Using Near Infrared Spectroscopy. Cell. Mol. Bioeng. 2020, 13, 219–228. [Google Scholar] [CrossRef] [PubMed]
- Aljunid, M.F.; Manjaiah, D.H. Data Management, Analytics and Innovation; Springer: Berlin/Heidelberg, Germany, 2019; Volume 808. [Google Scholar] [CrossRef]
- McClusky, M. Faster, Higher, Stronger: How Sports Science Is Creating a New Generation of Superathletes and What We Can Learn from Them; Cambridge University Press: Cambridge, UK, 2014; Available online: https://www.cambridge.org/core/product/identifier/CBO9781107415324A009/type/book_part (accessed on 15 February 2023).
- WNBA Basketball Reference. NBA Basketball Reference. 2021. Available online: https://www.basketball-reference.com/ (accessed on 20 August 2023).
- ESPN Enterprises Inc. Website—NBA Stats. ESPN NBA Stats. 2023. Available online: https://www.espn.com/nba/stats (accessed on 1 September 2023).
- NBA.com Website. NBA.com. 2023. Available online: https://stats.nba.com (accessed on 1 September 2023).
- Jansen, B.J.; Moore, K.; Carman, S. Evaluating the performance of demographic targeting using gender in sponsored search. Inf. Process. Manag. 2013, 49, 286–302. [Google Scholar] [CrossRef]
- Oliver, D. Basketball on Paper: Rules and Tools for Performance Analysis; University of Nebraska Press: Lincoln, NE, USA, 2004. [Google Scholar]
- Groll, A.; Liebl, D. Editorial special issue: Statistics in sports. AStA Adv. Stat. Anal. 2022, 107, 0123456789. [Google Scholar] [CrossRef] [PubMed]
- Investopedia. U.S. Inflation Rate by Year: 1929–2023. Available online: https://www.investopedia.com/inflation-rate-by-year-7253832 (accessed on 1 September 2023).
- CoinNews Media Group Company. US Inflation Calculator. Available online: https://www.usinflationcalculator.com/inflation/current-inflation-rates/ (accessed on 1 September 2023).
- Donoghue, O.A.; Harrison, A.J.; Coffey, N.; Hayes, K. Functional data analysis of running kinematics in Chronic Achilles tendon injury. Med. Sci. Sports Exerc. 2008, 40, 1323–1335. [Google Scholar] [CrossRef]
- Thornton, H.R.; Delaney, J.A.; Duthie, G.M.; Dascombe, B.J. Developing athlete monitoring systems in team sports: Data analysis and visualization. Int. J. Sports Physiol. Perform. 2019, 14, 698–705. [Google Scholar] [CrossRef]
- Christmann, J.; Akamphuber, M.; Müllenbach, A.L.; Güllich, A. Crunch time in the NBA—The effectiveness of different play types in the endgame of close matches in professional basketball. Int. J. Sports Sci. Coach. 2018, 13, 1090–1099. [Google Scholar] [CrossRef]


| Name | Type | # Records | # Features |
|---|---|---|---|
| Player performance statistics | Regular | 733193 | 132 |
| Player performance statistics | Playoffs | 48213 | 132 |
| Injury data | On and off game | 58151 | 4 |
| Salaries data | Per season | 15365 | 4 |
| Anatomical Sub-Areas | Avg. p-Value | Median p-Value | Avg. t-Statistic | Median t-Statistic | Avg. Cohen’s D | Median Cohen’s D | Average of Avg. Percentage Change | Median Avg. Percentage Change |
|---|---|---|---|---|---|---|---|---|
| Ankle | 1.03 × 10⁻²⁸ | 1.11 × 10−68 | 18.77 | 19.18 | −0.40 | −0.41 | −18.73 | −21.97 |
| Knee | 2.78 × 10−39 | 1.33 × 10−45 | 16.29 | 14.39 | −0.32 | −0.28 | −14.00 | −15.47 |
| Thigh | 7.85 × 10⁻²⁰ | 4.45 × 10⁻³¹ | 12.45 | 12.41 | −0.38 | −0.40 | −15.60 | −17.80 |
| Abdominal | 8.68 × 10⁻⁶ | 1.82 × 10⁻²⁸ | 10.80 | 11.68 | −0.54 | −0.58 | −28.09 | −29.06 |
| Foot | 3.67 × 10⁻¹⁷ | 4.80 × 10⁻²⁵ | 11.12 | 10.62 | −0.41 | −0.39 | −23.16 | −24.21 |
| Thoracolumbar | 5.98 × 10⁻¹⁴ | 9.26 × 10⁻²¹ | 10.53 | 9.48 | −0.30 | −0.28 | −11.32 | −10.69 |
| Hand–Thumb–Fingers | 5.73 × 10⁻⁶ | 2.67 × 10⁻¹⁸ | 8.55 | 9.03 | −0.38 | −0.40 | −14.90 | −16.58 |
| Hip | 8.72 × 10⁻¹¹ | 2.19 × 10⁻¹⁷ | 8.30 | 8.75 | −0.37 | −0.40 | −13.88 | −16.43 |
| Shoulder | 2.25 × 10⁻⁸ | 7.90 × 10⁻¹⁶ | 8.49 | 8.78 | −0.37 | −0.42 | −17.46 | −16.97 |
| Calf | 2.17 × 10⁻⁸ | 5.48 ×10⁻¹³ | 7.56 | 7.41 | −0.36 | −0.40 | −16.73 | −18.81 |
| Wrist | 5.63 × 10⁻⁵ | 4.93 × 10⁻⁸ | 6.06 | 5.58 | −0.34 | −0.26 | −9.96 | −22.79 |
| Heel | 2.97 × 10⁻⁴ | 1.78 × 10⁻⁷ | 5.69 | 5.32 | −0.32 | −0.25 | −14.11 | −19.22 |
| Elbow | 2.64 × 10⁻³ | 1.07 × 10⁻⁵ | 2.97 | 4.51 | −0.23 | −0.31 | 1.73 | −13.62 |
| Chest | 1.96 × 10⁻² | 1.47 × 10⁻² | −0.23 | −2.10 | 0.00 | 0.22 | 17.21 | 22.96 |
| Pelvic | 3.33 × 10⁻² | 2.17 × 10⁻² | 1.05 | 2.15 | −0.16 | −0.32 | −1.18 | −23.34 |
| Fibular | 3.38 × 10⁻² | 2.45 × 10⁻² | 1.63 | 2.31 | −0.28 | −0.39 | −5.57 | −15.27 |
| Shin | 3.27 × 10⁻² | 3.04 × 10⁻² | 1.10 | 2.16 | −0.17 | −0.30 | −7.61 | −22.61 |
| Upper arm–Forearm | 5.14 × 10⁻² | 5.01 × 10⁻² | −1.74 | −2.05 | 0.35 | 0.43 | 1.09 | 40.49 |
| Anatomical Sub-Areas | Avg. p-Value | Median p-Value | Avg. t-Statistic | Median t-Statistic | Avg. Cohen’s D | Median Cohen’s D | Average of Avg. % Change | Median Avg. % Change |
|---|---|---|---|---|---|---|---|---|
| Ankle | 1.78 × 10⁻³⁰ | 7.46 × 10−74 | 18.04 | 18.78 | −0.35 | −0.35 | −4.88 | −7.39 |
| Knee | 6.39 × 10⁻³³ | 6.94 × 10−52 | 16.20 | 15.43 | −0.28 | −0.26 | −1.56 | −4.12 |
| Thigh | 4.32 × 10⁻²² | 9.77 × 10⁻³⁵ | 12.73 | 12.70 | −0.35 | −0.34 | −9.91 | −12.09 |
| Thoracolumbar | 3.68 × 10⁻¹⁹ | 2.37 × 10⁻²⁵ | 11.63 | 10.93 | −0.30 | −0.28 | −3.27 | −2.16 |
| Foot | 5.60 × 10⁻¹⁵ | 3.04 × 10⁻²⁴ | 10.58 | 10.42 | −0.35 | −0.34 | −3.33 | −6.83 |
| Abdominal | 6.03 × 10⁻⁹ | 2.79 × 10⁻²⁰ | 9.48 | 9.59 | −0.42 | −0.43 | −8.54 | −10.39 |
| Shoulder | 3.15 × 10⁻⁹ | 1.49 × 10⁻¹⁹ | 8.77 | 9.36 | −0.36 | −0.36 | −4.78 | −5.79 |
| Hip | 2.30 × 10⁻¹⁰ | 4.40 × 10⁻¹⁷ | 8.37 | 8.66 | −0.35 | −0.35 | −3.70 | −4.24 |
| Calf | 8.50 × 10⁻¹¹ | 5.00 × 10⁻¹⁴ | 7.70 | 7.76 | −0.34 | −0.34 | −7.96 | −9.26 |
| Hand–Thumb–Fingers | 1.33 × 10⁻⁷ | 8.27 × 10⁻¹³ | 8.16 | 7.30 | −0.35 | −0.29 | −5.57 | −5.41 |
| Wrist | 2.60 × 10⁻⁶ | 8.93 × 10⁻¹² | 7.01 | 7.07 | −0.42 | −0.43 | −10.10 | −9.99 |
| Heel | 6.18 × 10⁻⁶ | 3.00 × 10⁻¹⁰ | 6.41 | 6.48 | −0.35 | −0.35 | −7.05 | −8.92 |
| Toes | 5.40 × 10⁻⁵ | 6.23 × 10⁻⁹ | 6.03 | 6.01 | −0.35 | −0.33 | −4.87 | −2.27 |
| Elbow | 1.68 × 10⁻⁴ | 1.51 × 10⁻⁵ | 3.87 | 4.43 | −0.28 | −0.34 | −3.50 | −8.18 |
| Chest | 2.29 × 10⁻² | 4.40 × 10⁻³ | 2.95 | 2.92 | −0.29 | −0.33 | −3.32 | −5.24 |
| Shin | 2.29 × 10⁻² | 6.91 × 10⁻³ | 1.34 | 2.44 | −0.18 | −0.27 | 4.89 | −1.10 |
| Pelvic | 3.07 × 10⁻² | 2.10 × 10⁻² | 1.89 | 2.42 | −0.26 | −0.29 | −7.34 | −16.70 |
| Upper arm–Forearm | 4.53 × 10⁻² | 4.15 × 10⁻² | 0.86 | 1.95 | −0.10 | −0.28 | −10.80 | −4.25 |
| Fibular | 4.47 × 10⁻² | 4.54 × 10⁻² | 1.69 | 2.08 | −0.28 | −0.35 | 0.90 | 4.41 |
| Anatomical Sub-Areas | Avg. p-Value | Median p-Value | Avg. t-Statistic | Median t-Statistic | Avg. Cohen’s D | Median Cohen’s D | Average of Avg. % Change | Median Avg. % Change |
|---|---|---|---|---|---|---|---|---|
| Ankle | 2.05 × 10−41 | 2.65 × 10−57 | 16.19 | 16.34 | −0.28 | −0.26 | −0.76 | −3.83 |
| Knee | 8.79 × 10−42 | 2.35 × 10−45 | 15.91 | 14.37 | −0.26 | −0.22 | 3.17 | 3.43 |
| Thigh | 1.02 × 10⁻²⁶ | 2.86 × 10⁻²⁹ | 11.94 | 11.54 | −0.31 | −0.32 | −2.42 | −3.81 |
| Thoracolumbar | 2.35 × 10⁻²⁶ | 7.47 × 10⁻²⁹ | 12.01 | 11.39 | −0.27 | −0.27 | 3.05 | 2.45 |
| Foot | 2.34 × 10⁻¹⁵ | 6.41 × 10⁻²⁴ | 10.49 | 10.36 | −0.31 | −0.31 | 1.18 | −1.29 |
| Abdominal | 7.17 × 10⁻⁹ | 6.73 × 10⁻¹⁸ | 8.83 | 9.02 | −0.35 | −0.36 | −3.63 | −5.08 |
| Shoulder | 5.64 × 10⁻¹⁴ | 5.82 × 10⁻¹⁴ | 7.84 | 7.69 | −0.29 | −0.27 | 0.57 | −1.47 |
| Hip | 3.97 × 10⁻¹¹ | 1.52 × 10⁻¹³ | 7.58 | 7.56 | −0.29 | −0.27 | 5.20 | 1.55 |
| Calf | 3.12 × 10⁻¹⁰ | 1.17 × 10⁻¹¹ | 7.19 | 6.95 | −0.29 | −0.25 | 0.57 | 0.54 |
| Heel | 2.07 × 10⁻⁷ | 8.96 × 10⁻¹¹ | 6.85 | 6.69 | −0.33 | −0.33 | −5.43 | −5.25 |
| Hand–Thumb–Fingers | 1.10 × 10⁻⁸ | 3.50 × 10⁻¹⁰ | 7.11 | 6.67 | −0.28 | −0.26 | 1.49 | 0.68 |
| Wrist | 3.40 × 10⁻⁵ | 1.43 × 10⁻⁹ | 5.67 | 6.23 | −0.33 | −0.35 | 1.49 | −2.68 |
| Toes | 1.33 × 10⁻⁵ | 4.26 × 10⁻⁸ | 5.72 | 5.76 | −0.30 | −0.27 | −4.02 | −5.09 |
| Elbow | 2.19 × 10⁻³ | 2.15 × 10⁻⁶ | 4.04 | 4.87 | −0.26 | −0.28 | −1.98 | −5.40 |
| Chest | 1.87 × 10⁻² | 1.02 × 10⁻³ | 3.16 | 3.49 | −0.32 | −0.31 | −49.15 | −6.78 |
| Pelvic | 2.30 × 10⁻² | 1.39 × 10⁻² | 2.36 | 2.60 | −0.26 | −0.25 | −8.06 | −10.80 |
| Fibular | 3.22 × 10⁻² | 2.22 × 10⁻² | 2.37 | 2.42 | −0.34 | −0.36 | −5.66 | −6.96 |
| Shin | 3.13 × 10⁻² | 3.25 × 10⁻² | 2.22 | 2.18 | −0.24 | −0.23 | 4.53 | 2.28 |
| Upper arm–Forearm | 4.17 × 10⁻² | 4.12 × 10⁻² | 0.87 | 1.98 | −0.11 | −0.27 | 7.94 | 6.24 |
| Performance Metric | Median p-Value | Avg. p-Value | Avg. t-Statistic | Median t-Statistic | Median Cohen’s D | Avg. Cohen’s D | Median Avg. % Change | Average of Avg. % Change |
|---|---|---|---|---|---|---|---|---|
| POSS_ADVANCED | 4.24 × 10⁻³² | 4.24 ×10⁻³² | 12.55 | 12.55 | −0.53 | −0.53 | 2.40 | 2.40 |
| FG_PCT_PLAYER_TRACK | 1.51 × 10⁻¹⁴ | 1.51 × 10⁻¹⁴ | 8.05 | 8.05 | −0.54 | −0.54 | −15.97 | −15.97 |
| OFF_RATING_ADVANCED | 2.32 × 10⁻⁷ | 3.00 × 10⁻⁴ | 7.13 | 6.82 | −0.61 | −0.62 | −15.85 | −15.51 |
| DEF_RATING_ADVANCED | 7.02 × 10⁻¹⁰ | 6.34 × 10⁻⁴ | 7.01 | 7.09 | −0.58 | −0.59 | −14.09 | −15.22 |
| E_DEF_RATING_ADVANCED | 1.04 × 10⁻² | 1.04 × 10⁻² | 2.79 | 2.79 | −0.66 | −0.66 | −5.49 | −5.49 |
| OPP_FTA_RATE_FOUR_FACTORS | 3.56 × 10⁻² | 3.56 × 10⁻² | −2.24 | −2.24 | 0.55 | 0.55 | 27.00 | 27.00 |
| PCT_PF_USAGE | 4.10 × 10⁻² | 4.10 × 10⁻² | −2.18 | −2.18 | 0.61 | 0.61 | 61.32 | 61.32 |
| E_NET_RATING_ADVANCED | 4.15 × 10⁻² | 4.15 × 10⁻² | −2.16 | −2.16 | 0.60 | 0.60 | −183.09 | −183.09 |
| OPP_TOV_PCT_FOUR_FACTORS | 4.95 × 10⁻² | 4.95 ×10⁻² | −2.07 | −2.07 | 0.65 | 0.65 | 27.79 | 27.79 |
| Performance Metric | Median p-Value | Avg. p-Value | Avg. t-Statistic | Median t-Statistic | Median Cohen’s D | Avg. Cohen’s D | Median Avg. % Change | Average of Avg. % Change |
|---|---|---|---|---|---|---|---|---|
| POSS_ADVANCED | 4.24 × 10⁻³² | 4.24 × 10⁻³² | 12.55 | 12.55 | −0.53 | −0.53 | 2.40 | 2.40 |
| FG_PCT_PLAYER_TRACK | 1.51 × 10⁻¹⁴ | 1.51 × 10⁻¹⁴ | 8.05 | 8.05 | −0.54 | −0.54 | −15.97 | −15.97 |
| OFF_RATING_ADVANCED | 2.32 × 10⁻⁷ | 3.00 × 10⁻⁴ | 7.13 | 6.82 | −0.61 | −0.62 | −15.85 | −15.51 |
| DEF_RATING_ADVANCED | 7.02 × 10⁻¹⁰ | 6.34 ×10⁻⁴ | 7.01 | 7.09 | −0.58 | −0.59 | −14.09 | −15.22 |
| E_DEF_RATING_ADVANCED | 1.04 × 10⁻² | 1.04 × 10⁻² | 2.79 | 2.79 | −0.66 | −0.66 | −5.49 | −5.49 |
| OPP_FTA_RATE_FOUR_FACTORS | 3.56 × 10⁻² | 3.56 × 10⁻² | −2.24 | −2.24 | 0.55 | 0.55 | 27.00 | 27.00 |
| PCT_PF_USAGE | 4.10 × 10⁻² | 4.10 × 10⁻² | −2.18 | −2.18 | 0.61 | 0.61 | 61.32 | 61.32 |
| E_NET_RATING_ADVANCED | 4.15 × 10⁻² | 4.15 × 10⁻² | −2.16 | −2.16 | 0.60 | 0.60 | −183.09 | −183.09 |
| OPP_TOV_PCT_FOUR_FACTORS | 4.95 × 10⁻² | 4.95 × 10⁻² | −2.07 | −2.07 | 0.65 | 0.65 | 27.79 | 27.79 |
| Performance Metric | Median p-Value | Avg. p-Value | Avg. t-Statistic | Median t-Statistic | Median Cohen’s D | Avg. Cohen’s D | Median Avg. % Change | Average of Avg. % Change |
|---|---|---|---|---|---|---|---|---|
| OPP_PTS_FB_MISC | 0.0005 | 0.0005 | 3.965 | 3.965 | −0.650 | −0.650 | −11.830 | −11.830 |
| DEF_RATING_ADVANCED | 0.0037 | 0.0034 | 5.640 | 3.111 | −0.603 | −0.647 | −11.010 | −11.610 |
| OFF_RATING_ADVANCED | 0.0051 | 0.0051 | 2.990 | 2.990 | −0.538 | −0.538 | −10.590 | −10.590 |
| E_DEF_RATING_ADVANCED | 0.0051 | 0.0051 | 3.092 | 3.092 | −0.706 | −0.706 | −4.710 | −4.710 |
| POSS_ADVANCED | 0.0091 | 0.0091 | 2.853 | 2.853 | −0.543 | −0.543 | −11.230 | −11.230 |
| OPP_EFG_PCT_FOUR_FACTORS | 0.0247 | 0.0247 | 2.404 | 2.404 | −0.526 | −0.526 | −4.090 | −4.090 |
| OPP_TOV_PCT_FOUR_FACTORS | 0.0264 | 0.0264 | −2.372 | −2.372 | 0.697 | 0.697 | 17.440 | 17.440 |
| E_NET_RATING_ADVANCED | 0.0446 | 0.0446 | −2.125 | −2.125 | 0.616 | 0.616 | 44.240 | 44.240 |
| Teams | Average Recovery Time (2000–2023) | Sum of Losses (2000–2023) |
|---|---|---|
| GSW | 38.33 | USD 980,043,613.6 |
| DEN | 33.96 | USD 898,608,370.5 |
| WAS | 42.38 | USD 896,393,189.0 |
| CLE | 38.91 | USD 884,262,820.6 |
| NYK | 43.09 | USD 882,353,294.8 |
| NOH–NOK –NOP 1 | 47.13 | USD 850,911,070.3 |
| HOU | 35.51 | USD 831,909,820.5 |
| LAL | 43.89 | USD 829,088,874.5 |
| MEM–VAN 2 | 37.27 | USD 818,408,844.2 |
| MIL | 33.00 | USD 803,077,829.5 |
| BKN–NJN 3 | 35.94 | USD 787,297,893.7 |
| POR | 42.67 | USD 725,597,473.1 |
| TOR | 37.21 | USD 719,025,631.9 |
| DAL | 31.81 | USD 717,319,559.4 |
| IND | 28.26 | USD 707,021,308.5 |
| MIA | 27.46 | USD 696,390,943.7 |
| MIN | 39.37 | USD 687,081,943.9 |
| CHA–CHH 4 | 40.73 | USD 672,569,410.7 |
| LAC | 32.64 | USD 669,659,380.7 |
| ORL | 34.44 | USD 650,059,655.1 |
| PHI | 29.59 | USD 633,630,120.4 |
| ATL | 35.52 | USD 629,062,649.4 |
| CHI | 41.94 | USD 620,958,846.2 |
| SAC | 37.62 | USD 593,901,503.1 |
| PHX | 37.92 | USD 553,901,960.3 |
| UTA | 32.62 | USD 552,960,349.6 |
| DET | 33.35 | USD 494,764,653.5 |
| SAS | 21.36 | USD 484,022,964.1 |
| BOS | 37.31 | USD 470,742,686.1 |
| OKC and SEA | 29.40 | USD 467,801,724.6 |
| Grand Total | 35.98 | USD 21,208,828,385.5 |
| Anatomical Sub-Areas | Avg. Recovery Time | Sum of Team Losses |
|---|---|---|
| Knee | 44.47 | USD 4,223,672,393.1 |
| Unclassified | 30.32 | USD 3,923,783,660.9 |
| Ankle | 32.67 | USD 2,509,238,498.5 |
| Thigh | 33.75 | USD 1,544,221,395.7 |
| Thoracolumbar | 30.02 | USD 1,345,058,412.9 |
| Foot | 43.91 | USD 1,216,344,145.1 |
| Hand–Thumb–Fingers | 51.29 | USD 1,025,316,589.5 |
| Heel | 45.94 | USD 718,869,461.3 |
| Shoulder | 47.04 | USD 691,206,599.1 |
| Abdominal | 35.21 | USD 630,757,817.8 |
| Calf | 36.75 | USD 595,174,649.9 |
| Hip | 28.63 | USD 480,523,199.1 |
| Wrist | 46.31 | USD 412,959,249.0 |
| Cranial | 32.92 | USD 269,506,780.6 |
| Toes | 40.45 | USD 225,354,084.5 |
| Elbow | 48.64 | USD 220,358,271.9 |
| Rest | 11.59 | USD 190,999,755.3 |
| Other facial areas | 64.23 | USD 143,326,062.1 |
| Neck | 20.94 | USD 138,930,281.6 |
| Shin | 44.00 | USD 115,452,588.8 |
| Digestive | 13.02 | USD 107,701,146.1 |
| Mouth | 25.98 | USD 90,712,536.9 |
| Eye | 36.47 | USD 79,136,024.3 |
| Fibular | 75.04 | USD 64,233,781.7 |
| Nose | 21.17 | USD 54,995,090.5 |
| Pelvic | 30.78 | USD 53,377,027.9 |
| Chest | 16.39 | USD 42,115,533.9 |
| COVID-19-related | 76.44 | USD 32,549,095.0 |
| Upper arm–Forearm | 43.45 | USD 32,083,939.4 |
| Respiratory | 19.80 | USD 30,870,312.7 |
| USD 21,208,828,385.1 |
| Anatomical Sub-Areas (2d) | Rating | Misc | Offensive | Defensive | Grand Total |
|---|---|---|---|---|---|
| Abdominal | 4 | 1 | 1 | 2 | 8 |
| Ankle | 1 | 1 | 2 | ||
| Calf | 1 | 1 | 2 | ||
| Chest | 1 | 1 | 2 | ||
| COVID-19-related | 4 | 2 | 1 | 2 | 9 |
| Cranial | 1 | 1 | 2 | ||
| Elbow | 1 | 1 | |||
| Eye | 1 | 1 | |||
| Fibular | 3 | 1 | 4 | ||
| Foot | 1 | 1 | |||
| Hand–Thumb–Fingers | 1 | 1 | 2 | ||
| Heel | 1 | 1 | 2 | ||
| Hip | 1 | 1 | 2 | ||
| Mouth | 2 | 2 | |||
| Pelvic | 4 | 3 | 1 | 3 | 11 |
| Shin | 1 | 1 | 2 | ||
| Shoulder | 1 | 1 | 2 | ||
| Thigh | 1 | 1 | 2 | ||
| Toes | 1 | 1 | |||
| Upper arm–Forearm | 1 | 1 | 1 | 3 | |
| Wrist | 4 | 1 | 1 | 1 | 7 |
| Grand Total | 20 | 8 | 16 | 24 | 68 |
| Anatomical Sub-Areas (5d) | Rating | Misc | Offensive | Defensive | Grand Total |
|---|---|---|---|---|---|
| Abdominal | 1 | 1 | 1 | 3 | |
| Chest | 1 | 1 | 2 | ||
| COVID-19-related | 1 | 1 | 2 | ||
| Elbow | 1 | 1 | |||
| Hand–Thumb–Fingers | 1 | 1 | |||
| Heel | 1 | 1 | |||
| Other facial areas | 1 | 1 | |||
| Pelvic | 1 | 1 | 2 | ||
| Toes | 1 | 1 | |||
| Upper arm–Forearm | 3 | 2 | 5 | ||
| Wrist | 1 | 1 | 1 | 3 | |
| Grand Total | 5 | 2 | 4 | 11 | 22 |
| Anatomical Sub-Areas (10d) | Rating | Offensive | Misc | Defensive | Grand Total |
|---|---|---|---|---|---|
| Upper arm–Forearm | 4 | 2 | 6 | ||
| Fibular | 1 | 1 | 2 | ||
| Abdominal | 1 | 1 | |||
| Pelvic | 1 | 1 | 2 | ||
| Grand Total | 5 | 1 | 1 | 4 | 11 |
| Metrics-Dimensions | 2 Games | 5 Games | 10 Games |
|---|---|---|---|
| Areas with Significant Impact on Concern | Abdominal, Foot, Pelvic | Pelvic, Thigh, Abdominal | Pelvic, Chest, Ankle |
| % Change | Most Impacted: Abdominal area (−29.06%); Least Impacted: Upper Forearm area (40.49%) | Most Impacted: Pelvic area (−16.70%); Least Impacted: Fibular area (4.41%) | Most Impacted: Pelvic area (−10.80%); Least Impacted: Upper arm–Forearm area (6.24%) |
| Metric/Dimension | 2 Games | 5 Games | 10 Games |
|---|---|---|---|
| Significant Impact | All metrics have p-values below 0.05 | All metrics have p-values below 0.05 | All metrics have p-values below 0.05 |
| Cohen’s D | PCT_TOV_USAGE, PLUS_MINUS_TRADITIONAL, PCT_BLK_USAGE, BLK_TRADITIONAL, BLK_MISC, PCT_PTS_FT_SCORING, OPP_TOV_PCT_FOUR_FACTORS, OREB_PCT_FOUR_FACTORS | OPP_FTA_RATE_FOUR_FACTORS, PCT_PF_USAGE, E_NET_RATING_ADVANCED, OPP_TOV_PCT_FOUR_FACTORS | OPP_TOV_PCT_FOUR_FACTORS, E_NET_RATING_ADVANCED |
| % Change | Most impacted: +65.15% in BLK_TRADITIONAL; Least impacted: −71.23% in DFGM_PLAYER_TRACK | Most impacted: +61.32% in PCT_PF_USAGE; Least impacted: −183.09% in E_NET_RATING_ADVANCED | Most impacted: +44.24% in E_NET_RATING_ADVANCED; Least impacted: −11.83% in OPP_PTS_FB_MISC |
| Areas of Concern | DEF_RATING_ADVANCED with the highest average % decline | DEF_RATING_ADVANCED showing a continued decline | Multiple metrics with both positive and negative changes; care needed in interpretation |
| Aspect | Two-Game Series | Five-Game Series | Ten-Game Series |
|---|---|---|---|
| Injury Prone Areas | Pelvic and wrist areas had notable injury incidences. | Shift in high incidence of injuries to the upper arm–forearm area. | Upper arm–forearm area remained most prone to injuries. |
| Play Type Risks | Defensive plays associated with the highest number of injuries. | Defensive injuries continued to be significant, reflective of the physical demands of the sport. | Defensive play injuries persisted, emphasizing the need for focused preventative strategies. |
| Injury Ratings | Some injuries rated, but without a high severity in any specific area. | Ratings not extensively reported, suggesting a need for more detailed injury impact assessments. | Ratings more prevalent, especially in the upper arm–forearm area, indicating higher risk. |
Disclaimer/Publisher’s Note: The statements, opinions and data contained in all publications are solely those of the individual author(s) and contributor(s) and not of MDPI and/or the editor(s). MDPI and/or the editor(s) disclaim responsibility for any injury to people or property resulting from any ideas, methods, instructions or products referred to in the content. |
© 2023 by the authors. Licensee MDPI, Basel, Switzerland. This article is an open access article distributed under the terms and conditions of the Creative Commons Attribution (CC BY) license (https://creativecommons.org/licenses/by/4.0/).
Share and Cite
Sarlis, V.; Papageorgiou, G.; Tjortjis, C. Sports Analytics and Text Mining NBA Data to Assess Recovery from Injuries and Their Economic Impact. Computers 2023, 12, 261. https://doi.org/10.3390/computers12120261
Sarlis V, Papageorgiou G, Tjortjis C. Sports Analytics and Text Mining NBA Data to Assess Recovery from Injuries and Their Economic Impact. Computers. 2023; 12(12):261. https://doi.org/10.3390/computers12120261
Chicago/Turabian StyleSarlis, Vangelis, George Papageorgiou, and Christos Tjortjis. 2023. "Sports Analytics and Text Mining NBA Data to Assess Recovery from Injuries and Their Economic Impact" Computers 12, no. 12: 261. https://doi.org/10.3390/computers12120261
APA StyleSarlis, V., Papageorgiou, G., & Tjortjis, C. (2023). Sports Analytics and Text Mining NBA Data to Assess Recovery from Injuries and Their Economic Impact. Computers, 12(12), 261. https://doi.org/10.3390/computers12120261