1. Introduction
Home automation systems and networks aim to facilitate communication between devices by integrating technologies that accommodate automated procedures. The many applications of home automation networks leverage network technologies, sensors, controllers and devices to establish systems of interconnected devices and networks, e.g., security systems, home appliances, energy management systems and multiple similar architectures [
1]. According to Sovacool and Del [
2], home automation technologies offer many benefits that are related to finance, healthcare, security, education and entertainment, thus affecting several aspects of both daily life and industrial services. From the user perspective, the main perceptible and important benefits of home automation networks are related to (i) comfort (smart kitchen, TV), (ii) monitoring (sensors), (iii) therapy (automated delivery of treatments) (iv) support (robotic devices, mobility devices) and (v) consultancy (sensors) [
3]. This fact, combined with the impressive rise of IoT and AI in the last decade, renders these technologies as catalysts in the progress and development of humanity, hence offering practical services and applications.
In order to provide novel solutions and produce competitive products, both researchers and industries are seeking to solve important problems and optimize the current approaches for innovative home automation technologies by employing a variety of scientific approaches and models, e.g., deep learning, statistics, graph theory, cryptography, heuristic algorithms [
4]. These innovations, which can potentially lead to commercially exploitable outcomes, are usually covered by patent documents that protect the valuable legal and practical assets of individuals and organizations against competitors.
Regarding the industrial involvement, patented technologies can be used as a basis upon which to assess emerging technologies and key individuals, organizations and countries as they contain significant information and details on both trending and essential technologies and methodologies [
5]. The process of analyzing and extracting knowledge from patent data constitutes the field of patent analysis and is used as a tool to cover multiple research goals related to trending and competitor analysis, technology forecasting and strategic planning. Evidently, the corresponding approaches leverage several data and text mining techniques for the completion of defined research goals [
6], including natural language processing, cluster analysis and citation networks/graph theory.
In this study, we focus on exploring and assessing the main technologies and assignees of home automation networking by collecting and analyzing relevant patent data in order to provide sufficient insights into emerging and dominant technologies as well as leading assignees. Thus, we first collect the appropriate patent information from the USPTO (
https://www.uspto.gov/, accessed on 16 October 2023) and then deploy a patent analysis framework that combines cluster analysis with multiple patent properties to address these objectives. Our framework is inspired by existing patent analysis methodologies that make use of patent classification schemas [
7,
8], in our case the Cooperative Patent Classification (CPC (
https://www.uspto.gov/web/patents/classification/cpc/html/cpc.html), accessed on 16 October 2023), and the Compound Annual Growth (CAGR) [
9], to detect dominant or declining clusters. In brief, we firstly establish a CPC subclass to a patent matrix (CPM) and further employe the non-negative matrix factorization (NMF) algorithm [
10,
11] to detect the main technology clusters of home automation patents. Additionally, we leverage additional information from the patent data to firstly calculate the CAGR of the extracted clusters and to evaluate the status and the representative organizations of each cluster.
Overall, our analysis demystifies the underlying relationships between patent classifications which leads to a determination of the general technology clusters of home automation networking patents. The corresponding findings, which are complemented by the evaluation of the CAGR, and the leading assignees of each cluster can provide guidelines for multiple patent analysis scopes such as trending and competitor analysis as well as technology forecasting.
The rest of this paper is organized as follows: in
Section 2, we provide a comprehensive review of the related literature both in home automation networks and in patent analysis, hence profiling the progress in the field. In
Section 3 we present the utilized methodology along with the key concepts and definitions. In
Section 4, the results of our analysis are presented and visualized while
Section 5 includes a contained discussion of our main findings. Finally,
Section 6,
Section 7 and
Section 8 provide the limitations of our study, conclusions and some interesting future work directions.
2. Literature Review
2.1. Home Automation Networks
Home automation networks have recently grown rapidly and are now widely applied to improve different systems and appliances. Shuhaiber and Mashal [
12] and Sin et al. [
13] have revealed that the perceived usefulness and risks as well as the ease of use of these technologies are some of the most important factors towards accepting and using home automation networks. However, the efficiency and quality of home automation networks is measured by different indicators. According to Toschi et al. [
14], home automation technologies should be evaluated based on their characteristics, such as communication and data type; their performance, such as complexity, rate, and processing power; as well as their various expenses, such as cost, energy consumption.
Zielonka et al. [
4] focus their review on research reports and patents in order to identify the research trends of home automation applications. According to their findings, the popular and trending technologies aim to improve healthcare, e.g., eldercare; information security, e.g., cryptography and the blockchain; and energy systems, e.g., management of energy consumption. Other areas of interest include remote devices, communication systems and sensors.
The recent advances of machine learning and deep learning architectures have brought to the surface some new technologies and frameworks that employ such techniques in home automation services. Yu et al. [
15] discuss the potential usage of deep learning in multiple applications and objectives that are relevant to home automation networks, indicating that these techniques improve existing machine learning approaches, e.g., naive Bayes and support vector machines. Their analysis shows that these applications are related to activity recognition and prediction, security as well as energy management while the utilized data structures are associated with sensors, images, videos and audio.
2.2. Patent Analaysis
Researchers and organizations have acknowledged the value of patent analysis as the information included in patent documents represents an overview of the technologies that are developed for different domains and objectives. The existing research, i.e., patent analysis studies, covers a widespread area and different fields of interest, including electrical vehicles [
16], artificial intelligence [
17], security [
18], software development [
19], etc. In general, a patent record contains information concerning patent assignees, usually large companies; inventors; citations; descriptions, i.e., titles and abstracts; and patent classifications, i.e., specific categories and identifiers describing relevant technological fields.
In particular, patent classifications have been effectively used to extract comprehensive knowledge from domain specific datasets. Jee et al. [
20] have leveraged the available patent classifications, which are assigned to each patent, in order to identify promising technologies by six different perspectives, indicating their role in a technology area expressed by a representative patent dataset. In a different context, Park and Geum [
21] assessed the relationships of the different technology areas using patent data and classifications, with a further goal of identifying potential opportunities from convergence networks. Similarly, Geum and Kim [
22] have combined the information from patent classifications to establish a graph network to uncover core technologies and technological chances through cluster analysis. In addition, clustering applications that are based on patent classifications have been previously proposed as effective approaches in forecasting and evaluating promising and emerging technologies [
7,
8].
Regarding patent assignees, analyzing the patents and assets of a specific company can lead to the evaluation of its overall knowledge status, immediate competitors and relative strategic positioning. Suominen et al. [
23] have explored the technologies of telecommunication industries through patent analysis in order to profile the different involved organizations and assess the potential connections between them. Likewise, by analyzing patent citations and the main properties of patent data, Daim et al. [
24] evaluated the overall technology knowledge status of the different organizations, thus distinguishing those that hold significant inventions in the field of IoT, cybersecurity and blockchain. Additionally, Wang and Hsu [
25] have established a topic strategy matrix and a topic–firm network to assess the activity and associations between topics and firms and to discover the core assignees and significant topics of smart manufacturing technologies.
3. Methodology
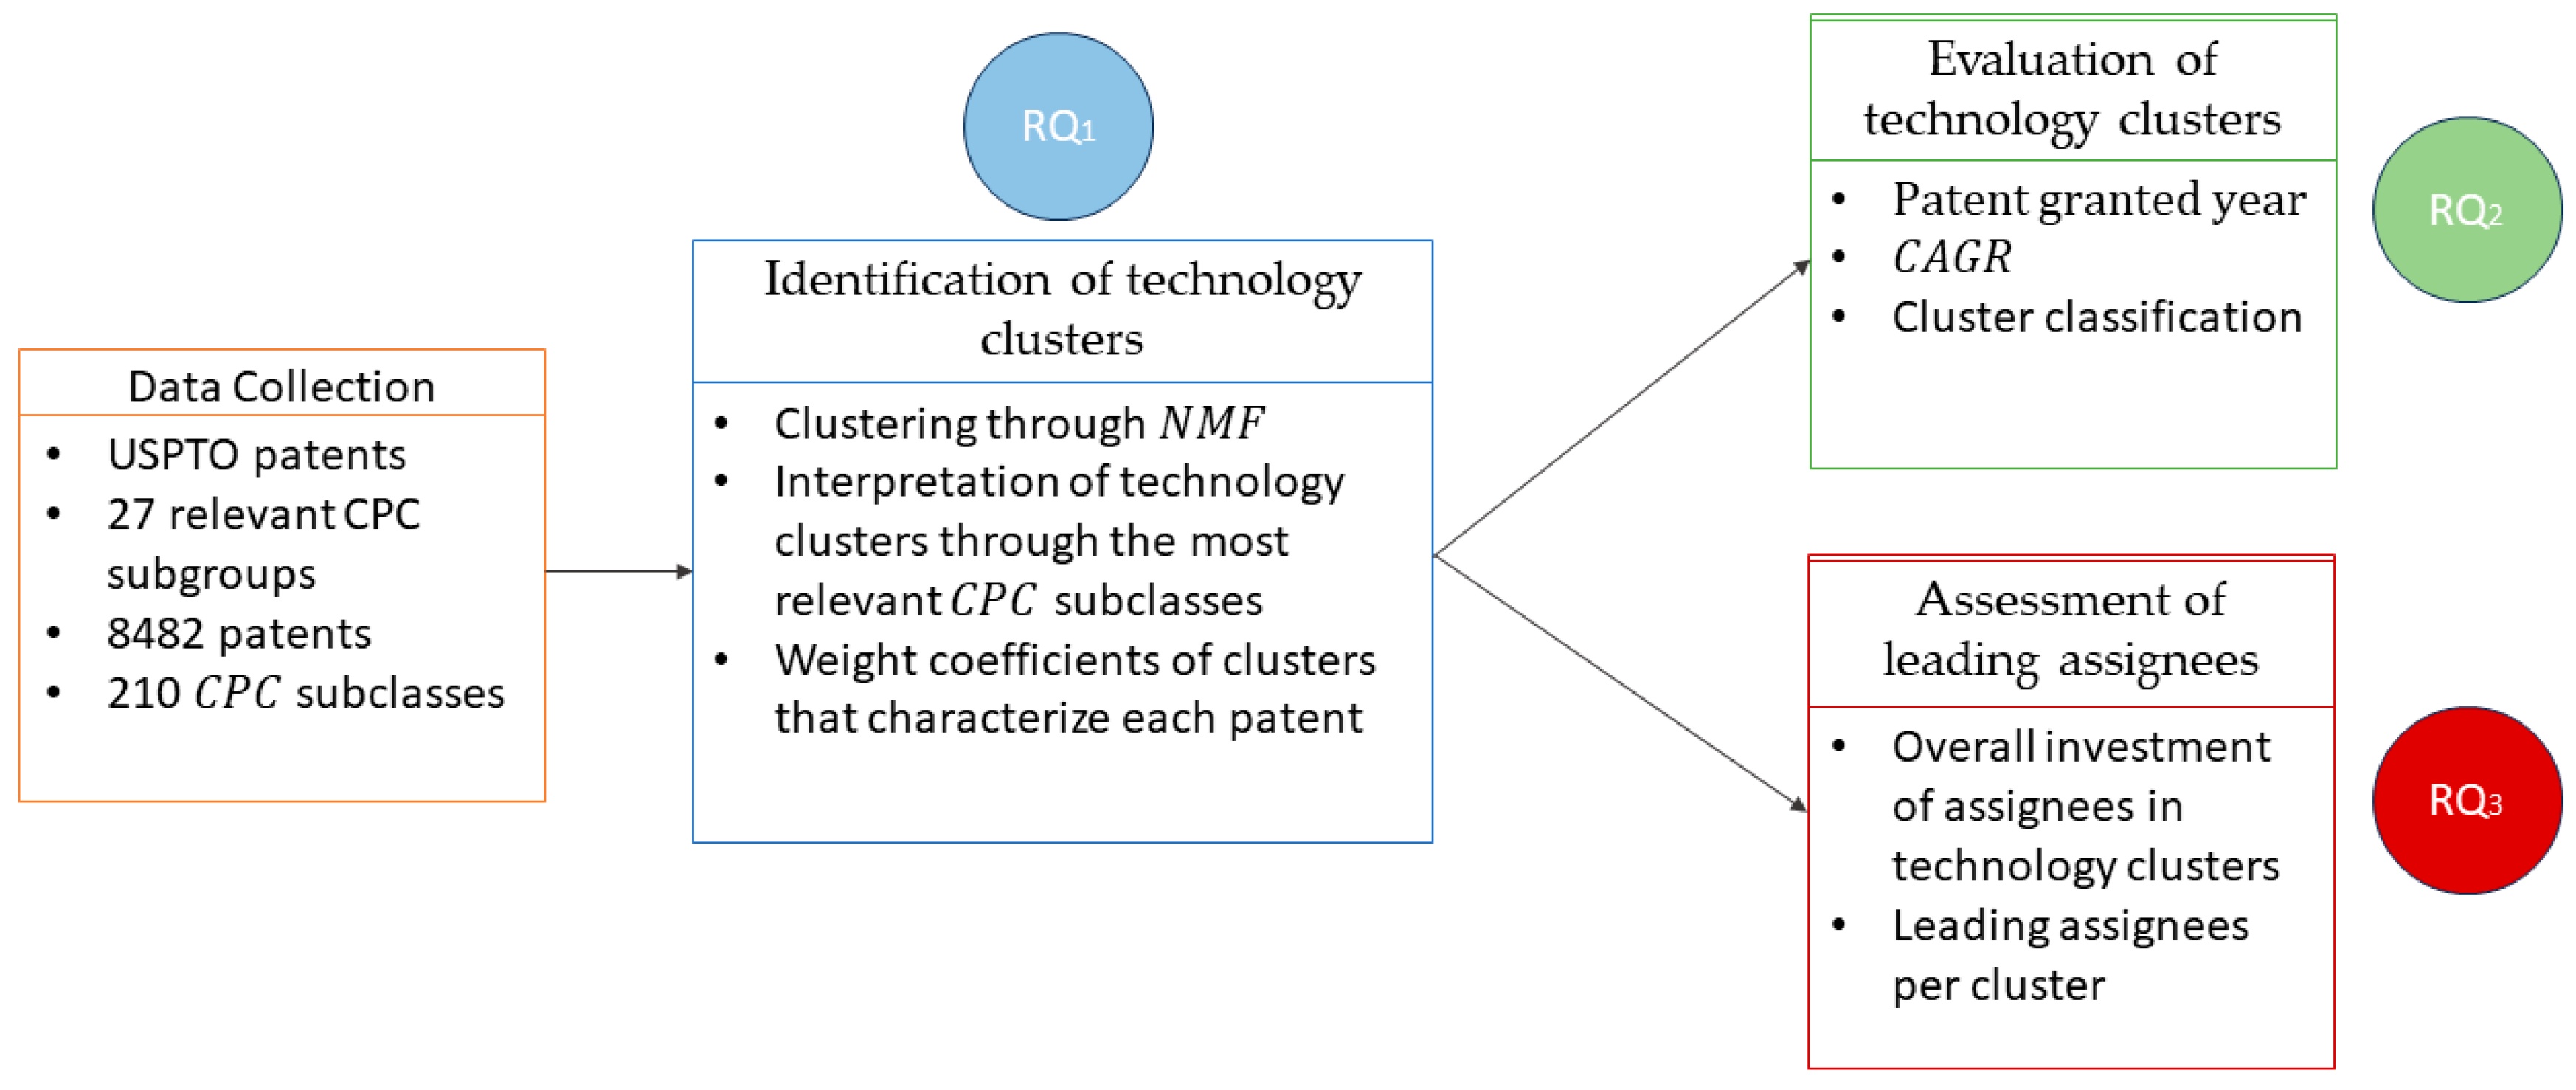
The outline of the proposed approach is presented in
Figure 1 and consists of distinct phases which are described as (i) data collection, (ii) identification of technology clusters, (iii) evaluation of technology clusters, and (iv) assessment of leading assignees. In addition, we provide an additional figure (
Figure 2) presenting the data exchanges between these phases, with the displayed data structures described later in this section. Overall, through the techniques that are described in this section we aim to provide answers to the following research questions (RQs):
RQ1: What are the core technology clusters of home automation networks?
Purpose: Given that patent data correspond to multifaceted and innovative products that are patented by large companies, it is expected that the technological objectives will be varied and different. Hence, the purpose of RQ1 is to aggregate the patent data and detect primary clusters of co-occurring technologies that describe the status of home automation networks. These clusters represent groups of CPC subclasses that have similar objectives and are hence related in terms of technological convergence.
RQ2: How are the different technology clusters classified with respect to patent activity trends and growth?
Purpose: The identified technology clusters are composed of patents that cover a wide time period. Thus, it is of high research interest to examine which clusters evolve and dominate the market over time, as this indicates essential technologies. It is also of interest to examine which clusters present a downward trend, indicating declining or niche domains of home automation networks that require more careful planning and more thorough methodologies.
RQ3: Who are the leading assignees/competitors of the different technology clusters of home automation networking?
Purpose: Patent data contain a multitude of information, with one of the most important fields being the patent assignee, i.e., the company, organization or individual, that has the ownership of the patent. By utilizing the technology clusters identified in RQ1 and the growth of each cluster from RQ2,, in RQ3 we are able to pinpoint the leading companies of home automation networking that participate in dominating and emerging clusters while, at the same time, we discuss companies that operate in less popular or niche fields.
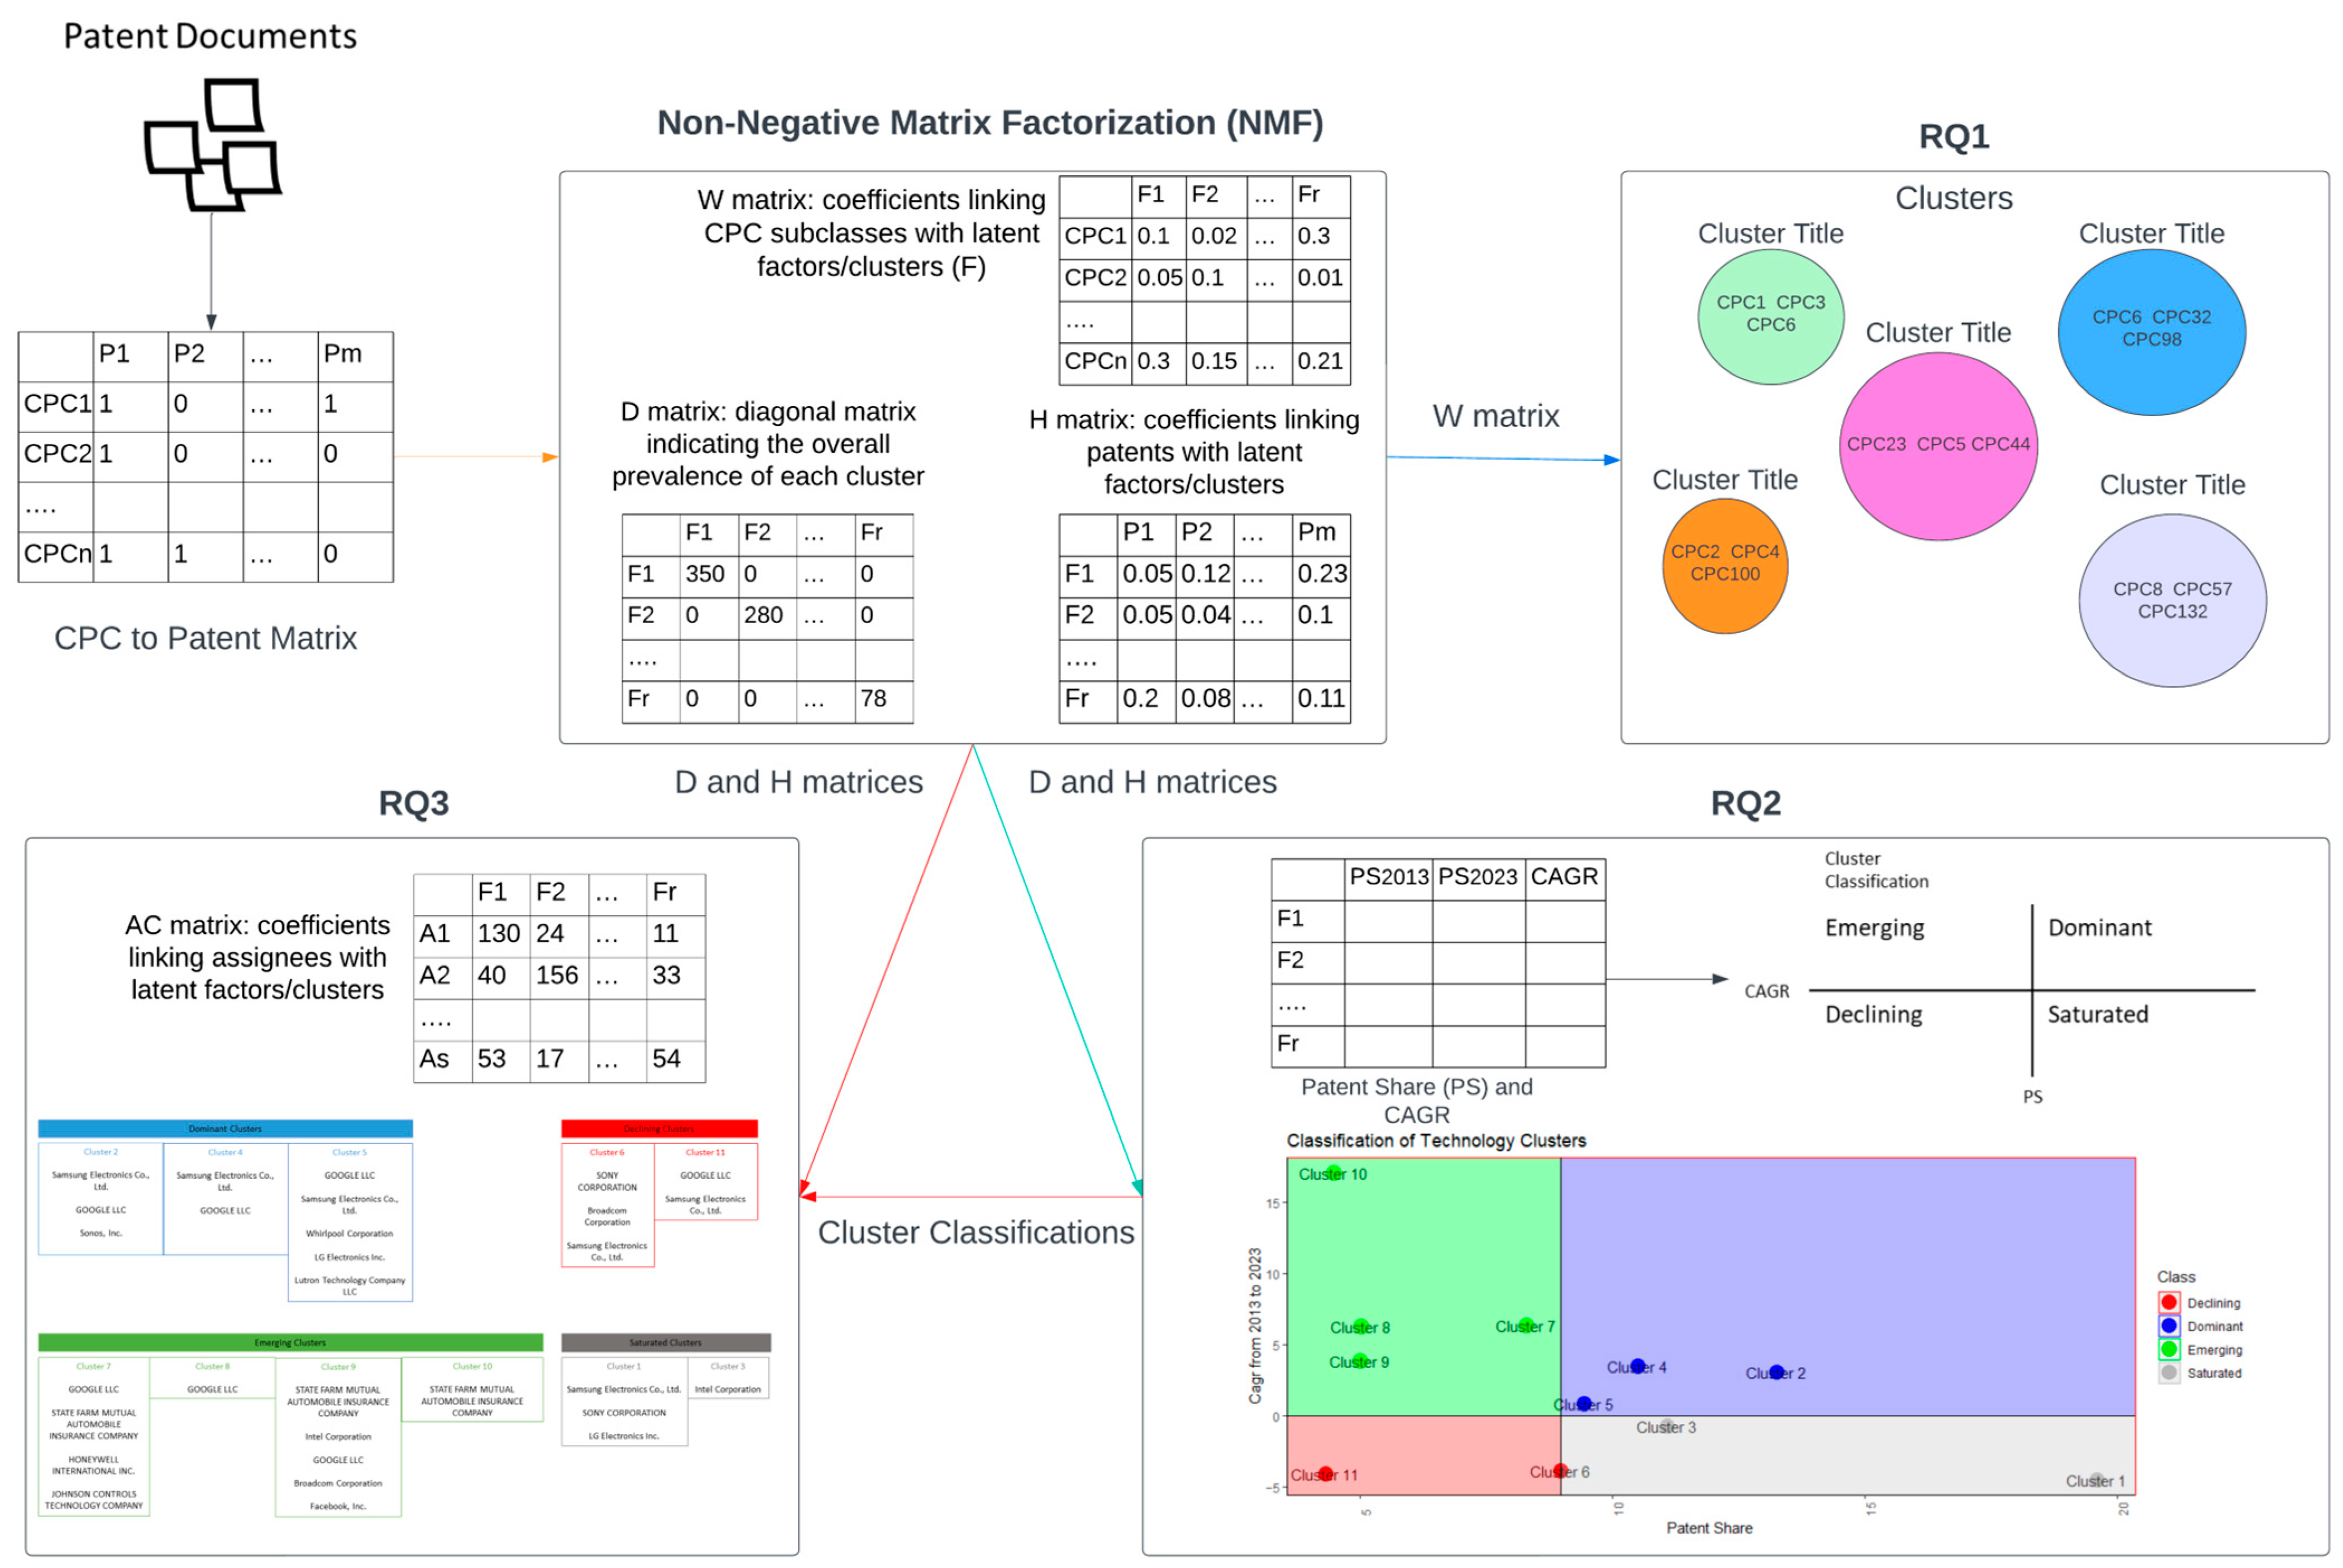
The purpose of the first phase of our approach was to identify an appropriate source of patent data, from an acclaimed patent office. Given that USPTO is hailed in similar literature as a potent repository of patent grants, we turned our attention to this specific patent office to accumulate patent data about home automation networks. In addition, as the usage of a manually formulated search string could potentially lead to data omission or the retrieval of irrelevant patents, we decided to leverage one of the existing classification schemas of USPTO, i.e., the CPC schema, and identify all of the CPC subgroups that are relevant to the area of interest of this study, i.e., home automation networks. As a result, we manually searched the CPC schema and identified 27 subgroups, summarized into 9 CPC prefixes, which are presented in more detail in our prior work [
26]. Instead of analyzing a sample, which was the objective of our previous work, in this study we analyze the complete dataset that is formed by the 8482 patents.
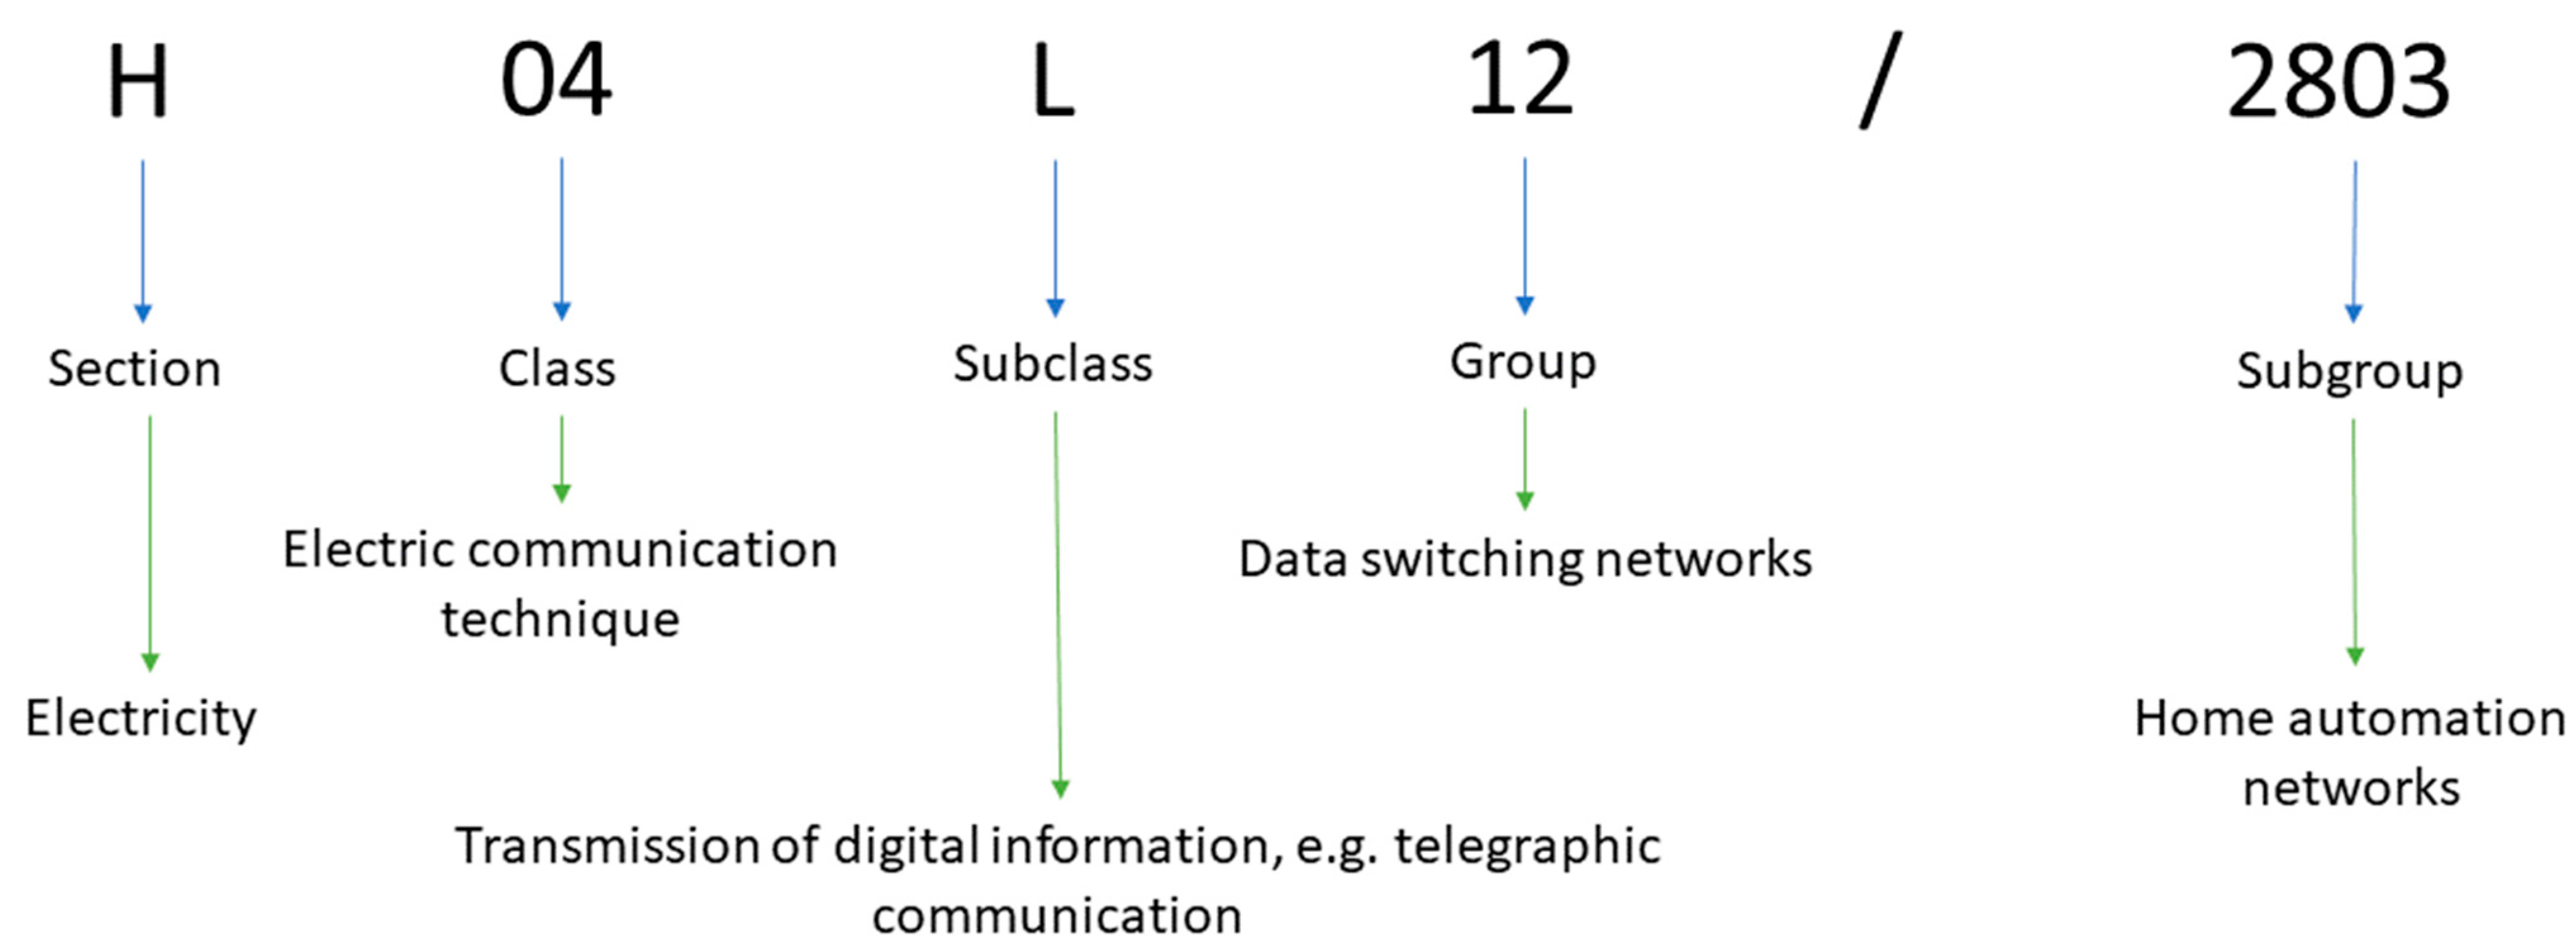
The CPC schema, used by the USPTO for patent classification, follows a tree structure and is divided into upper levels that correspond to more general and inclusive classes, these are then dispersed into secondary and tertiary levels that reflect more specific technological objectives and domains. In general, a single USPTO patent is assigned, by applicants or examiners, to multiple CPC subgroups that are used to describe the concepts of the respective patent and cover a very specific technological area. As the goal of this study is to identify the general technology clusters of home automation networking patents, we used an upper level of the CPC schema, i.e., the subclasses, instead of the lowest level (subgroups) to achieve our goals. In
Figure 3, we present the meaning of the different encodings that form a single CPC subgroup.
After collecting all the necessary patent information, we then proceed to constructing the CPC-to-patent matrix (CPM)
where
is the number of patents and
is the number of the detected CPC subclasses (210 overall in our dataset).
The CPM will be used to establish cohesive technology clusters, reduce the dimensionality of the CPC schema and identify the potential interconnections between the CPC subclasses, and possibly subgroups, which fall under different encodings. To identify and assess the general technology clusters associated with home automation networking, we employ a variation of the standard NMF [
10,
11], proposed by Debruine et al. [
27],
where an initial matrix
(from visible), the CPM in our case, is decomposed into two lower-rank non-negative matrices entitled
and
, for a predefined number of features, which is referred to as rank (
). These two outcoming matrices (
and
) help us relate the CPC subclasses and the patents with their respective semantic features. In this variation,
is a diagonal matrix that scales the two aforementioned matrices to sum to one, i.e., the elementwise column sums of
and the elementwise row sums of
are equal to one and indicate the overall prevalence of each feature in the data.
In general, each column of
defines the vector of a latent/basis feature of
, while a column of
stores the weight coefficients that connect an initial observation with these basis features [
28]. Lee and Seung [
10] describe how, for the initial matrix
, with
words and
documents,
indicates the frequency of the
ith word in the
jth semantic feature, while
denotes the weight that is given to the
ith semantic feature for the
jth document. In our case, where words are replaced by CPC subclasses and documents by patents,
will help us address the core concepts of the basis features, expressing technology clusters, while
will help us assess the overall presence of these features in each patent.
Although NMF is quite an old algorithm, it is considered an effective and widespread methodology as it is still employed in multiple areas of interest, such as sound event detection [
29], speech recognition [
30], text mining [
31,
32,
33], image analysis [
34,
35], security and privacy [
36] and community detection [
37]. In many of these applications, NMF is used as a tool for classification, filtering, dimensionality reduction as well as data clustering, which is the core concept of this study. In addition, the advantage of NMF against the standard clustering approaches is that this algorithm produces weight coefficients instead of an evaluation that relates each data point/observation to a single cluster.
To pick the ‘optimal’ rank, we employ normalized pointwise mutual information [
38] for the ten CPC subclasses with the highest frequencies in each feature, which is a typical selection to measure the coherence of clusters and topic models. NPMI is a measure, ranging from −1 to 1, for pairwise associations where higher values indicate positive degrees of co-occurrence/association while lower values indicate positive degrees of independence. After finalizing the model for the ‘best’ number of features, we make use of the most frequent CPC subclasses to interpret each feature into a general technology cluster.
Moreover, we follow the methodology proposed by Choi and Song [
9] to classify each cluster as emerging, dominant, declining or saturated by evaluating the compound annual growth (CAGR), given a period of ten years (2013–2023) and the patent share (PS) of the clusters in the collected patents. In this study, we denote the PS as the overall prevalence of each factor/cluster in the patents and
as the patents belonging to a selected patent subset.
To characterize the clusters into the four classes, we plot the overall PS with the CAGR evaluations, where the characteristics of each class are the following:
Emerging: Low PS, high CAGR
Dominant: High PS, high CAGR
Declining: Low PS, low CAGR
Saturated: High PS, low CAGR
As one of the goals of this study is to identify the leading assignees of the various technologies that are relevant to home automation networking, we further assess the overall investment of each assignee in a technology cluster using the
matrix
where
(assignee–cluster matrix) denotes the overall investment of the
ith assignee in the
jth cluster,
is the number of assignees and
is the set of patents which are assigned to the
ith assignee. The assignees with the highest AC values in a cluster are declared as the leading assignees.
4. Results
In this section, we present the main results of this study, with which we aim to provide answers to the three posed research questions. To answer RQ
1, we first present the main technology clusters as extracted using the NMF, complemented by representative descriptions, which in turn are based on the most frequent CPC subclasses of each cluster (
Section 4.1). Furthermore, in
Section 4.2, we discuss the findings concerning the classification of each technology cluster based on CAGR and PS. Finally, in
Section 4.3 we present the leading assignees (organizations) of each technology cluster and also evaluate their investment in home automation networking technologies.
4.1. RQ1: What Are the Core Technology Clusters of Home Automation Networks?
Initially, we evaluated 19 NMF models, using the NPMI, ranging from 2 to 20 features/clusters. The evaluations of these models are presented in
Figure 4, where we observe that the NPMI is maximized under 11 features/clusters. Thus, we proceed to the following phases using the properties of the respective model.
An initial step towards the interpretation of the derived results is to inspect the most frequent CPC subclasses of each cluster to provide a representative description for each one. These subclasses, along with their relative frequency are presented in
Table 1, where we should note that the frequencies of all detected subclasses, not only the top 10, are scaled and are summed to one for each cluster.
By inspecting the above table, we are able to detect that there are several clusters that are mostly formed by a single CPC subclass. However, we can also observe that three clusters are formed by multiple subclasses, e.g., Cluster 10, meaning that our approach indeed discovered associations between different CPC encodings. It is also evident that while the prevalent subclasses correspond to the primary subclass for home automation, other subclasses that comprise the clusters relate to more distinct objectives. For example, Cluster 1 contains subclasses related to lightbulbs (F21V), refrigerators (F25D) and laundering (D06F), indicating that home automation networking expands across various domains. The different CPC subclasses, shown in
Table 1, along with the descriptions of the representative CPC groups and subgroups of each cluster, finally help us provide a descriptive title for each cluster (
Table 2). The reason behind the inspection and presentation of the most frequent CPC groups and subgroups of each cluster is because each patent is assigned to multiple identifiers of this level rather than to CPC subclasses directly.
The most representative CPC subclasses and cluster titles indicate that the general clusters of home automation networking patents are related to both technical content, such as the transmission of digital information and electric digital data processing, and to relevant applications, such as alarm systems, air conditioning, and pictorial communication. In addition, we should mention that the first cluster is the most relevant to our dataset as the retrieved patent records belong to the CPC subgroups that fall under the H04L12/2803 CPC encoding. Of course, clusters with reduced prevalence present more interesting characteristics and refer to specific technologies and patent objectives such as home automation networking targeted at finance and management (Cluster 9), general-purpose alarm systems (Cluster 8), air conditioning and regulation systems (Cluster 7) or autonomous systems that utilize computation methods for multi-purpose usage in vehicles, e.g., temperature control or traffic monitoring (Cluster 10). Finally, an interesting indicator of the rise of IoT technologies is the dedicated cluster for remote appliance control and communication via sensors and other computer systems (Cluster 11).
Remarkably, by reviewing the patent abstracts of the retrieved patents, we noticed several common control units of smart home networks, including microcontrollers (Cluster 3, Cluster 7, Cluster 11), programmable logic controllers (Cluster 3, Cluster 5), tablets (Cluster 5, Cluster 7, Cluster 11) and phones/smartphones (Cluster 11). At the same time, we also observed multiple communication protocols such as Wi-Fi (Cluster 4), Ethernet (Cluster 3, Cluster 6, Cluster 11), ZigBee (Cluster 4, Cluster 5), Bluetooth (Cluster 2, Cluster 4, Cluster 9, Cluster 11), IEEE (Cluster 6, Cluster 9) and X10 (Cluster 1, Cluster 4). Our research shows that the different control units and communication protocols are not employed in similar technologies as they are not gathered around distinct clusters, meaning that they have advantages and disadvantages against each other in the various communication networks. To detect the aforementioned technologies, we traced patent abstracts that contained them and then analyzed the weight coefficients of each patent (matrix ) in order to denote the representative clusters that included these technologies.
4.2. RQ2: How Are the Different Technology Clusters Classified with Respect to Patent Activity Trends and Growth?
According to Choi and Song [
9], the four classes that are used to characterize each cluster are formed using two critical thresholds. The first threshold is the median cluster PS (
x axis) while the second is the 0 CAGR (
y axis). Thus, by using these two thresholds, we are able to create a two-dimensional space with 4 quartiles representing analogous classifications, as presented in
Figure 5. More specifically, each quartile corresponds to combinations of PS and CAGR, with PS receiving only positive values and the CAGR receiving positive and negative values. Hence, clusters are represented as points in the two-dimensional space, falling into different quartiles which are interpreted as either dominant, emerging, declining or saturated. Evidently, dominant and emerging clusters are more important as they indicate technologies that are either the primary focus of patent objectives and assignees or have prospects for further investment. On the other hand, declining and saturated clusters can be traced to technologies that are rendered obsolete or that have been overshadowed by other technologies i.e., technologies that are present in dominant or emerging clusters.
Based on the aforementioned classifications,
Figure 5 shows that Cluster 10 (computational systems for vehicle control) is the most emergent technology cluster (green quartile), having a relatively high CAGR and low PS. Hence, we can conclude that the recent trends of home automation networking technologies are related to computational models which are used for various purposes, with autonomous vehicles being the primary focus. This is a prime example of an emerging technology, as autonomous vehicles are indeed a field that has seen a rise in investments from high-profile companies and is in dire need of automated networking systems. Other clusters that represent emerging technologies are those that represent air conditioning and regulation systems (Cluster 7), multi-purpose alarm systems (Cluster 8) and automation technologies for financial and managerial services. Based on
Table 2, these clusters, while having a low prevalence overall in our patent data, are not necessarily sectors that have no industrial interest but rather, they represent niche and domain-specific markets that are met with a rise in investments. In addition, Cluster 2 (electric digital data processing) should be considered as the most dominant technology cluster (blue quartile), meaning that a relatively high proportion of home automation networking patents process digital data and interface interactions, in turn meaning that there is also an increasing interest rate in these technologies. In general, in the dominant clusters category, we can discern technological clusters that, while not necessarily groundbreaking, represent standard practices in home automation networking that dominate the market due to the fact that most patents utilize them in their methodologies. This is further validated by the other dominant clusters, which are both essential parts of automation networking and refer to wireless communications (Cluster 4) and energy/power supply (Cluster 5).
At the same time, the declining clusters (red quartile) are mostly associated with telephonic and pictorial communications (Cluster 11). This observation shows that these two technological areas were trending prior to 2013, particularly during the rise of smartphones, but not in the more recent innovations, where other more innovative concepts have overtaken them. Finally, the saturated clusters (grey quartile) contain Cluster 3 (transmission systems) and Cluster 1 (digital information transmission). This is not a surprising fact, as traditional or analogue transmission systems can be considered a saturated field, one which, though an essential part of home automation networking, contains multiple solutions that perform different functions and have been complemented by developments in dominant and emerging fields (e.g., IoT, wireless communications). Additionally, as every patent of our dataset is assigned to the subclass, the classification of Cluster 1 indicates that the recent home automation networking patents have an increased number of assigned technology areas, expressed by CPC subclasses and subgroups. A final finding is associated with the classification of Cluster 6 (interaction with content and pictorial communications) which balances between the declining and saturated categories, hence determining a technology field that, while not entirely uncompetitive, has been rendered moderately innovative and overshadowed by other relevant clusters (e.g., Cluster 2).
Overall, our analysis can be used as a knowledge basis in profiling the recent activity of home automation networking patents and assessing technology scouting directions for future inventions. For example, the distinguished emerging and dominant technology clusters should be considered as the primary options in forming a single home automation networking patent, focusing on prevalent sectors and technologies that provide a competitive advantage to companies that will invest in relevant patents. Similarly, the declining and saturated fields, while not necessarily obsolete, should be approached carefully when patenting products relevant to them.
4.3. RQ3: Who Are the Leading Assignees/Competitors of the Different Technology Clusters of Home Automation Networking?
Our first assumption is that the most prevalent investors of the retrieved patents are expected to also be heavily involved in the different technology clusters. In
Table 3, we present the 10 most involved assignees in the retrieved home automation networking patents. The main activities of these assignees are related to the manufacturing of electronic equipment, e.g., software and hardware for smartphones, televisions, and the development of semiconductors. Among these, we can see well known technological companies that have established footholds in technological areas such as hardware and electronics (AT&T, Samsung, Panasonic, LG), semiconductors (Broadcom Corporation) and software or computing (Google, Intel). This is another indicator that home automation networking is a multidisciplinary field that attracts the interest of high-profile investors, who strive to patent their products and exploit them commercially.
Furthermore, the established AC matrix shows that some technology clusters are mostly associated with a single assignee, while others are related to multiple. For example, the weight coefficients of the patents (matrix
) indicate that Cluster 10 (Computational systems for Vehicle control) is formed by patents that are mostly owned by the State Farm Mutual Automobile Insurance Company (40%). At the same time, similar evaluations are inspected for Cluster 3, which is related to transmission systems, (Intel Corporation—18%) and Cluster 8, which is related to alarm systems, (Google LLC—21%). The remaining clusters are distributed to several assignees in a more balanced way, but we can also distinguish some that are more prevalent. In
Figure 6, we present the most prevalent assignees of each technology cluster with respect to the classification of the clusters (see
Figure 5).
The results from our analysis show that the primary competitors of the different technology clusters are indeed the major investors of the whole patent dataset. In particular, we observe that Google LLC and Samsung Electronics Co., Ltd. are among the main competitors in seven and six technology clusters, respectively. Likewise, these two assignees hold a significant stake in the dominant technology clusters, while Google LLC is also apparent in three out of the four emerging clusters as well. This proves that, where dominant and emerging technologies of home automation networking are concerned, software solutions and innovative hardware play a crucial role and are considered the top choices for patenting and protecting intellectual property.
Furthermore, we should emphasize that State Farm Mutual Automobile Insurance Company, despite its overall low involvement (89 patents) when compared with the major investors, holds a large proportion of patents that are relevant to three out of the four emerging clusters. The findings indicate that this company brought to the surface some new technologies that are related to home automation networking, as they own patents with a cumulative weight coefficient that exceeds forty percent in the most emergent cluster, Cluster 10. In addition, the fact that this assignee is present in the emerging clusters category is an encouraging sign of a company that provides innovative solutions, not only for autonomous vehicles but also for regulation systems, pictorial communications and data management. The declining and saturated clusters also present some interesting findings, with Broadcom Corporation being present in one declining cluster, related to content interaction (Cluster 6), while having a notable presence in granted patents, according to
Table 3. In addition, Sony, while being one of the top ten assignees, is also present only in the declining and saturated clusters. This does not necessarily mean that these companies do not have robust patenting strategies but rather that the dominant and emerging categories are populated with companies more akin to software development and hardware. Finally, in the dominant clusters, several known hardware companies are present (Whirlpool Corporation, LG Electronics Inc.) while the presence of Sonos Inc., a company that sells sound-related products, reveals interesting technological avenues of dominant patents.
Therefore, we believe that researchers and companies should study the technologies, strategies and business models of the companies that are present in the dominant and emerging clusters, in order to create new or to expand existing clusters and direct their patenting objectives towards these technologies, due to their contribution and general involvement in home automation networking patents.
In summary, in this subsection we have provided information concerning a primary task related to patent analysis—competitor analysis—as we identified the main competitors of each technology cluster. Therefore, inventors and organizations may leverage our outcomes to assess their immediate competitors and to further gain insights into their strategies, tactics and products. Through this process, an organization can detect misplaced or misdirected actions in its strategies while also pinpointing some potential technological gaps that would offer a significant advantage against these competitors.
5. Discussion
Overall, in this study we have explored the main technologies which are relevant and which contribute to home automation networking inventions. Through our analysis, we have shown that the different technology clusters encompass various areas of interest that are relevant to both technical content, e.g., transmission systems and data processing, and to specific appliances, e.g., alarm systems, air conditioning or financial systems (RQ1).
Moreover, we have classified the main technology clusters by evaluating their overall development across the past decade (2013–2023). In short, the respective outcomes have revealed that home automation networking patents are associated with an increased number of relevant technologies in this period. The detailed mapping distinguishes computational models and data processing techniques as the most emergent and dominant clusters, respectively, along with several upcoming concepts in home automation networking, such as wireless technologies and more efficient energy/power supply methodologies (RQ2).
In addition, the extracted results indicate that the retrieved patent data also contain several essential hardware technologies and protocols that are being leveraged in home automation networking. Among these, we can observe equipment such as tablets and PLCs and protocols such as Wi-Fi or Ethernet and Bluetooth communication. The existence of these systems in patent data proves that home automation networking concerns multiple interested parties, including software, hardware and firmware companies.
Finally, the available patent data have helped us to assess the leading assignees of each technology cluster using the portfolio of each assignee and the scores/coefficients linking each patent with the different clusters. The results point out some major assignees that invest in many dominant technology areas, e.g., Google LLC and Samsung Electronics Co., Ltd., while also some assignees that are more centralized to home automation networking appliances, e.g., State Farm Mutual Automobile Insurance Company. By leveraging the available cluster classifications, we conclude that the latter assignee has a strong presence in the most emerging technologies while the former two assignees should be characterized as the most dominant. In addition, some well-known hardware companies, such as Whirlpool and LG, have found secure pathways in patenting and have invested in dominant and emerging technological clusters, while Broadcom Corporation and Sony were only detected in the declining and saturated clusters. These findings have helped us ensure that RQ3 is addressed in detail.
Regarding the practical implications of this study, we believe that the employed framework and the findings from our experiments contribute to the provision of insights to both researchers and industrial actors.
In terms of research interest and implications, we have introduced an approach by which to assess technology clusters from patent data using patent classifications and NMF, which is indeed an algorithm which has been previously and effectively utilized for multiple tasks and data types. Compared with other clustering techniques, our approach assesses the links between each patent and each cluster with scoring mechanisms, instead of assigning a single cluster to each patent. As each patent is assigned to multiple CPC subgroups, and by extension to several subclasses, this practice seems a more appropriate approach than the standard hard clustering techniques. Additionally, the results and methodological framework of this study can be easily reproduced following our detailed approach and using various implementations of NMF that are publicly available on multiple programming languages, e.g., Python, R. Thus, the employed framework can be adapted to other datasets for similar patent analysis tasks or altered according to the objectives of each researcher. As many patent offices make use of the CPC or the International Patent Classification (IPC) schemas, which are similar in terms of structure and identifiers, our framework can be adapted to other countries and datasets beyond those belonging to the USPTO. Of course, for such an analysis to be carried out effectively, the structures and potentially varied patenting and legal procedures of other offices should be taken under careful consideration. In addition, apart from patent data, our approach could be useful in regard to different data types that use classification schemas or tagging systems, e.g., research papers, Twitter posts, Q&A discussions.
Furthermore, from a business perspective, the outcomes of this study provide insights concerning the main technologies and assignees of home automation networking patents. Among the different use cases, our results can be used as a basis when establishing high quality and valuable inventions, by providing information about emerging and declining technologies. Additionally, as we evaluated the involvement of the assignees in the different technology clusters, both researchers and practitioners or industrial actors can study our outcomes to identify immediate and major competitors to further build business strategies or to accordingly study groups of assignees. Finally, individuals or organizations which aim to establish or study home automation networks can leverage our findings and detect the general and more niche or refined technologies which can be used to establish relevant systems and networks, as the initial CPC identifiers are numerous compared with the eleven technology clusters which were assessed by our approach.
6. Threats to Validity
Although we based our framework on existing approaches and validated data sources, we identified several threats that can be categorized into the general concepts of internal and external validity.
In our case, the internal threats concern the employed methodologies, data structures and assessment methods. First, by exclusively using the CPC subclasses as our knowledge basis, we may have omitted the valuable information included in the descriptions and titles of the retrieved patents and the general intricacies of semantic data that may also contain technological objectives. However, existing studies have also exclusively studied patent classifications in order to answer research objectives that are similar to the RQs of our study. In addition, the CPC identifiers provide detailed information on the specifications of each patent as they are assigned by the experts of the related fields and the applicants themselves. Hence, we deem the threat of information loss to be mitigated by the fact that we utilized a well-known classification schema that is assigned after careful expert judgement.
Moreover, the clustering approach that was followed is currently a less explored one, as NMF is not commonly used in patent analysis. This fact raises the potential of bias in the selection of the algorithms, which may also affect the validity of the respective outcomes. Nevertheless, NMF is a standard approach to the discovery of underlying patterns from various data types and is also validated as an effective approach in different tasks. Finally, the assessment methods that were used to find the optimal rank, i.e., number of technology clusters, the classes of the different clusters, and the prevalence of each assignee, also fall under this potential for bias. To overcome issues of this nature, we based our analysis on existing techniques and assessment methods, e.g., NPMI, PS, and CAGR, that are commonly employed in both similar and in more generic tasks.
The external validity refers to the significance and potential generalization of the study’s outcomes. First, we believe that the choice of including a single patent office in our analysis could raise some issues concerning the generalization of our findings. Despite these vital concerns, the USPTO is considered the primary choice for patent analysis research, capturing a more global perspective than other patent offices [
39], while also using a respected classification schema for the storage of information. Furthermore, additional data sources, including business reports and related studies, could help us form a more inclusive/generic dataset that could also capture the internal and external factors that formulate technological trends and are not directly relevant to patent grants. However, patent data indicate the industrial activity of the different firms in a concise and contained way and thus the employed dataset can be considered a reliable knowledge base.
7. Conclusions
In this section, we present the main conclusions of this study as indicated by the employed framework and the respective findings. Our analysis has shown that the employed framework is able to extract coherent and distinct technology clusters that were easily interpretable. In addition, it has also addressed and uncovered the associations between different technologies which combine to create a home automation networking invention. The outcomes of our approach have shown that this field is characterized by a variety of different technologies and applications which aim to enhance automated procedures, which in turn ensure safety, comfort and control.
Moreover, by classifying the different clusters into four distinct categories of technological growth, we have provided information on the technologies that may be either reduced or replaced in the future, i.e., telephonic communication technologies. At the same time, we have distinguished both dominant and emerging technologies, i.e., data processing techniques and computational models, respectively, further providing guidelines for future directions. Lastly, we have assessed the leading assignees of the different technology clusters, hence revealing some popular assignees that invest in many different fields, e.g., Google LLC, and also some more domain-specific investors that obtained a lower involvement but a significant stake in emerging technologies, e.g., State Farm Mutual Automobile Insurance Company.
In summary, we believe that this study has produced valuable insights on home automation networking inventions, satisfying some standard patent analysis objectives such as technology forecasting, trending analysis and competitor analysis. We have further proposed an approach in the identification of technology clusters from patent data, which can also serve as a reproducible and valuable tool in future research.
8. Future Work
In this section, we discuss, in brief, some research directions for future work that could stand as extensions to this study or other existing works. First, we believe that additional prospects, such as patent descriptions, and data sources, such as literature data, may also provide significant information and extend or validate the findings of this study. Thus, researchers could investigate some publicly available and relevant data sources. In addition, beyond data clustering, there are other approaches that have been previously proposed and employed in prior work for research objectives similar to our own. Overall, we recommend co-word analysis and topic modelling as two effective alternatives in analyzing the main content of patent data.
Apart from the properties that describe the nature of the patents and their respective assignees, the inventors and the citation information have been previously studied as important patent characteristics. By analyzing the information of the different inventors of a patent dataset, researchers can identify the most productive and prolific as well as establish collaboration networks between their countries. Furthermore, the citation characteristics are usually studied as indicators that correspond to patent value and influence. Hence, researchers could leverage this information and further assess influential clusters by investigating patent citation networks or combine this information within the framework that we employed. This would lead to a more comprehensive and detailed analysis and forecasting of technologies while also taking into account geographical, interpersonal and research related trends.


