Article

lncRNA NAS1 Deficiency Drives Cisplatin Resistance via NR2F1-Mediated TGFB1/NF-κB Signaling Axis in NSCLC

1
State Key Laboratory of Natural Medicines, China Pharmaceutical University, Nanjing 211198, China
2
School of Life Science and Technology, China Pharmaceutical University, Nanjing 211198, China
3
Jiangsu Key Laboratory of Drug Design and Optimization, China Pharmaceutical University, Nanjing 211198, China
*
Authors to whom correspondence should be addressed.
These authors contributed equally to this work.
Cancers 2026, 18(7), 1159; https://doi.org/10.3390/cancers18071159
Submission received: 23 February 2026 / Revised: 30 March 2026 / Accepted: 1 April 2026 / Published: 3 April 2026
(This article belongs to the Section Molecular Cancer Biology)

Simple Summary

Cisplatin resistance is a major obstacle in the treatment of non-small cell lung cancer (NSCLC). In this study, we identified the lncRNA NAS1 as a consistently downregulated transcript in cisplatin-resistant NSCLC cells. Mechanistically, loss of NAS1 reduced NR2F1 expression, increased TGFB1, activated NF-κB signaling, and promoted cisplatin resistance. These findings reveal a NAS1–NR2F1–TGFB1–NF-κB regulatory axis involved in chemoresistance and suggest potential targets for improving platinum response in NSCLC.

Abstract

Background: Cisplatin resistance remains a major challenge in the treatment of non-small cell lung cancer (NSCLC). Although long non-coding RNAs (lncRNAs) have been implicated in chemotherapy resistance, their specific roles and underlying mechanisms remain incompletely understood. This study aimed to identify lncRNAs associated with cisplatin resistance in NSCLC and to elucidate the role and mechanism of NR2F1-AS1 (NAS1) in this process. Methods: Cisplatin-resistant NSCLC cell lines were established and subjected to transcriptome-wide RNA sequencing. NAS1 expression was validated by quantitative real-time PCR, and its clinical relevance was assessed using The Cancer Genome Atlas (TCGA) dataset. NAS1 and NR2F1 knockdown, together with NR2F1 overexpression and rescue experiments, were performed to evaluate their effects on cisplatin sensitivity. Downstream mechanisms were investigated by public dataset analysis, qPCR, and Western blotting, and NF-κB signaling was functionally assessed using the inhibitor DHMEQ. Results: NAS1 was consistently downregulated in multiple cisplatin-resistant NSCLC cell lines and was also decreased in NSCLC tissues. NAS1 knockdown enhanced cisplatin resistance. Mechanistically, loss of NAS1 reduced NR2F1 protein expression without significantly affecting its mRNA level, indicating translational regulation. NR2F1 downregulation also conferred cisplatin resistance, phenocopying the effect of NAS1 loss, whereas NR2F1 re-expression restored cisplatin sensitivity. Further analyses identified TGFB1 as a downstream effector derepressed by loss of the NAS1-NR2F1 axis, leading to activation of NF-κB signaling. Inhibition of NF-κB partially reversed cisplatin resistance in resistant cells. Conclusions: Collectively, our findings delineate a NAS1/NR2F1/TGFB1/NF-κB signaling axis critical for cisplatin resistance in NSCLC, revealing a potential therapeutic target for overcoming platinum resistance.

1. Introduction

Non-small cell lung cancer (NSCLC) is the most prevalent histological subtype of lung cancer, accounting for approximately 85% of all cases and representing a leading cause of global cancer-related mortality [1]. For patients with advanced or post-operative disease, platinum-based chemotherapy, predominantly with cisplatin, remains a cornerstone of first-line treatment [2,3]. However, the clinical efficacy of cisplatin is severely limited by the frequent development of intrinsic or acquired drug resistance, which constitutes a major obstacle to achieving durable therapeutic responses and improving long-term survival [4,5]. Consequently, elucidating the underlying molecular mechanisms of cisplatin resistance is imperative for developing novel strategies to overcome this barrier and improve outcomes for NSCLC patients.
Long non-coding RNAs (lncRNAs) are a class of transcripts longer than 200 nucleotides that lack protein-coding capacity. Accumulating evidence indicates their pivotal involvement in tumor biology, where they can act as drivers or suppressors of cancer initiation, progression, and metastasis [6]. Notably, their dysregulation is also increasingly linked to the development of chemotherapy resistance [7]. NR2F1-AS1 (nuclear receptor subfamily 2 group F member 1 antisense RNA 1, hereafter referred to as NAS1), a recently identified lncRNA located on chromosome 5q15, has been documented in a wide array of malignancies with context-dependent regulatory functions [8]. Intriguingly, the adjacent gene NR2F1 encodes a transcription factor reported to be translationally regulated by NAS1 and implicated in processes such as tumor dormancy and drug resistance [9,10]. However, the precise mechanism through which NAS1 modulates cisplatin resistance via NR2F1 in NSCLC has not yet been fully characterized. Therefore, this study aims to determine whether the NAS1-NR2F1 axis is involved in cisplatin resistance in NSCLC and to explore the molecular mechanisms by which its downstream factors exert their effects.
In this study, we identify that both NAS1 and NR2F1 are significantly downregulated in cisplatin-resistant NSCLC cell lines. Functional experiments confirm that knockdown of either gene increases cisplatin resistance, establishing their negative correlation with the cisplatin-resistant phenotype. Through rescue investigations, we demonstrate that NR2F1 is a necessary downstream target through which NAS1 exerts its effect. Furthermore, by integrating transcriptomic analysis and experimental validation, we reveal that downregulation of the NAS1-NR2F1 axis converges on the transcriptional derepression of TGFB1, leading to subsequent activation of the NF-κB signaling pathway to drive cisplatin resistance. Collectively, our findings delineate a NAS1/NR2F1/TGFB1/NF-κB regulatory axis and suggest that targeting this pathway could represent a promising therapeutic strategy for overcoming cisplatin resistance in NSCLC.

2. Materials and Methods

2.1. Cell Culture

The human lung adenocarcinoma cell line PC9 (CellCook, CC0204, Guangzhou, China) and its cisplatin-resistant derivative PC9/CDDPr (CellCook, DR0204-DDP); the large cell lung cancer cell line H460 and its cisplatin-resistant derivative H460/CDDPr (MingJing Biology, M-C7062, Shanghai, China); as well as the lung squamous carcinoma cell line H226 (Cell Bank of Chinese Academy of Sciences, SCSP-5073, Shanghai, China) and its cisplatin-resistant counterpart H226/CDDPr were used in this study. Generated in-house by concentration-gradient intermittent induction: H226 cells were obtained from the Cell Bank of the Chinese Academy of Sciences. H226 cisplatin-resistant cells were established in-house by stepwise intermittent exposure to increasing concentrations of cisplatin over 6 months until a stable resistant phenotype was achieved. Resistant cells were maintained in medium containing 1 μM cisplatin and cultured in drug-free medium for 1 week before experiments. All cell lines were authenticated by short tandem repeat profiling within the past 3 years and routinely confirmed to be free of mycoplasma contamination. Cells were cultured in RPMI-1640 medium supplemented with 10% FBS and 1% penicillin/streptomycin at 37 °C in a humidified incubator with 5% CO2. All cells were cultured in RPMI-1640 medium (BI, 01-100-1ACS, Kibbutz Beit Haemek, Israel) supplemented with 10% FBS (VivaCell, C04001-500, Shanghai, China) and 1% penicillin/streptomycin (Life Technologies, 15140163, Shanghai, China). To maintain the resistant phenotype, H226/CDDPr, H460/CDDPr and PC9/CDDPr cells were routinely cultured with 1 µM, 0.83 µM and 6.6 µM cisplatin, respectively. Cells were switched to drug-free medium for one week prior to experiments. All cultures were maintained at 37 °C in a humidified atmosphere containing 5% CO2.

2.2. RNA-Seq Data Analysis

For transcriptomic profiling of cisplatin-resistant cell lines, total RNA was extracted from cells at 70–80% confluence using TRIzol reagent (Invitrogen, Carlsbad, CA, USA) according to the manufacturer’s instructions. Libraries were prepared and sequenced on an Illumina NovaSeq platform (Novogene, Beijing, China). Raw transcriptome sequencing data were first subjected to quality control using FastQC (version 0.12.1) and summarized with MultiQC [11] (version 1.33). Low-quality bases and residual adapter sequences were then removed using TrimGalore (https://github.com/FelixKrueger/TrimGalore, accessed on 7 September 2016). The cleaned reads were aligned to the human reference genome (GRCh38, Ensembl release) using Hisat2 (version 2.2.1) [12]. Gene-level read counts were quantified with FeatureCounts [13]. Differential expression analysis was performed using DESeq2 (version 1.42.1) [14]. Genes with an absolute log2 fold change (|log2FC|) > 1 and a p-value < 0.05 were considered significantly differentially expressed.
For the external dataset GSE233167 (gastric cancer cells with NR2F1 knockdown or overexpression), FPKM values were downloaded from the GEO database. Genes with FPKM fold-change > 1.3 or <1/1.3 were defined as upregulated or downregulated, respectively. Heatmaps were generated for genes with |Z-score (OE_NC − KD_NC)| < 1.

2.3. TCGA Data Analysis

The RNA expression profiles of lung adenocarcinoma (LUAD) and lung squamous cell carcinoma (LUSC) cohorts were obtained from The Cancer Genome Atlas (TCGA) database. Primary non-small cell lung cancer (NSCLC) tumor tissues and corresponding normal lung tissues were included in the analysis. The RNA expression level of NR2F1-AS1 was extracted from the TCGA expression datasets. Differences in NR2F1-AS1 expression between NSCLC and normal tissues were visualized using the ggplot2 package in R (version 4.0.1). The Wilcoxon rank-sum test was applied to evaluate the statistical significance of differences in NR2F1-AS1 RNA expression between the two groups.

2.4. Plasmid Construction and Transfection

To construct the shNR2F1 plasmid, a double-stranded oligonucleotide encoding the NR2F1-targeting shRNA (5′-CTCTTCTTCGTCCGTTTGGTA-3′) or a control shRNA (shScramble: 5′-AACAGTCGCGTTTGCGACTGG-3′) was cloned into the pRSI9-U6-(sh)-UbiC-TagRFP-2A-Puro vector. Correct insertion was verified by Sanger sequencing.
For NR2F1 overexpression, the full-length human NR2F1 coding sequence (NM_005654.6) was amplified by PCR with flanking HindIII and BamHI sites and inserted into the pcDNA3.1 vector to generate pcDNA3.1-Myc-NR2F1. Empty pcDNA3.1 was used as a negative control. Primer sequences are listed in Supplementary Table S1.
Cells were seeded in 3.5 cm dishes 24 h before transfection to reach 50–70% confluence. the pcDNA3.1 empty vector (negative control) or the pcDNA3.1-Myc-NR2F1 expression plasmid was delivered using Lipofectamine™ 3000 (Invitrogen, L3000015). Medium was replaced 4–6 h post-transfection, and subsequent experiments were conducted 24 h after transfection. Transfection efficiency was assessed 48 h after the transfection.

2.5. Construction of Knockdown Cell Lines

For stable NAS1 knockdown, lentiviral particles carrying two independent shRNAs (shNAS1-1: 5′-GACACTGATATAACTGTAGAT-3′; shNAS1-2: 5′-GCTGCATCCTTATGGTAGCTA-3′) or a control shRNA (shNC: 5′-TTCTCCGAACGTGTCACGT-3′) were obtained from GenePharma (Shanghai, China). Cells were co-infected with both shNAS1 lentiviruses or infected with shNC lentiviruses at 40–50% confluence. After 24 h, the viral supernatant was removed. The cells were then cultured in complete culture medium without antibiotics for an additional 24 h. Subsequently, the cells were maintained in complete culture medium for 2 days, followed by puromycin selection (PC9: 1 µg/mL, H226: 0.5 µg/mL) was applied for 7 days to establish stable pools.
For NR2F1 knockdown, lentivirus was produced by transfecting HEK-293T cells with packaging and shNR2F1 plasmids using Exfect Transfection Reagent (Vazyme, T101-02, Nanjing, China). Supernatants were collected at 24 h and 48 h, filtered (0.45 µm), and used to infect target cells at 40–50% confluence. After 24 h, complete medium was applied, and stable populations were selected with puromycin for 7 days. Knockdown efficiency was confirmed by qRT-PCR and Western blot.

2.6. RNA Isolation and Quantitative Real-Time PCR

Total RNA was extracted with TRIzol reagent (Invitrogen, 15596018). Reverse transcription was performed using 1 µg RNA with HiScript III RT SuperMix (Vazyme, R323-01). qPCR was carried out with ChamQ SYBR Master Mix (Vazyme, Q331-02) on a QuantStudio 3 system (Applied Biosystems, Foster City, CA, USA). Relative expression was calculated by the 2−ΔΔCT method using β-actin as the internal control. All primers were synthesized by Tsingke and are listed in Supplementary Table S1.

2.7. Western Blot (WB)

Cells were lysed in SDS-PAGE sample buffer and heated at 100 °C for 10 min. Proteins were separated on 10% SDS-PAGE gels and transferred onto NC membranes (Sangon Biotech, F619512, Shanghai, China). Membranes were blocked with 5% non-fat milk in TBST, then incubated overnight at 4 °C with the following primary antibodies: COUP-TF1 (ab181137, Abcam, 1:1000, Cambridge, MA, USA), GAPDH (sc-365062, Santa Cruz, 1:5000, Santa Cruz, CA, USA), p-P65 (3033, CST, 1:1000, Danvers, MA, USA), P65 (8242, CST, 1:1000). After washing, membranes were incubated with HRP-conjugated anti-rabbit (SA00001-2, Proteintech, 1:5000, Wuhan, China) or anti-mouse (SA00001-1, Proteintech, 1:5000) secondary antibodies for 1 h at room temperature. Signals were detected with a ChemiDoc system (Tanon, Shanghai, China) and quantified using ImageJ (version 1.54g). All experiments were performed in triplicate.

2.8. Chemosensitivity Assay

Cell viability was assessed using the CCK-8 kit (Vazyme, A311-02). Cells were seeded in 96-well plates (3000 cells/well) and treated with a series of cisplatin concentrations (two-fold dilutions from 0 to 256 µM) for 48 h. Then, 10 µL of CCK-8 reagent was added per well, incubated for 1 h, and absorbance was measured at 450 nm. The half-maximal inhibitory concentration (IC50) was calculated by fitting a dose–response curve in GraphPad Prism 10 using the equation inhibitor vs. normalized response-variable slope.

2.9. Cell Migration Assay

Migration was evaluated using Transwell chambers (8 µm pore, LabSelect, 14341, Beijing, China). Cells were resuspended in medium with 1% FBS and seeded into the upper chamber (6 × 10⁵ cells/mL, 100 µL/well). The lower chamber contained medium with 10% FBS. Cisplatin (0, 4, or 8 µM) was added to both chambers. After 24 h, cells on the upper surface were removed, and migrated cells on the lower surface were fixed with 4% paraformaldehyde (Biosharp, 23355142, Beijing, China), stained with 0.1% crystal violet (Beyotime Biotechnology, C0121, Shanghai, China), imaged, and counted.

2.10. Colony Formation Assay

Cells were plated in 6-well plates at 700 cells/well. After adhesion, cisplatin (0, 0.5, or 1 µM) was added. Cells were cultured for 7–10 days, fixed with 4% paraformaldehyde (Biosharp, 23355142), stained with 0.1% crystal violet (Beyotime Biotechnology, C0121), and colony areas were quantified.

2.11. Enrichment Analysis

Gene Ontology and pathway enrichment analysis was performed using the clusterProfiler (v4.12.6) R package.

2.12. Statistical Analysis

All data are derived from at least three independent biological replicates. Unless otherwise specified, differences between two groups were assessed using unpaired two-tailed Student’s t-test. Data are presented as mean ± SEM. Significance levels are denoted as * p < 0.05, ** p < 0.01, and *** p < 0.001. Analyses were performed in GraphPad Prism 10.

3. Results

3.1. NAS1 Is Downregulated in Multiple Cisplatin-Resistant NSCLC Cells

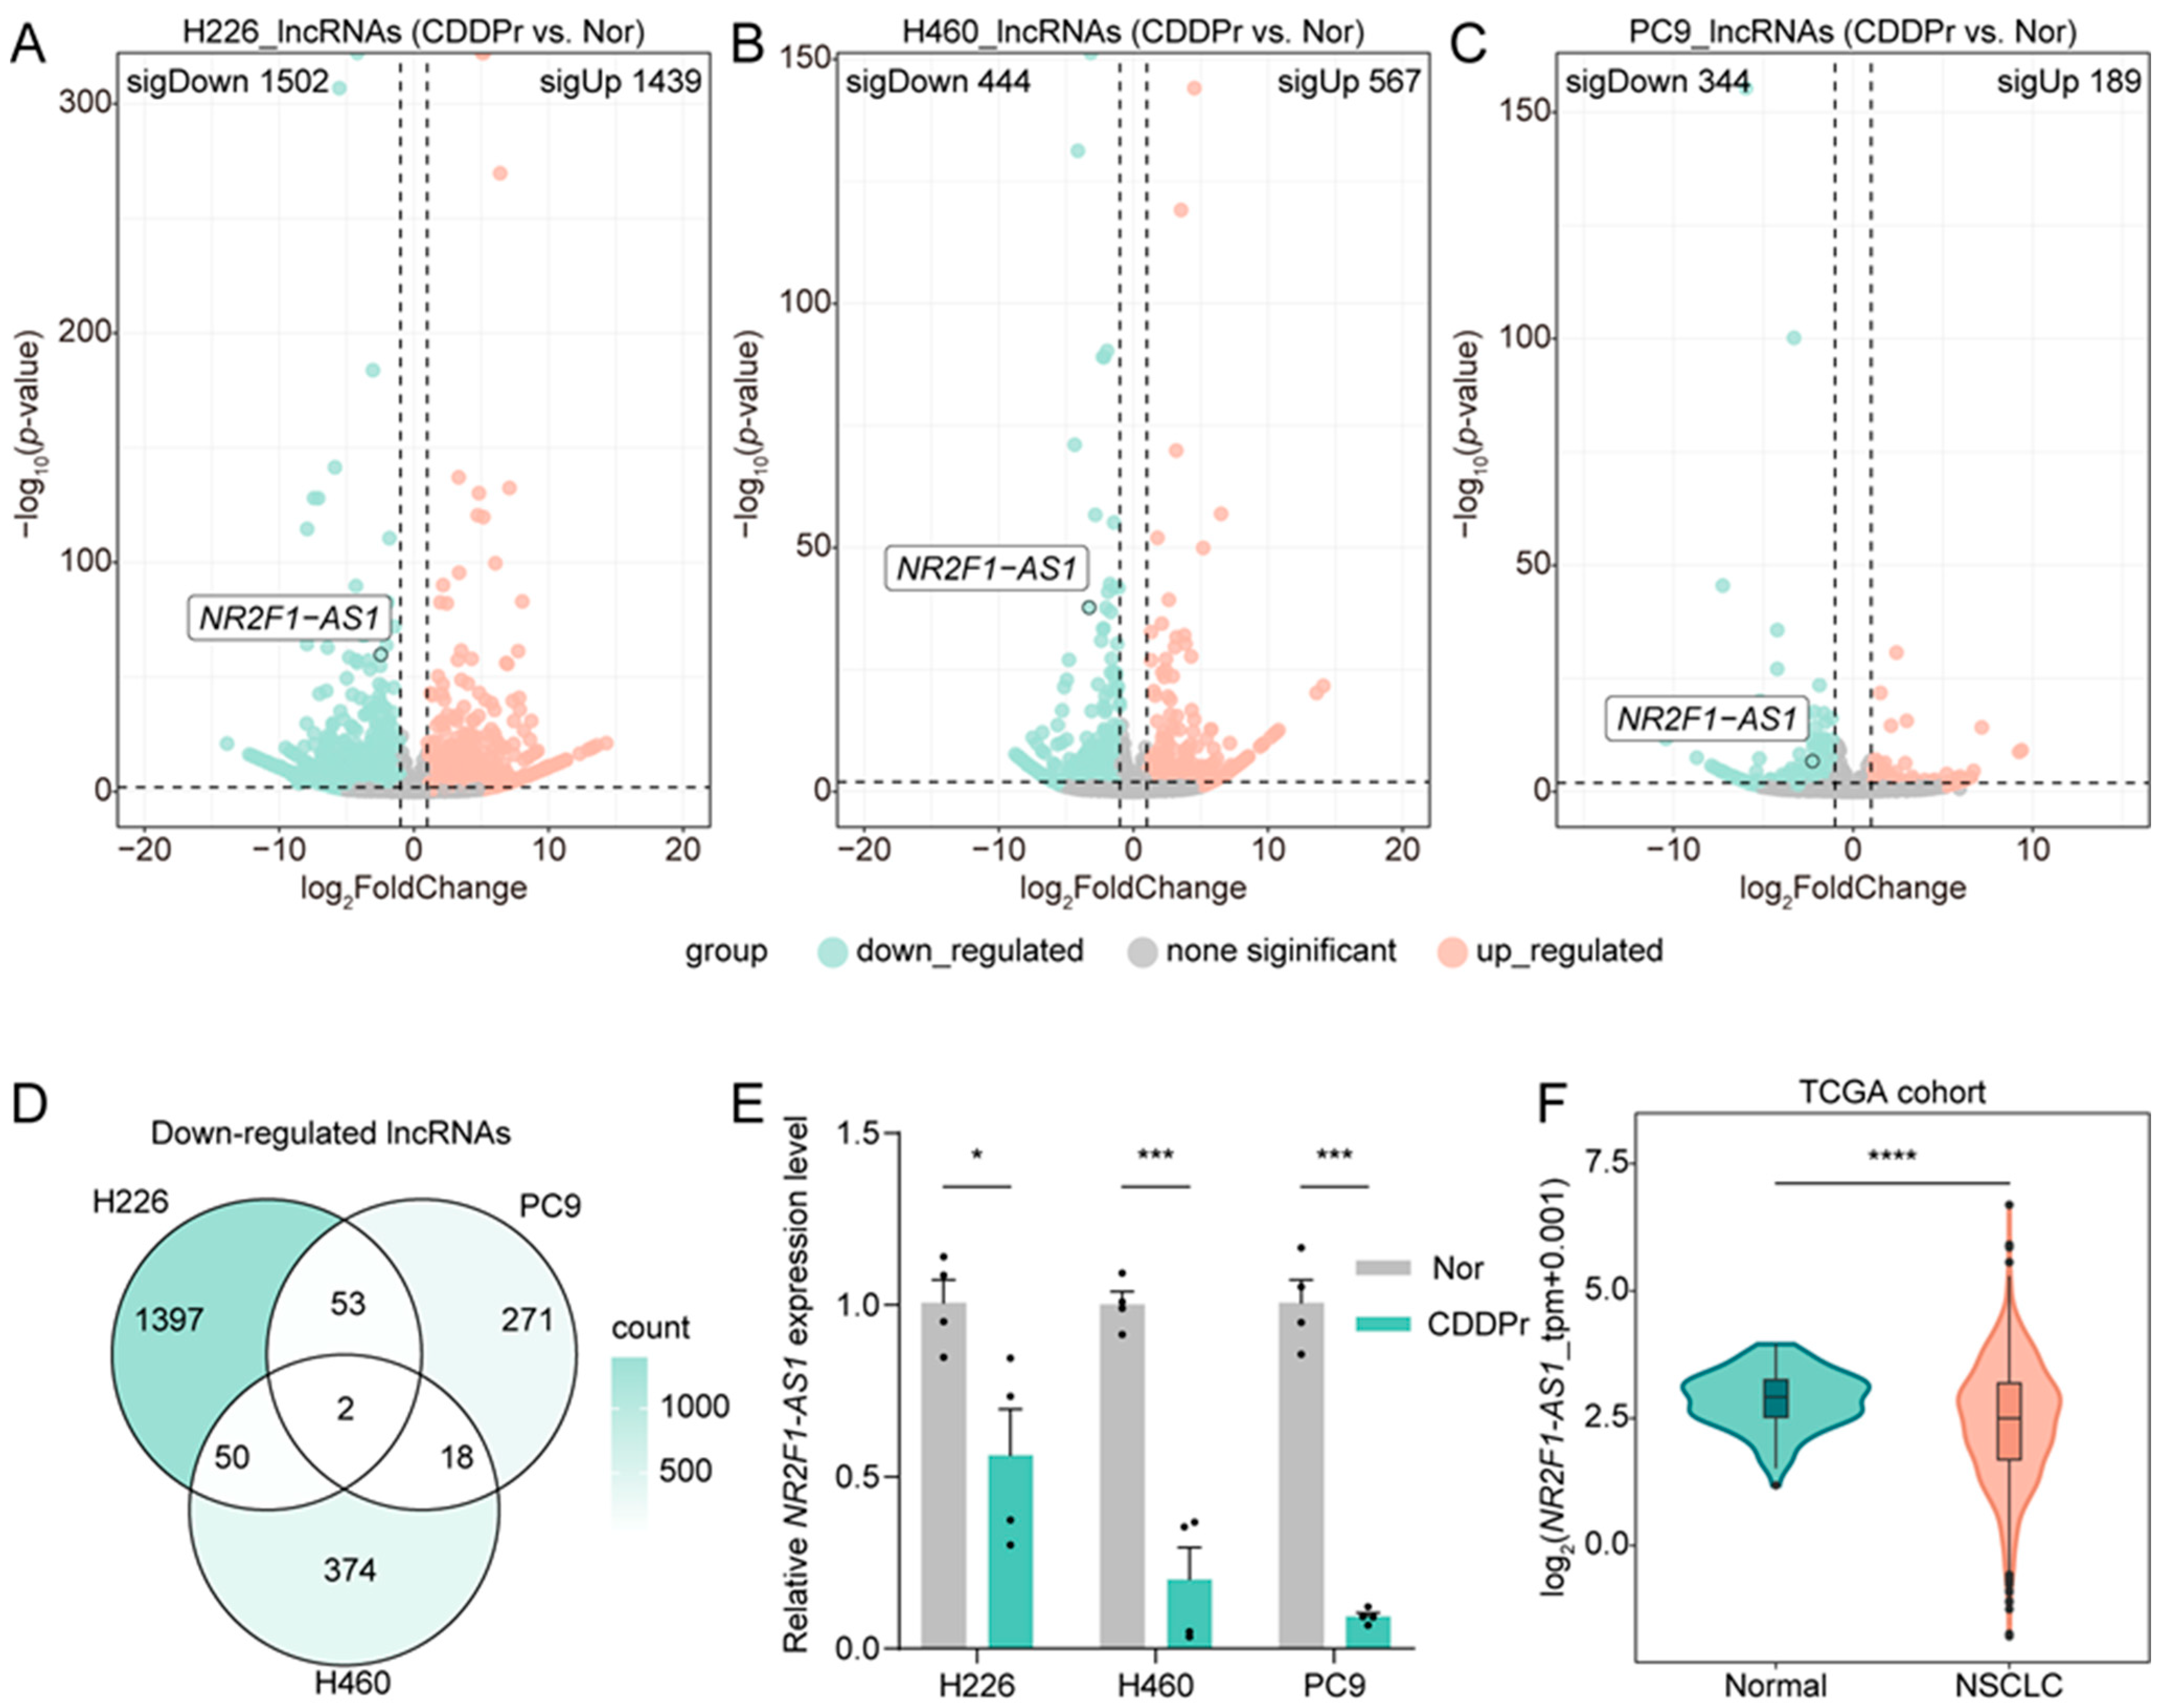
To investigate the role of lncRNAs in cisplatin resistance of NSCLC, we performed transcriptome-wide RNA sequencing to identify differentially expressed lncRNA between three distinct cisplatin-resistant NSCLC cell lines (H226/CDDPr, H460/CDDPr, PC9/CDDPr) and their corresponding parental cells (Figure 1A–C). Widespread dysregulation of lncRNA expression was observed across all resistant cell lines. Notably, H226-resistant cells exhibited thousands of differentially expressed genes, whereas PC9-resistant cells showed a comparatively limited transcriptional response. Analysis revealed two consistently downregulated and eight consistently upregulated lncRNAs across all three resistant cell lines (Figure 1D and Figure S1A). Subsequent validation by quantitative PCR (qPCR) confirmed that only NAS1 was significantly downregulated in all three cisplatin-resistant NSCLC models (Figure 1E and Figure S1B–E). Therefore, we further analyzed The Cancer Genome Atlas (TCGA) NSCLC cohorts and found that NAS1 expression was consistently low in NSCLC (Figure 1F). These findings suggest that NAS1 may play an important role in regulating cisplatin resistance in NSCLC.

3.2. NAS1 Knockdown Increases Cisplatin Resistance in NSCLC Cells

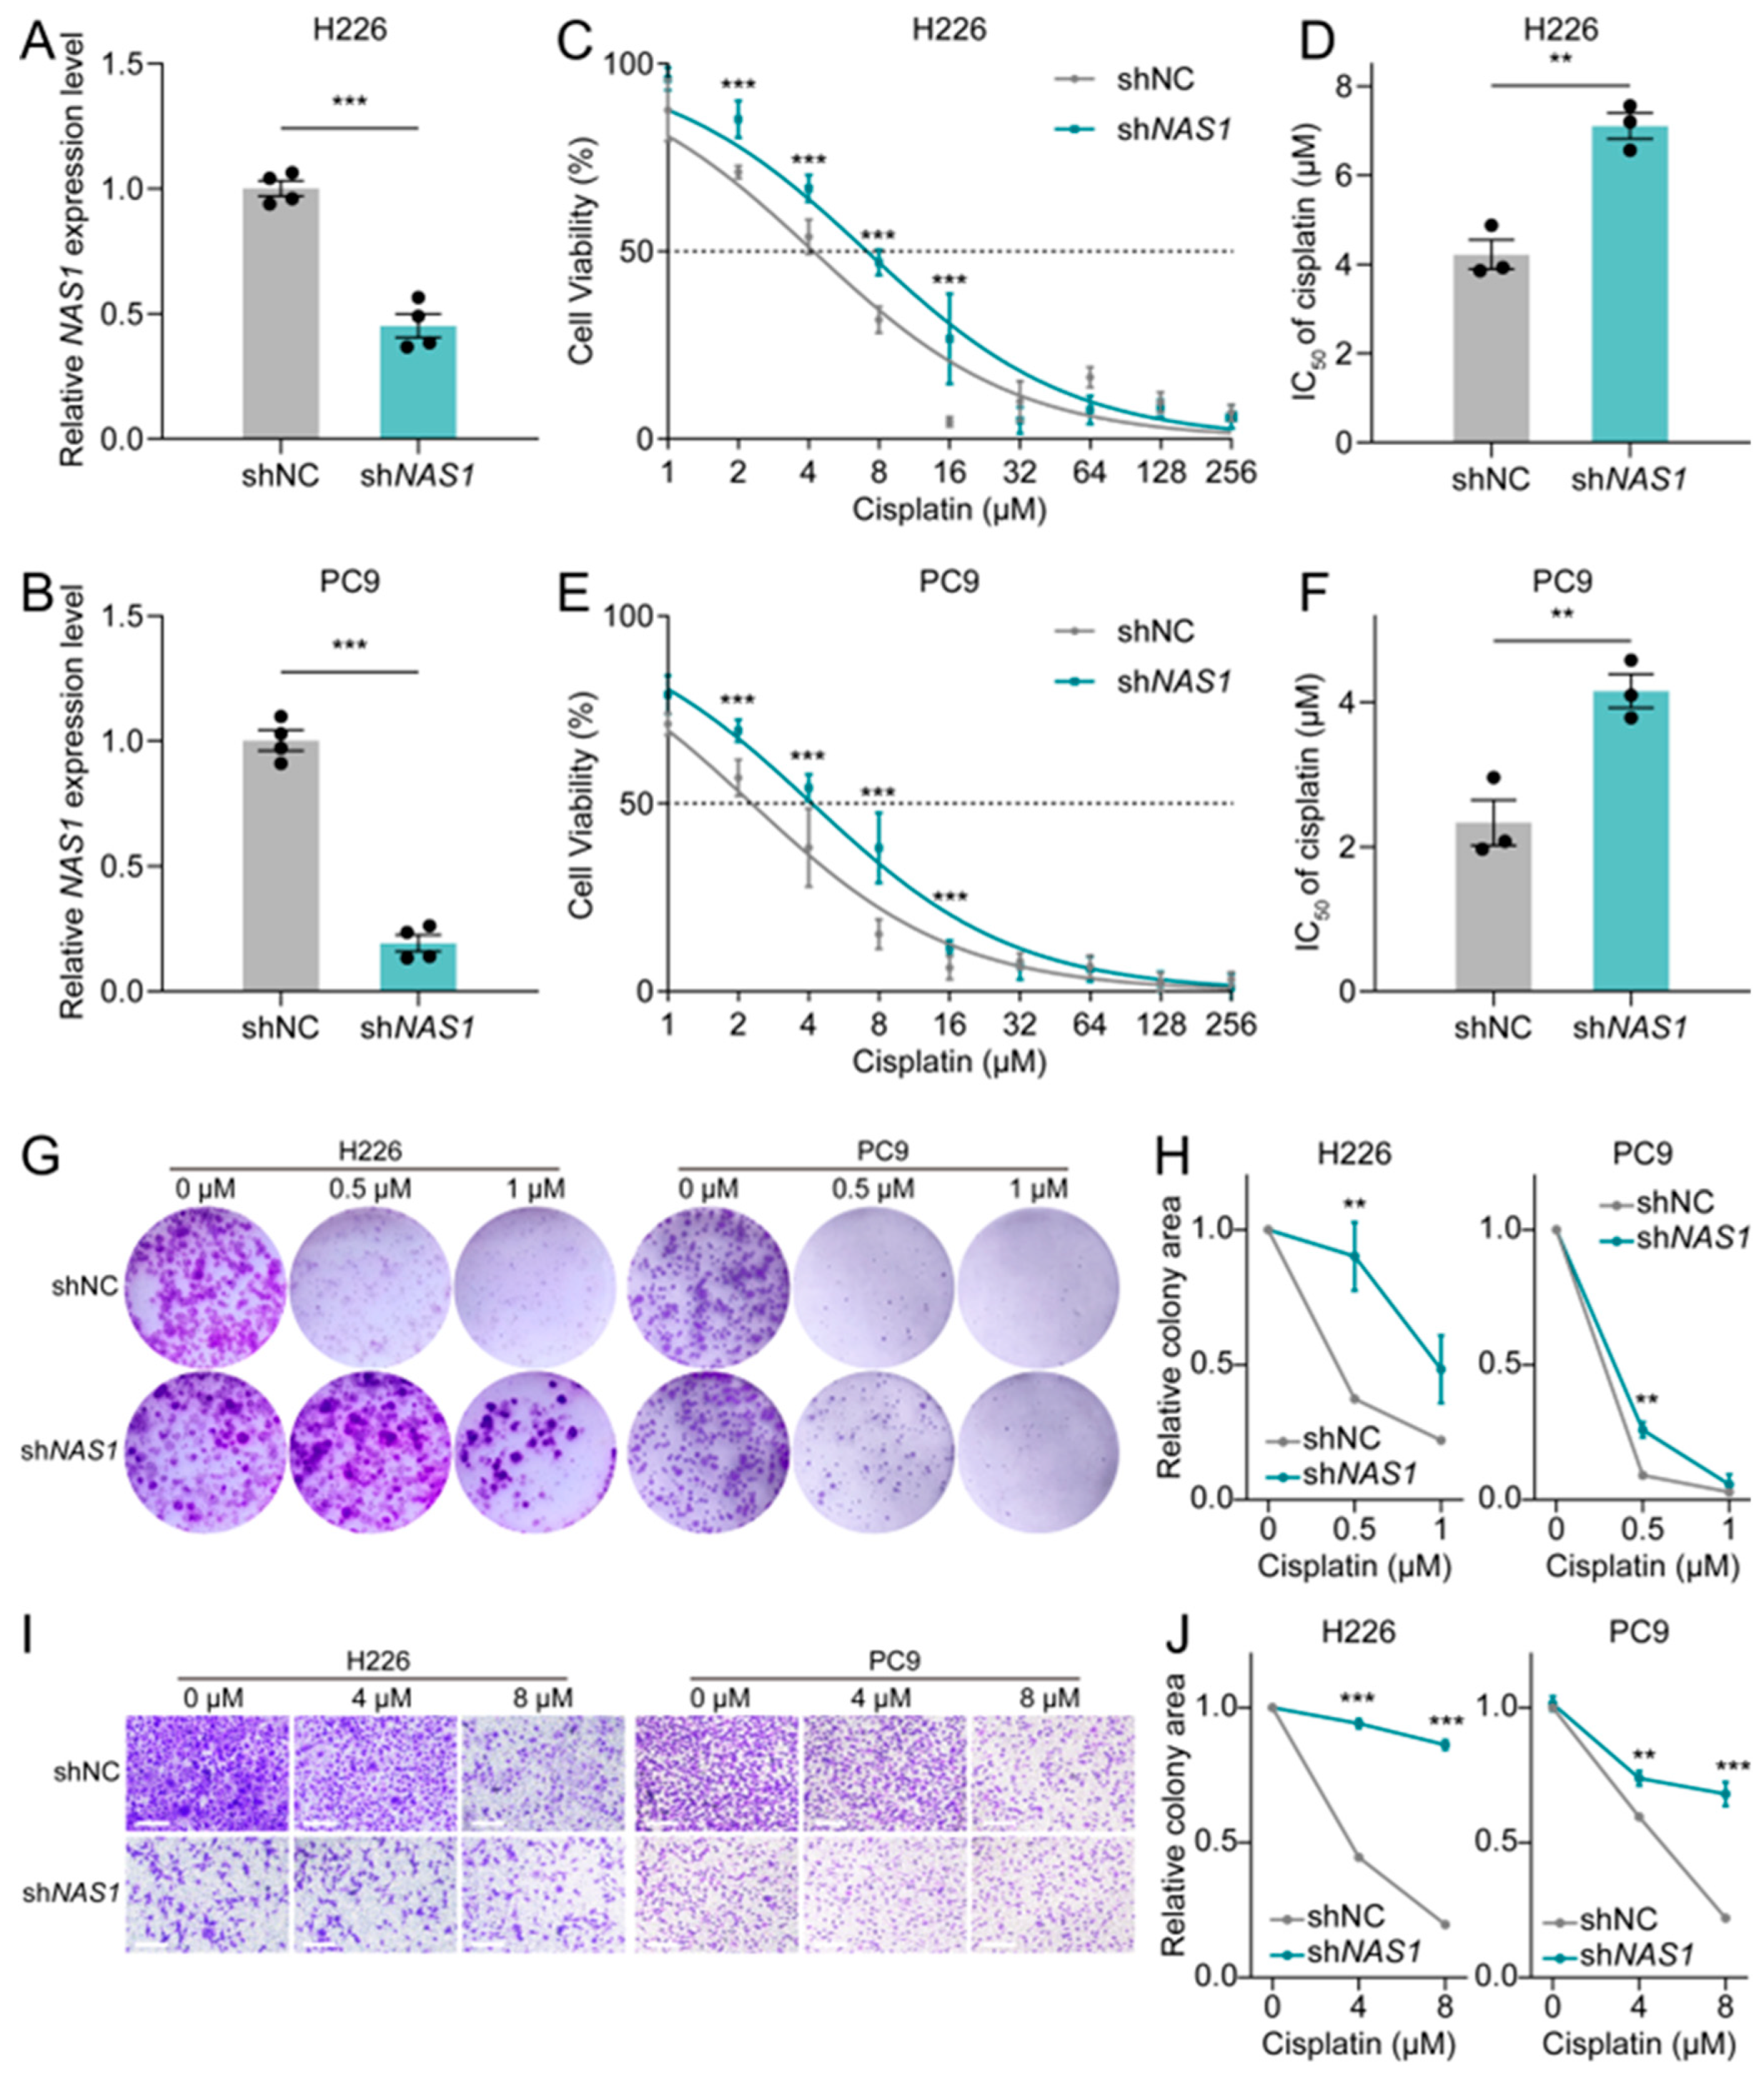
To validate the negative correlation between NAS1 expression and cisplatin resistance, we knocked down NAS1 in H226 and PC9 cell lines by co-transfecting two independent shRNAs targeting different regions of the NAS1 transcript (Figure 2A,B). Evaluation of the effect of NAS1 knockdown on cisplatin sensitivity showed that loss of NAS1 led to a roughly 2-fold elevation in the IC50 of cisplatin in both cell lines examined (Figure 2C–F). Moreover, NAS1 depletion markedly attenuated the inhibitory effects of cisplatin on colony formation and cell migration (Figure 2G–J). Taken together, these findings implicate that downregulation of NAS1 promotes cisplatin resistance in NSCLC.

3.3. The NAS1-Translational Regulated Gene NR2F1 Confers Cisplatin Resistance to NSCLC Cells upon Its Downregulation

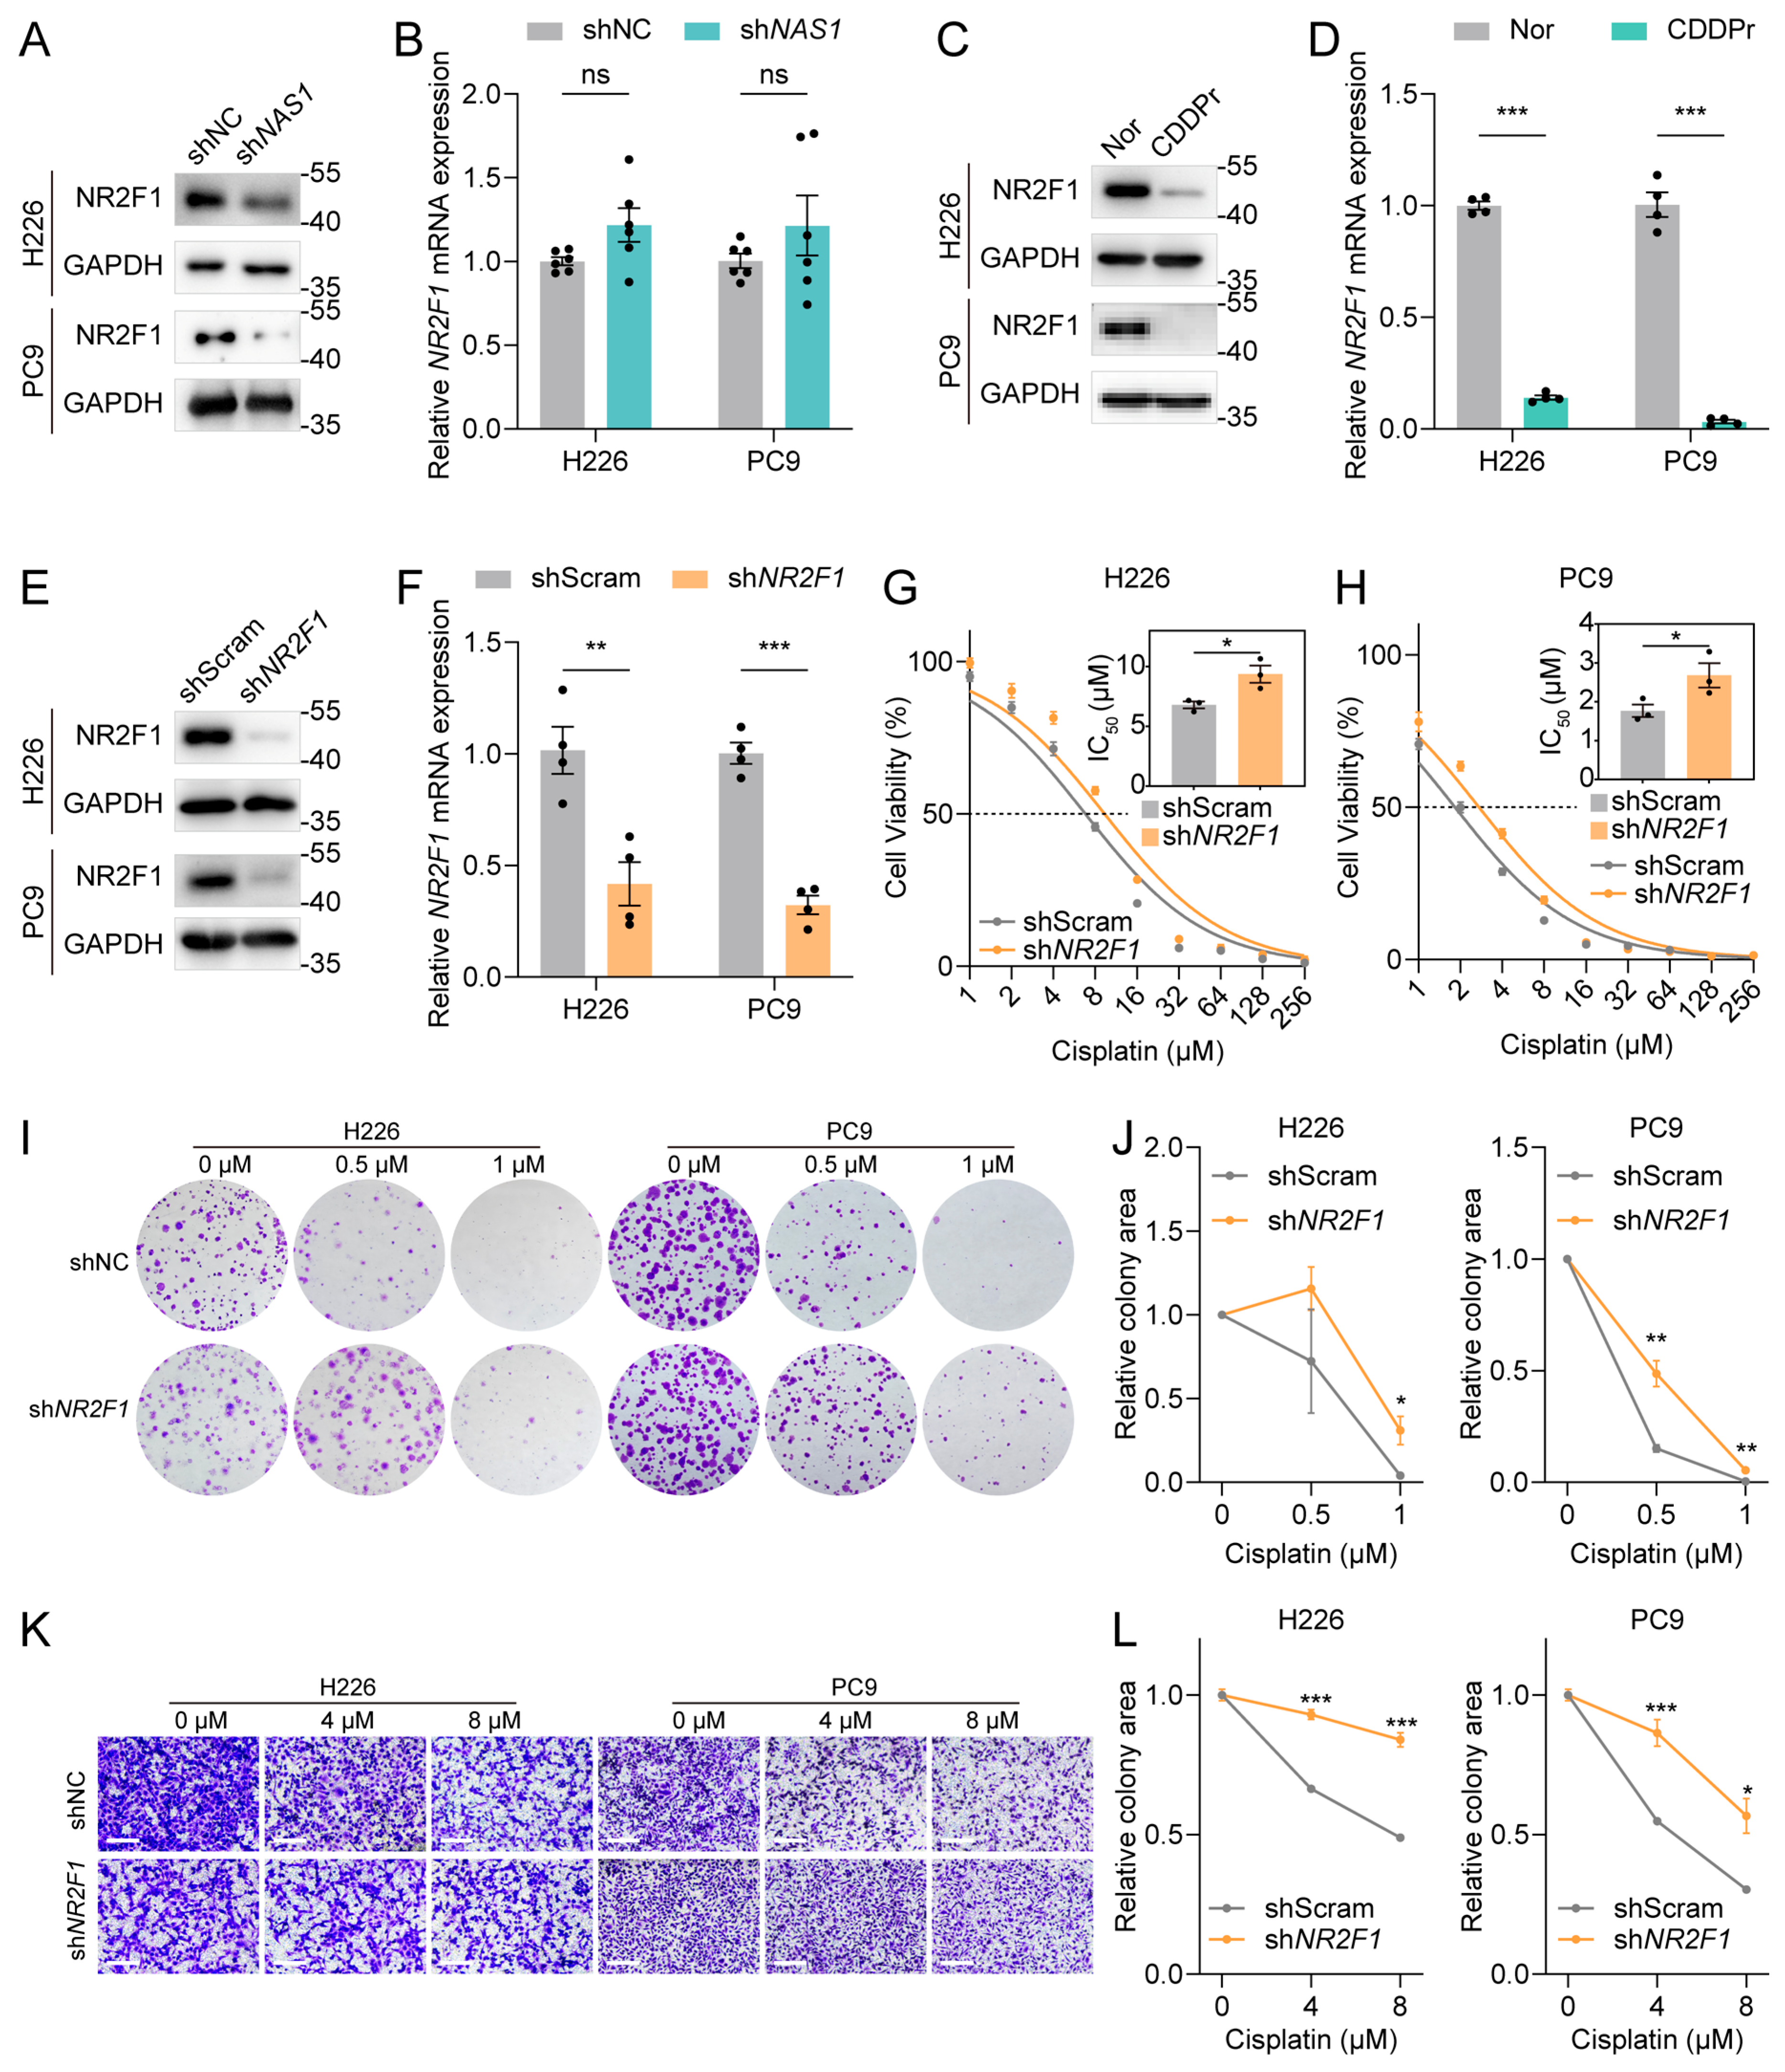
To elucidate the molecular mechanism by which NAS1 regulates cisplatin resistance, we focused on NR2F1, a gene located adjacent to NAS1 that encodes a transcription factor previously reported to be translationally regulated by NAS1 and implicated in drug resistance [9,10]. To assess whether NAS1 mediates cisplatin resistance through NR2F1, we first confirmed their regulatory relationship. Consistent with prior studies, NAS1 knockdown reduced NR2F1 protein levels without affecting its mRNA expression (Figure 3A,B). Notably, both NR2F1 mRNA and NR2F1 protein levels were downregulated in cisplatin-resistant cells (Figure 3C,D), suggesting that reduced NR2F1 expression may contribute to cisplatin resistance. We then knocked down NR2F1 (Figure 3E,F) and evaluated its effect on drug sensitivity. Similar to NAS1 knockdown, NR2F1 depletion significantly increased the IC50 of cisplatin (Figure 3G,H) and attenuated cisplatin-induced suppression of colony formation and cell migration (Figure 3I–L). These findings indicate that NR2F1 downregulation promotes cisplatin resistance and that NR2F1 appears to act as a downstream target of NAS1 in mediating the resistant phenotype.

3.4. Overexpression of NR2F1 Alleviates Cisplatin Resistance Caused by NAS1 Knockdown

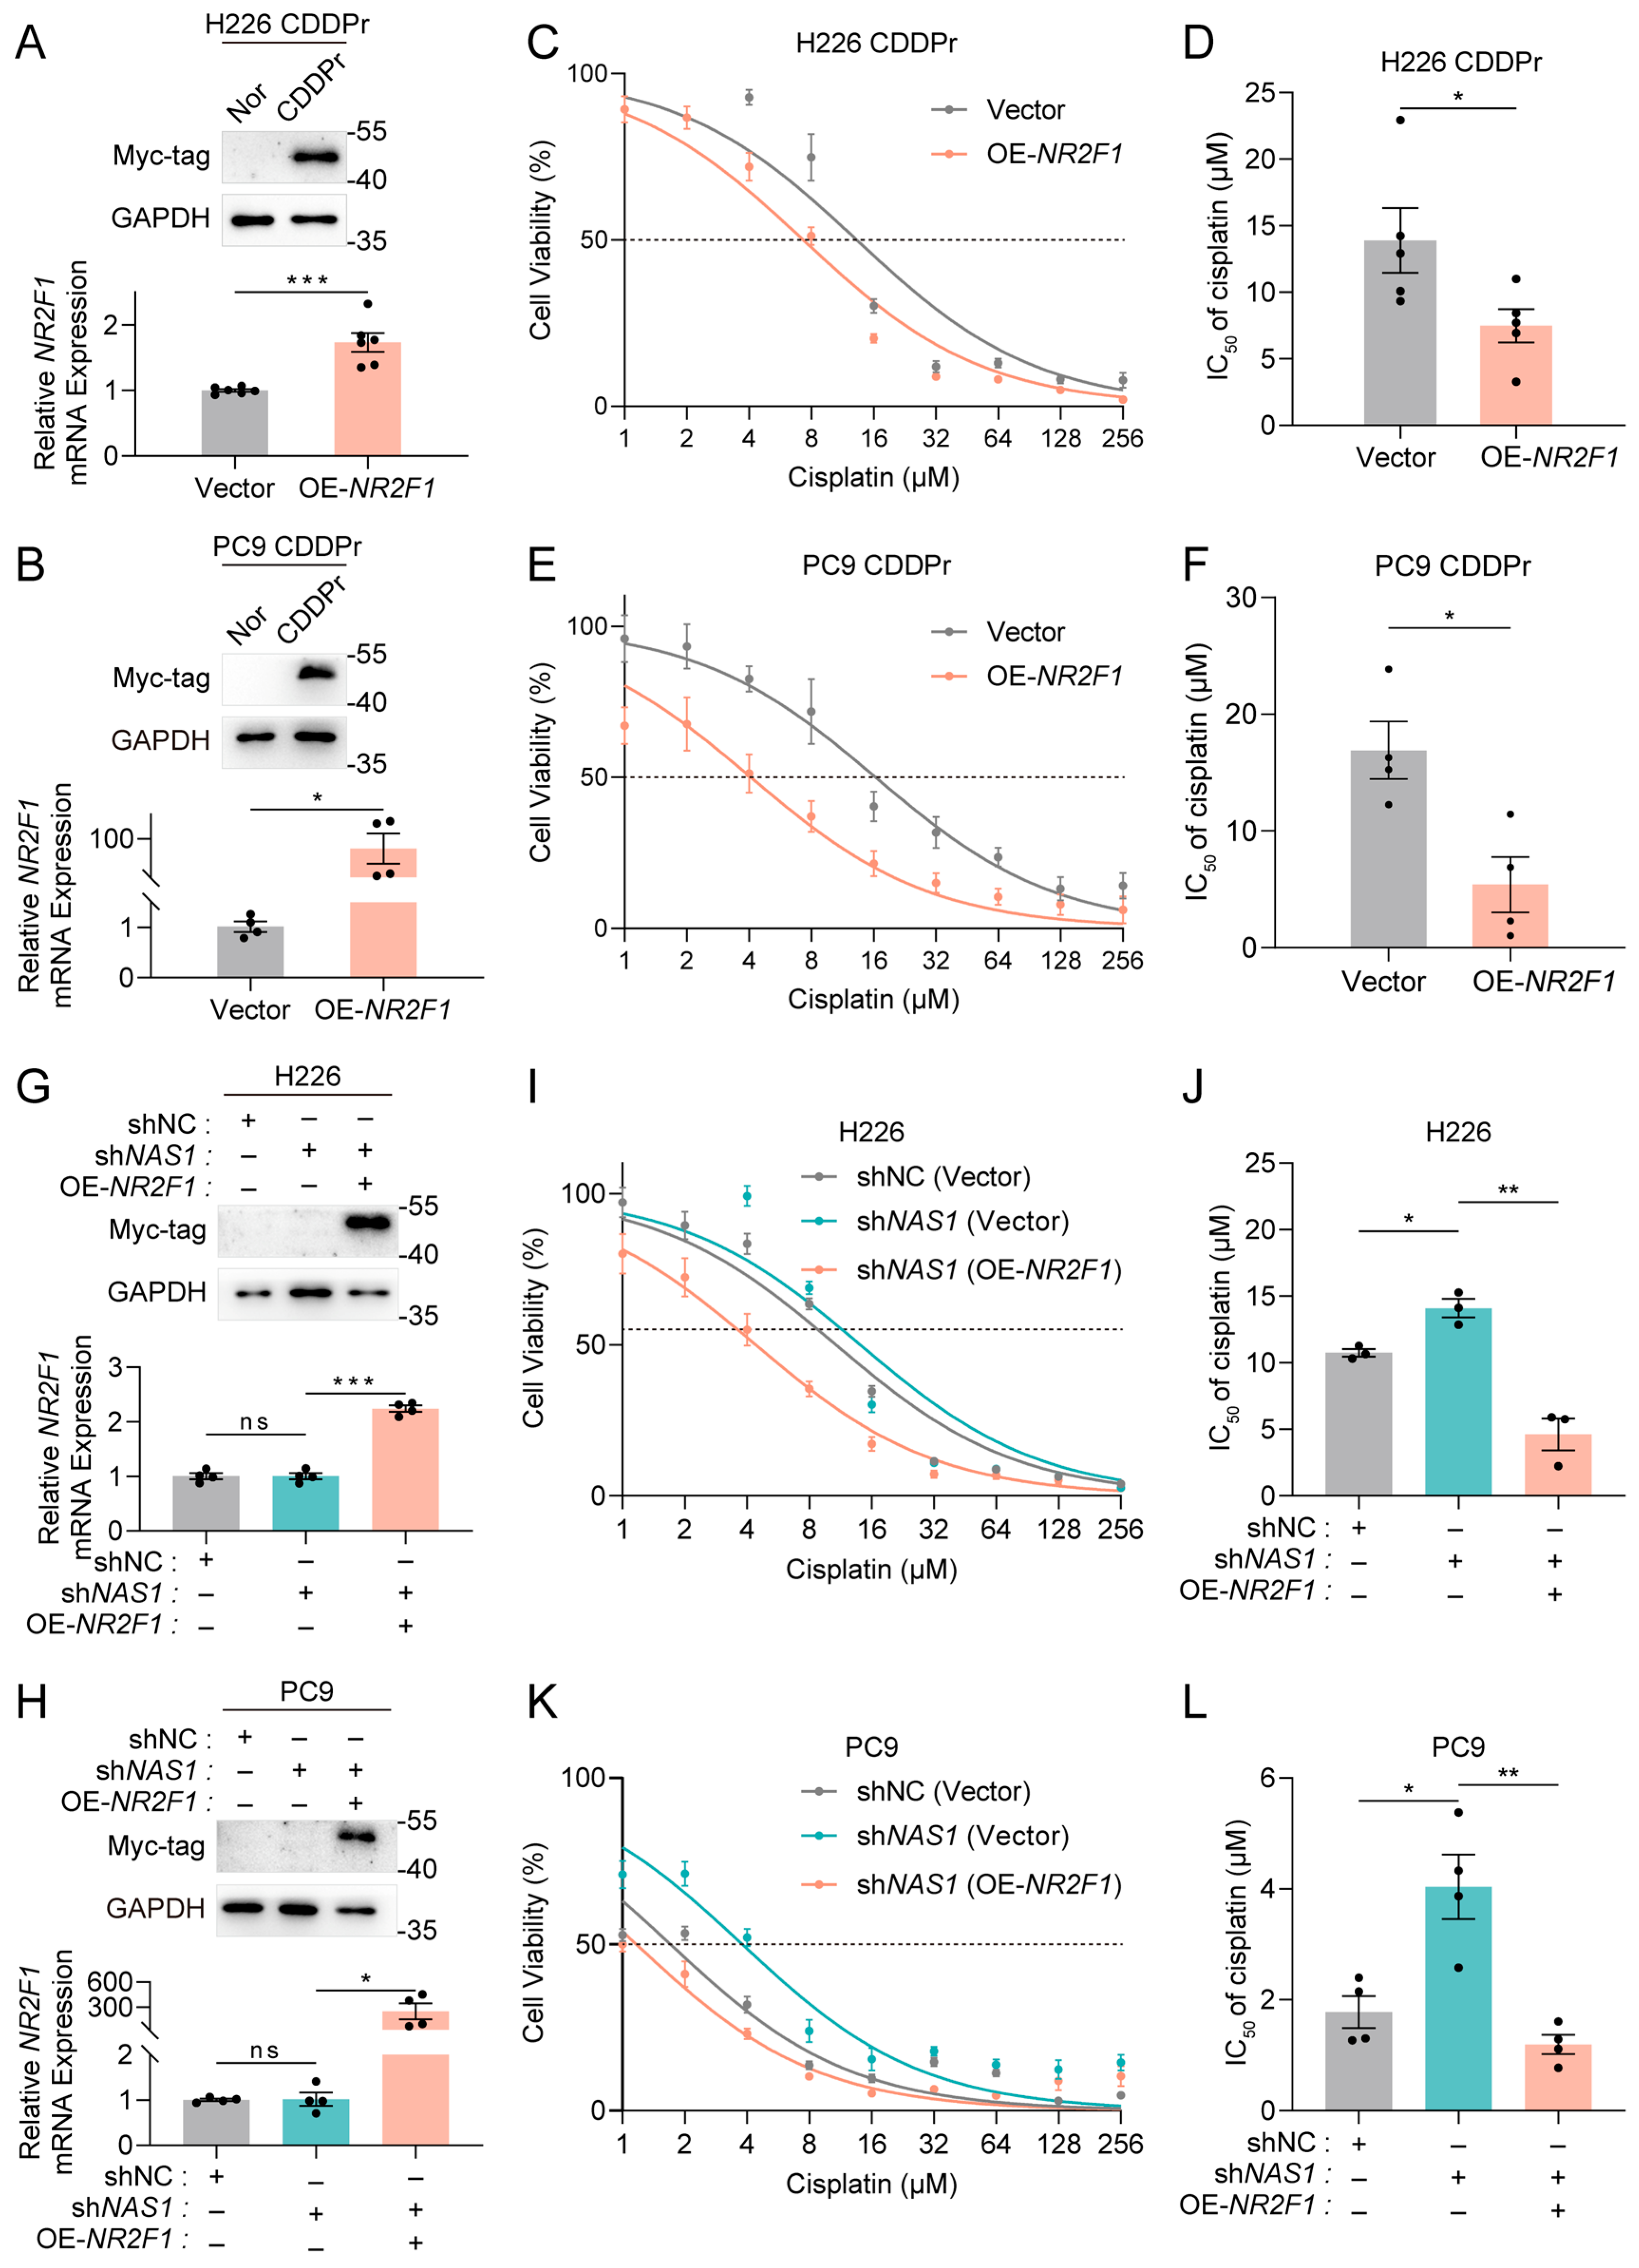
To further verify whether NR2F1 is required for NAS1-mediated cisplatin resistance, we performed a rescue experiment by overexpressing NR2F1 in two cisplatin-resistant cell lines (in which both NAS1 and NR2F1 are downregulated) and evaluated its impact on drug sensitivity (Figure 4A,B). The results showed that NR2F1 overexpression significantly reduced the IC50 of cisplatin in both resistant cell lines (Figure 4C–F). In H226-CDDPr cells, the IC50 decreased from approximately 13.91 μM to 7.49 μM, representing a nearly 2-fold reduction. In PC9-CDDPr cells, a more pronounced decrease was observed, with the IC50 dropping from 16.92 μM to 5.42 μM. These findings indicate that restoring NR2F1 expression effectively sensitizes cisplatin-resistant cells to treatment.
Moreover, restoring NR2F1 expression effectively rescued the cisplatin resistance induced by NAS1 knockdown (Figure 4G–L). In H226 cells, NR2F1 restoration lowered the IC50 from 14.1 μM to 4.63 μM, a reduction of approximately 67.16%. In PC9 cells, the IC50 decreased even more sharply, from 4.04 μM to 1.19 μM, corresponding to a 70.54% reduction. Collectively, these findings demonstrate that NR2F1 is a functional downstream target of NAS1 and is necessary for mediating cisplatin resistance in NSCLC.

3.5. NR2F1 Regulates Cisplatin Resistance in NSCLC Through the Transcriptional Repression of TGFB1

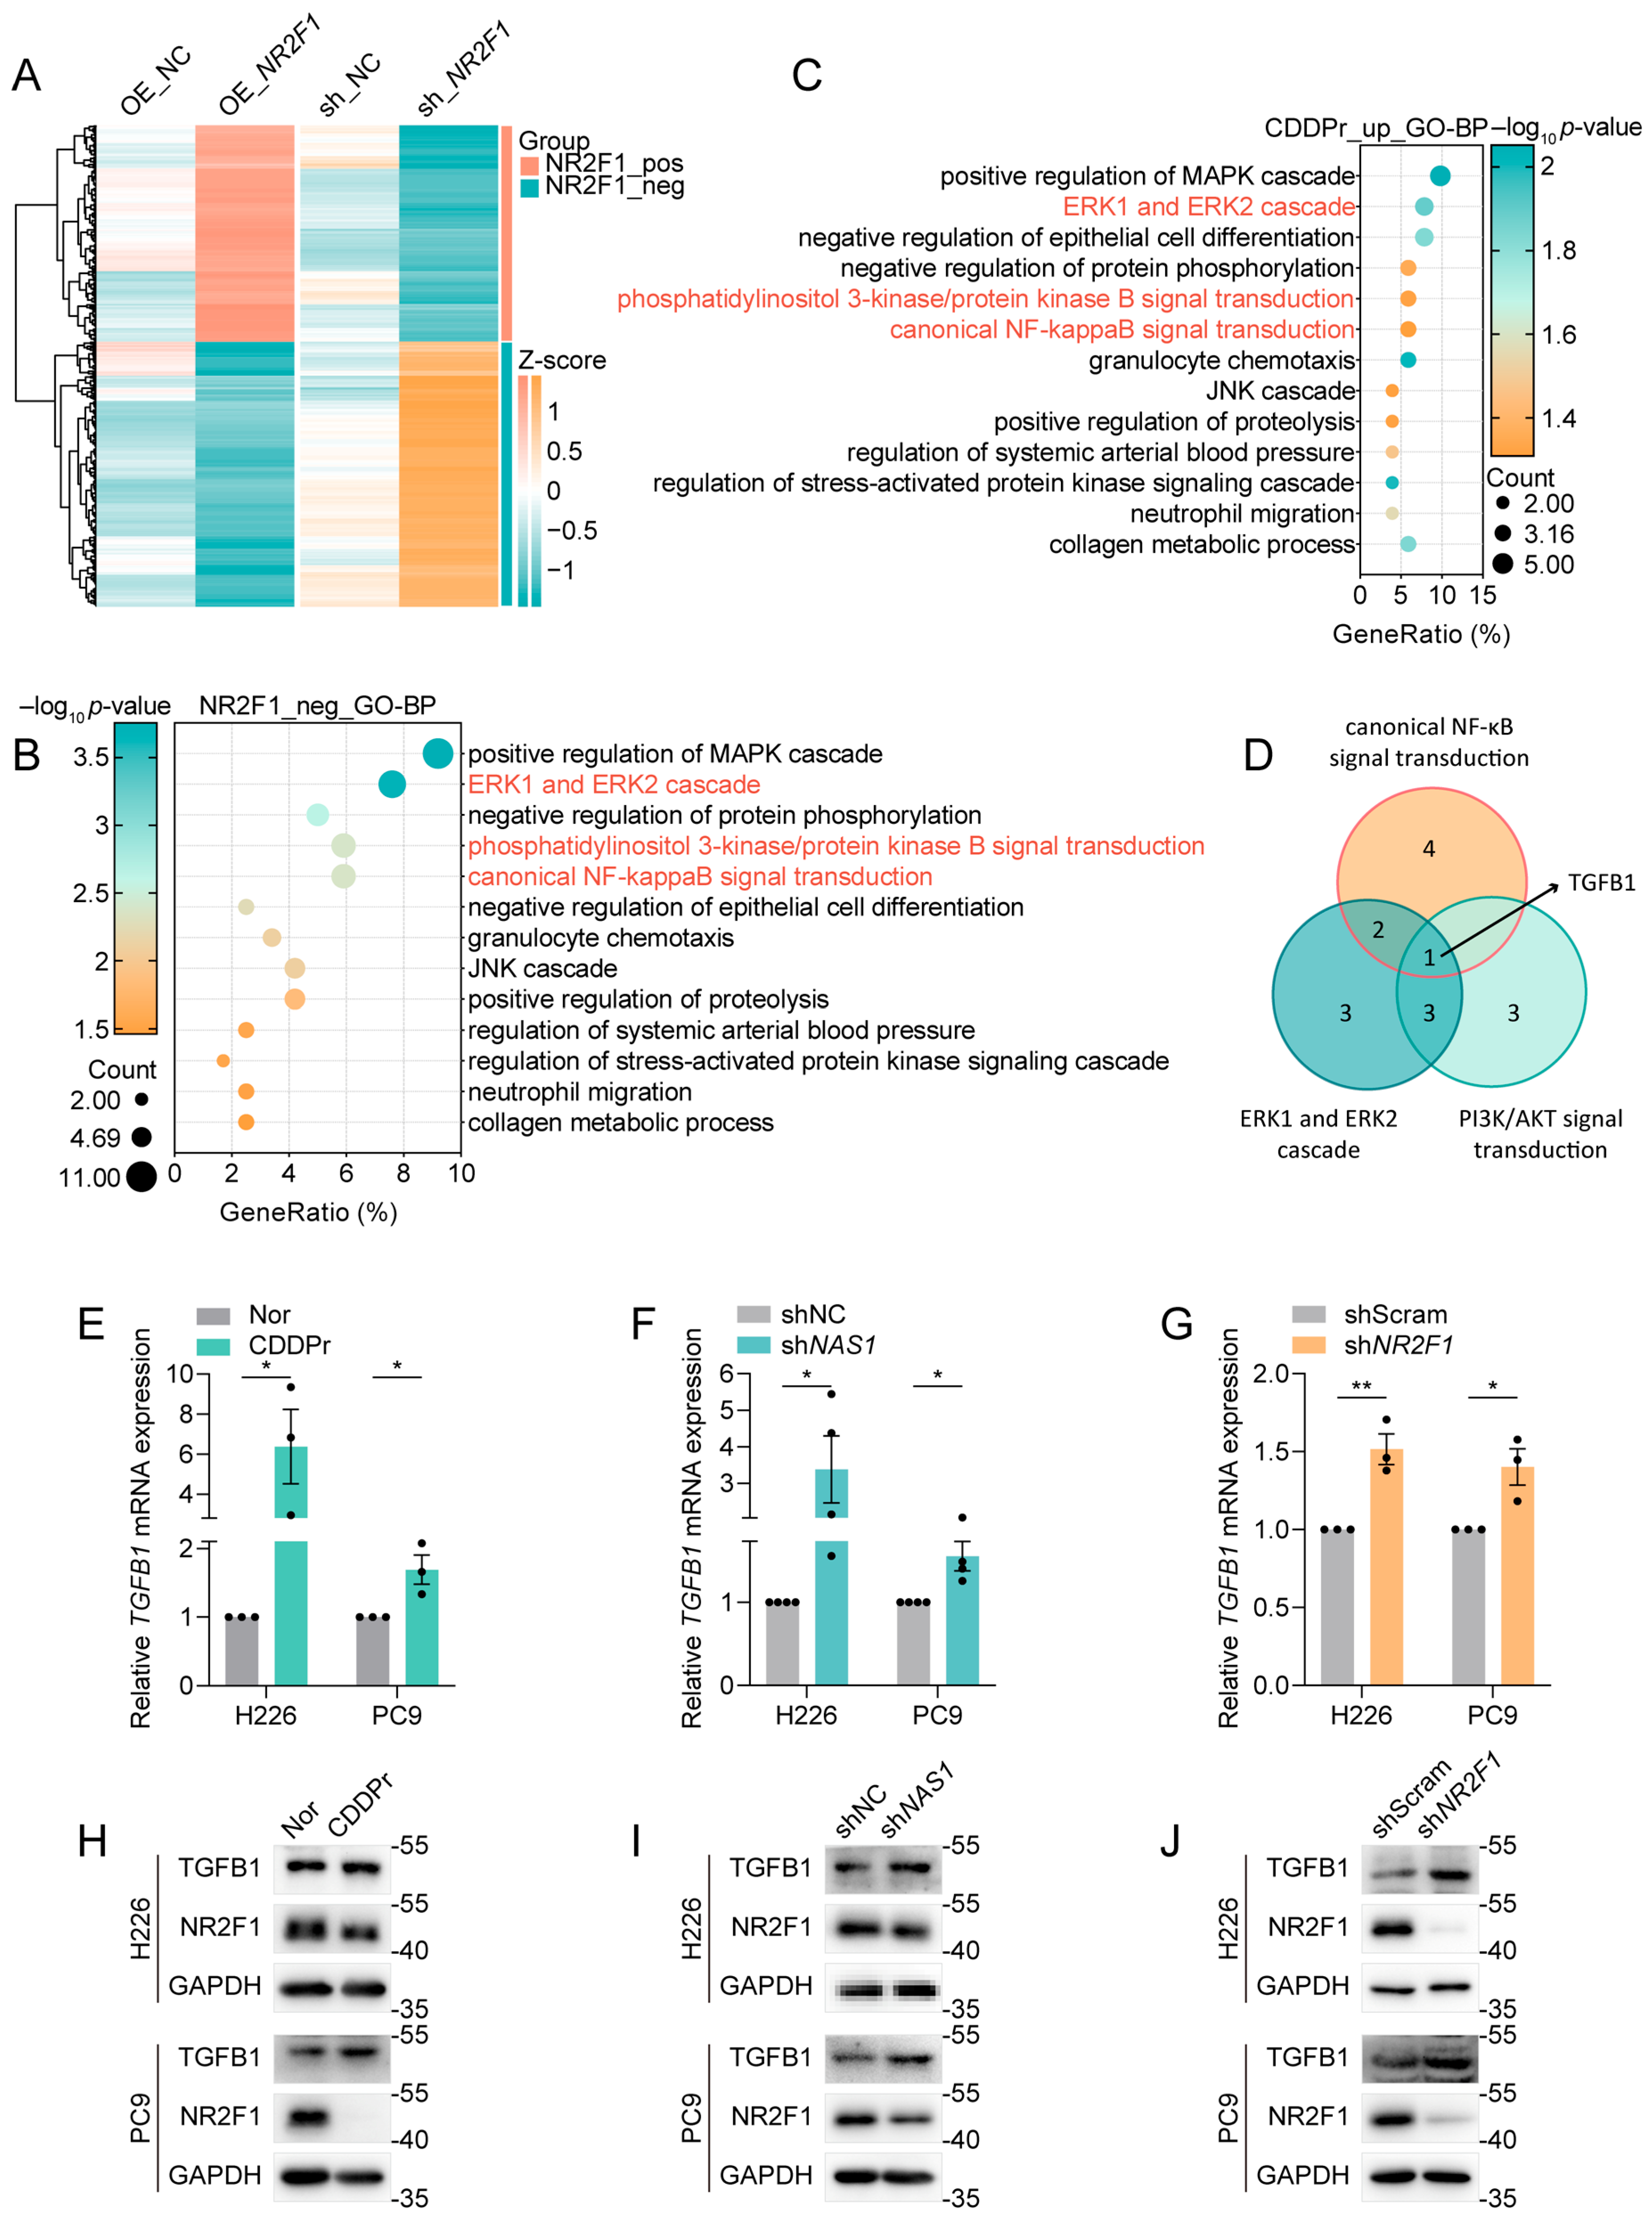
To elucidate the downstream molecular mechanisms by which the NAS1-NR2F1 axis regulates cisplatin resistance, we analyzed RNA-seq datasets (GSE233167) from gastric cancer cells following NR2F1 knockdown or overexpression. Given that the transcription factor NR2F1 has been reported to act as a transcriptional repressor of ΔNp63 [9], we focused on genes negatively regulated by NR2F1 (i.e., upregulated upon NR2F1 knockdown and downregulated upon NR2F1 overexpression) (Figure 5A). GO enrichment analysis revealed that these NR2F1-repressed genes were enriched in multiple drug resistance-associated signaling pathways (Figure 5B), which were similarly enriched among genes upregulated in cisplatin-resistant cells (Figure 5C). Among these pathways, NF-κB signaling, PI3K/AKT signaling, and the ERK1/ERK2 cascade have previously been linked to cisplatin resistance upon activation [4,15]. Notably, transforming growth factor-β1 (TGFβ1, TGFB1) was the only NR2F1-repressed gene involved in all three pathways (Figure 5D) and has been reported to promote drug resistance in various cancers [16,17,18]. These findings suggested that TGFB1 may be a key downstream target of the NAS1-NR2F1 axis. Subsequent qPCR validation confirmed that TGFB1 expression was upregulated in cisplatin-resistant NSCLC models as well as in NAS1- and NR2F1-knockdown cells (Figure 5E–G). Western blot analysis further confirmed the protein-level changes in NR2F1 and TGFB1 in these models. Consistent with the transcriptional results, cisplatin-resistant, NAS1-knockdown, and NR2F1-knockdown H226 and PC9 cells showed reduced NR2F1 protein expression accompanied by increased TGFB1 protein levels (Figure 5H–J). Together, these results demonstrate that TGFB1 acts as a downstream effector of the NAS1-NR2F1 axis and confers cisplatin resistance through the regulation of multiple signaling pathways.

3.6. Activation of the NF-κB Pathway by the Downregulated NAS1-NR2F1 Axis Drives Cisplatin Resistance

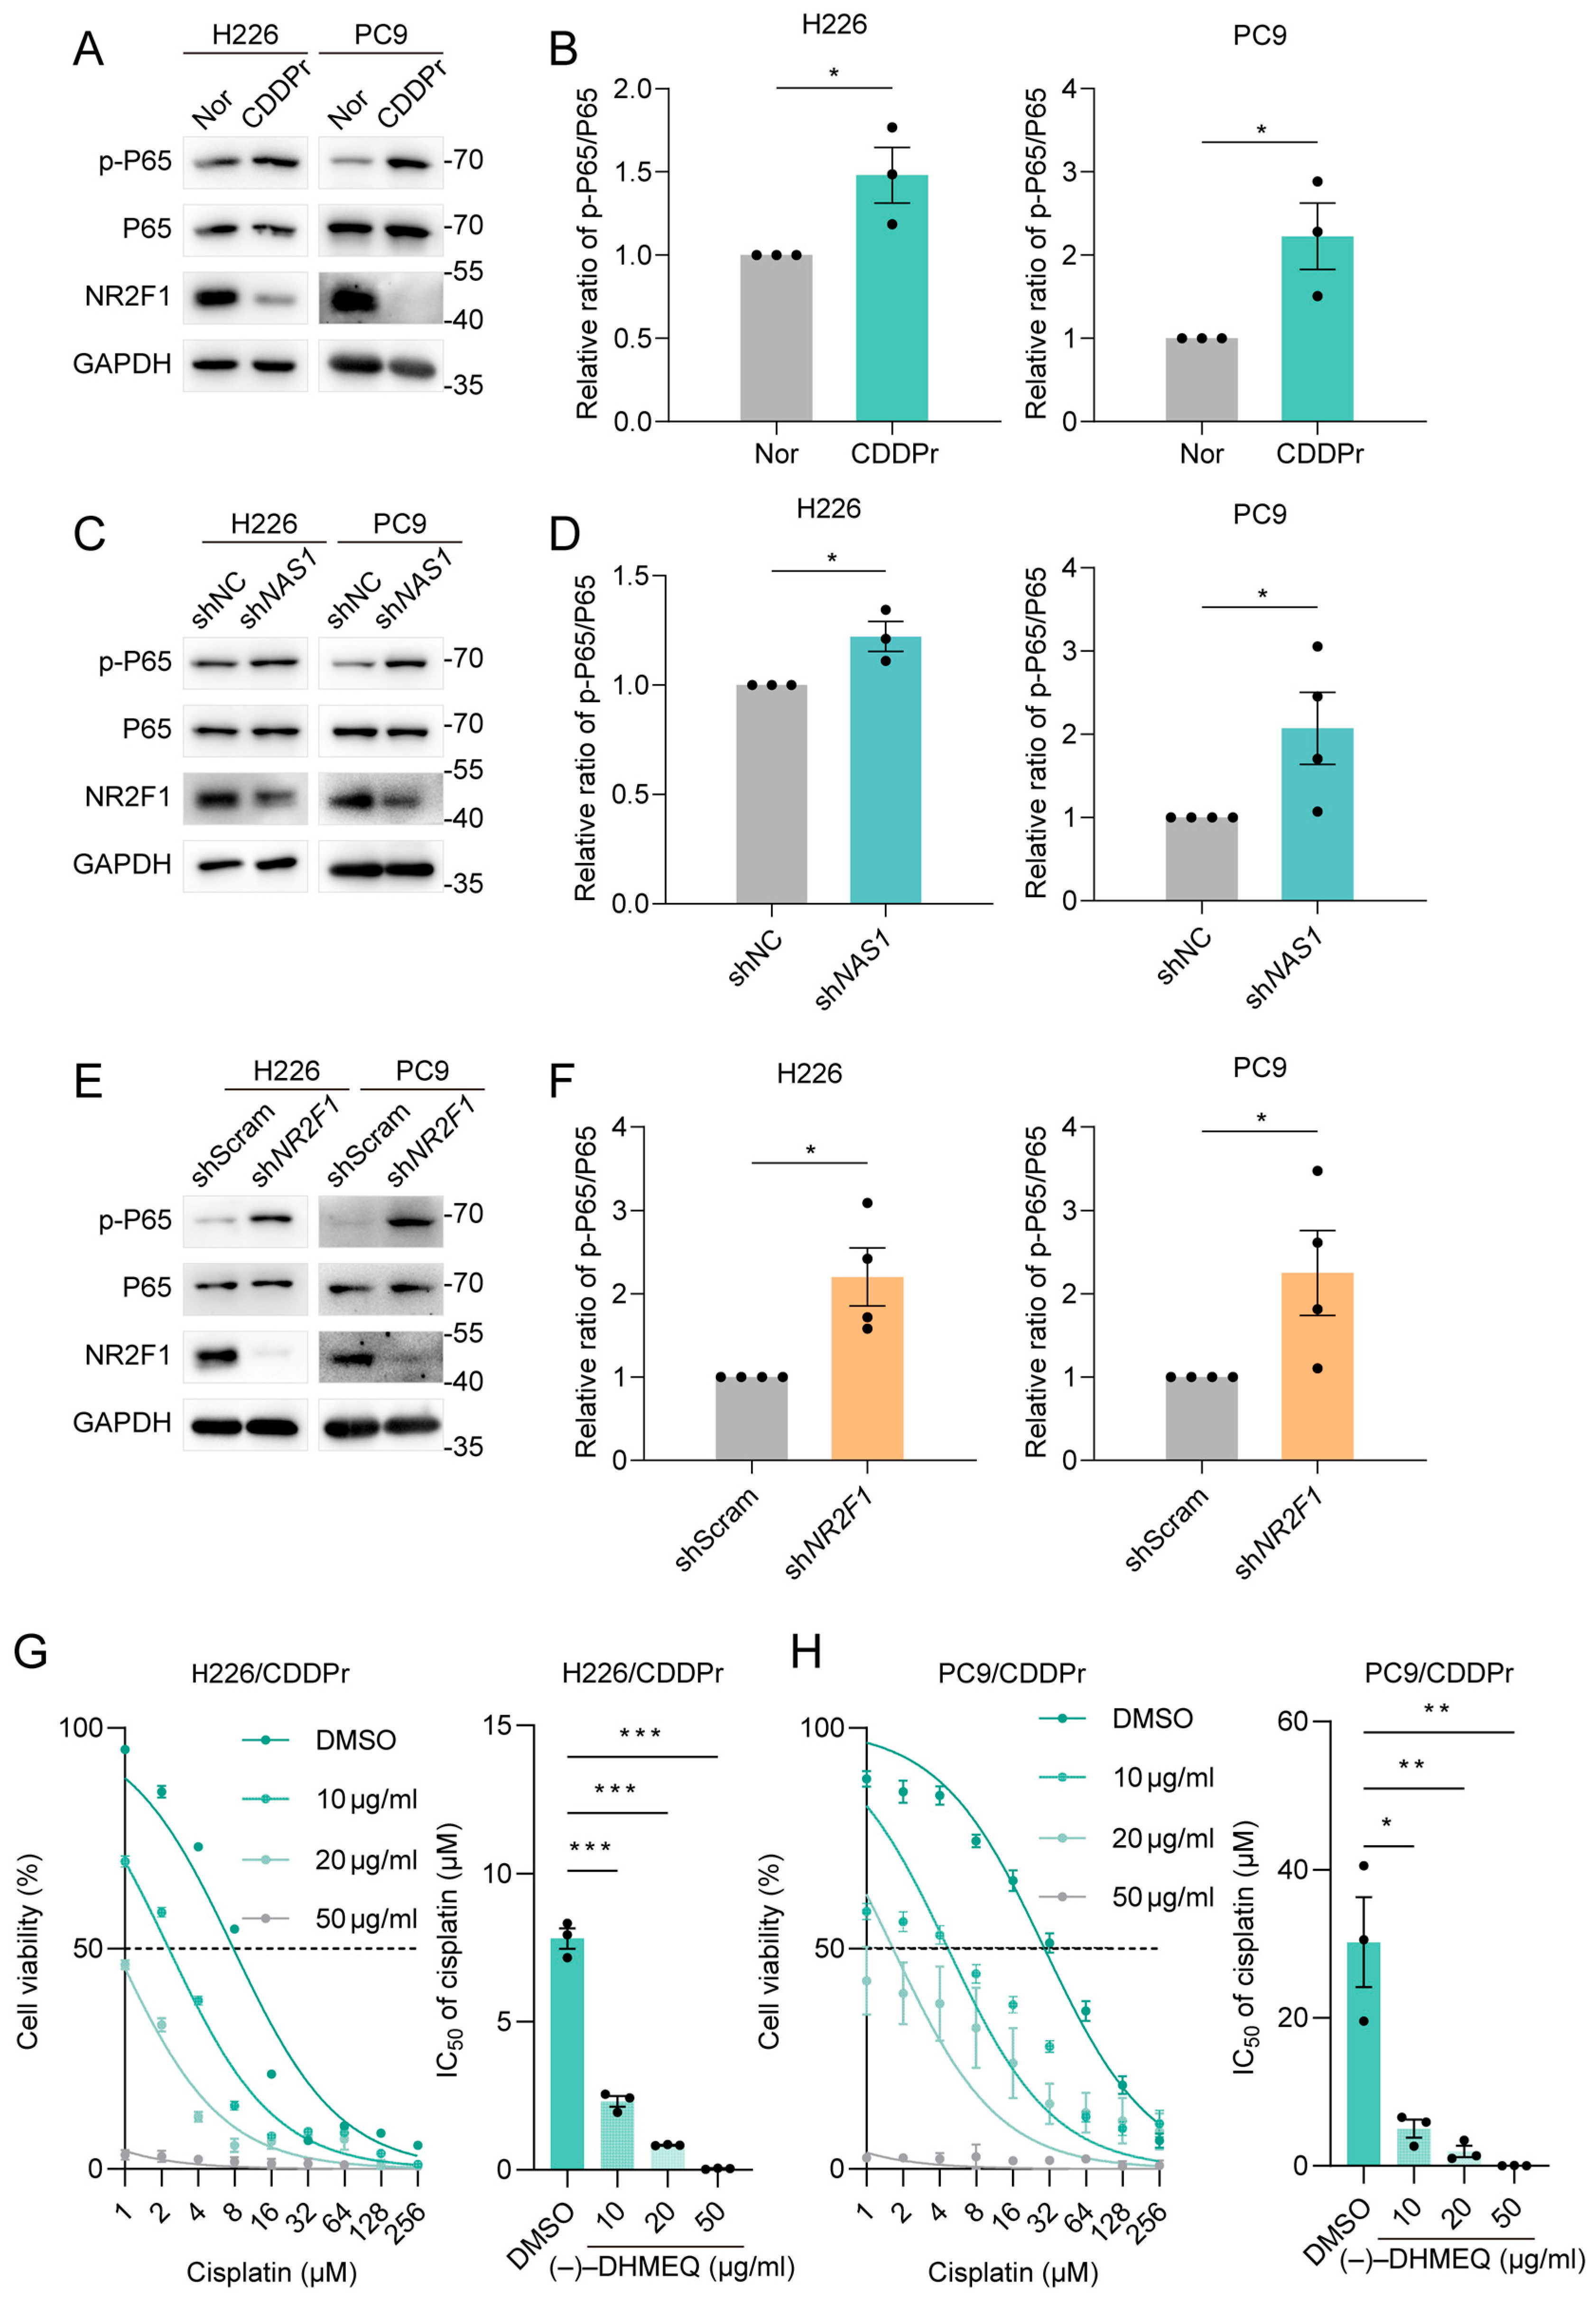
NF-κB hyperactivation is a known driver of chemoresistance, often through the upregulation of anti-apoptotic genes [15,19,20]. Furthermore, TGFB1 has been shown to activate NF-κB in other cancer contexts to promote a drug-resistant phenotype [18]. To test this link in our model, we examined the NF-κB activity. Immunoblot analysis revealed a consistent increase in the levels of phosphorylated p65 (p-p65), a marker of NF-κB activation, in both H226 and PC9 cisplatin-resistant cells (Figure 1E and Figure 6A,B). Notably, this elevation in p-p65 was inversely correlated with the downregulated expression of both NAS1 and NR2F1 in these resistant cells (Figure 1E and Figure 6A,B). We then performed loss-of-function experiments. Strikingly, the specific knockdown of either NAS1 or NR2F1 in parental NSCLC cells was sufficient to recapitulate the resistance-associated phenotype, leading to a marked increase in p-p65 levels (Figure 6C–F) and subsequent NF-κB transcriptional activity. To further determine whether NF-κB activation functionally contributes to cisplatin resistance, we treated cisplatin-resistant H226/CDDPr and PC9/CDDPr cells with the NF-κB inhibitor DHMEQ and assessed cisplatin sensitivity. DHMEQ treatment reduced the IC50 of cisplatin in both resistant cell lines in a dose-dependent manner, indicating that inhibition of NF-κB partially restored cisplatin sensitivity (Figure 6G,H). These results provide functional evidence that NF-κB activation contributes to the maintenance of the cisplatin-resistant phenotype in NSCLC cells.
Collectively, these findings delineate a comprehensive signaling cascade underlying cisplatin resistance in NSCLC. We proposed a model in which downregulation of NAS1 impairs the translation of NR2F1. The subsequent loss of NR2F1 relieves its transcriptional repression of TGFB1, leading to increased TGFB1 expression. Upregulated TGFB1 subsequently activates the downstream NF-κB pathway, ultimately driving the acquisition and maintenance of the cisplatin-resistant phenotype.

4. Discussion

The development of cisplatin resistance remains a major obstacle in the treatment of NSCLC. It is crucial to improve chemosensitivity and prevent or bypass chemoresistance to enhance the prognosis of NSCLC patients [21]. Therefore, developing novel potential targets related to chemotherapeutic treatment response rates, as well as revealing the underlying mechanisms, is essential for optimizing clinical chemotherapeutical schemes and the treatment of NSCLC. Emerging evidence has highlighted the involvement of NAS1, including NSCLC, in tumor development [8], but the specific roles and mechanisms of NAS1 in cisplatin resistance are poorly understood. By analyzing our RNA sequencing data, we identified lncRNA NAS1 as the most considerably down-regulated lncRNA in three cisplatin-resistant NSCLC cell lines compared to their corresponding parental cells (Figure 1). Knockdown of NAS1 further confirmed the negative relationship of NAS1 and cisplatin resistance of NSCLC (Figure 2). While numerous studies have established that NAS1 mainly acts as an oncogene across multiple cancer types, tumor-suppressive properties have been documented in specific malignancies, indicating context-dependent regulatory functions that differ among cancer types [8]. In the present study, TCGA database analysis demonstrated significant downregulation of NAS1 in NSCLC tumors (Figure 1F). However, phenotypic assays following NAS1 knockdown revealed that although NAS1 depletion significantly increased cellular chemoresistance, it concomitantly impaired cell migratory capacity (Figure 2I,J). Comparable observations were made in NR2F1 knockdown experiments (Figure 3K,L), underscoring the multifaceted role of the NAS1-NR2F1 axis in NSCLC. This functional complexity may be attributed to the regulatory effects of the NAS1-NR2F1 axis on cellular dormancy. It has been previously reported that NAS1 is upregulated in dormant mesenchymal-like breast cancer cells, where it promotes tumor dissemination through translational regulation of NR2F1, albeit at the expense of proliferative capacity [9]. Nevertheless, the specific role of the NAS1-NR2F1 axis in modulating cancer phenotypes in NSCLC warrants further investigation.
LncRNAs can modulate gene expression through diverse mechanisms, including functioning as competing endogenous RNAs (ceRNAs) or miRNA sponges, regulating RNA-binding proteins (RBPs), and transcription-dependent activation or repression of neighboring genes [22]. NR2F1, located adjacent to NAS1, has been previously reported to undergo translational regulation by NAS1, which binds NR2F1 mRNA and recruits the RBP PTBP1 to facilitate internal ribosome entry site (IRES)-mediated translation [9]. Our study confirmed this translational regulatory relationship between NAS1 and NR2F1 (Figure 3A). Whether post-translational regulation or altered protein stability contributes to NR2F1 downregulation remains an open question that will be important to address in future studies. The NAS1-NR2F1 axis has been implicated in cellular dormancy regulation, though the underlying mechanisms vary across different cellular contexts: it promotes dormancy in breast cancer cells but drives the transition from dormancy to proliferation in prostate cancer [9,23]. In contrast, we demonstrated that diminished expression of the NAS1-NR2F1 axis enhances cisplatin resistance in NSCLC, with NR2F1 identified as a crucial downstream mediator of NAS1 in this process (Figure 4). However, whether dormancy plays a role in cisplatin resistance in NSCLC through the NAS1-NR2F1 axis requires further experimental validation. Intriguingly, while NAS1 regulates cisplatin resistance through translational control of NR2F1, cisplatin-resistant cell lines exhibited reductions in both NR2F1 protein and NR2F1 mRNA levels (Figure 3B). This observation implies that NR2F1 downregulation in resistant cells may involve supplementary upstream regulatory mechanisms independent of NAS1, underscoring the intricate molecular circuitry underlying cisplatin resistance.
Transforming growth factor-β (TGF-β) is a pleiotropic cytokine implicated in multiple cellular processes—including cell development, proliferation, epithelial–mesenchymal transition (EMT), and immune regulation—via SMAD-dependent and non-SMAD signaling cascades (encompassing PI3K/AKT, MAPK, and NF-κB pathways) [24]. Intriguingly, TGF-β signaling exhibits dichotomous functions in cancer: it serves as a robust tumor suppressor during early tumorigenesis by inducing apoptosis or cell cycle arrest, yet paradoxically facilitates advanced tumor transformation, progression, and metastasis through multidimensional mechanisms [24]. Although TGFβ1 demonstrates context-dependent roles in oncogenesis, accumulating evidence indicates that elevated TGFβ1 expression fosters chemoresistance, with distinct molecular mechanisms identified across various malignancies [16,18,25,26], notably including NF-κB pathway activation-mediated drug resistance [18]. Consistently, our findings reveal that diminished NAS1-NR2F1 axis derepresses TGFB1 transcription, resulting in its upregulation and subsequent NF-κB pathway activation (evidenced by markedly increased phosphorylated p65 levels) (Figure 5 and Figure 6). These observations were corroborated in cisplatin-resistant cell lines as well as in NAS1- or NR2F1-deficient cellular models, substantiating the relationship between TGFβ1 overexpression and enhanced chemotherapeutic resistance.
In summary, our findings underscore the pivotal role of the NAS1-NR2F1 axis in modulating cisplatin resistance in NSCLC. Downregulation of this axis derepresses TGFB1 transcription, leading to NF-κB pathway activation and consequent promotion of cisplatin resistance. NF-κB activation has been widely implicated in cisplatin resistance, in part through promoting pro-survival and anti-apoptotic signaling. While the precise transcriptional regulatory mechanisms through which NR2F1 governs TGFB1 expression warrant further elucidation, therapeutic interventions aimed at restoring NAS1 expression (such as nucleotide analog administration), suppressing TGFB1 activity, or antagonizing downstream NF-κB signaling—particularly in combination with cisplatin—may offer a promising strategy for overcoming drug resistance in this malignancy. Although this study has validated the proposed mechanism in cell-based assays, the key findings have not yet been confirmed in animal models. Further in vivo and clinical investigations will be necessary to substantiate the translational relevance of this regulatory axis.


5. Conclusions

In this study, we report a comprehensive signaling cascade underlying cisplatin resistance in NSCLC. We propose a model in which downregulation of NAS1 impairs the translation of NR2F1. The subsequent loss of NR2F1 relieves its transcriptional repression of TGFB1, leading to increased TGFB1 expression. Upregulated TGFB1 subsequently activates the downstream NF-κB pathway, ultimately driving the acquisition and maintenance of the cisplatin-resistant phenotype.

Supplementary Materials

The following supporting information can be downloaded at https://www.mdpi.com/article/10.3390/cancers18071159/s1: Figure S1: Validation of candidate lncRNAs differentially expressed in cisplatin-resistant NSCLC; Table S1: List of primers and shRNA used in this study; File S1: Western blots information.

Author Contributions

J.Z. (Jun Zhou) and X.L. conceived and designed the research. Y.W. and Q.W. perform most of the experiments; W.T. analyzed the data. J.Z. (Jun Zhou), J.Z. (Jun Zhang) and X.L. wrote the manuscript. All authors discussed and edited the manuscript. All authors have read and agreed to the published version of the manuscript.

Funding

This work was supported by grants from the National Key Research and Development Program of China (No. 2023YFC2706303), the National Natural Science Foundation of China (92581126, 82173053), and the Fundamental Research Funds for the Central Universities (2632025TD05).

Institutional Review Board Statement

Not applicable.

Informed Consent Statement

Not applicable.

Data Availability Statement

All data associated with this study are present in the paper or the Supplementary Materials. The raw and processed high-throughput sequencing data in this study are publicly available in GEO (reference number GSE318830).

Acknowledgments

We thank NovoGene for providing sequencing services. Editorial support was provided by Grammarly.

Conflicts of Interest

The authors declare no conflicts of interest.

References

  1. Bray, F.; Laversanne, M.; Sung, H.; Ferlay, J.; Siegel, R.L.; Soerjomataram, I.; Jemal, A. Global cancer statistics 2022: GLOBOCAN estimates of incidence and mortality worldwide for 36 cancers in 185 countries. CA Cancer J. Clin. 2024, 74, 229–263. [Google Scholar] [CrossRef] [Scilit] [PubMed]
  2. Herbst, R.S.; Morgensztern, D.; Boshoff, C. The biology and management of non-small cell lung cancer. Nature 2018, 553, 446–454. [Google Scholar] [CrossRef] [Scilit] [PubMed]
  3. Pirker, R. Adjuvant chemotherapy in patients with completely resected non-small cell lung cancer. Transl. Lung Cancer Res. 2014, 3, 305–310. [Google Scholar]
  4. Galluzzi, L.; Senovilla, L.; Vitale, I.; Michels, J.; Martins, I.; Kepp, O.; Castedo, M.; Kroemer, G. Molecular mechanisms of cisplatin resistance. Oncogene 2012, 31, 1869–1883. [Google Scholar] [CrossRef] [Scilit] [PubMed]
  5. Giaccone, G. Clinical perspectives on platinum resistance. Drugs 2000, 59, 9–17. [Google Scholar] [CrossRef] [Scilit]
  6. Xiong, X.-D.; Ren, X.; Cai, M.-Y.; Yang, J.W.; Liu, X.; Yang, J.-M. Long non-coding RNAs: An emerging powerhouse in the battle between life and death of tumor cells. Drug Resist. Updat. 2016, 26, 28–42. [Google Scholar] [CrossRef] [Scilit] [PubMed]
  7. Hu, Y.; Zhu, Q.-N.; Deng, J.-L.; Li, Z.-X.; Wang, G.; Zhu, Y.-S. Emerging role of long non-coding RNAs in cisplatin resistance. OncoTargets Ther. 2018, 11, 3185–3194. [Google Scholar] [CrossRef] [Scilit]
  8. Yao, Q.; Zhang, X.; Chen, Y.; Lv, J.; Chen, J.; Chen, D. Long non-coding RNA NR2F1-AS1: An increasingly significant LncRNA in human cancers. J. Physiol. Biochem. 2025, 81, 961–973. [Google Scholar] [CrossRef] [Scilit]
  9. Liu, Y.; Zhang, P.; Wu, Q.; Fang, H.; Wang, Y.; Xiao, Y.; Cong, M.; Wang, T.; He, Y.; Ma, C.; et al. Long non-coding RNA NR2F1-AS1 induces breast cancer lung metastatic dormancy by regulating NR2F1 and ΔNp63. Nat. Commun. 2021, 12, 5232. [Google Scholar] [CrossRef] [Scilit] [PubMed]
  10. Liang, Q.; Xu, Z.; Liu, Y.; Peng, B.; Cai, Y.; Liu, W.; Yan, Y. NR2F1 Regulates TGF-β1-Mediated Epithelial-Mesenchymal Transition Affecting Platinum Sensitivity and Immune Response in Ovarian Cancer. Cancers 2022, 14, 4639. [Google Scholar] [CrossRef] [Scilit]
  11. Ewels, P.; Magnusson, M.; Lundin, S.; Kaller, M. MultiQC: Summarize analysis results for multiple tools and samples in a single report. Bioinformatics 2016, 32, 3047–3048. [Google Scholar] [CrossRef] [Scilit] [PubMed]
  12. Kim, D.; Paggi, J.M.; Park, C.; Bennett, C.; Salzberg, S.L. Graph-based genome alignment and genotyping with HISAT2 and HISAT-genotype. Nat. Biotechnol. 2019, 37, 907–915. [Google Scholar] [CrossRef] [Scilit] [PubMed]
  13. Liao, Y.; Smyth, G.K.; Shi, W. featureCounts: An efficient general purpose program for assigning sequence reads to genomic features. Bioinformatics 2014, 30, 923–930. [Google Scholar] [CrossRef] [Scilit] [PubMed]
  14. Love, M.I.; Huber, W.; Anders, S. Moderated estimation of fold change and dispersion for RNA-seq data with DESeq2. Genome Biol. 2014, 15, 550. [Google Scholar] [CrossRef] [Scilit] [PubMed]
  15. Lugones, Y.; Loren, P.; Salazar, L.A. Cisplatin Resistance: Genetic and Epigenetic Factors Involved. Biomolecules 2022, 12, 1365. [Google Scholar] [CrossRef] [Scilit]
  16. Hu, Q.; Chen, Q.; Yang, W.; Ren, A.; Tan, J.; Huang, T. GPX3 promotes cisplatin resistance in TNBC by manipulating ROS-TGFB1-ZEB2. Cell Commun. Signal. 2025, 23, 355. [Google Scholar] [CrossRef] [Scilit]
  17. Wu, J.; Jiang, L.; Wang, S.; Peng, L.; Zhang, R.; Liu, Z. TGF β1 promotes the polarization of M2-type macrophages and activates PI3K/mTOR signaling pathway by inhibiting ISG20 to sensitize ovarian cancer to cisplatin. Int. Immunopharmacol. 2024, 134, 112235. [Google Scholar] [CrossRef] [Scilit]
  18. Louault, K.; Blavier, L.; Lee, M.-H.; Kennedy, R.J.; Fernandez, G.E.; Pawel, B.R.; Asgharzadeh, S.; DeClerck, Y.A. Nuclear factor-κB activation by transforming growth factor-β1 drives tumour microenvironment-mediated drug resistance in neuroblastoma. Br. J. Cancer 2024, 131, 90–100. [Google Scholar] [CrossRef] [Scilit] [PubMed]
  19. Suenaga, N.; Kuramitsu, M.; Komure, K.; Kanemaru, A.; Takano, K.; Ozeki, K.; Nishimura, Y.; Yoshida, R.; Nakayama, H.; Shinriki, S.; et al. Loss of Tumor Suppressor CYLD Expression Triggers Cisplatin Resistance in Oral Squamous Cell Carcinoma. Int. J. Mol. Sci. 2019, 20, 5194. [Google Scholar] [CrossRef] [Scilit]
  20. Wang, L.H.; Li, Y.; Yang, S.N.; Wang, F.Y.; Hou, Y.; Cui, W.; Chen, K.; Cao, Q.; Wang, S.; Zhang, T.Y.; et al. Gambogic acid synergistically potentiates cisplatin-induced apoptosis in non-small-cell lung cancer through suppressing NF-κB and MAPK/HO-1 signalling. Br. J. Cancer 2014, 110, 341–352. [Google Scholar] [CrossRef] [Scilit] [PubMed]
  21. Vasan, N.; Baselga, J.; Hyman, D.M. A view on drug resistance in cancer. Nature 2019, 575, 299–309. [Google Scholar] [CrossRef] [Scilit]
  22. Marchese, F.P.; Raimondi, I.; Huarte, M. The multidimensional mechanisms of long noncoding RNA function. Genome Biol. 2017, 18, 206. [Google Scholar] [CrossRef] [Scilit] [PubMed]
  23. Chen, W.; Mao, Y.; Zhan, Y.; Li, W.; Wu, J.; Mao, X.; Xu, B.; Shu, F. Exosome-delivered NR2F1-AS1 and NR2F1 drive phenotypic transition from dormancy to proliferation in treatment-resistant prostate cancer via stabilizing hormonal receptors. J. Nanobiotechnology 2024, 22, 761. [Google Scholar] [CrossRef] [Scilit] [PubMed]
  24. Liu, J.; Wang, Y.; Tang, C.; Zhang, L.; Xiong, S.; Wang, J.; Dong, C. TGF-β in tumor development and progression: Mechanisms and therapeutics. Mol. Biomed. 2026, 7, 9. [Google Scholar] [CrossRef] [Scilit]
  25. Shang, Y.; Zhang, J.; Liu, T. CAPG Regulates Doxorubicin Resistance in Hepatocellular Carcinoma Cells via TGFB1/Smad/Nrf2 Signalling Pathway. J. Cell. Mol. Med. 2025, 29, e70847. [Google Scholar] [CrossRef] [Scilit] [PubMed]
  26. Wei, W.; Wang, D.; Zhou, N.; Chen, H.; Yu, W.; Wu, L.; Peng, R.; Shi, H.; Zhou, F. Piwi-interacting RNA-823 promotes cell growth and chemoresistance by stimulating the TGF-β1-mediated AKT/ERK pathway in multiple myeloma. Int. Immunopharmacol. 2025, 166, 115405. [Google Scholar] [CrossRef] [Scilit]
Figure 1. Screening and validation of NAS1 downregulation in cisplatin-resistant NSCLC. (AC) Volcano plots depicting differentially expressed genes between cisplatin-resistant cell lines (H226/CDDPr, H460/CDDPr, PC9/CDDPr) and their respective parental controls. Significantly upregulated and downregulated genes (threshold: |log2 fold change| > 1, p-value < 0.05) are highlighted in orange and green, respectively. (D) Venn diagram identifying lncRNAs consistently downregulated across all three resistant cell lines, with NAS1 being one of the two candidates. (E) qPCR validation of NAS1 expression confirms its significant downregulation in cisplatin-resistant cells compared to parental controls (n ≥ 3). (F) Analysis of NAS1 expression in NSCLC patient cohorts from The Cancer Genome Atlas (TCGA) database, showing lower NAS1 expression in tumor tissues compared to normal adjacent tissues. The data shown in the figure are presented as the mean ± SEM unless otherwise indicated. p values were calculated using two-tailed Student’s t test. * p < 0.05, *** p < 0.001, **** p < 0.0001.
Cancers 18 01159 g001
Figure 2. NAS1 knockdown enhances cisplatin resistance in NSCLC cells. (A,B) Validation of NAS1 knockdown efficiency in H226 (A) and PC9 (B) cells co-transfected with a combination of two independent shRNAs (shNAS1#1 + shNAS1#2) or a control shRNA (shCtrl), as measured by qPCR (n ≥ 3). (CF) Cisplatin sensitivity measured by IC50 in H226 (C,D) and PC9 (E,F) cells following NAS1 knockdown (n = 3). (G,H) Representative images (G) and quantification (H) of colony formation assays in H226 and PC9 cells treated with cisplatin (0, 0.5, or 1 μM) following NAS1 knockdown. (I,J) Representative images (I) and quantification (J) of trans-well migration assays in H226 and PC9 cells under cisplatin treatment (0, 4, or 8 μM) after NAS1 knockdown. Scale bar, 20 µm. The data shown in the figure are presented as the mean ± SEM unless otherwise indicated. p values were calculated using two-tailed Student’s t test. ** p < 0.01, *** p < 0.001.
Cancers 18 01159 g002
Figure 3. NR2F1 acts as a downstream effector of NAS1 to mediate cisplatin resistance. (A,B) NAS1 knockdown reduces NR2F1 protein expression without affecting its mRNA levels in H226 and PC9 cells, as determined by Western blot (A) and qPCR (B) (n ≥ 3), confirming translational regulation. (C,D) Both NR2F1 mRNA (C) and NR2F1 protein (D) (n ≥ 3) levels are downregulated in cisplatin-resistant cell lines compared to their parental controls. (E,F) Validation of NR2F1 knockdown efficiency in H226 and PC9 cells transfected with NR2F1 shRNA (shNR2F1) or control shRNA (shScramble), measured by qPCR (E) and Western blot (F) (n ≥ 3). (G,H) Cisplatin sensitivity measured by IC50 in H226 (G) and PC9 (H) cells following NR2F1 knockdown. (I,J) Representative images (I) and quantification (J) of colony formation assays in H226 and PC9 cells treated with cisplatin (0, 0.5, or 1 μM) following NR2F1 knockdown. (K,L) Representative images (K) and quantification (L) of trans-well migration assays in H226 and PC9 cells under cisplatin (0, 4, or 8 μM) treatment after NR2F1 knockdown. Scale bar, 20 µm. The data shown in the figure are presented as the mean ± SEM unless otherwise indicated. p values were calculated using two-tailed Student’s t test. ns, p ≥ 0.05, * p < 0.05, ** p < 0.01, *** p < 0.001. The uncropped blots are shown in File S1.
Cancers 18 01159 g003
Figure 4. Rescue of cisplatin resistance by NR2F1 overexpression. (A,B) Validation of NR2F1 overexpression in cisplatin-resistant H226/CDDPr (A) and PC9/CDDPr (B) cells by Western blot (top) and qPCR (bottom, n ≥ 3). (CF) Cisplatin sensitivity measured by IC50 in H226/CDDPr (C,D) and PC9/CDDPr (E,F) cells with or without NR2F1 overexpression (n ≥ 3). (G,H) Validation of NR2F1 re-expression in NAS1-knockdown H226 (G) and PC9 (H) cells by Western blot (top) and qPCR (bottom). Cells were first transfected with control (shCtrl) or NAS1-targeting shRNA (shNAS1), followed by empty vector (Vec) or NR2F1 expression vector (NR2F1-OE) (n ≥ 3). (IL) Cisplatin sensitivity measured by IC50 in NAS1-knockdown H226 (I,J) and PC9 (K,L) cells with or without concomitant NR2F1 re-expression (n ≥ 3). The data shown in the figure are presented as the mean ± SEM unless otherwise indicated. p values were calculated using two-tailed Student’s t test. ns, p ≥ 0.05, * p < 0.05, ** p < 0.01, *** p < 0.001. The uncropped blots are shown in File S1.
Cancers 18 01159 g004
Figure 5. TGFB1 is identified as a downstream effector of the NAS1-NR2F1 axis. (A) Heatmaps showing differentially expressed genes upon NR2F1 overexpression (OE_NR2F1) or knockdown (sh_NR2F1) in gastric cancer cells (RNA-seq dataset GSE233167). Genes upregulated upon NR2F1 knockdown and downregulated upon NR2F1 overexpression are defined as NR2F1-repressed genes (NR2F1-neg); genes showing the opposite pattern are defined as NR2F1-induced genes (NR2F1-pos). (B) GO enrichment analysis of NR2F1-repressed genes (NR2F1-neg), showing significant enrichment in drug resistance-associated signaling pathways (shown in red). (C) GO enrichment analysis of genes upregulated in cisplatin-resistant NSCLC cell lines compared to parental controls, revealing overlapping pathway enrichment with NR2F1-repressed genes. Drug resistance-associated signaling pathways are colored in red. (D) Venn diagram identifying TGFB1 as the only NR2F1-repressed gene common to three cisplatin resistance-related pathways: NF-κB, PI3K/AKT, and ERK1/ERK2 cascade. (EG) qPCR validation of TGFB1 expression (n ≥ 3). TGFB1 is upregulated in (E) cisplatin-resistant NSCLC cell lines, (F) NAS1-knockdown cells, and (G) NR2F1-knockdown cells, compared to their respective controls. (HJ) Western blot validation of NR2F1 and TGFB1 protein expression in H226 and PC9 cells. Consistent with the qPCR results, (H) cisplatin-resistant, (I) NAS1-knockdown, (J) and NR2F1-knockdown cells show reduced NR2F1 and increased TGFB1 protein levels relative to their respective controls. The data shown in the figure are presented as the mean ± SEM unless otherwise indicated. p values were calculated using two-tailed Student’s t test. * p < 0.05, ** p < 0.01. The uncropped blots are shown in File S1.
Cancers 18 01159 g005
Figure 6. NF-κB pathway activation via downregulation of the NAS1-NR2F1 axis promotes cisplatin resistance. (A,B) Elevated NF-κB activity in cisplatin-resistant NSCLC cell lines. (A) Representative Western blot and (B) quantification showing increased phosphorylation of p65 (p-p65) in H226/CDDPr and PC9/CDDPr cells compared to their parental controls (n ≥ 3). (C,D) NF-κB activation following NAS1 knockdown. (C) Representative Western blot and (D) quantification of p-p65 levels in H226 and PC9 cells transfected with control (shNC) or NAS1-targeting shRNA (shNAS1) (n ≥ 3). Data are presented as mean ± SEM; * p < 0.05 (two-tailed Student’s t-test). (E,F) NF-κB activation following NR2F1 knockdown. (E) Representative Western blot and (F) quantification of p-p65 levels in H226 and PC9 cells transfected with control (shScramble) or NR2F1-targeting shRNA (shNR2F1) (n ≥ 3). (G) Cisplatin sensitivity measured by dose–response curve and quantification of the corresponding IC50 values in cisplatin-resistant H226/CDDPr cells treated with the NF-κB inhibitor DHMEQ at the indicated concentrations (0, 10, 20, or 50 μg/mL) (n ≥ 3). (H) Cisplatin sensitivity measured by dose–response curve and quantification of the corresponding IC50 values in cisplatin-resistant PC9/CDDPr cells treated with the NF-κB inhibitor DHMEQ at the indicated concentrations (0, 10, 20, or 50 μg/mL) (n ≥ 3). The data shown in the figure are presented as the mean ± SEM unless otherwise indicated. p values were calculated using two-tailed Student’s t-test. * p < 0.05, ** p < 0.01, *** p < 0.001. The uncropped blots are shown in File S1.
Cancers 18 01159 g006
Disclaimer/Publisher’s Note: The statements, opinions and data contained in all publications are solely those of the individual author(s) and contributor(s) and not of MDPI and/or the editor(s). MDPI and/or the editor(s) disclaim responsibility for any injury to people or property resulting from any ideas, methods, instructions or products referred to in the content.