Article

Gene Expression, Non-Coding RNA, and Circular RNA Alterations in Patients with T-Prolymphocytic Leukemia


by
Vanessa Rebecca Gasparini
1,2,†,
Silvia Orsi
1,3,†,
Alessia Buratin
3,4,
Elisa Rampazzo
1,2,
Giulia Calabretto
1,2,
Elena Buson
1,2,
Alberto Caregari
3,4,
Cristina Vicenzetto
5,
Gregorio Barilà
6,
Eleonora Roncaglia
3,4,
Roberto Merlo
3,4,
Livio Trentin
1,
Monica Facco
1,2,
Laura Pavan
6,
Gianpietro Semenzato
2,*,
Enrico Gaffo
7,
Antonella Teramo
1,2,
Renato Zambello
1,2,‡ and
Stefania Bortoluzzi
7,*,‡
1
Hematology Section, Department of Medicine, University of Padova, 35128 Padova, Italy
2
Veneto Institute of Molecular Medicine (VIMM), 35129 Padova, Italy
3
Department of Biology, University of Padova, 35131 Padova, Italy
4
Department of Molecular Medicine, University of Padova, 35131 Padova, Italy
5
Cardiology Section, Department of Cardiac Thoracic Vascular Sciences and Public Health, University of Padova, 35129 Padova, Italy
6
Hematology Unit, San Bortolo Hospital, 36100 Vicenza, Italy
7
Department of Surgery, Oncology and Gastroenterology, University of Padova, 35131 Padova, Italy
*
Authors to whom correspondence should be addressed.
These authors contributed equally to this work.
These authors also contributed equally to this work.
Cancers 2026, 18(15), 2442; https://doi.org/10.3390/cancers18152442
Submission received: 24 June 2026 / Revised: 24 July 2026 / Accepted: 27 July 2026 / Published: 29 July 2026
(This article belongs to the Section Molecular Cancer Biology)

Simple Summary

The high heterogeneity of the T-PLL molecular background considerably challenges the identification of treatments for this incurable disease. The emerging roles of lncRNAs and circRNAs in hematological malignancies prompted their study in the context of T-PLL. Here, we identified gene, lncRNA, and circRNA expression alterations and aberrant pathway activations in T-PLL, combining genomic and transcriptomic data to explore the links between driver variants and expression alterations. This study opens new lines of investigation into common pathways (e.g., the Wnt pathway) hit in T-PLL patients that could be pharmacologically targetable to potentially expand therapeutic options in the future.

Abstract

Background/Objectives: Identifying molecular liabilities and understanding disease heterogeneity are prerequisites for advancing therapies in T-cell prolymphocytic leukemia (T-PLL), a rare T-cell malignancy with a poor prognosis. Methods: RNA-seq profiling of T-PLL samples (n = 10) and the normal counterpart (n = 5) allowed us to report gene expression and pathway alterations in malignant cells, revealing that non-coding, antisense and circular RNA expression is profoundly altered in T-PLL. Results: T-PLL displayed activation of several oncogenic pathways, particularly PI3K/AKT/mTOR and Wnt, suppression of healthy T-cell activities and cell death escape. Tumor suppressor lncRNAs (NEAT1, MIAT and LUCAT1) with reduced expression and upregulated oncogenic pro-proliferative lncRNAs (FIRRE, TERC, XIST and PVT1) were identified. CircRNAs ectopically expressed in T-PLL included circSEMA4B and circSATB1, linked to the Wnt pathway, circFIRRE and oncogenic circPVT1 and circFKBP5. Focusing on five genes with validated recurrent oncogenic variants (STAT5B, JAK3, ATM, KMT2C, and ARID1A), we investigated genotype/phenotype relations. A multiple predictor linear model suggested potential links between driver variants and alterations in gene and circRNA expression, including association between STAT5B mutations and LTF upregulation, JAK3 lesions and increased PLXNA4 expression along with CCR4 suppression. Conclusions: Our transcriptomic profiling and genotype–phenotype association analysis identified specific genes, non-coding RNAs, pathways and candidate genotype-associated transcriptional signatures that warrant further investigation as potential targets for the development of new therapeutic approaches for this rare and heterogeneous malignancy.

1. Introduction

T-cell prolymphocytic leukemia (T-PLL) is an extremely aggressive malignancy of mature T lymphocytes characterized by a rapid clinical course and resistance to conventional chemotherapy [1,2,3]. Humanized CD52-antibody alemtuzumab is effective as first-line therapy [3,4,5], but relapses are inevitable without consolidation with allogeneic transplantation, which is feasible only in a restricted subset of patients [4].
Leukemic T-PLL cells are characterized by a complex karyotype, with alterations of chromosome 14 leading to the overexpression of TCL1A or MTCP1 proto-oncogenes [5,6,7] and deletions of 11q with ATM loss [7]. Other recurrent alterations involve chromosome 8, including MYC gain [5]. Genomic studies have shown that almost 60% of the lesions affect the JAK/STAT axis, with JAK3 (30–42%), STAT5B (19–36%) and JAK1 (6–8%) being the most recurrently mutated genes [8,9,10]. In addition, mutations in ATM, TP53, DNA repair/checkpoint proteins and epigenetic regulators are recurrent [7,9].
Conversely, the transcriptomic profile of T-PLL patients has been rarely studied. Array-based gene expression profiling in 5 T-PLL patients identified putative genes involved in lymphomagenesis, cell cycle regulation, apoptosis and DNA repair [11]. A larger study also included genes associated with proliferation, immune responses, and signal transduction intermediates [7]. Defined microRNA expression patterns were associated with worse prognosis [12,13,14]. In the last few years, new classes of non-coding RNA such as long non-coding RNA (lncRNA) and circular RNA (circRNA) have been extensively studied in cancer and in hematological conditions for their involvement in pathogenesis, progression and therapeutic resistance [15,16]. However, scattered data of these molecules in the context of T-PLL are available.
Here, we provide new data on the molecular makeup of T-PLL, leveraging multi-level omics data, which encompass comprehensive transcriptomic analysis integrated with the definition of patient genetic aberrations. In this way, we extend the knowledge about the most dysregulated genes and pathways, disclose alterations of non-coding RNAs and circRNAs in malignant T-PLL cells, and model the link between recurrent driver mutations with gene and circRNA expression patterns in this rare and challenging disease.

2. Materials and Methods

2.1. Cohort of Study

The study comprises 19 CD4+ T-PLL patients and 9 healthy controls (CTR). All the patients were recruited at the Hematology Unit of Padua University Hospital and met the diagnostic criteria for T-PLL (Supplementary Table S1) [17]. The study was performed according to the Helsinki Declaration and approved by the Padua Provincial Ethical Committee for Clinical Trials (CESC code 5229/AO/21; URC code AOP2436). All the patients gave written informed consent before inclusion in the study. Healthy controls were recruited from the Department of Transfusion Medicine of Padua University Hospital. Details about sample collection and purification, as well as about mutation screening are described in the Supplementary Methods S1.

2.2. RNA-Seq Profiling

RNA was extracted from peripheral blood mononuclear cells (PBMC) of CD4+ T-PLL patients and CD4+ cells of CTR using the RNeasy kit (Qiagen, Hilden, Germany) following the manufacturer’s instructions. RNA sequencing (RNA-seq) was performed using the Illumina platform (paired-end, 60 million reads on average per sample, Ribozero Gold rRNA depletion kit; Illumina, San Diego, CA, USA). RNA-sequencing data are available at Gene Expression Omnibus (GSE281431).

2.3. Gene and circRNA Expression Estimation from RNA-Seq

Expressed genes and circRNAs were detected with CirComPara2 v0.6.3 [18], implementing data quality control and filtering, read alignment to the reference genome and linear and circular transcriptome reconstruction, respectively, using Hisat2 and the combination of seven backsplicing detection methods. More details about the filtering, differential expression and functional enrichment analyses are described in the Supplementary Methods S2.

2.4. RT-qPCR for Expression Quantification

Quantitative real-time PCR (RT-qPCR) has been performed to confirm dysregulated expression of transcripts in T-PLL. Primers for circRNAs were designed with Primer Blast (Supplementary Table S2; Sigma-Aldrich, Saint Louis, MO, USA) to amplify the backsplice junction region. PCR product starting from cDNA pre-treated with RNase R (ThermoFisher Scientific, Waltham, MA, USA), to optimize circRNA detection, was analyzed with Sanger sequencing to confirm the amplification of the correct region. Gene expression quantification was obtained on QuantStudio 5 Real-Time PCR System (ThermoFisher Scientific, Waltham, MA, USA) and analyzed using the comparative threshold cycle method (ddCt) with GAPDH as the reference gene.

2.5. Variant Calling and Validation

Expressed candidate driver variants were inferred from RNA-seq data; variant annotation and selection is detailed in Supplementary Methods S3. Driver variant prediction was obtained by Cancer Genome Interpreter, and the functional enrichment of mutated driver genes was calculated (Supplementary Methods S4).
Selected candidate variants were prioritized for validation according to their gene function and variant allele frequency in order to confirm their presence in the entire cohort. Validation was performed with Sanger sequencing using custom primers designed with Primer Blast (Supplementary Table S2; Sigma-Aldrich, Saint Louis, MO, USA). Purified PCR products were sequenced on an ABI 3130 sequencer (Applied Biosystems, Waltham, MA, USA), and the results were analyzed with NCBI BLASTN (v.2.15.0+) and ChromasPro (v.2.1.20.1).

2.6. Modeling Gene and circRNA Expression Relation with Genetic Lesions

To identify significant relations between T-PLL cells’ genotype, considering driver genes hit by point mutations, and phenotype, in terms of gene and circRNA expression profile, a linear expression model fitted with Limma has been used (Supplementary Methods S5).

3. Results

3.1. Clinical and Molecular Features of the T-PLL Cohort and Study Design

PBMC from 10 CD4+ T-PLL patient samples (Table 1) and sorted CD4+ cells from age-matched healthy donor samples (n = 5), as normal counterparts (CTR), were profiled by RNA-seq.
Standard screening by Sanger sequencing detected STAT5B and JAK3 variants in six and two cases, respectively. The median age at diagnosis was 69 years. The leukemic clone phenotype resulted in CD4+ and CD7+, with a variable expression of CD25 and CD26 markers. All cases presented a clonal expansion according to the molecular evaluation of the TCR Gamma gene rearrangement, while Vbeta 7.1 expansion was recurrent in 25% of cases. All patients presented with a high white blood cell count, marked lymphocytosis, reduced hemoglobin levels, lymphadenopathy and hepatosplenomegaly (Supplementary Table S1).

3.2. Aberrant Gene Expression and Pathway Activity in T-PLL

CirComPara2 analysis extracted expression profiles of both genes (14,912) and circular RNAs (6469) in T-PLL and the normal counterpart from RNA-seq data.
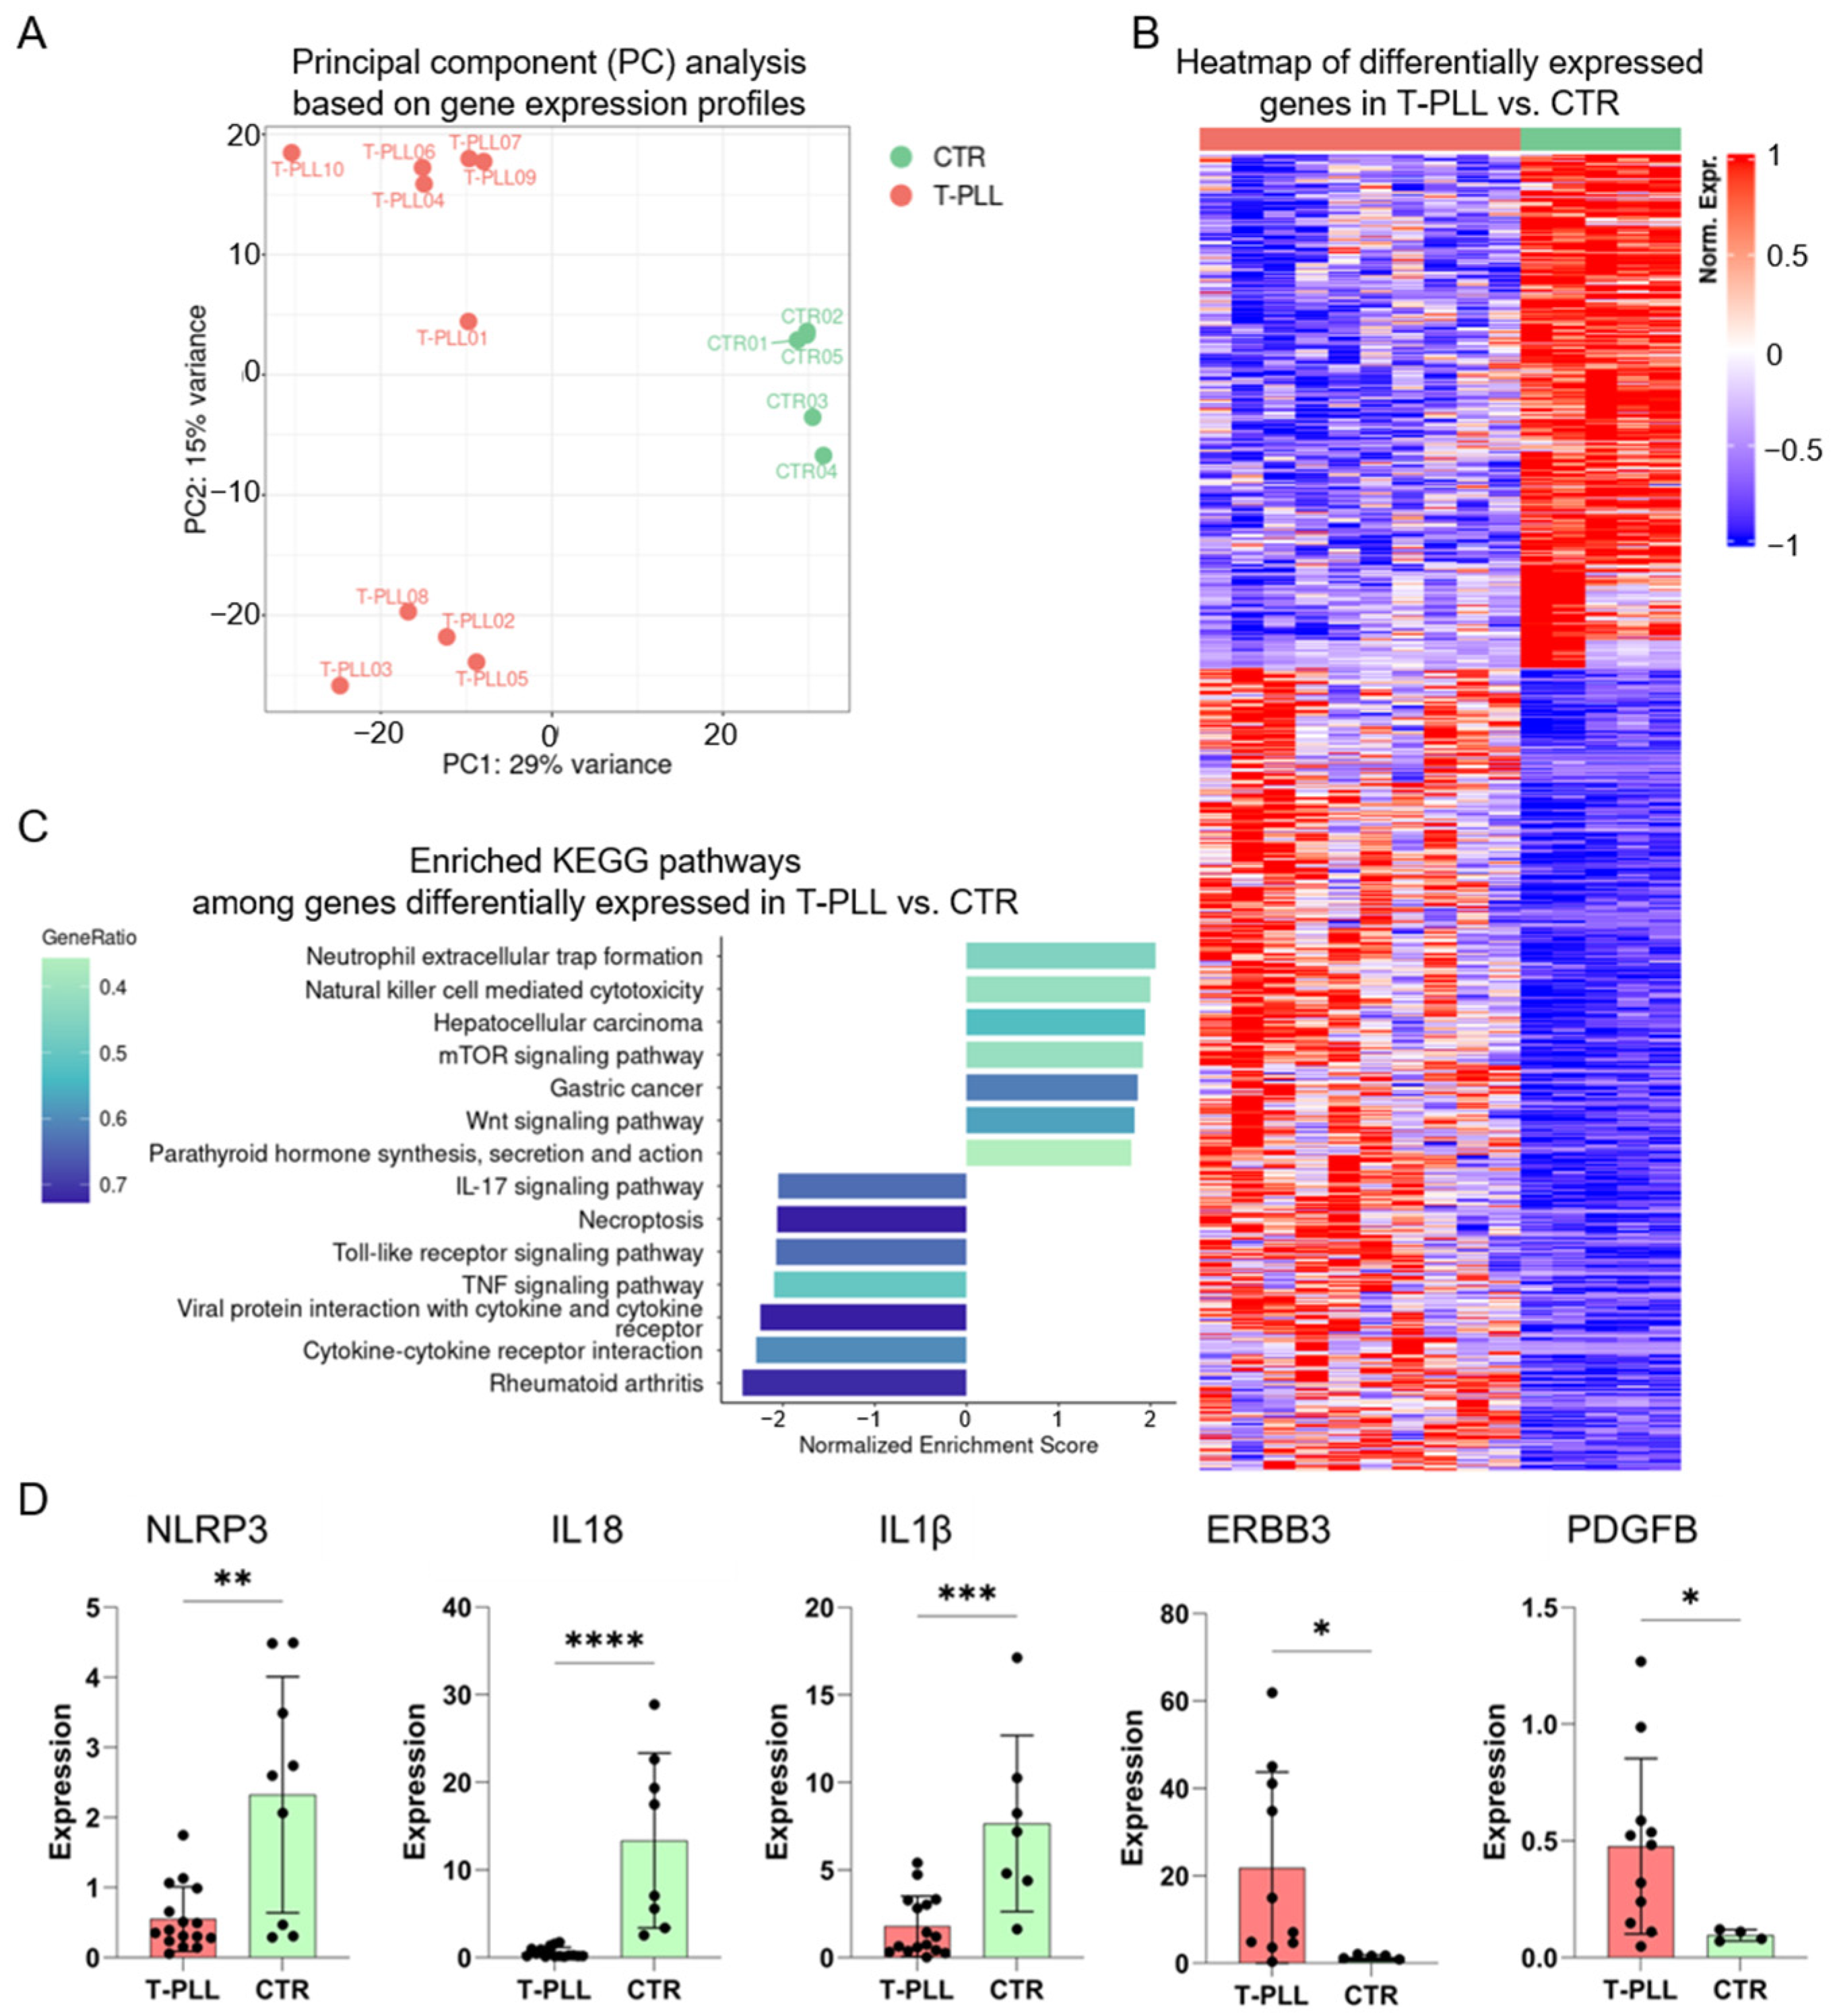
According to principal component analysis (PCA) based on gene expression profiles (Figure 1A), T-PLL samples were separated from CTR samples. A direct comparison identified 2009 genes differentially expressed, with 60% being abnormally upregulated in malignant cells (Figure 1B and Supplementary Table S3). Differential expression analysis showed an increased expression of several cancer-associated genes in the T-PLL samples, including ERBB3, PDGFB and MYC (Supplementary Table S3). Gene Set Enrichment Analysis (GSEA; Figure 1C) identified enrichment of several cancer-related pathways, particularly PI3K/AKT/mTOR and Wnt signaling. In line with the enrichment of Wnt signaling, LRP5 and FZD8 encode a Wnt co-receptor and receptor, respectively, whereas DAAM1 acts downstream of non-canonical Wnt signaling and regulates actin cytoskeleton remodeling. Additionally, a series of pathways and functions active in healthy T-cells were suppressed in T-PLL such as antigen processing and presentation, apoptosis, cytokine regulation and T cell differentiation (Supplementary Figure S1 and Figure 1C). ERBB3 and PDGFB were selected for RT-qPCR validation based on their expression levels, degree of dysregulation, and potential biological relevance, and their upregulation was confirmed in the extended cohort (Figure 1D). RT-qPCR also confirmed the downregulation of IL1β and NLRP3. Although the decrease in IL18 did not reach statistical significance in the RNA-seq cohort, its significant downregulation was confirmed by RT-qPCR in the extended cohort, consistent with the direction of change observed in the sequencing data (Figure 1D).
In conclusion, the aberrant expression of coding transcripts in T-PLL indicated the activation of distinct oncogenic signaling pathways, particularly PI3K/AKT/mTOR and Wnt, in addition to the suppression of healthy T-cell activities and the escape of multiple cell death mechanisms.

3.3. Refining the T-PLL Transcriptomics: Aberrant Non-Coding and Circular RNA Expression

To give new insight about the transcriptomic profile of T-PLL patients, we investigated the expression of antisense long non-coding RNAs and circular RNAs in T-PLL.
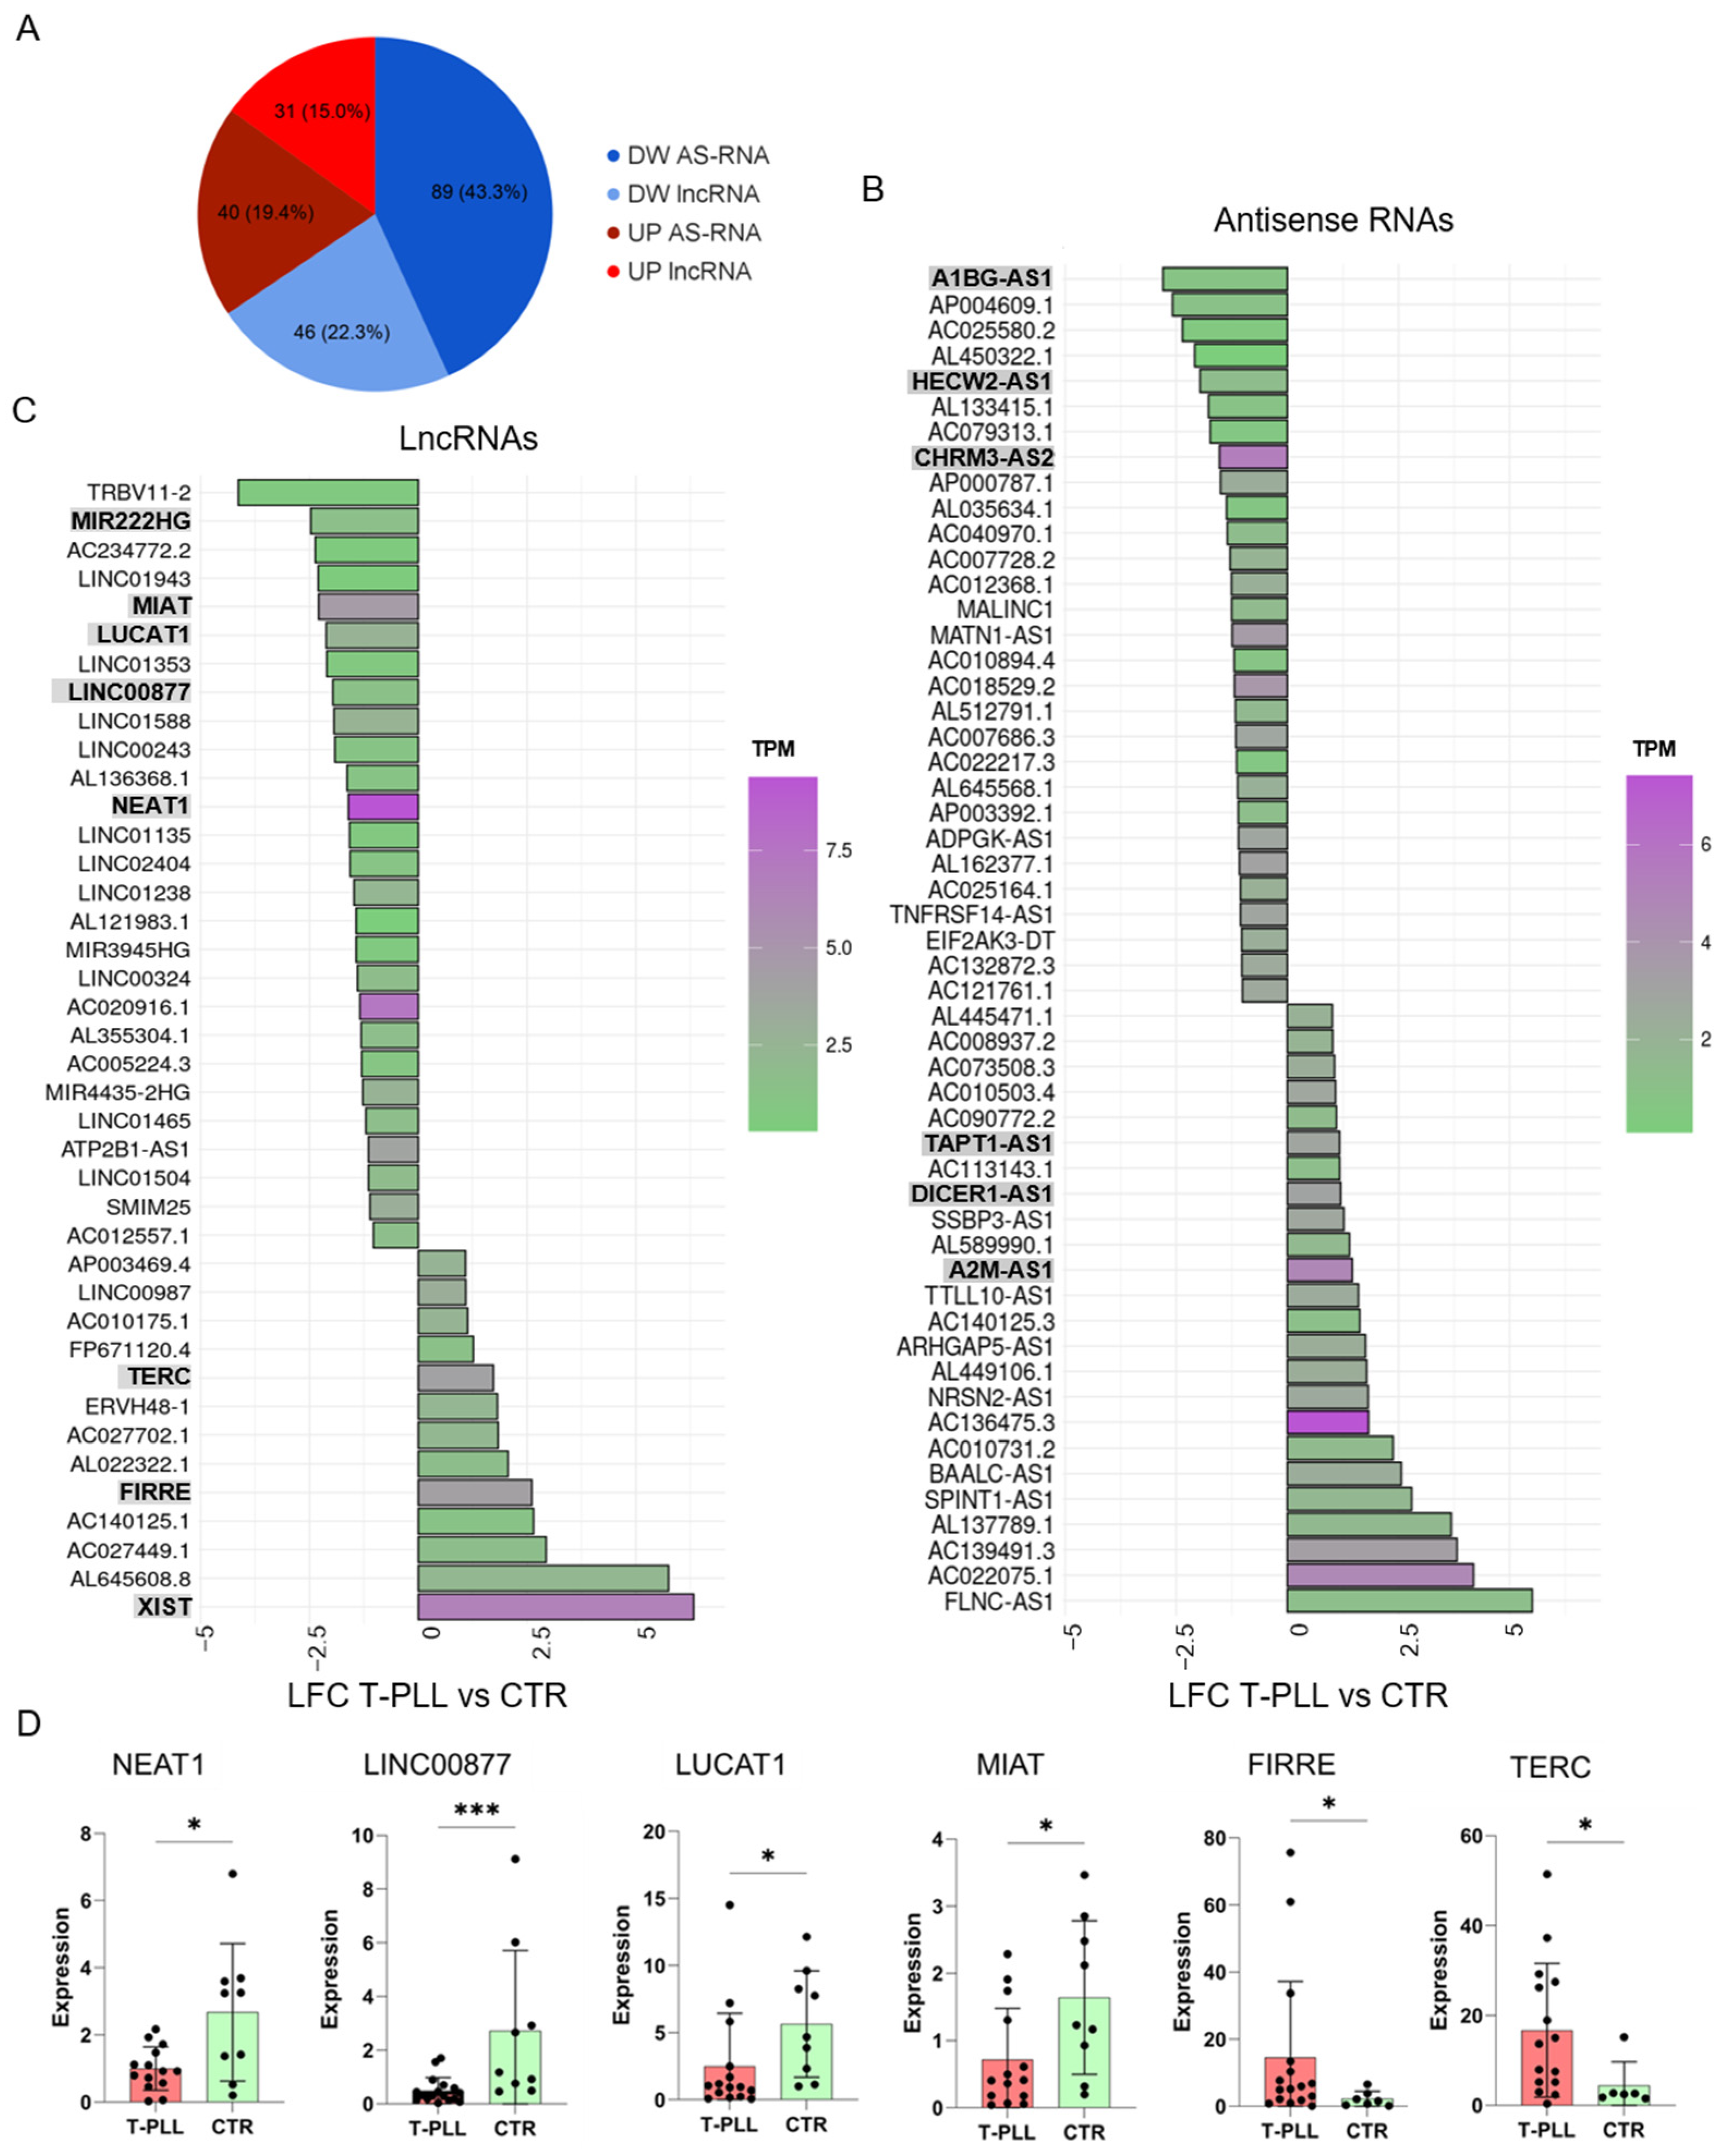
We found 129 antisense (AS) and 77 long non-coding RNAs (lncRNAs) with altered expression, prevalently (69% and 60%) downregulated, in T-PLL (Figure 2A). Among the differentially expressed antisense RNAs (Figure 2B), A1BG-AS1, a tumor suppressor in solid cancer [19], was among the most aberrantly downregulated in T-PLL. Conversely, A2M-AS1 and DICER1-AS1, with oncogenic roles in other settings [20,21], and the less characterized TAPT1-AS1 were overexpressed in T-PLL.
Several lncRNAs were dysregulated (Figure 2C), including MIR222HG, MIAT, LUCAT1 and LINC00877 within the most downregulated. RNA-seq and RT-qPCR (Figure 2C,D) concordantly showed the downregulation of NEAT1, a nuclear paraspeckle lncRNA that acts as a tumor suppressor in leukemia [22,23]. RT-qPCR (Figure 2D) also confirmed the downregulation of MIAT, LUCAT1 and LINC00877. These lncRNAs were firstly associated with the initiation of metastasis and proliferation in several malignant tumors [24], while LUCAT1 downregulation in acute lymphoblastic leukemia [25] and of LINC00877 in mantle cell lymphoma [26] were recently described.
Among the most upregulated lncRNAs (Figure 2C), we found FIRRE and TERC (Figure 2D), previously linked to pro-proliferative functions [27], XIST, an important regulator of cell growth and development, and PVT1, a well-known lncRNA under control of p53, that promotes tumorigenesis, boosting MYC expression [28], which is increased in our data (Supplementary Table S3).
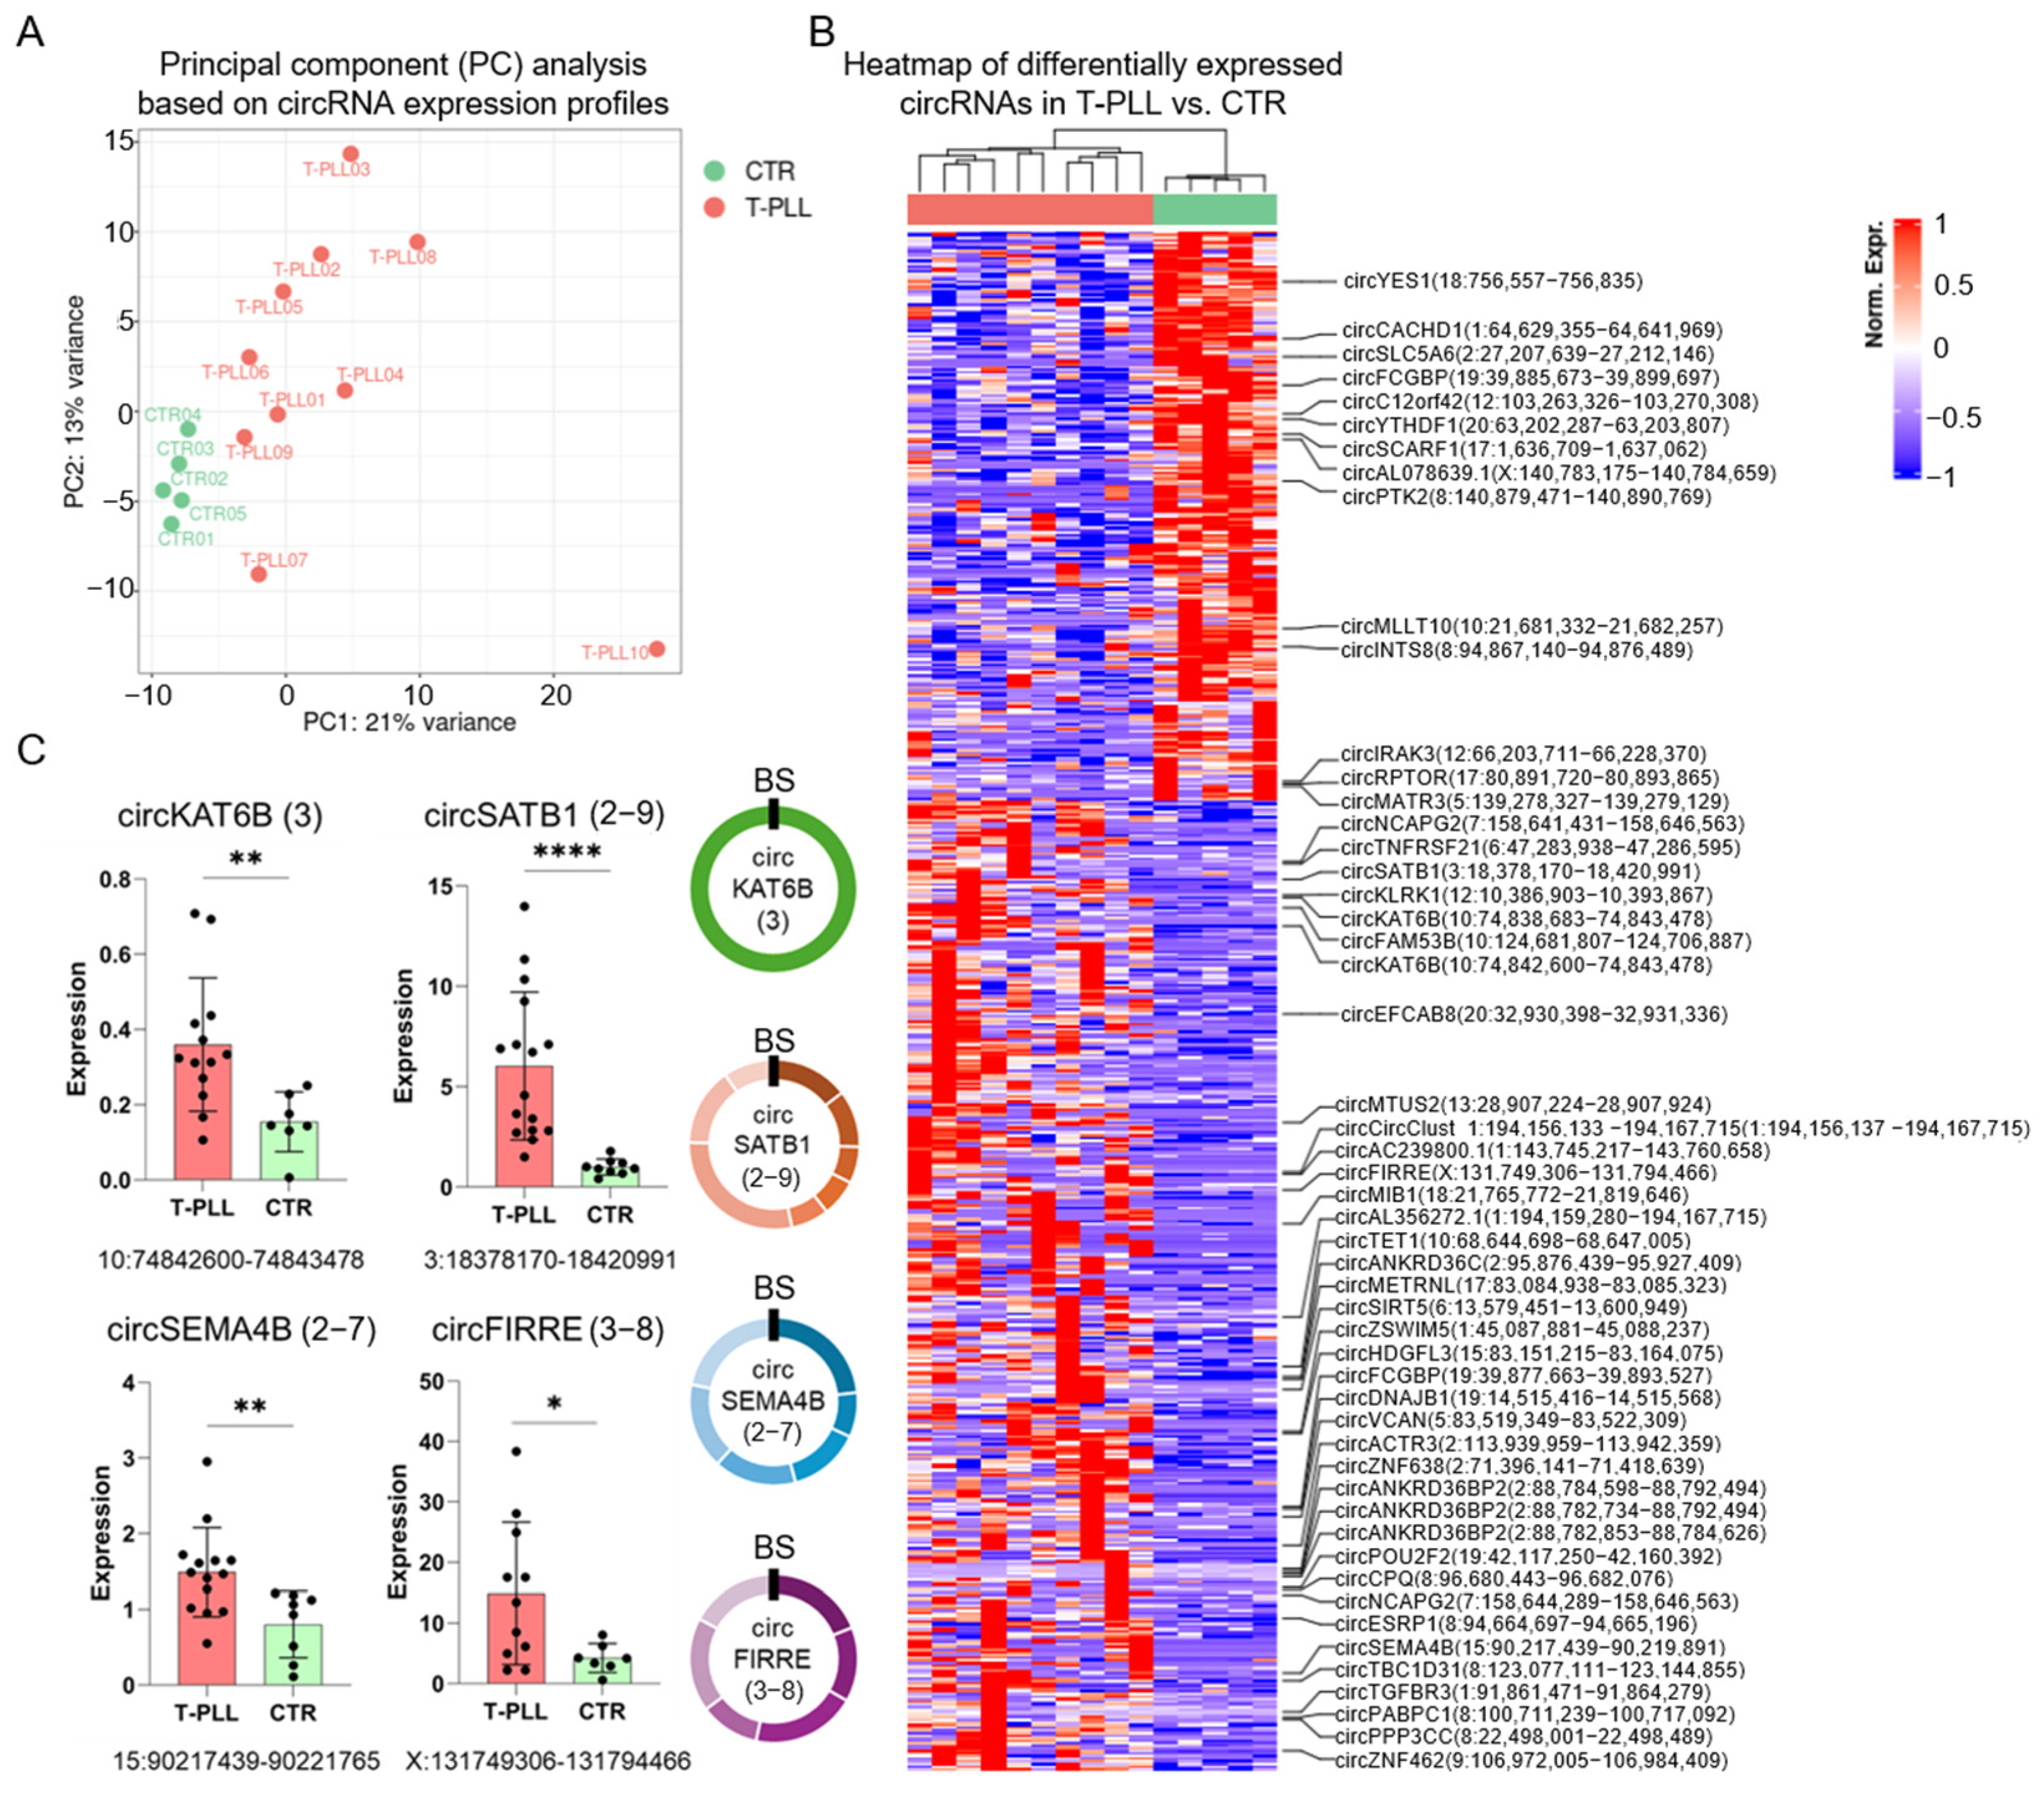
The examination of circRNA expression in T-PLL provided for the first time a comprehensive profile of the circRNAome aberrancies in this malignancy. Descriptive analysis showed that T-PLL samples can be discriminated from CTR exclusively using circRNA expression profiles (Figure 3A). In line, 261 circRNAs were significantly differentially expressed, prevalently (71%) upregulated, in T-PLL compared to CTR (Figure 3B and Supplementary Table S4).
Among the upregulated circRNAs, 85 were ectopically expressed in T-PLL, including circKAT6B, circPVT1 and circFKBP5 with known oncogenic functions [29,30,31]. We selected four significantly upregulated circRNAs, namely circKAT6B, circSATB1, circSEMA4B, and circFIRRE, based on robust back-splice junction read support, relevant fold change, and prior cancer- or T-cell-related annotations and validated their differential expression compared to CTR (Figure 3C). The abnormal overexpression of both the linear lncRNA FIRRE (Figure 2D) and circFIRRE has been confirmed, and the circular to linear proportion (CLP [32]) rose from 0.38 in CTR to 0.55 in T-PLL.
Most of the downregulated circRNAs (Figure 3B), comprising circMETRNL, circIRAK3, circPOU2F2, circACTR3, circZNF638 and circVCAN, were poorly characterized.

3.4. Association of Driver Variants with Distinct Gene and circRNA Expression Profiles

The next aim of the study was to obtain a better characterization of the disease heterogeneity, by defining the association of driver mutations with the transcriptome profile in T-PLL. The genomic state of patients was inferred from RNA-seq data by identification of expressed driver variant alleles with putative pathogenic relevance.
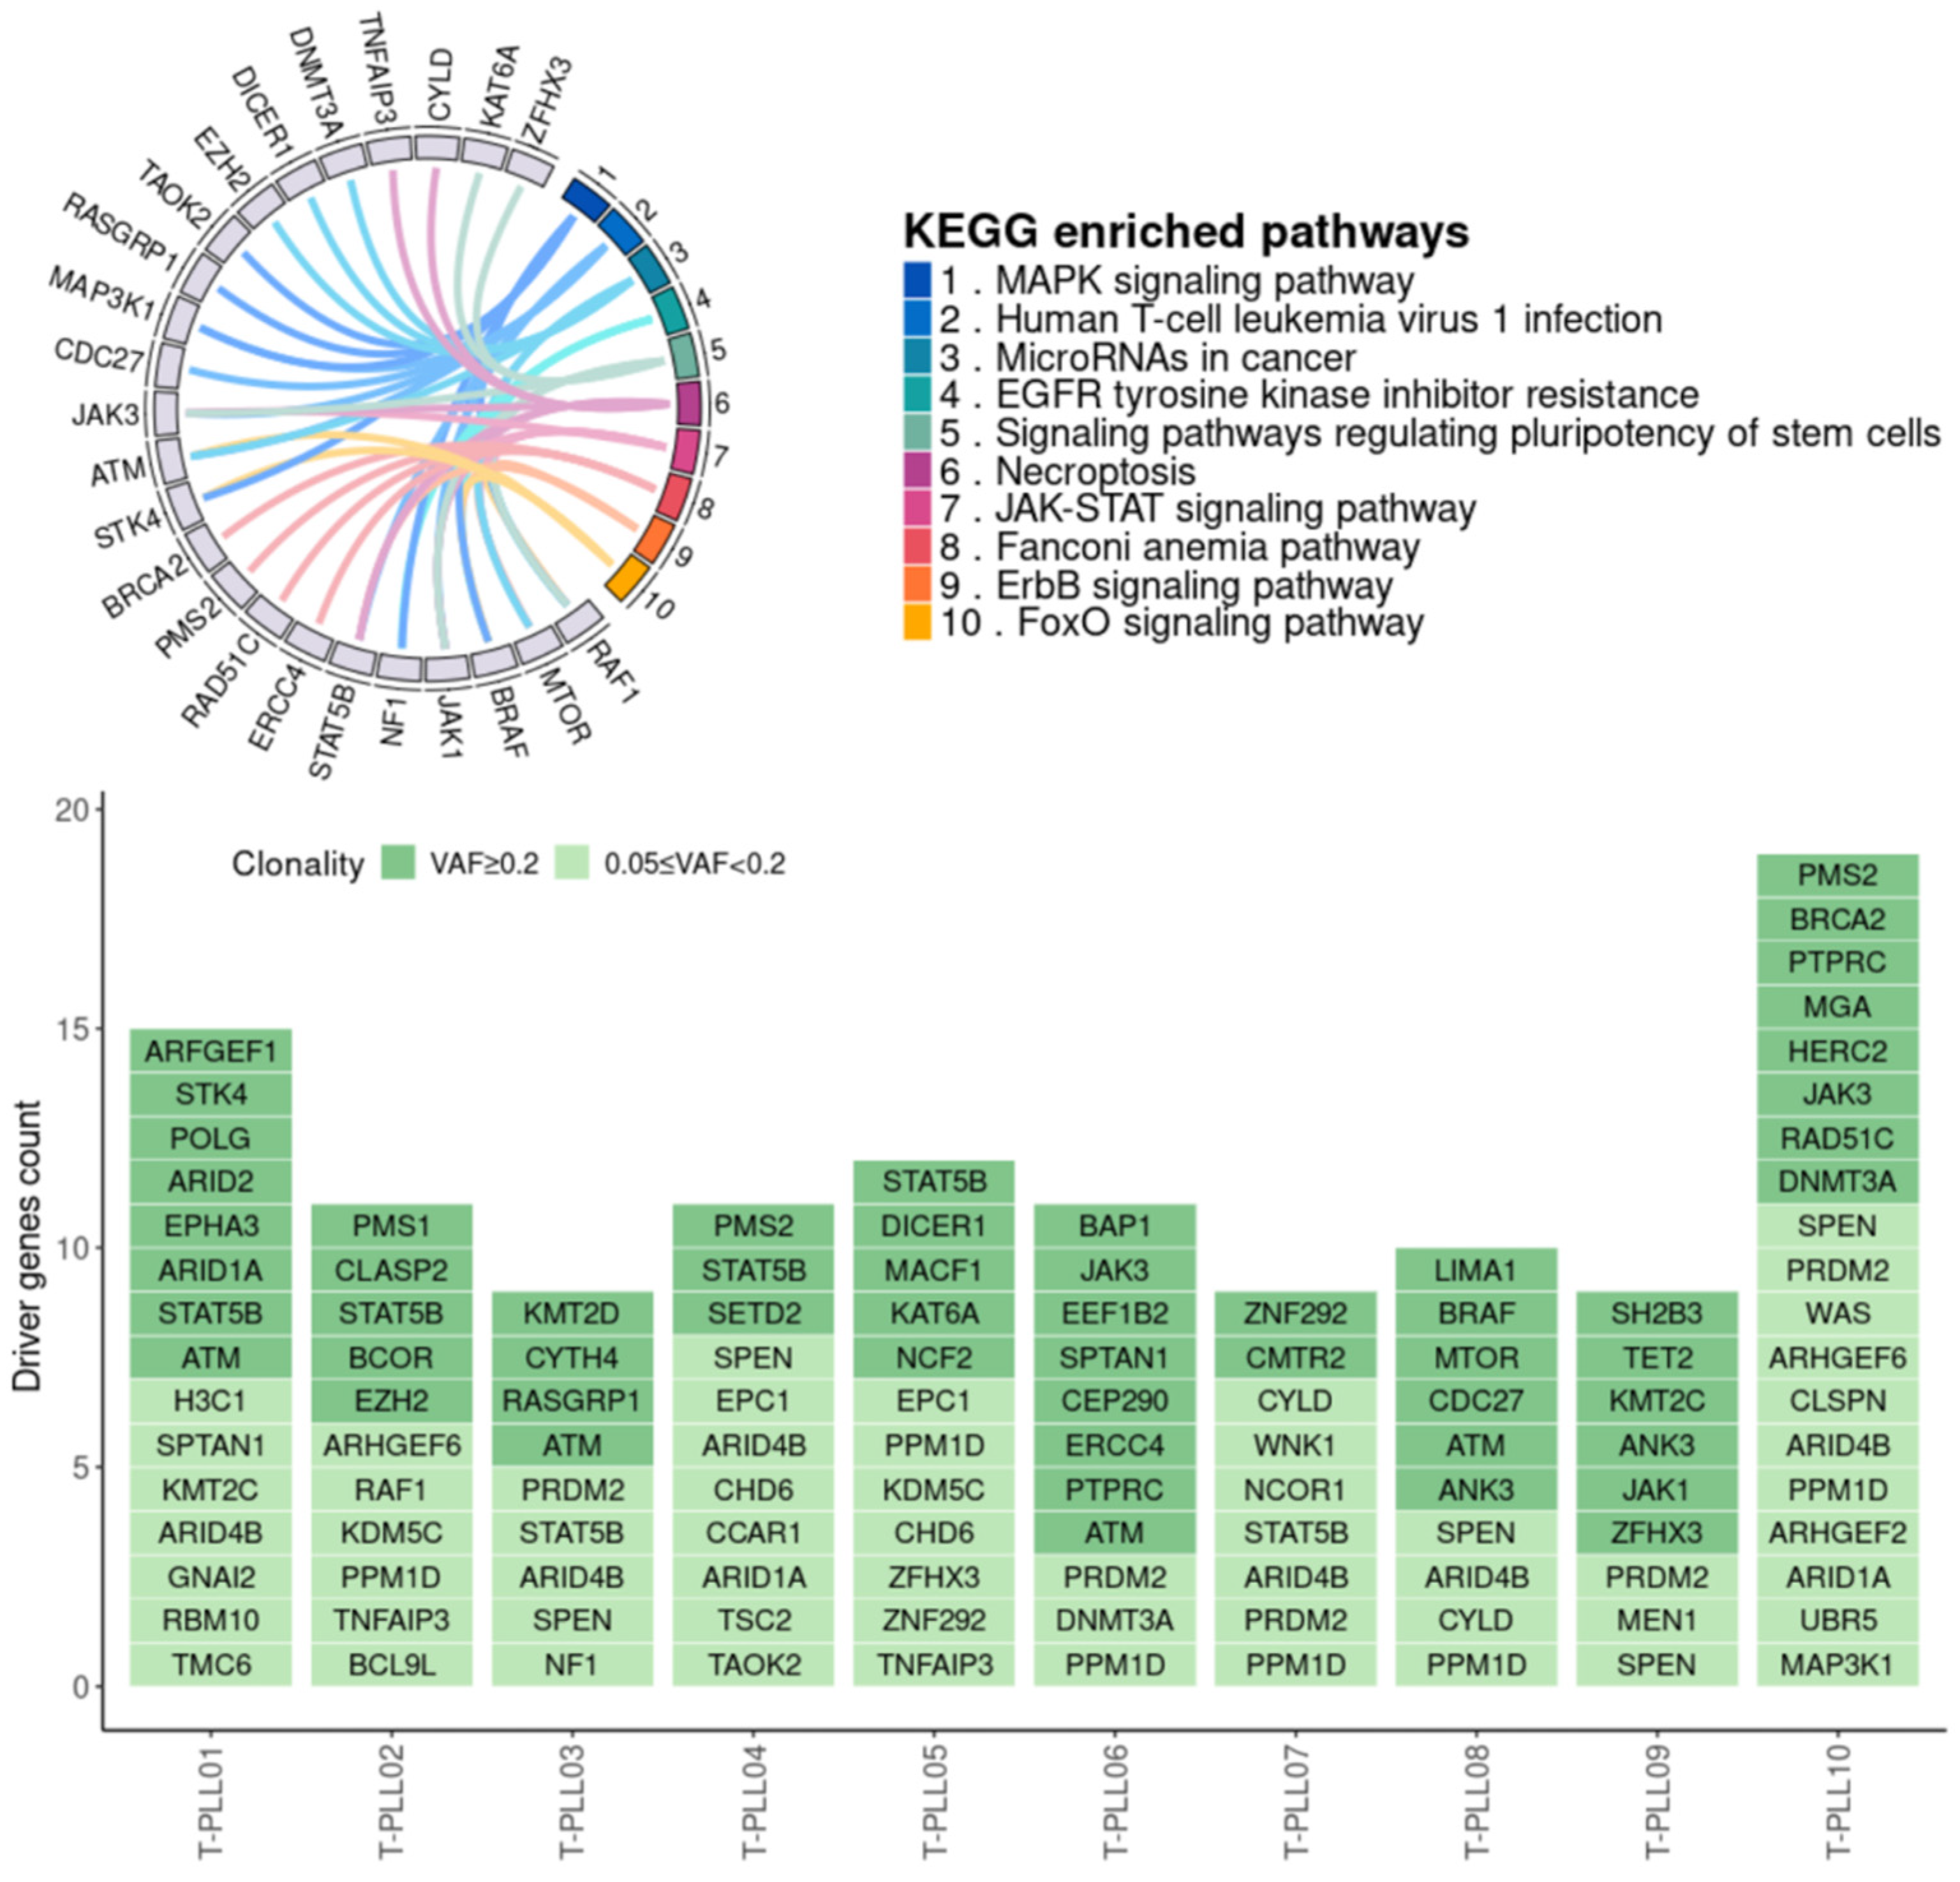
We detected 1991 rare variants per patient, on average, with a VAF at least 5% in leukemic cells. We found 126 driver variants in 73 genes according to CGI analysis (Supplementary Tables S1 and S5). The validation by Sanger sequencing of 18 selected variants corroborated the robustness of these data (Supplementary Table S6 and Supplementary Figure S2). Patients presented a complex molecular profile harboring from 12 to 26 driver variants, with multiple oncogenic variants with an estimated VAF of at least 0.2 in most cases (Figure 4). Mutations were found in genes previously associated with T-PLL (ATM, JAK3, KMT2C, PTPRC) and in others not previously described in this malignancy (ANK3, ARID1A, CMTR2), which were validated. STAT5B was mutated in six cases, with two also carrying ATM variants. In one case, a low VAF (0.07) STAT5B variant coexisted with variants of KMT2D, RASGRP1, CYTH4, and NF1 genes, which were not previously described in T-PLL. ATM inactivating variants were detected in four cases. JAK genes were mutated in three cases (all STAT5B negative), with JAK3 and JAK1 variants coexisting in two. Ten KEGG pathways were enriched in driver-mutated genes (Figure 4), with MAPK signaling, chemokine signaling, EGFR tyrosine kinase inhibitor resistance and the JAK-STAT signaling pathway representing the hallmarks of the disease.
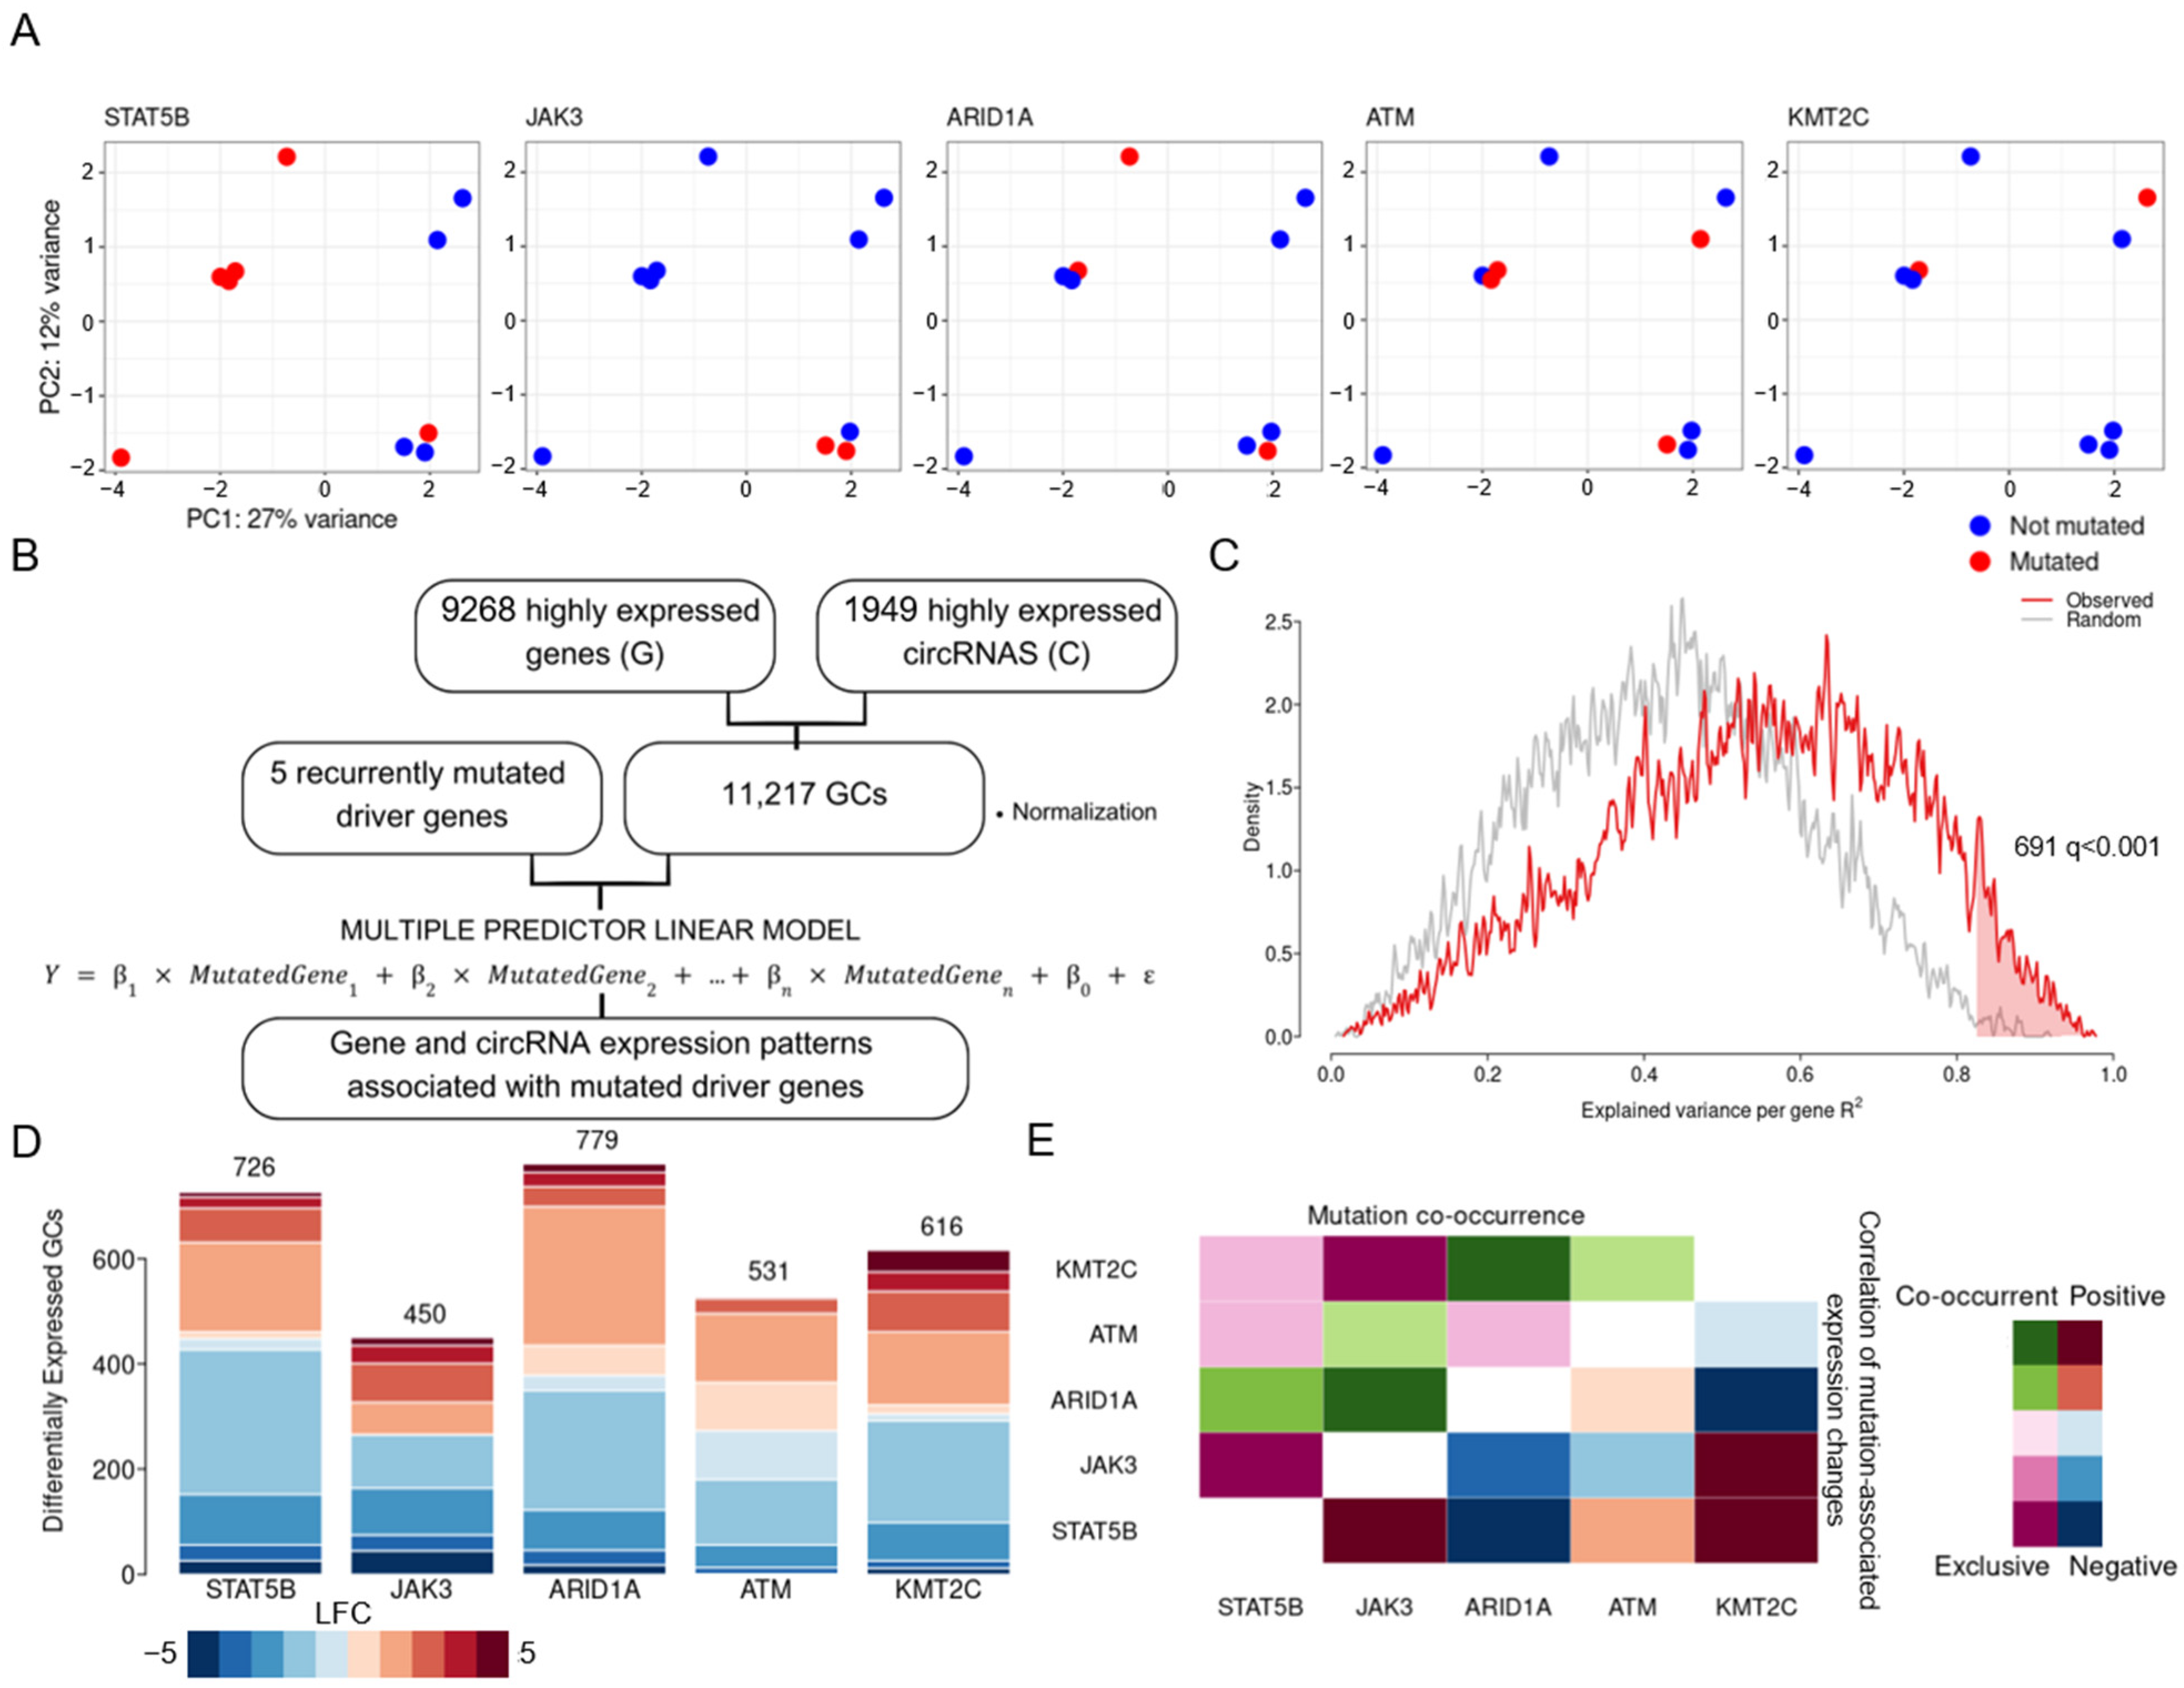
Considering the heterogeneous data obtained, we performed an exploratory analysis of how recurrent orthogonally validated variants in STAT5B, ATM, ARID1A, KMT2C and JAK3 relate to gene and circRNA expression. Expression profiles of 9268 genes and 1949 circRNAs robustly expressed were normalized and merged in an integrated expression matrix. The PCA of patient sample separation indicated that cases sharing the same lesion could have a similar expression profile (Figure 5A). Because several of these lesions co-occur within individual cases, we did not attempt to isolate single-gene effects univariately; instead, a multiple-predictor linear model including all five genotypes was fitted per feature, so that associations are estimated while adjusting for co-occurring variants (Figure 5B). To distinguish genuine associations from those expected under the limited sample size and large feature space, per-feature R2 was benchmarked against an empirical null generated by permuting genotype labels and refitting the identical model; here, 691 features exceeded the null-derived threshold (R2 > 0.82, q < 0.001), indicating collective genotype-associated structure above chance rather than variance attributable to individual lesions (Figure 5C). Thus, 1843 genes or circRNAs in the model were significantly differentially expressed in mutated samples (Figure 5D and Supplementary Table S7). Considering mutation co-occurrence (Figure 5E), the couples JAK3/STAT5B and JAK3/KMT2C, both mutually exclusive in our patient set, were linked to similar expression profiles. Conversely, ARID1A lesions were associated with a distinct profile, although this lesion co-occurred with both KMT2C and JAK3 and partially with STAT5B.
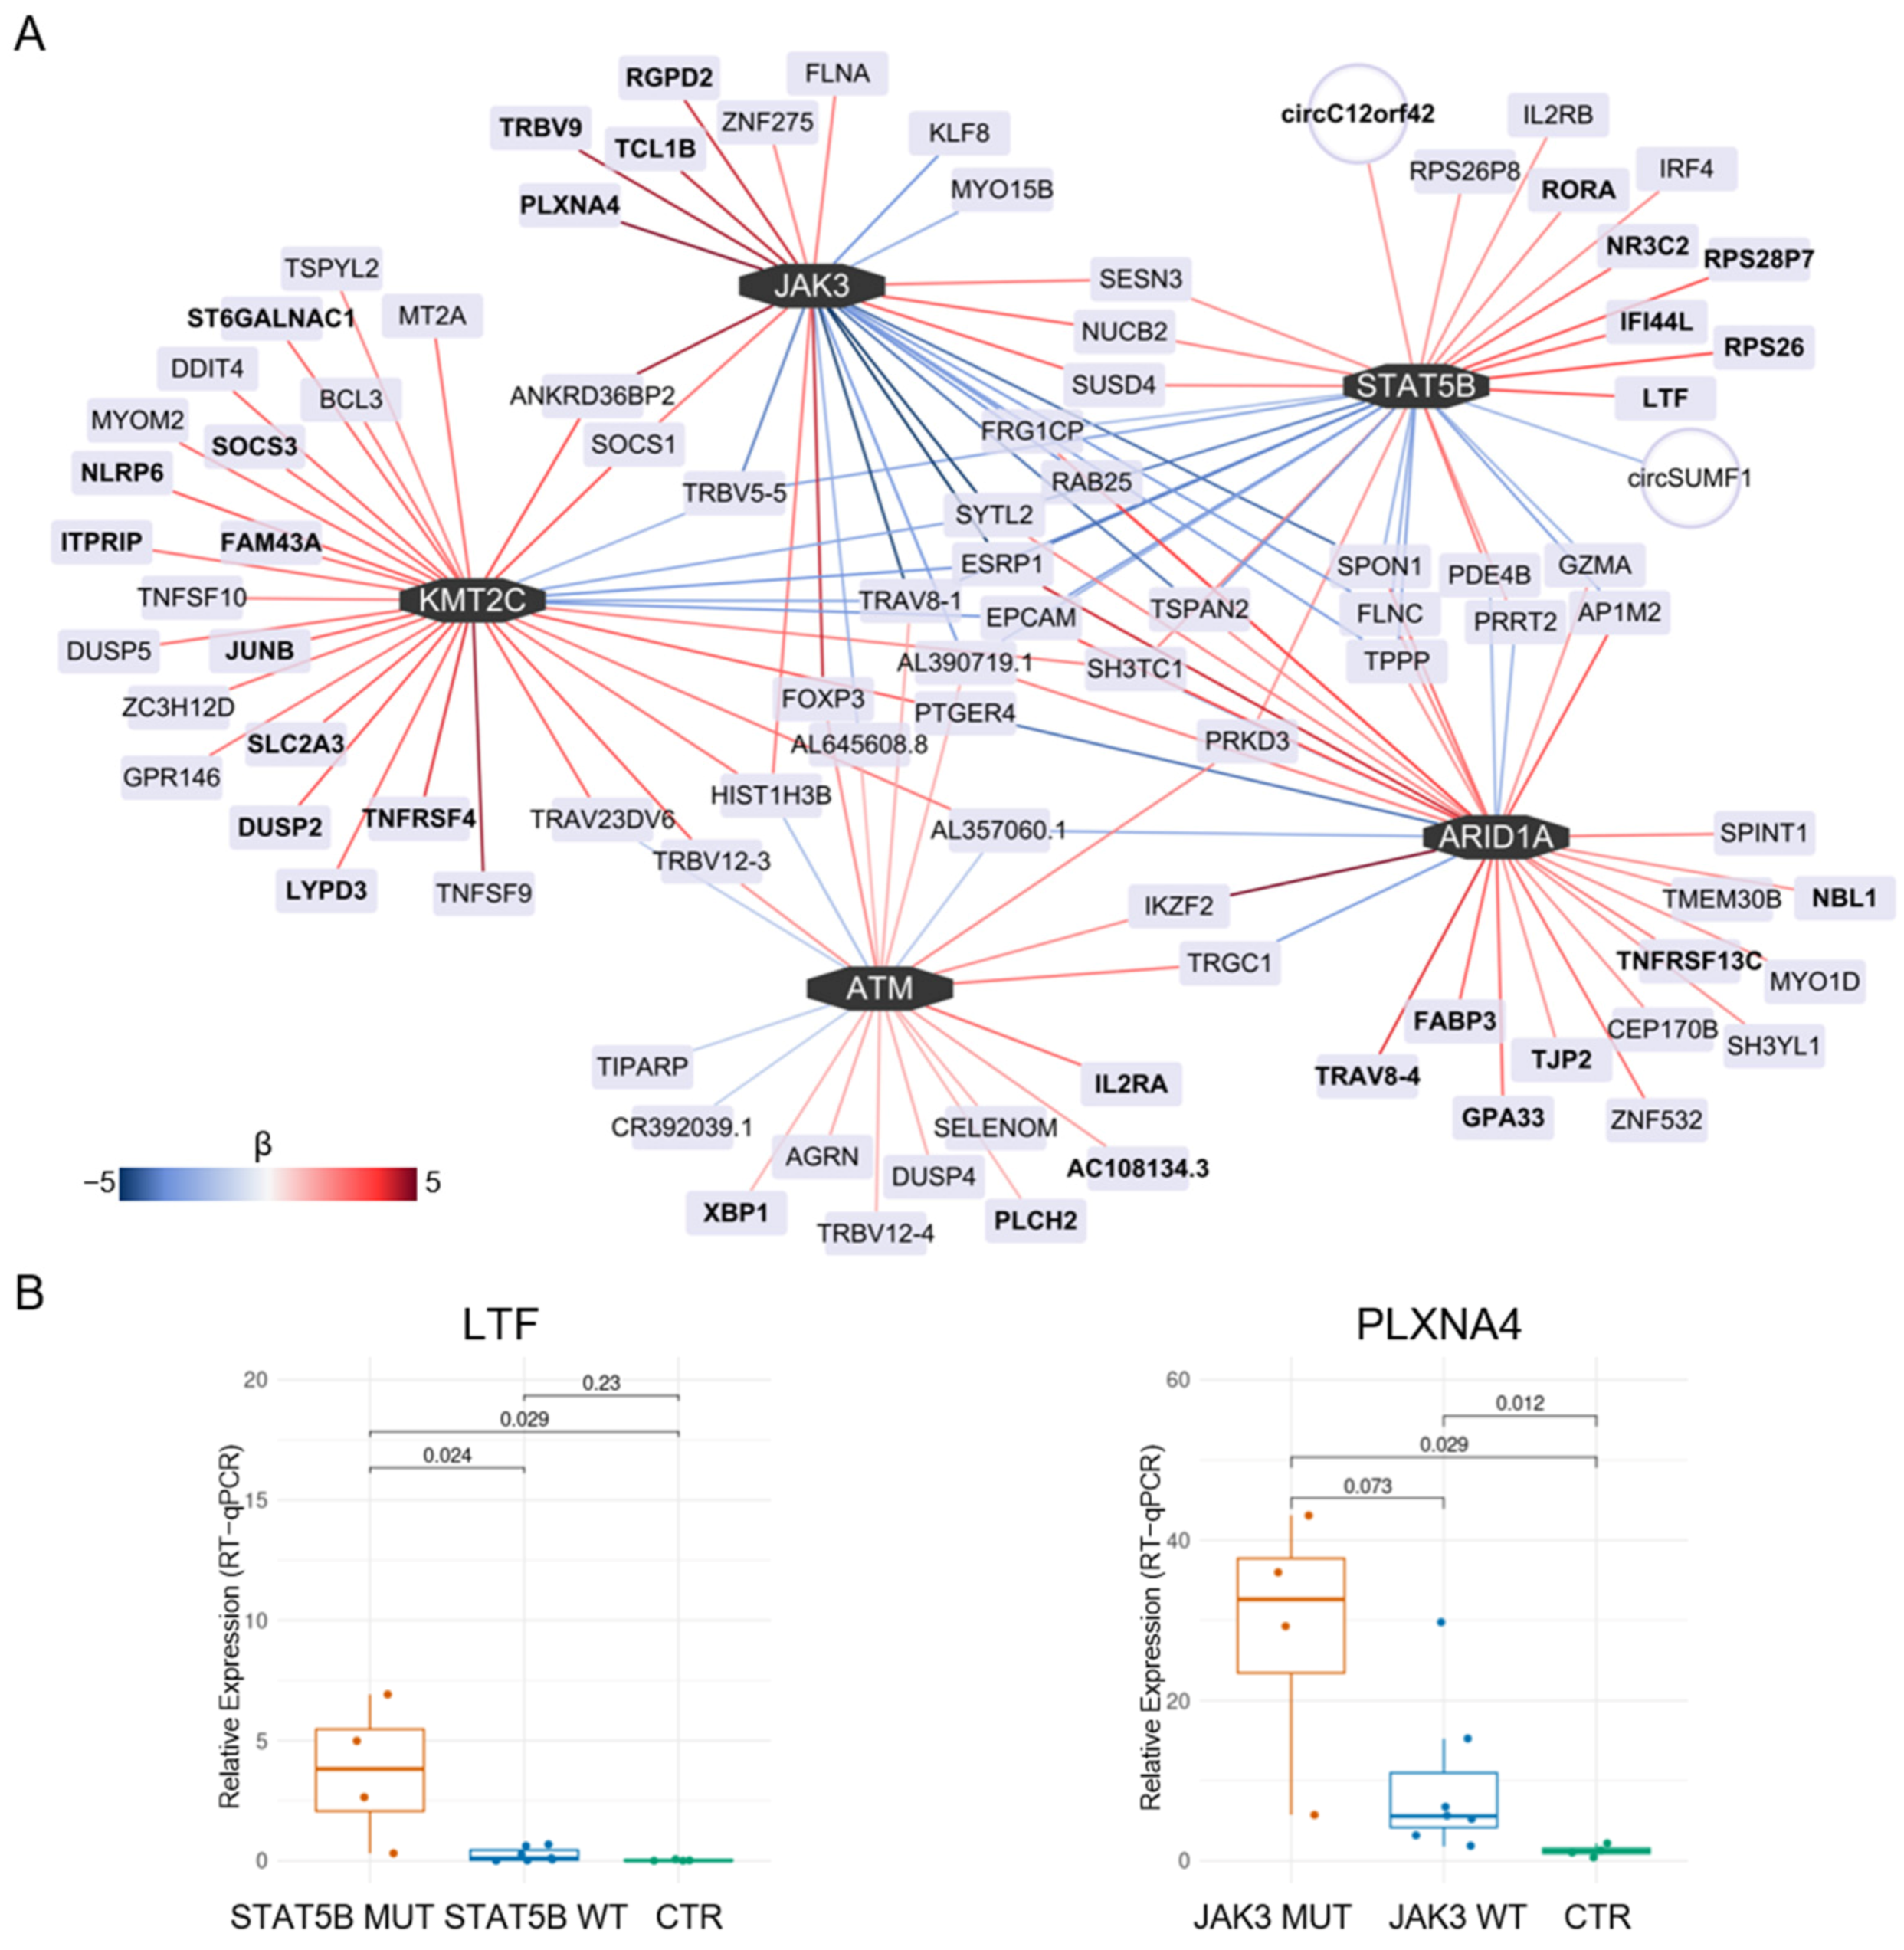
The network in Supplementary Figure S3 shows, for each lesion, the 50 genes or circRNAs whose expression was most strongly associated with mutation status according to the linear model. Of the 51 genes associated with 2–4 mutated genes, 25 showed consistent and 26 showed opposite behavior. For instance, ESRP1 was upregulated in cases with ARID1A mutation and downregulated in STAT5B- and JAK3-mutated cases, whereas FOXP3 was upregulated in JAK3- and ATM-mutated cases. STAT5B- and JAK3-mutated cases shared the upregulation of NUCB2, SESN3 and SUSD4. All the circRNAs and most genes (126, 72%) were instead linked with only one lesion. A reduced network showing, for each lesion, the 25 genes or circRNAs whose expression was most strongly associated, either positively or negatively, with the corresponding mutation status according to the multiple-predictor linear model, is presented in Figure 6A. ATM mutation was linked to the upregulation of IL2RA. ARID1A and, at a lesser extent, ATM lesions were linked to an upregulation of IKZF2. TNFSF9 and TNFRSF4 upregulation were present in cases with KMT2C mutation. Of particular interest, STAT5B lesions were associated with the upregulation of LTF, while in JAK3-mutated cases, PLXNA4 was upregulated. These latter specific upregulations were confirmed in the extended cohort, further strengthening our findings (Figure 6B).

4. Discussion

In this study, we report gene expression and pathway dysregulation, along with aberrations in non-coding and circular transcriptome in T-PLL. By integrating multi-modal data from RNA-seq, we gained a deeper understanding of the heterogeneity in expression profiles associated with this malignancy, providing new insights into links between driver lesions and transcriptome alterations.
We confirmed the overexpression of TCL1A and MYC and uncovered the alteration of the Wnt signaling pathway. We also observed the BCL2 dependency of T-PLL through the overexpression of BCL2L1, pharmacologically inhibited by Venetoclax [33]. This drug has been tested in a recent clinical trial with variable success rates, thus requiring a prior patient stratification for a better benefit from the treatment [34,35,36].
Additionally, we observed the downregulation of several genes in the IL-17 signaling pathway in T-PLL. The confirmed low expression of IL1β, IL18 and NLRP3 in leukemic cells indicates their escape from Fas-induced apoptosis [37] and pyroptosis [38], thus opening new lines of investigation about the pharmacological restoration of the NLRP3/IL1β axis [39].
Beyond gene expression dysregulation, we identified non-coding RNA and circRNA with altered expression in T-PLL. Most of the non-coding RNAs were downregulated, including NEAT1, MIAT, LUCAT1 and LINC00877, whose significantly reduced expression in T-PLL was validated. In acute leukemia [40], it has been demonstrated that the nuclear paraspeckle lncRNA NEAT1 translocates to the cytoplasm suppressing Wnt signaling; thus, its downregulation observed in our cohort might be potentially relevant also in the context of T-PLL as a contributing factor to Wnt signaling hyperactivation. In addition, the circRNAome of T-PLL was found to be highly dysregulated with the ectopic expression in T-PLL of several circRNAs with oncogenic functions [29,30,31]. Amongst the circRNAs with validated upregulation in T-PLL, we detected circSEMA4B, which was previously shown to inhibit IL1β expression acting through the Wnt signaling pathway [41], suggesting an axis worth further investigation in T-PLL. We also confirmed the upregulation of circSATB1 in T-PLL, as observed in T-cell acute lymphoblastic leukemia (T-ALL). This circRNA derives from SATB1, a gene found upregulated in T-PLL which encodes a protein essential for thymocyte maturation and T-ALL pathogenesis [42]. Moreover, the expression of SATB1 is induced upon hyperactivation of Wnt signaling in colorectal cancer [43], further supporting the study of this regulation also in T-PLL. Given the emerging role of circRNAs in cancer and, in particular, in hematological conditions in which circRNA detection was correlated with pathogenesis, chemotherapy resistance and prognosis [15,44,45], our findings could open new lines of investigation in T-PLL, aiming to clarify the contribution of aberrant circRNA expression to the maintenance of the malignant cell phenotype and the progression of disease.
A key point of this study is the exploration of the relationship between complex mutation patterns and gene and circRNA expression in T-PLL. The detection of variants from RNA-seq was able to identify both high- and low-VAF variants, and the robustness of the data was supported by Sanger validation of selected variants. However, RNA-seq-based variant calling is limited to expressed regions and may miss variants in low- or non-expressed genes; it can also be affected by transcript abundance, allele-specific expression, RNA-editing events, and splicing-related artifacts near intron–exon junctions. These issues were considered in our workflow through stringent filtering, including removal of known RNA-editing sites, exclusion of variants close to splice junctions, use of resources, and Sanger confirmation of selected variants. The detection of recurrent variants in the JAK–STAT axis (i.e., STAT5B and JAK3 genes) further confirms its importance in T-PLL [8], which has been recently pharmacologically targeted with promising phase Ib results [46,47,48,49]. Along with the recurrent ATM and KMT2C mutations, these findings align with previously reported clustering of T-PLL mutated gene functions [7]. ARID1A, a novel gene recurrently mutated in our cohort, encodes a subunit of the chromatin remodeling complex and is mutated in several tumors for which clinically applicable drugs based on synthetic lethal strategy have been developed [50]. According to the recurrent oncogenic variants, a group of five genes (STAT5B, JAK3, ATM, KMT2C, and ARID1A) was thus examined to gain a better understanding of genotype/phenotype relations in T-PLL. To this end, we employed a linear model that linked each lesion to a set of genes or circRNAs showing significant expression changes between mutated and non-mutated samples. We considered only validated variants to ground on a solid basis, noting that STAT5B, JAK3, and KMT2C mutations were linked to similar expression patterns, while ATM mutations were associated with milder changes and ARID1A mutations to changes opposite to those seen in the other subgroups.
The strongest associations of our preliminary model of genotype-associated expression changes included the link between STAT5B lesions and the upregulation of lactotransferrin (LTF), an immune modulatory protein whose increased levels in T-ALL cell lines and in CLL inhibit ferroptosis [51]. JAK3-mutated cases displayed upregulation of PLXNA4, a semaphorin receptor, linked to immune modulation in melanoma [52], and downregulation of the chemokine receptor CCR4. ATM mutations were linked to the upregulation of the pro-proliferative interleukin-2 receptor subunit alpha (IL2RA), which is associated with aggressiveness in AML [53], and to the downregulation of PYHIN1, a cell cycle inhibitor [54]. ARID1A lesions were associated with the downregulation of TLE4, a transcription corepressor that negatively regulates the canonical Wnt signaling pathway and acts as a tumor suppressor in acute myeloid [55] and lymphoblastic leukemia [56]. We would like to highlight in patients with KMT2C mutations the upregulation of TNFRSF4, an oncogenic TNF-receptor, which is pharmacologically targeted in hematological cancers [57,58]. The sample size of this study prevents drawing definitive conclusions regarding genotype–phenotype relationships in T-PLL. Therefore, despite their compelling nature, our data about genotype–phenotype relations should be considered preliminary. Nevertheless, validation of the statistical model, together with the confirmation of the association between gene expression changes and oncogenic variants in the extended cohort, provides strong support for our findings.

5. Conclusions

In conclusion, we expanded the knowledge of gene expression aberrancies in T-PLL, presenting robust new data on lncRNAs and circRNAs with aberrant expression and their potential role in this malignancy. Moreover, we characterized the genetic makeup of T-PLL focusing on driver gene mutations and explored the association between gene and circRNA expression profiles and driver genes, offering valuable new clues into the disease’s heterogeneity, which may reflect new lines of investigation for the development of new therapeutic approaches. This approach could be effectively applied to larger cohorts in the future. Collaborative studies will be instrumental, especially for such a rare, incurable and enigmatic disease as T-PLL.

Supplementary Materials

The following supporting information can be downloaded at https://www.mdpi.com/article/10.3390/cancers18152442/s1. Supplementary Methods S1: Samples and mutation screening at diagnosis [59]; Supplementary Methods S2: Gene and circRNA expression estimation from RNA-seq [18,60,61]; Supplementary Methods S3: Oncogenic variant calling from RNA-seq [62,63,64,65,66,67,68,69,70,71,72,73]; Supplementary Methods S4: Functional enrichments [74,75,76,77]; Supplementary Methods S5: Modeling gene and circRNA expression relation with genetic lesions [78]; Figure S1: Gene loadings and KEGG pathway enriched in the principal component analysis (PCA) of T-PLL and control samples, according to gene expression profiles reported in the main Figure 1A; Figure S2: Validation of at least one representative variant per patient by Sanger sequencing; Figure S3: Gene and circRNA expression profile associated with distinct driver gene variants in T-PLL; Table S1: Clinical and molecular data of the T-PLL cohort; Table S2: Primers designed for RT-qPCR and Sanger sequencing; Table S3: Genes differentially expressed in T-PLL compared to CD4+ of healthy donors, with adjusted p-values (padj.) and Log Fold Changes (logFC); Table S4: CircRNAs differentially expressed in T-PLL compared to CD4+ of healthy donors, with adjusted p-values (padj.) and Log Fold Changes (logFC); Table S5: Expressed candidate driver variants detected in T-PLL patients and classified as oncogenic drivers according to Cancer Genome Interpreter (CGI) analysis; Table S6: List of the validated candidate variants detected in T-PLL patients; Table S7: Significant relations between genes hit by point mutations and phenotype, in terms of gene and circRNA expression profile.

Author Contributions

Conceptualization: V.R.G., S.O., A.B., R.Z. and S.B.; methodology: S.O., A.B., A.C., E.R. (Eleonora Roncaglia), R.M. and E.G.; Software: S.O., A.B., A.C., E.R. (Eleonora Roncaglia), R.M., E.G. and S.B.; validation: V.R.G., E.R. (Elisa Rampazzo), G.C., E.B., C.V. and A.T.; formal analysis: V.R.G., S.O., A.B., R.Z. and S.B.; investigation: V.R.G., S.O., A.B., R.Z. and S.B.; resources: G.B., L.P., L.T., M.F., R.Z. and G.S.; data curation: V.R.G., S.O., A.B. and S.B.; writing—original draft preparation: V.R.G., S.O., A.B. and S.B.; writing—review and editing: V.R.G., S.O., A.B. and S.B.; visualization: V.R.G., S.O., A.B. and S.B.; supervision: S.B.; project administration: G.S., R.Z. and S.B.; funding acquisition: G.S., R.Z. and S.B. All authors have read and agreed to the published version of the manuscript.

Funding

This work was supported by grants from Fondazione AIRC per la Ricerca sul Cancro (IG 2017 #20216 to G.S.; IG 2017 #20052 and IG 2023 #28966 to S.B.; IG 2023 #29058 to R.Z.), EU funding within the MUR PNRR “National Center for Gene Therapy and Drugs based on RNA Technology” (Project no. CN00000041 CN3 Spoke #6 “RNA chemistry”) to S.B. and R.Z. and “National Center for HPC, Big Data and Quantum Computing” (Project no. CN00000013 CN1 Spoke #8 “In Silico Medicine & Omics Data”) to S.B., PRIN MIUR 2022 #20222EC7LA to S.B. and Fondazione Cariparo Excellence project 68070 to R.Z. and S.B. VRG fellowship was granted by AIRC IT#26815.

Institutional Review Board Statement

The study was conducted in accordance with the Declaration of Helsinki and approved by the Padua Provincial Ethical Committee for Clinical Trials (CESC code 5229/AO/21; URC code AOP2436; date of approval 20 January 2022).

Informed Consent Statement

Informed consent was obtained from all subjects involved in the study. Written informed consent has been obtained from the patient(s) to publish this paper.

Data Availability Statement

RNA-seq data (GSE281431) are freely available at Gene Expression Omnibus (https://www.ncbi.nlm.nih.gov/geo/, accessed on 26 July 2026).

Conflicts of Interest

The authors declare no conflicts of interest.

References

  1. Staber, P.B.; Herling, M.; Bellido, M.; Jacobsen, E.D.; Davids, M.S.; Kadia, T.M.; Shustov, A.; Tournilhac, O.; Bachy, E.; Zaja, F.; et al. Consensus Criteria for Diagnosis, Staging, and Treatment Response Assessment of T-Cell Prolymphocytic Leukemia. Blood 2019, 134, 1132–1143. [Google Scholar] [CrossRef] [Scilit] [PubMed]
  2. Cross, M.; Dearden, C. B and T Cell Prolymphocytic Leukaemia. Best Pract. Res. Clin. Haematol. 2019, 32, 217–228. [Google Scholar] [CrossRef] [Scilit] [PubMed]
  3. Braun, T.; von Jan, J.; Wahnschaffe, L.; Herling, M. Advances and Perspectives in the Treatment of T-PLL. Curr. Hematol. Malig. Rep. 2020, 15, 113–124. [Google Scholar] [CrossRef] [Scilit] [PubMed]
  4. Vardell, V.A.; Ermann, D.A.; Shah, H.; Fitzgerald, L.A.; Hu, B.; Stephens, D.M. T-Cell Prolymphocytic Leukemia: Trends in Overall Survival Demonstrate Marginal Improvement over Time and Minimal Benefit with Currently Available Treatments. Blood 2022, 140, 1085–1086. [Google Scholar] [CrossRef] [Scilit]
  5. Laribi, K.; Lemaire, P.; Sandrini, J.; Baugier de Materre, A. Advances in the Understanding and Management of T-Cell Prolymphocytic Leukemia. Oncotarget 2017, 8, 104664–104686. [Google Scholar] [CrossRef] [Scilit] [PubMed]
  6. Herling, M.; Patel, K.A.; Teitell, M.A.; Konopleva, M.; Ravandi, F.; Kobayashi, R.; Jones, D. High TCL1 Expression and Intact T-Cell Receptor Signaling Define a Hyperproliferative Subset of T-Cell Prolymphocytic Leukemia. Blood 2008, 111, 328–337. [Google Scholar] [CrossRef] [Scilit] [PubMed]
  7. Schrader, A.; Crispatzu, G.; Oberbeck, S.; Mayer, P.; Pützer, S.; von Jan, J.; Vasyutina, E.; Warner, K.; Weit, N.; Pflug, N.; et al. Actionable Perturbations of Damage Responses by TCL1/ATM and Epigenetic Lesions Form the Basis of T-PLL. Nat. Commun. 2018, 9, 697. [Google Scholar] [CrossRef] [Scilit] [PubMed]
  8. Wahnschaffe, L.; Braun, T.; Timonen, S.; Giri, A.K.; Schrader, A.; Wagle, P.; Almusa, H.; Johansson, P.; Bellanger, D.; López, C.; et al. JAK/STAT-Activating Genomic Alterations Are a Hallmark of T-PLL. Cancers 2019, 11, 1833. [Google Scholar] [CrossRef] [Scilit] [PubMed]
  9. Kiel, M.J.; Velusamy, T.; Rolland, D.; Sahasrabuddhe, A.A.; Chung, F.; Bailey, N.G.; Schrader, A.; Li, B.; Li, J.Z.; Ozel, A.B.; et al. Integrated Genomic Sequencing Reveals Mutational Landscape of T-Cell Prolymphocytic Leukemia. Blood 2014, 124, 1460–1472. [Google Scholar] [CrossRef] [Scilit] [PubMed]
  10. Bellanger, D.; Jacquemin, V.; Chopin, M.; Pierron, G.; Bernard, O.A.; Ghysdael, J.; Stern, M.-H. Recurrent JAK1 and JAK3 Somatic Mutations in T-Cell Prolymphocytic Leukemia. Leukemia 2014, 28, 417–419. [Google Scholar] [PubMed]
  11. Dürig, J.; Bug, S.; Klein-Hitpass, L.; Boes, T.; Jöns, T.; Martin-Subero, J.I.; Harder, L.; Baudis, M.; Dührsen, U.; Siebert, R. Combined Single Nucleotide Polymorphism-Based Genomic Mapping and Global Gene Expression Profiling Identifies Novel Chromosomal Imbalances, Mechanisms and Candidate Genes Important in the Pathogenesis of T-Cell Prolymphocytic Leukemia with inv(14)(q11q32). Leukemia 2007, 21, 2153–2163. [Google Scholar] [CrossRef] [Scilit] [PubMed]
  12. Braun, T.; Glass, M.; Wahnschaffe, L.; Otte, M.; Mayer, P.; Franitza, M.; Altmüller, J.; Hallek, M.; Hüttelmaier, S.; Schrader, A.; et al. Micro-RNA Networks in T-Cell Prolymphocytic Leukemia Reflect T-Cell Activation and Shape DNA Damage Response and Survival Pathways. Haematologica 2022, 107, 187–200. [Google Scholar] [PubMed]
  13. Erkeland, S.J.; Stavast, C.J.; Schilperoord-Vermeulen, J.; Dal Collo, G.; Van de Werken, H.J.G.; Leon, L.G.; Van Hoven-Beijen, A.; Van Zuijen, I.; Mueller, Y.M.; Bindels, E.M.; et al. The miR-200c/141-ZEB2-TGFβ Axis Is Aberrant in Human T-Cell Prolymphocytic Leukemia. Haematologica 2022, 107, 143–153. [Google Scholar] [PubMed]
  14. Patil, P.; Hillebrecht, S.; Chteinberg, E.; López, C.; Toprak, U.H.; Seufert, J.; Bernhart, S.H.; Kretzmer, H.; Bergmann, A.K.; Bens, S.; et al. T-Cell Prolymphocytic Leukemia Is Associated with Deregulation of Oncogenic microRNAs on Transcriptional and Epigenetic Level. Genes Chromosom. Cancer 2022, 61, 432–436. [Google Scholar] [CrossRef] [Scilit] [PubMed]
  15. Cui, Y.-B.; Wang, L.-J.; Xu, J.-H.; Nan, H.-J.; Yang, P.-Y.; Niu, J.-W.; Shi, M.-Y.; Bai, Y.-L. Recent Progress of CircRNAs in Hematological Malignancies. Int. J. Med. Sci. 2024, 21, 2544–2561. [Google Scholar] [CrossRef] [Scilit] [PubMed]
  16. Wong, N.K.; Huang, C.-L.; Islam, R.; Yip, S.P. Long Non-Coding RNAs in Hematological Malignancies: Translating Basic Techniques into Diagnostic and Therapeutic Strategies. J. Hematol. Oncol. 2018, 11, 131. [Google Scholar] [CrossRef] [Scilit] [PubMed]
  17. Alaggio, R.; Amador, C.; Anagnostopoulos, I.; Attygalle, A.D.; de Oliveira Araujo, I.B.; Berti, E.; Bhagat, G.; Borges, A.M.; Boyer, D.; Calaminici, M.; et al. The 5th Edition of the World Health Organization Classification of Haematolymphoid Tumours: Lymphoid Neoplasms. Leukemia 2022, 36, 1720–1748. [Google Scholar] [CrossRef] [Scilit] [PubMed]
  18. Gaffo, E.; Buratin, A.; Dal Molin, A.; Bortoluzzi, S. Sensitive, Reliable and Robust circRNA Detection from RNA-Seq with CirComPara2. Brief. Bioinform. 2022, 23, bbab418. [Google Scholar] [CrossRef] [Scilit] [PubMed]
  19. Bai, J.; Yao, B.; Wang, L.; Sun, L.; Chen, T.; Liu, R.; Yin, G.; Xu, Q.; Yang, W. lncRNA A1BG-AS1 Suppresses Proliferation and Invasion of Hepatocellular Carcinoma Cells by Targeting miR-216a-5p. J. Cell. Biochem. 2019, 120, 10310–10322. [Google Scholar] [PubMed]
  20. Fang, K.; Caixia, H.; Xiufen, Z.; Zijian, G.; Li, L. Screening of a Novel Upregulated lncRNA, A2M-AS1, That Promotes Invasion and Migration and Signifies Poor Prognosis in Breast Cancer. Biomed. Res. Int. 2020, 2020, 9747826. [Google Scholar] [CrossRef] [Scilit] [PubMed]
  21. Li, W.; Ke, C.; Yang, C.; Li, J.; Chen, Q.; Xia, Z.; Xu, J. LncRNA DICER1-AS1 Promotes Colorectal Cancer Progression by Activating the MAPK/ERK Signaling Pathway through Sponging miR-650. Cancer Med. 2023, 12, 8351–8366. [Google Scholar] [CrossRef] [Scilit] [PubMed]
  22. Zeng, C.; Xu, Y.; Xu, L.; Yu, X.; Cheng, J.; Yang, L.; Chen, S.; Li, Y. Inhibition of Long Non-Coding RNA NEAT1 Impairs Myeloid Differentiation in Acute Promyelocytic Leukemia Cells. BMC Cancer 2014, 14, 693. [Google Scholar] [CrossRef] [Scilit] [PubMed]
  23. Rostami, M.; Kharajo, R.S.; Parsa-Kondelaji, M.; Ayatollahi, H.; Sheikhi, M.; Keramati, M.R. Altered Expression of NEAT1 Variants and P53, PTEN, and BCL-2 Genes in Patients with Acute Myeloid Leukemia. Leuk. Res. 2022, 115, 106807. [Google Scholar] [CrossRef] [Scilit] [PubMed]
  24. Role of lncRNA LUCAT1 in Cancer. Biomed. Pharmacother. 2021, 134, 111158. [CrossRef] [Scilit] [PubMed]
  25. Cruz-Miranda, G.M.; Olarte-Carrillo, I.; Bárcenas-López, D.A.; Martínez-Tovar, A.; Ramírez-Bello, J.; Ramos-Peñafiel, C.O.; García-Laguna, A.I.; Cerón-Maldonado, R.; May-Hau, D.; Jiménez-Morales, S. Transcriptome Analysis in Mexican Adults with Acute Lymphoblastic Leukemia. Int. J. Mol. Sci. 2024, 25, 1750. [Google Scholar] [CrossRef] [Scilit] [PubMed]
  26. Khanmohammadi, S.; Fallahtafti, P. Long Non-Coding RNA as a Novel Biomarker and Therapeutic Target in Aggressive B-Cell Non-Hodgkin Lymphoma: A Systematic Review. J. Cell. Mol. Med. 2023, 27, 1928–1946. [Google Scholar] [CrossRef] [Scilit] [PubMed]
  27. Yildirim, E.; Kirby, J.E.; Brown, D.E.; Mercier, F.E.; Sadreyev, R.I.; Scadden, D.T.; Lee, J.T. Xist RNA Is a Potent Suppressor of Hematologic Cancer in Mice. Cell 2013, 152, 727–742. [Google Scholar] [CrossRef] [Scilit] [PubMed]
  28. Jin, K.; Wang, S.; Zhang, Y.; Xia, M.; Mo, Y.; Li, X.; Li, G.; Zeng, Z.; Xiong, W.; He, Y. Long Non-Coding RNA PVT1 Interacts with MYC and Its Downstream Molecules to Synergistically Promote Tumorigenesis. Cell. Mol. Life Sci. 2019, 76, 4275–4289. [Google Scholar] [CrossRef] [Scilit] [PubMed]
  29. Ghetti, M.; Vannini, I.; Bochicchio, M.T.; Azzali, I.; Ledda, L.; Marconi, G.; Melloni, M.; Fabbri, F.; Rondoni, M.; Chicchi, R.; et al. Uncovering the Expression of circPVT1 in the Extracellular Vesicles of Acute Myeloid Leukemia Patients. Biomed. Pharmacother. 2023, 165, 115235. [Google Scholar] [CrossRef] [Scilit] [PubMed]
  30. Tretti Parenzan, C.; Molin, A.D.; Longo, G.; Gaffo, E.; Buratin, A.; Cani, A.; Boldrin, E.; Serafin, V.; Guglielmelli, P.; Vannucchi, A.M.; et al. Functional Relevance of circRNA Aberrant Expression in Pediatric Acute Leukemia with KMT2A::AFF1 Fusion. Blood Adv. 2024, 8, 1305–1319. [Google Scholar] [CrossRef] [Scilit] [PubMed]
  31. Zhou, Y.; Xue, X.; Luo, J.; Li, P.; Xiao, Z.; Zhang, W.; Zhou, J.; Li, P.; Zhao, J.; Ge, H.; et al. Circular RNA Circ-FIRRE Interacts with HNRNPC to Promote Esophageal Squamous Cell Carcinoma Progression by Stabilizing GLI2 mRNA. Cancer Sci. 2023, 114, 3608–3622. [Google Scholar] [CrossRef] [Scilit] [PubMed]
  32. Gaffo, E.; Boldrin, E.; Dal Molin, A.; Bresolin, S.; Bonizzato, A.; Trentin, L.; Frasson, C.; Debatin, K.-M.; Meyer, L.H.; Te Kronnie, G.; et al. Circular RNA Differential Expression in Blood Cell Populations and Exploration of circRNA Deregulation in Pediatric Acute Lymphoblastic Leukemia. Sci. Rep. 2019, 9, 14670. [Google Scholar] [CrossRef] [Scilit] [PubMed]
  33. Smith, V.M.; Lomas, O.; Constantine, D.; Palmer, L.; Schuh, A.H.; Bruce, D.; Gonchar, O.; Macip, S.; Jayne, S.; Dyer, M.J.S.; et al. Dual Dependence on BCL2 and MCL1 in T-Cell Prolymphocytic Leukemia. Blood Adv. 2020, 4, 525–529. [Google Scholar] [CrossRef] [Scilit] [PubMed]
  34. Herbaux, C.; Kornauth, C.; Poulain, S.; Chong, S.J.F.; Collins, M.C.; Valentin, R.; Hackett, L.; Tournilhac, O.; Lemonnier, F.; Dupuis, J.; et al. BH3 Profiling Identifies Ruxolitinib as a Promising Partner for Venetoclax to Treat T-Cell Prolymphocytic Leukemia. Blood 2021, 137, 3495–3506. [Google Scholar] [CrossRef] [Scilit] [PubMed]
  35. Herling, M.; Dearden, C.; Zaja, F.; El-Sharkawi, D.; Ding, W.; Bellido, M.; Khot, A.; Tick, L.; Jacobsen, E.; Eyre, T.A.; et al. Limited Efficacy for Ibrutinib and Venetoclax in T-Prolymphocytic Leukemia: Results from a Phase 2 International Study. Blood Adv. 2024, 8, 842–845. [Google Scholar] [CrossRef] [Scilit] [PubMed]
  36. von Jan, J.; Timonen, S.; Braun, T.; Jiang, Q.; Ianevski, A.; Peng, Y.; McConnell, K.; Sindaco, P.; Müller, T.A.; Pützer, S.; et al. Optimizing Drug Combinations for T-PLL: Restoring DNA Damage and P53-Mediated Apoptotic Responses. Blood 2024, 144, 1595–1610. [Google Scholar] [CrossRef] [Scilit] [PubMed]
  37. Wang, P.; Qian, H.; Xiao, M.; Lv, J. Role of Signal Transduction Pathways in IL-1β-Induced Apoptosis: Pathological and Therapeutic Aspects. Immun. Inflamm. Dis. 2023, 11, e762. [Google Scholar] [CrossRef] [Scilit] [PubMed]
  38. Toldo, S.; Abbate, A. The Role of the NLRP3 Inflammasome and Pyroptosis in Cardiovascular Diseases. Nat. Rev. Cardiol. 2024, 21, 219–237. [Google Scholar] [PubMed]
  39. Rébé, C.; Ghiringhelli, F. Interleukin-1β and Cancer. Cancers 2020, 12, 1791. [Google Scholar] [CrossRef] [Scilit] [PubMed]
  40. Yan, H.; Wang, Z.; Sun, Y.; Hu, L.; Bu, P. Cytoplasmic NEAT1 Suppresses AML Stem Cell Self-Renewal and Leukemogenesis through Inactivation of Wnt Signaling. Adv. Sci. 2021, 8, e2100914. [Google Scholar] [CrossRef] [Scilit]
  41. Wang, X.; Wang, B.; Zou, M.; Li, J.; Lü, G.; Zhang, Q.; Liu, F.; Lu, C. CircSEMA4B Targets miR-431 Modulating IL-1β-Induced Degradative Changes in Nucleus Pulposus Cells in Intervertebral Disc Degeneration via Wnt Pathway. Biochim. Biophys. Acta Mol. Basis Dis. 2018, 1864, 3754–3768. [Google Scholar] [CrossRef] [Scilit] [PubMed]
  42. Buratin, A.; Paganin, M.; Gaffo, E.; Dal Molin, A.; Roels, J.; Germano, G.; Siddi, M.T.; Serafin, V.; De Decker, M.; Gachet, S.; et al. Large-Scale Circular RNA Deregulation in T-ALL: Unlocking Unique Ectopic Expression of Molecular Subtypes. Blood Adv. 2020, 4, 5902–5914. [Google Scholar] [CrossRef] [Scilit] [PubMed]
  43. Mir, R.; Pradhan, S.J.; Patil, P.; Mulherkar, R.; Galande, S. Wnt/β-catenin signaling regulated SATB1 promotes colorectal cancer tumorigenesis and progression. Oncogene 2016, 35, 1679–1691. [Google Scholar] [CrossRef] [Scilit] [PubMed]
  44. Bonizzato, A.; Gaffo, E.; Te Kronnie, G.; Bortoluzzi, S. CircRNAs in Hematopoiesis and Hematological Malignancies. Blood Cancer J. 2016, 6, e483. [Google Scholar] [CrossRef] [Scilit] [PubMed]
  45. Visci, G.; Tolomeo, D.; Agostini, A.; Traversa, D.; Macchia, G.; Storlazzi, C.T. CircRNAs and Fusion-circRNAs in Cancer: New Players in an Old Game. Cell Signal. 2020, 75, 109747. [Google Scholar] [CrossRef] [Scilit] [PubMed]
  46. Boidol, B.; Kornauth, C.; van der Kouwe, E.; Prutsch, N.; Kazianka, L.; Gültekin, S.; Hoermann, G.; Mayerhoefer, M.E.; Hopfinger, G.; Hauswirth, A.; et al. First-in-Human Response of BCL-2 Inhibitor Venetoclax in T-Cell Prolymphocytic Leukemia. Blood 2017, 130, 2499–2503. [Google Scholar] [CrossRef] [Scilit] [PubMed]
  47. Kadia, T.M.; Ravandi, F.; Borthakur, G.; Yilmaz, M.; Montalban-Bravo, G.; Adewale, L.; Pierce, S.A.; Jain, N.; Ferrajoli, A.; Wierda, W.G.; et al. A Phase Ib Pilot Study of Itacitinib Combined with Alemtuzumab in Patients with T-Cell Prolymphocytic Leukemia (T-PLL). Blood 2021, 138, 1375. [Google Scholar] [CrossRef] [Scilit]
  48. Hampel, P.J.; Parikh, S.A.; Call, T.G.; Shah, M.V.; Bennani, N.N.; Al-Kali, A.; Rabe, K.G.; Wang, Y.; Muchtar, E.; Leis, J.F.; et al. Venetoclax Treatment of Patients with Relapsed T-Cell Prolymphocytic Leukemia. Blood Cancer J. 2021, 11, 47. [Google Scholar] [CrossRef] [Scilit] [PubMed]
  49. Brothers, J.; Castillo, D.R.; Jeon, W.J.; Joung, B.; Linhares, Y. Partial Response to Venetoclax and Ruxolitinib Combination in a Case of Refractory T-Prolymphocytic Leukemia. Hematology 2023, 28, 2237342. [Google Scholar] [CrossRef] [Scilit] [PubMed]
  50. Xu, S.; Tang, C. The Role of ARID1A in Tumors: Tumor Initiation or Tumor Suppression? Front. Oncol. 2021, 11, 745187. [Google Scholar] [CrossRef] [Scilit] [PubMed]
  51. Tian, C.; Zheng, M.; Lan, X.; Liu, L.; Ye, Z.; Li, C. Silencing LCN2 Enhances RSL3-Induced Ferroptosis in T Cell Acute Lymphoblastic Leukemia. Gene 2023, 879, 147597. [Google Scholar] [CrossRef] [Scilit] [PubMed]
  52. Celus, W.; Oliveira, A.I.; Rivis, S.; Van Acker, H.H.; Landeloos, E.; Serneels, J.; Cafarello, S.T.; Van Herck, Y.; Mastrantonio, R.; Köhler, A.; et al. Plexin-A4 Mediates Cytotoxic T-Cell Trafficking and Exclusion in Cancer. Cancer Immunol. Res. 2022, 10, 126–141. [Google Scholar] [PubMed]
  53. Nguyen, C.H.; Schlerka, A.; Grandits, A.M.; Koller, E.; van der Kouwe, E.; Vassiliou, G.S.; Staber, P.B.; Heller, G.; Wieser, R. IL2RA Promotes Aggressiveness and Stem Cell-Related Properties of Acute Myeloid Leukemia. Cancer Res. 2020, 80, 4527–4539. [Google Scholar] [CrossRef] [Scilit] [PubMed]
  54. Wang, S.; Bai, J. Functions and Roles of IFIX, a Member of the Human HIN-200 Family, in Human Diseases. Mol. Cell. Biochem. 2022, 477, 771–780. [Google Scholar] [CrossRef] [Scilit] [PubMed]
  55. Shin, T.H.; Brynczka, C.; Dayyani, F.; Rivera, M.N.; Sweetser, D.A. TLE4 Regulation of Wnt-Mediated Inflammation Underlies Its Role as a Tumor Suppressor in Myeloid Leukemia. Leuk. Res. 2016, 48, 46–56. [Google Scholar] [CrossRef] [Scilit] [PubMed]
  56. Brassesco, M.S.; Pezuk, J.A.; Cortez, M.A.; Bezerra Salomão, K.; Scrideli, C.A.; Tone, L.G. TLE1 as an Indicator of Adverse Prognosis in Pediatric Acute Lymphoblastic Leukemia. Leuk. Res. 2018, 74, 42–46. [Google Scholar] [CrossRef] [Scilit] [PubMed]
  57. Liu, L.; Wu, Y.; Ye, K.; Cai, M.; Zhuang, G.; Wang, J. Antibody-Targeted TNFRSF Activation for Cancer Immunotherapy: The Role of FcγRIIB Cross-Linking. Front. Pharmacol. 2022, 13, 924197. [Google Scholar] [CrossRef] [Scilit] [PubMed]
  58. Marconato, M.; Kauer, J.; Salih, H.R.; Märklin, M.; Heitmann, J.S. Expression of the Immune Checkpoint Modulator OX40 Indicates Poor Survival in Acute Myeloid Leukemia. Sci. Rep. 2022, 12, 15856. [Google Scholar] [CrossRef] [Scilit] [PubMed]
  59. Gasparini, V.R.; Binatti, A.; Coppe, A.; Teramo, A.; Vicenzetto, C.; Calabretto, G.; Barilà, G.; Barizza, A.; Giussani, E.; Facco, M.; et al. A high definition picture of somatic mutations in chronic lymphoproliferative disorder of natural killer cells. Blood Cancer J. 2020, 10, 42. [Google Scholar] [CrossRef] [Scilit] [PubMed]
  60. Love, M.I.; Huber, W.; Anders, S. Moderated estimation of fold change and dispersion for RNA-seq data with DESeq2. Genome Biol. 2014, 15, 550. [Google Scholar] [CrossRef] [Scilit] [PubMed]
  61. Robinson, M.D.; McCarthy, D.J.; Smyth, G.K. edgeR: A Bioconductor package for differential expression analysis of digital gene expression data. Bioinformatics 2010, 26, 139–140. [Google Scholar] [CrossRef] [Scilit] [PubMed]
  62. Dobin, A.; Davis, C.A.; Schlesinger, F.; Drenkow, J.; Zaleski, C.; Jha, S.; Batut, P.; Chaisson, M.; Gingeras, T.R. STAR: Ultrafast universal RNA-seq aligner. Bioinformatics 2013, 29, 15–21. [Google Scholar] [PubMed]
  63. Van der Auwera, G.A.; O’Connor, B.D. Genomics in the Cloud: Using Docker, GATK, and WDL in Terra; O’Reilly Media: Sebastopol, CA, USA, 2020. [Google Scholar]
  64. Poplin, R.; Ruano-Rubio, V.; DePristo, M.A.; Fennell, T.J.; Carneiro, M.O.; Van der Auwera, G.A.; Kling, D.E.; Gauthier, L.D.; Levy-Moonshine, A.; Roazen, D.; et al. Scaling accurate genetic variant discovery to tens of thousands of samples. BioRxiv 2017. [Google Scholar] [CrossRef] [Scilit]
  65. Cingolani, P.; Platts, A.; Wang, L.L.; Coon, M.; Nguyen, T.; Wang, L.; Land, S.J.; Lu, X.; Ruden, D.M. A program for annotating and predicting the effects of single nucleotide polymorphisms, SnpEff: SNPs in the genome of Drosophila melanogaster strain w1118. Fly 2012, 6, 80–92. [Google Scholar] [CrossRef] [Scilit] [PubMed]
  66. Cingolani, P.; Patel, V.M.; Coon, M.; Nguyen, T.; Land, S.J.; Ruden, D.M.; Lu, X. Using Drosophila melanogaster as a Model for Genotoxic Chemical Mutational Studies with a New Program, SnpSift. Front. Genet 2012, 3, 35. [Google Scholar] [CrossRef] [Scilit] [PubMed]
  67. Sherry, S.T.; Ward, M.-H.; Kholodov, M.; Baker, J.; Phan, L.; Smigielski, E.M.; Sirotkin, K. dbSNP: The NCBI database of genetic variation. Nucleic Acids Res. 2001, 29, 308–311. [Google Scholar] [CrossRef] [Scilit] [PubMed]
  68. Landrum, M.J.; Lee, J.M.; Benson, M.; Brown, G.R.; Chao, C.; Chitipiralla, S.; Gu, B.; Hart, J.; Hoffman, D.; Jang, W.; et al. ClinVar: Improving access to variant interpretations and supporting evidence. Nucleic Acids Res. 2018, 46, D1062–D1067. [Google Scholar] [PubMed]
  69. Tate, J.G.; Bamford, S.; Jubb, H.C.; Sondka, Z.; Beare, D.M.; Bindal, N.; Boutselakis, H.; Cole, C.G.; Creatore, C.; Dawson, E.; et al. COSMIC: The Catalogue of Somatic Mutations in Cancer. Nucleic Acids Res. 2019, 47, D941–D947. [Google Scholar] [PubMed]
  70. Karczewski, K.J.; Francioli, L.C.; Tiao, G.; Cummings, B.B.; Alfoldi, J.; Wang, Q.; Collins, R.L.; Laricchia, K.M.; Ganna, A.; Birnbaum, D.P.; et al. The mutational constraint spectrum quantified from variation in 141,456 humans. Nature 2020, 581, 434–443. [Google Scholar] [CrossRef] [Scilit] [PubMed]
  71. Picardi, E.; D’Erchia, A.M.; Lo Giudice, C.; Pesole, G. REDIportal: A comprehensive 12 database of A-to-I RNA editing events in humans. Nucleic Acids Res. 2017, 45, D750–D757. [Google Scholar] [PubMed]
  72. Cotto, K.C.; Feng, Y.-Y.; Ramu, A.; Richters, M.; Freshour, S.L.; Skidmore, Z.L.; Xia, H.; McMichael, J.F.; Kunisaki, J.; Campbell, K.M.; et al. RegTools: Integrated analysis of genomic and transcriptomic data for the discovery of splice-associated variants in cancer. Nat. Commun. 2023, 14, 1–18. [Google Scholar] [CrossRef] [Scilit]
  73. Tamborero, D.; Rubio-Perez, C.; Deu-Pons, J.; Schroeder, M.P.; Vivancos, A.; Rovira, A.; Tusquets, I.; Albanell, J.; Rodon, J.; Tabernero, J.; et al. Cancer Genome Interpreter annotates the biological and clinical relevance of tumor alterations. Genome Med. 2018, 10, 25. [Google Scholar] [CrossRef] [Scilit] [PubMed]
  74. Kanehisa, M.; Goto, S. KEGG: Kyoto encyclopedia of genes and genomes. Nucleic Acids Res. 2000, 28, 27–30. [Google Scholar] [CrossRef] [Scilit] [PubMed]
  75. Subramanian, A.; Tamayo, P.; Mootha, V.K.; Mukherjee, S.; Ebert, B.L.; Gillette, M.A.; Paulovich, A.; Pomeroy, S.L.; Golub, T.R.; Lander, E.S.; et al. Gene set enrichment analysis: A knowledge-based approach for interpreting genome-wide expression profiles. Proc. Natl. Acad. Sci. USA 2005, 102, 15545–15550. [Google Scholar] [CrossRef] [Scilit] [PubMed]
  76. Wu, T.; Hu, E.; Xu, S.; Chen, M.; Guo, P.; Dai, Z.; Feng, T.; Zhou, L.; Tang, W.; Zhan, L.; et al. clusterProfiler 4.0: A universal enrichment tool for interpreting omics data. Innovation 2021, 2, 100141. [Google Scholar] [CrossRef] [Scilit] [PubMed]
  77. Huang, D.W.; Sherman, B.T.; Lempicki, R.A. Bioinformatics enrichment tools: Paths toward the comprehensive functional analysis of large gene lists. Nucleic Acids Res. 2009, 37, 1–13. [Google Scholar] [CrossRef] [Scilit] [PubMed]
  78. Smyth, G.K. Linear models and empirical bayes methods for assessing differential expression in microarray experiments. Stat. Appl. Genet Mol. Biol. 2004, 3, 3. [Google Scholar] [CrossRef] [Scilit]
Figure 1. Aberrant gene expression and pathway activation in T-PLL. (A) Principal component analysis (PCA) of 10 T-PLL and 5 control (CTR) samples according to gene expression profiles; (B) heatmap of expression profiles (average clustering based on Spearman correlation-based distance; scaled expression) and (C) enriched KEGG pathways according to GSEA of 3693 differentially expressed genes comparing T-PLL with CTR (adj. p-value < 0.01); (D) RT-qPCR quantification of gene expression in an extended cohort of 16 T-PLL cases and 9 CTR (*, **, ***, **** Mann–Whitney p-value < 0.05, 0.01, 0.001, 0.0001).
Cancers 18 02442 g001
Figure 2. Long non-coding RNAs (lncRNAs) and antisense RNAs with altered expression in T-PLL. (A) Pie chart of number and percentage of up- and downregulated RNAs; waterfall plots of (B) antisense RNAs and (C) lncRNAs with significant differential expression between T-PLL and CTR (adj. p-value < 0.01; only transcripts with |LFC| > 1 are shown; the bar color indicates the average expression as TPM (transcripts per million reads); bold text with light grey background indicates the RNAs cited in the main text; (D) RT-qPCR quantification of transcript expression in an extended cohort of 16 T-PLL cases and 9 CTR (*, ***, Mann–Whitney p-value < 0.05, 0.001).
Cancers 18 02442 g002
Figure 3. The aberrant circRNAome of T-PLL. (A) Principal component analysis (PCA) of 10 T-PLL and 5 control (CTR) samples according to circRNA expression profiles; (B) heatmap of 261 circRNAs differentially expressed comparing T-PLL with CTR (adj. p-value < 0.01; names are shown for circRNAs with |LFC| ≥ 2 and high expression with backsplice junction counts >150; average clustering based on Euclidean distance, scaled expression); (C) structure (exons and backsplice junction, BS) and RT-qPCR quantification of circRNA expression in an extended cohort of 16 T-PLL cases and 9 CTR (*, **, **** Mann–Whitney p-value < 0.05, 0.01, 0.0001).
Cancers 18 02442 g003
Figure 4. Genes and pathways hit by expressed candidate driver variants inferred from RNA-seq data in T-PLL. Circos plot indicates the links between mutated genes and significantly enriched KEGG pathways; the barplot below shows the genes with driver variants detected in each patient, indicating the estimated variant allele frequency (VAF) class for each mutation.
Cancers 18 02442 g004
Figure 5. A model of the association between driver gene mutations and gene and circRNA expression profile alteration in T-PLL. (A) Principal component analysis (PCA) of 10 T-PLL cases according to gene and circRNA expression profiles; for each of the mutated genes considered (STAT5B, JAK3, ARID1A, ATM and KMT2C), a plot shows as red and blue dots the samples with and without the gene mutation, respectively; (B) overview of the strategy used to identify genes and circRNAs whose expression was most strongly associated with the presence of the investigated mutations (see the main text and Supplementary Materials for more details); (C) per-feature variance explained (R2) by the five genomic alterations (red) and empirical null obtained by permuting genotype labels and refitting the same model (grey). Shaded: 691 features above the null-derived threshold (R2 > 0.82, q < 0.001); (D) number of genes and circRNAs differentially expressed in the presence of each mutation, indicating separately the numbers of up-and downregulated elements with different LFC classes; (E) pairwise relationships among the five recurrently mutated genes. Lower triangle: Pearson correlation between mutation-associated expression-change profiles (per-gene coefficient vectors from the multiple-predictor linear model across 1843 features); red, concordant; blue, opposing. Upper triangle: mutation co-occurrence across the cohort (odds ratios from the binary mutation–status matrix); green, co-occurrent; pink, mutually exclusive. Because co-occurring lesions are collinear predictors, the two triangles are not independent.
Cancers 18 02442 g005
Figure 6. Gene and circRNA expression profile associated with distinct driver gene variants in T-PLL. (A) Network representation of the strongest associations detected between driver variants and gene and circRNA expression changes. For each mutated gene, the 25 genes or circRNAs whose expression was most strongly associated with mutation status according to the linear model are shown; edge colors indicate linear model β coefficients; genes and circRNAs highlighted in bold are significantly associated with only one mutated gene, according to the model. (B) Relative expression quantified by RT-qPCR (DDCt method, normalized to GAPDH) in T-PLL cases with and without the driver variant (4 STAT5B mutated and 7 with wild-type STAT5B for LTF and 4 JAK3 mutated and 7 with wild-type JAK3 for PLXNA4) and 4 CTR (The Wilcoxon test p-value is reported for each comparison).
Cancers 18 02442 g006
Table 1. Clinical and molecular characteristics of the T-PLL cases profiled by RNA-seq. Clinical and molecular characteristics of the 10 T-PLL cases profiled by RNA-seq at diagnosis. Patients were subdivided by age, sex, treatment requirement, phenotypic analysis of the leukemic clone and TCR Vbeta expression. Not identified Vbeta means that the expansion was not recognizable, as it was not included within the approximately 70% of the TCR Vβ repertoire covered by the kit. Blood counts included white blood cells (WBC; 4.4–11 × 109/L in CTR), hemoglobin (Hb; 140–175 g/L in CTR), absolute neutrophil count (ANC; 1.8–7.8 × 10⁹/L in CTR), lymphocyte (Ly; 1.1–4.8 × 10⁹/L in CTR) and platelets (PLT; 150–450 × 109/L in CTR) counts. Mutational status of the hotspot regions of STAT5B and JAK3 genes was determined by Sanger sequencing. NA: not available. More detailed features are reported in Supplementary Table S1.
Demographic
Age (years)69 mean; 46–86 range
Sex5 female; 5 male
Phenotype
CD4/7/25/26+ (number; %)2/10 (20%)
CD4/7/25+ CD26− (number; %)3/10 (30%)
CD4/7/26+ CD25− (number; %)3/10 (30%)
CD4/7+ CD25/26− (number; %)2/10 (20%)
TCR Vbeta
Not identified37.5%
Vbeta 112.5%
Vbeta 13.112.5%
Vbeta 5.312.5%
Vbeta 7.125%
Blood counts at recruitment
WBC (×109/L)68.76 mean; 29.03–135.83 range
Hb (g/L)121.7 mean; 81–150 range
ANC (×109/L)3.44 mean; 0.94–8.73 range; 3 NA
Ly (×109/L)51.58 mean; 25.58–84.31 range; 3 NA
PLT (×109/L)169.4 mean; 71–360 range
STAT5B screening
STAT5B mutated6/10 (60%)
STAT5B wild-type4/10 (40%)
JAK3 screening
JAK3 mutated2/10 (20%)
JAK3 wild-type8/10 (80%)
Disclaimer/Publisher’s Note: The statements, opinions and data contained in all publications are solely those of the individual author(s) and contributor(s) and not of MDPI and/or the editor(s). MDPI and/or the editor(s) disclaim responsibility for any injury to people or property resulting from any ideas, methods, instructions or products referred to in the content.