Free Light Chain Monomer—Dimer Pattern Analysis as Non-Invasive Tool in Predicting MGUS and SMM Progression †
 ,
,  , and
, and
Simple Summary
Abstract
1. Introduction
2. Materials and Methods
- (a)
- Dimerization index: iD/iM,
- (b)
- Clonality D index: iD/uD,
- (c)
- Clonality M index: iM/uM.
3. Results
4. Discussion
5. Conclusions
Supplementary Materials
Author Contributions
Funding
Institutional Review Board Statement
Informed Consent Statement
Data Availability Statement
Conflicts of Interest
Abbreviations
| AL | Amyloid light chain amyloidosis |
| BM | Bone marrow |
| BMPC | Bone marrow plasma cells |
| CRAB | Hypercalcemia, renal insufficiency, anemia, bone lesions |
| dFLC | Difference between involved and uninvolved free light chains |
| FLC | Free light chain |
| FLC-MDPA | Free light chain-monomer–dimer pattern analysis |
| FC | Flow cytometry |
| HR | Hazard ratio |
| IHC | Immunohistochemistry |
| IMWG | International Myeloma Working Group |
| MGUS | Monoclonal gammopathy of undetermined significance |
| MM | Multiple myeloma |
| MRI | Magnetic resonance imaging |
| NPD | Non-progressive disease |
| PC | Plasma cells |
| PCD | Plasma cell disorders |
| PD | Progressive disease |
| SMM | Smoldering multiple myeloma |
| WB | Western blot |
References
- Kyle, R.A.; Therneau, T.M.; Rajkumar, S.V.; Larson, D.R.; Plevak, M.F.; Offord, J.R.; Dispenzieri, A.; Katzmann, J.A.; Melton, L.J. Prevalence of Monoclonal Gammopathy of Undetermined Significance. N. Engl. J. Med. 2006, 354, 1362–1369. [Google Scholar] [CrossRef] [Scilit]
- Kyle, R.A.; Durie, B.G.M.; Rajkumar, S.V.; Landgren, O.; Blade, J.; Merlini, G.; Kröger, N.; Einsele, H.; Vesole, D.H.; Dimopoulos, M.; et al. Monoclonal Gammopathy of Undetermined Significance (MGUS) and Smoldering (Asymptomatic) Multiple Myeloma: IMWG Consensus Perspectives Risk Factors for Progression and Guidelines for Monitoring and Management. Leukemia 2010, 24, 1121–1127. [Google Scholar] [CrossRef] [Scilit] [PubMed]
- Mateos, M.-V.; Kumar, S.; Dimopoulos, M.A.; González-Calle, V.; Kastritis, E.; Hajek, R.; De Larrea, C.F.; Morgan, G.J.; Merlini, G.; Goldschmidt, H.; et al. International Myeloma Working Group Risk Stratification Model for Smoldering Multiple Myeloma (SMM). Blood Cancer J. 2020, 10, 102. [Google Scholar] [CrossRef] [Scilit] [PubMed]
- Pérez-Persona, E.; Vidriales, M.-B.; Mateo, G.; García-Sanz, R.; Mateos, M.-V.; De Coca, A.G.; Galende, J.; Martín-Nuñez, G.; Alonso, J.M.; De Las Heras, N.; et al. New Criteria to Identify Risk of Progression in Monoclonal Gammopathy of Uncertain Significance and Smoldering Multiple Myeloma Based on Multiparameter Flow Cytometry Analysis of Bone Marrow Plasma Cells. Blood 2007, 110, 2586–2592. [Google Scholar] [CrossRef] [Scilit] [PubMed]
- Rajkumar, S.V.; Kyle, R.A.; Therneau, T.M.; Melton, L.J.; Bradwell, A.R.; Clark, R.J.; Larson, D.R.; Plevak, M.F.; Dispenzieri, A.; Katzmann, J.A. Serum Free Light Chain Ratio Is an Independent Risk Factor for Progression in Monoclonal Gammopathy of Undetermined Significance. Blood 2005, 106, 812–817. [Google Scholar] [CrossRef] [Scilit] [PubMed]
- Zanwar, S.; Rajkumar, S.V. Current Risk Stratification and Staging of Multiple Myeloma and Related Clonal Plasma Cell Disorders. Leukemia 2025, 39, 2610–2617. [Google Scholar] [CrossRef] [Scilit] [PubMed]
- Bustoros, M.; Anand, S.; Sklavenitis-Pistofidis, R.; Redd, R.; Boyle, E.M.; Zhitomirsky, B.; Dunford, A.J.; Tai, Y.-T.; Chavda, S.J.; Boehner, C.; et al. Genetic Subtypes of Smoldering Multiple Myeloma Are Associated with Distinct Pathogenic Phenotypes and Clinical Outcomes. Nat. Commun. 2022, 13, 3449. [Google Scholar] [CrossRef] [Scilit] [PubMed]
- Visram, A.; Cook, J.; Warsame, R. Smoldering Multiple Myeloma: Evolving Diagnostic Criteria and Treatment Strategies. Hematology 2021, 2021, 673–681. [Google Scholar] [CrossRef] [Scilit] [PubMed]
- Korde, N.; Kristinsson, S.Y.; Landgren, O. Monoclonal Gammopathy of Undetermined Significance (MGUS) and Smoldering Multiple Myeloma (SMM): Novel Biological Insights and Development of Early Treatment Strategies. Blood 2011, 117, 5573–5581. [Google Scholar] [CrossRef] [Scilit] [PubMed]
- Medina-Herrera, A.; Vazquez, I.; Cuenca, I.; Rosa-Rosa, J.M.; Ariceta, B.; Jimenez, C.; Fernandez-Mercado, M.; Larrayoz, M.J.; Gutierrez, N.C.; Fernandez-Guijarro, M.; et al. The Genomic Profiling of High-Risk Smoldering Myeloma Patients Treated with an Intensive Strategy Unveils Potential Markers of Resistance and Progression. Blood Cancer J. 2024, 14, 74. [Google Scholar] [CrossRef] [Scilit] [PubMed]
- Dimopoulos, M.A.; Voorhees, P.M.; Schjesvold, F.; Cohen, Y.C.; Hungria, V.; Sandhu, I.; Lindsay, J.; Baker, R.I.; Suzuki, K.; Kosugi, H.; et al. Daratumumab or Active Monitoring for High-Risk Smoldering Multiple Myeloma. N. Engl. J. Med. 2025, 392, 1777–1788. [Google Scholar] [CrossRef] [Scilit] [PubMed]
- Kaplan, B.; Ramirez-Alvarado, M.; Sikkink, L.; Golderman, S.; Dispenzieri, A.; Livneh, A.; Gallo, G. Free Light Chains in Plasma of Patients with Light Chain Amyloidosis and Non-Amyloid Light Chain Deposition Disease. High Proportion and Heterogeneity of Disulfide-Linked Monoclonal Free Light Chains as Pathogenic Features of Amyloid Disease. Br. J. Haematol. 2009, 144, 705–715. [Google Scholar] [CrossRef] [Scilit] [PubMed]
- Kaplan, B.; Golderman, S.; Aizenbud, B.; Esev, K.; Kukuy, O.; Leiba, M.; Livneh, A.; Ben-Zvi, I. Immunoglobulin-free Light Chain Monomer-dimer Patterns Help to Distinguish Malignant from Premalignant Monoclonal Gammopathies: A Pilot Study. Am. J. Hematol. 2014, 89, 882–888. [Google Scholar] [CrossRef] [Scilit] [PubMed]
- Gatt, M.E.; Kaplan, B.; Yogev, D.; Slyusarevsky, E.; Pogrebijski, G.; Golderman, S.; Kukuy, O.; Livneh, A. The Use of Serum Free Light Chain Dimerization Patterns Assist in the Diagnosis of AL Amyloidosis. Br. J. Haematol. 2018, 182, 86–92. [Google Scholar] [CrossRef] [Scilit] [PubMed]
- Kukuy, O.; Kaplan, B.; Golderman, S.; Volkov, A.; Duek, A.; Leiba, M.; Ben-Zvi, I.; Livneh, A. Kidney Disease and Plasma Cell Dyscrasias: Ambiguous Cases Solved by Serum Free Light Chain Dimerization Analysis. Clin. Exp. Nephrol. 2019, 23, 763–772. [Google Scholar] [CrossRef] [Scilit] [PubMed]
- Rajkumar, S.V.; Dimopoulos, M.A.; Palumbo, A.; Blade, J.; Merlini, G.; Mateos, M.-V.; Kumar, S.; Hillengass, J.; Kastritis, E.; Richardson, P.; et al. International Myeloma Working Group Updated Criteria for the Diagnosis of Multiple Myeloma. Lancet Oncol. 2014, 15, e538–e548. [Google Scholar] [CrossRef] [Scilit] [PubMed]
- Durie, B.G.M.; Harousseau, J.-L.; Miguel, J.S.; Bladé, J.; Barlogie, B.; Anderson, K.; Gertz, M.; Dimopoulos, M.; Westin, J.; Sonneveld, P.; et al. International Uniform Response Criteria for Multiple Myeloma. Leukemia 2006, 20, 1467–1473. [Google Scholar] [CrossRef] [Scilit] [PubMed]
- Dispenzieri, A.; Kyle, R.; Merlini, G.; Miguel, J.S.; Ludwig, H.; Hajek, R.; Palumbo, A.; Jagannath, S.; Blade, J.; Lonial, S.; et al. International Myeloma Working Group Guidelines for Serum-Free Light Chain Analysis in Multiple Myeloma and Related Disorders. Leukemia 2009, 23, 215–224. [Google Scholar] [CrossRef] [Scilit] [PubMed]
- Lakshman, A.; Rajkumar, S.V.; Buadi, F.K.; Binder, M.; Gertz, M.A.; Lacy, M.Q.; Dispenzieri, A.; Dingli, D.; Fonder, A.L.; Hayman, S.R.; et al. Risk Stratification of Smoldering Multiple Myeloma Incorporating Revised IMWG Diagnostic Criteria. Blood Cancer J. 2018, 8, 59. [Google Scholar] [CrossRef] [Scilit] [PubMed]
- Óskarsson, J.Þ.; Rögnvaldsson, S.; Thorsteinsdottir, S.; Long, T.E.; Ólafsson, A.; Eythorsson, E.; Jónsson, Á.; Viðarsson, B.; Önundarson, P.T.; Agnarsson, B.A.; et al. The Significance of Free Light-Chain Ratio in Light-Chain Monoclonal Gammopathy of Undetermined Significance: A Flow Cytometry Sub-Study of the iStopMM Screening Study. Blood Cancer J. 2024, 14, 221. [Google Scholar] [CrossRef] [Scilit] [PubMed]
- Giles, H.V.; Drayson, M.T.; Kishore, B.; Pawlyn, C.; Kaiser, M.; Cook, G.; de Tute, R.; Owen, R.G.; Cairns, D.; Menzies, T.; et al. Progression Free Survival of Myeloma Patients Who Become IFE-Negative Correlates with the Detection of Residual Monoclonal Free Light Chain (FLC) by Mass Spectrometry. Blood Cancer J. 2024, 14, 50. [Google Scholar] [CrossRef] [Scilit] [PubMed]
- Murray, D.L.; Puig, N.; Kristinsson, S.; Usmani, S.Z.; Dispenzieri, A.; Bianchi, G.; Kumar, S.; Chng, W.J.; Hajek, R.; Paiva, B.; et al. Mass Spectrometry for the Evaluation of Monoclonal Proteins in Multiple Myeloma and Related Disorders: An International Myeloma Working Group Mass Spectrometry Committee Report. Blood Cancer J. 2021, 11, 24. [Google Scholar] [CrossRef] [Scilit] [PubMed]
- Dispenzieri, A.; Larson, D.R.; Rajkumar, S.V.; Kyle, R.A.; Kumar, S.K.; Kourelis, T.; Arendt, B.; Willrcih, M.; Dasari, S.; Murray, D. N-Glycosylation of Monoclonal Light Chains on Routine MASS-FIX Testing Is a Risk Factor for MGUS Progression. Leukemia 2020, 34, 2749–2753. [Google Scholar] [CrossRef] [Scilit] [PubMed]
- Chabrun, F.; Schwartz, D.E.; Gentile, S.; Mai, E.K.; Gupta, T.R.; Perry, J.; Cordas dos Santos, D.M.; Hielscher, T.; Werly, A.; Schmidt, S.K.; et al. Enhanced Dynamic Risk Stratification of Smoldering Multiple Myeloma. Nat. Med. 2026, 32, 1745–1753. [Google Scholar] [CrossRef] [Scilit] [PubMed]
- Massart, D.L.; Vandeginste, B.G.M.; Buydens, L.M.C.; De Jong, S.; Lewi, P.J.; Smeyers-Verbeke, J. Handbook of Chemometrics and Qualimetrics: Part A; Elsevier: Amsterdam, The Netherlands, 1997; p. 31. [Google Scholar]
- David, H.A. Further applications of range to analysis of variance. Biometrika 1951, 38, 393. [Google Scholar] [CrossRef] [Scilit]
- Dahlberg, G. Statistical Methods for Medical and Biological Students; G. Allen & Unwin Ltd.: London, UK, 1940. [Google Scholar]
- Hae-Young, K. Statistical notes for clinical researchers: Evaluation of measurement error 2: Dahlberg’s error, Bland-Altman method, and Kappa coefficient. Restor. Dent. Endod. 2013, 38, 82–185. [Google Scholar] [CrossRef] [Scilit]
- Little, T.A. Establishing acceptance criteria for analytical methods. BioPharm Int. 2016, 29, 44–48. [Google Scholar]



| Variable | MGUS (N = 68) | SMM (N = 40) | p | |
|---|---|---|---|---|
| Age (median) | 68 (42–88) | 68 (34–92) | 0.91 | |
| Gender | Male (n, %) | 50 (74.6%) | 23 (56.1%) | 0.001 ** |
| Female (n, %) | 18 (43.9%) | 17 (25.4%) | ||
| M-Protein Type | IgA (n, %) | 17 (25%) | 13 (33%) | <0.001 ** |
| IgG (n, %) | 18 (27%) | 22 (55%) | ||
| IgM (n, %) | 9 (13%) | 0 (0%) | ||
| LC (n, %) | 24 (34%) | 5 (12%) | ||
| LC Type | κ (n, %) | 43 (63%) | 26 (65%) | 0.84 |
| λ (n, %) | 25 (37%) | 14 (35%) | ||
| Immunoglobulin (mg/dL) | IgA (Median) | 796 (482–3516) | 1290 (482–3952) | 0.01 * |
| IgG (Median) | 1870 (1500–2974) | 2594 (1513–7470) | 0.02 * | |
| IgM (Median) | 1600 (155–1734) | - | - | |
| FLC (mg/L) | FLC κ (Median) | 72.9 (6.61–394) | 58 (10.72–994) | 0.55 |
| FLC λ (Median) | 30.0 (2.29–617) | 15.2 (1.59–814) | 0.08 | |
| FLC Ratio (Median) | 4.9 (1.02–670.0) | 6.3 (1.05–72.2) | 0.41 | |
| dFLC (Median) | 88.9 (2.6–571.0) | 91.7 (3.2–962.6) | 0.48 | |
| M-Protein (Median, g/dL) | 0.52 (0.03–3.52) | 1.37 (0.03–7.47) | 0.001 ** | |
| Immunoparesis (n, %) | 19 (28%) | 22 (56%) | <0.01 * | |
| Albumin (Median, g/dL) | 4.2 (3.5–5.2) | 4.1 (3.5–4.6) | 0.32 | |
| Creatinine (Median, mg/dL) | 1.06 (0.01–2.88) | 0.89 (0.61–2.43) | 0.04 * | |
| β2 microglobulin (Median, mg/L) | 3.37 (0.4–12.1) | 4 (0.7–10.0) | 0.42 | |
| BMPC% (Median, IHC) | 7.5 (3–20) | 15 (3–70) | <0.01 * | |
| BMPC% (Median, FC) | 1.05 (0.12–9) | 4.7 (0.3–36) | 0.02 * | |
| FISH CA HR (n, %) | 4 (6%) | 4 (10%) | 0.95 | |
| Aberrant cell > 95% (n, %) | 8 (11.7%) | 7 (18%) | 0.96 | |
| Variable | Clinical Progression (Yes/No) | p | Biochemical Progression (Yes/No) | p | p a | |||
|---|---|---|---|---|---|---|---|---|
| No PD (N = 82) | PD (N = 26) | No PD (N = 56) | PD (N = 46) | |||||
| Gender | Male (n, %) | 56 (68%) | 12 (46%) | 0.06 | 38 (68%) | 25 (54%) | 0.18 | 0.8 |
| Female (n, %) | 26 (32%) | 14 (54%) | 18 (32%) | 21 (46%) | ||||
| PCD | MGUS (n, %) | 59 (72%) | 9 (35%) | <0.01 * | 40 (71%) | 22 (48%) | 0.02 * | 0.8 |
| SMM (n, %) | 23 (28%) | 17 (65%) | 16 (29%) | 24 (52%) | ||||
| Age, years (Median) | 69 (42–92) | 67 (34–86) | 0.91 | 67 (42–92) | 71 (34–91) | 0.02 * | 0.68 | |
| M-Protein Type | IgA (n, %) | 21 (26%) | 9 (35%) | 0.66 | 22 (39%) | 7 (15%) | 0.04 * | 0.99 |
| IgG (n, %) | 30 (37%) | 10 (38%) | 17 (30%) | 23 (50%) | ||||
| IgM (n, %) | 8 (10%) | 1 (4%) | 5 (9%) | 3 (7%) | ||||
| LC (n, %) | 23 (28%) | 6 (23%) | 12 (21%) | 13 (28%) | ||||
| LC Type | κ (n, %) | 56 (68%) | 23 (88%) | 0.03 * | 42 (75%) | 33 (72%) | 0.88 | 0.59 |
| λ (n, %) | 26 (32%) | 3 (12%) | 14 (25%) | 13 (28%) | ||||
| M-Protein (Median, g/dL) | 1.02 (0.03–4.98) | 3.30 (0.03–7.47) | <0.001 ** | 0.9 (0.03–4.98) | 2.2 (0.03–7.47) | <0.001 ** | 0.94 | |
| Immunoglobulin (mg/dL) | IgA (Median) | 800 (482–1807) | 1830 (482–3952) | <0.001 ** | 911 (482–3952) | 1715 (482–3205) | 0.15 | 0.87 |
| IgG (Median) | 2147 (1500–4978) | 3049 (1536–7470) | 1787 (1513–2800) | 2730 (1500–7470) | ||||
| IgM (Median) | 1635 (155–1734) | 1600 (1600–1600) | 1525 (155–1670) | 1734 (1600–1734) | ||||
| FLC (mg/L) | FLC κ (Median) | 48.7 (6.61–592) | 83.2 (13.10–1246) | 0.04 * | 46.27 (6.61–592) | 94 (7.39–1246) | 0.07 | 0.99 |
| FLC λ (Median) | 24.29 (0.83–814) | 14.1 (1.59–617) | 21.06 (0.83–418) | 21.82 (1.59–814) | ||||
| FLC Ratio (Median) | 5 (1–80) | 8 (1–89) | 0.05 * | 3 (1–80) | 11.33 (1–89) | <0.001 ** | 0.79 | |
| dFLC (Median) | 88.9 (2.6–571.0) | 91.7 (3.2–962.6) | 0.48 | 77.3 (2.6–571.0) | 165.6 (11.5–962.6) | 0.06 | 0.99 | |
| Creatinine (Median, mg/dL) | 1 (0.53–2.88) | 0.91 (0.64–4.18) | 0.41 | 0.99 (0.53–4.18) | 0.97 (0.61–2.024) | 0.84 | 0.32 | |
| Albumin (Median, g/dL) | 4.2 (3.5–5.2) | 4 (3.5–4.8) | 0.02 * | 4.2 (3.5–5.2) | 4.1 (3.5–4.8) | 0.31 | 0.98 | |
| β2 microglobulin (Median, mg/L) | 4.03 (0.01–7217.0) | 3.43 (0.00–12,093) | 0.72 | 3.75 (0.01–12,093.0) | 3.43 (0.00–10,099) | 0.41 | 0.71 | |
| M-Protein > 2 (n, %) | 14 (17.5%) | 15 (57%) | <0.001 ** | 7 (12.3%) | 22 (47%) | <0.0001 *** | 0.88 | |
| FLC Ratio > 20 (n, %) | 7 (8.8%) | 9 (34%) | 0.01 * | 5 (8.8%) | 11 (23%) | 0.05 * | 1 | |
| BMPC > 20% (n, %) | 2 (2%) | 4 (15%) | 0.03 * | 3 (5%) | 3 (6%) | 1 | 1 | |
| BMPC % (Median, IHC) | 5 (3–50%) | 15 (5–70.0%) | <0.01 * | 7.5 (3–70%) | 8 (3–50%) | 0.45 | 0.15 | |
| BMPC % (Median, FC) | 1 (0.12–6%) | 7.5 (0.28–36%) | <0.001 ** | 1.7 (0.12–36%) | 2 (0.2–20%) | 0.34 | 0.09 | |
| FISH CA HR (n, %) | 4 (5%) | 5 (19%) | 0.04 * | 0 (0%) | 5 (11%) | 0.02 * | 0.41 | |
| Immunoparesis (n, %) | 29 (34%) | 12 (46%) | 0.36 | 24 (42.1%) | 17 (37%) | 0.69 | 0.78 | |
| Aberrant cell > 95% (n, %) | 9 (10%) | 4 (15%) | 0.51 | 6 (10%) | 8 (17%) | 0.39 | 0.84 | |
| Progression to MM (n, %) | 2 (2.5%) | 21 (80%) | <0.0001 *** | 4 (7.0%) | 19 (41%) | <0.001 ** | 0.87 | |
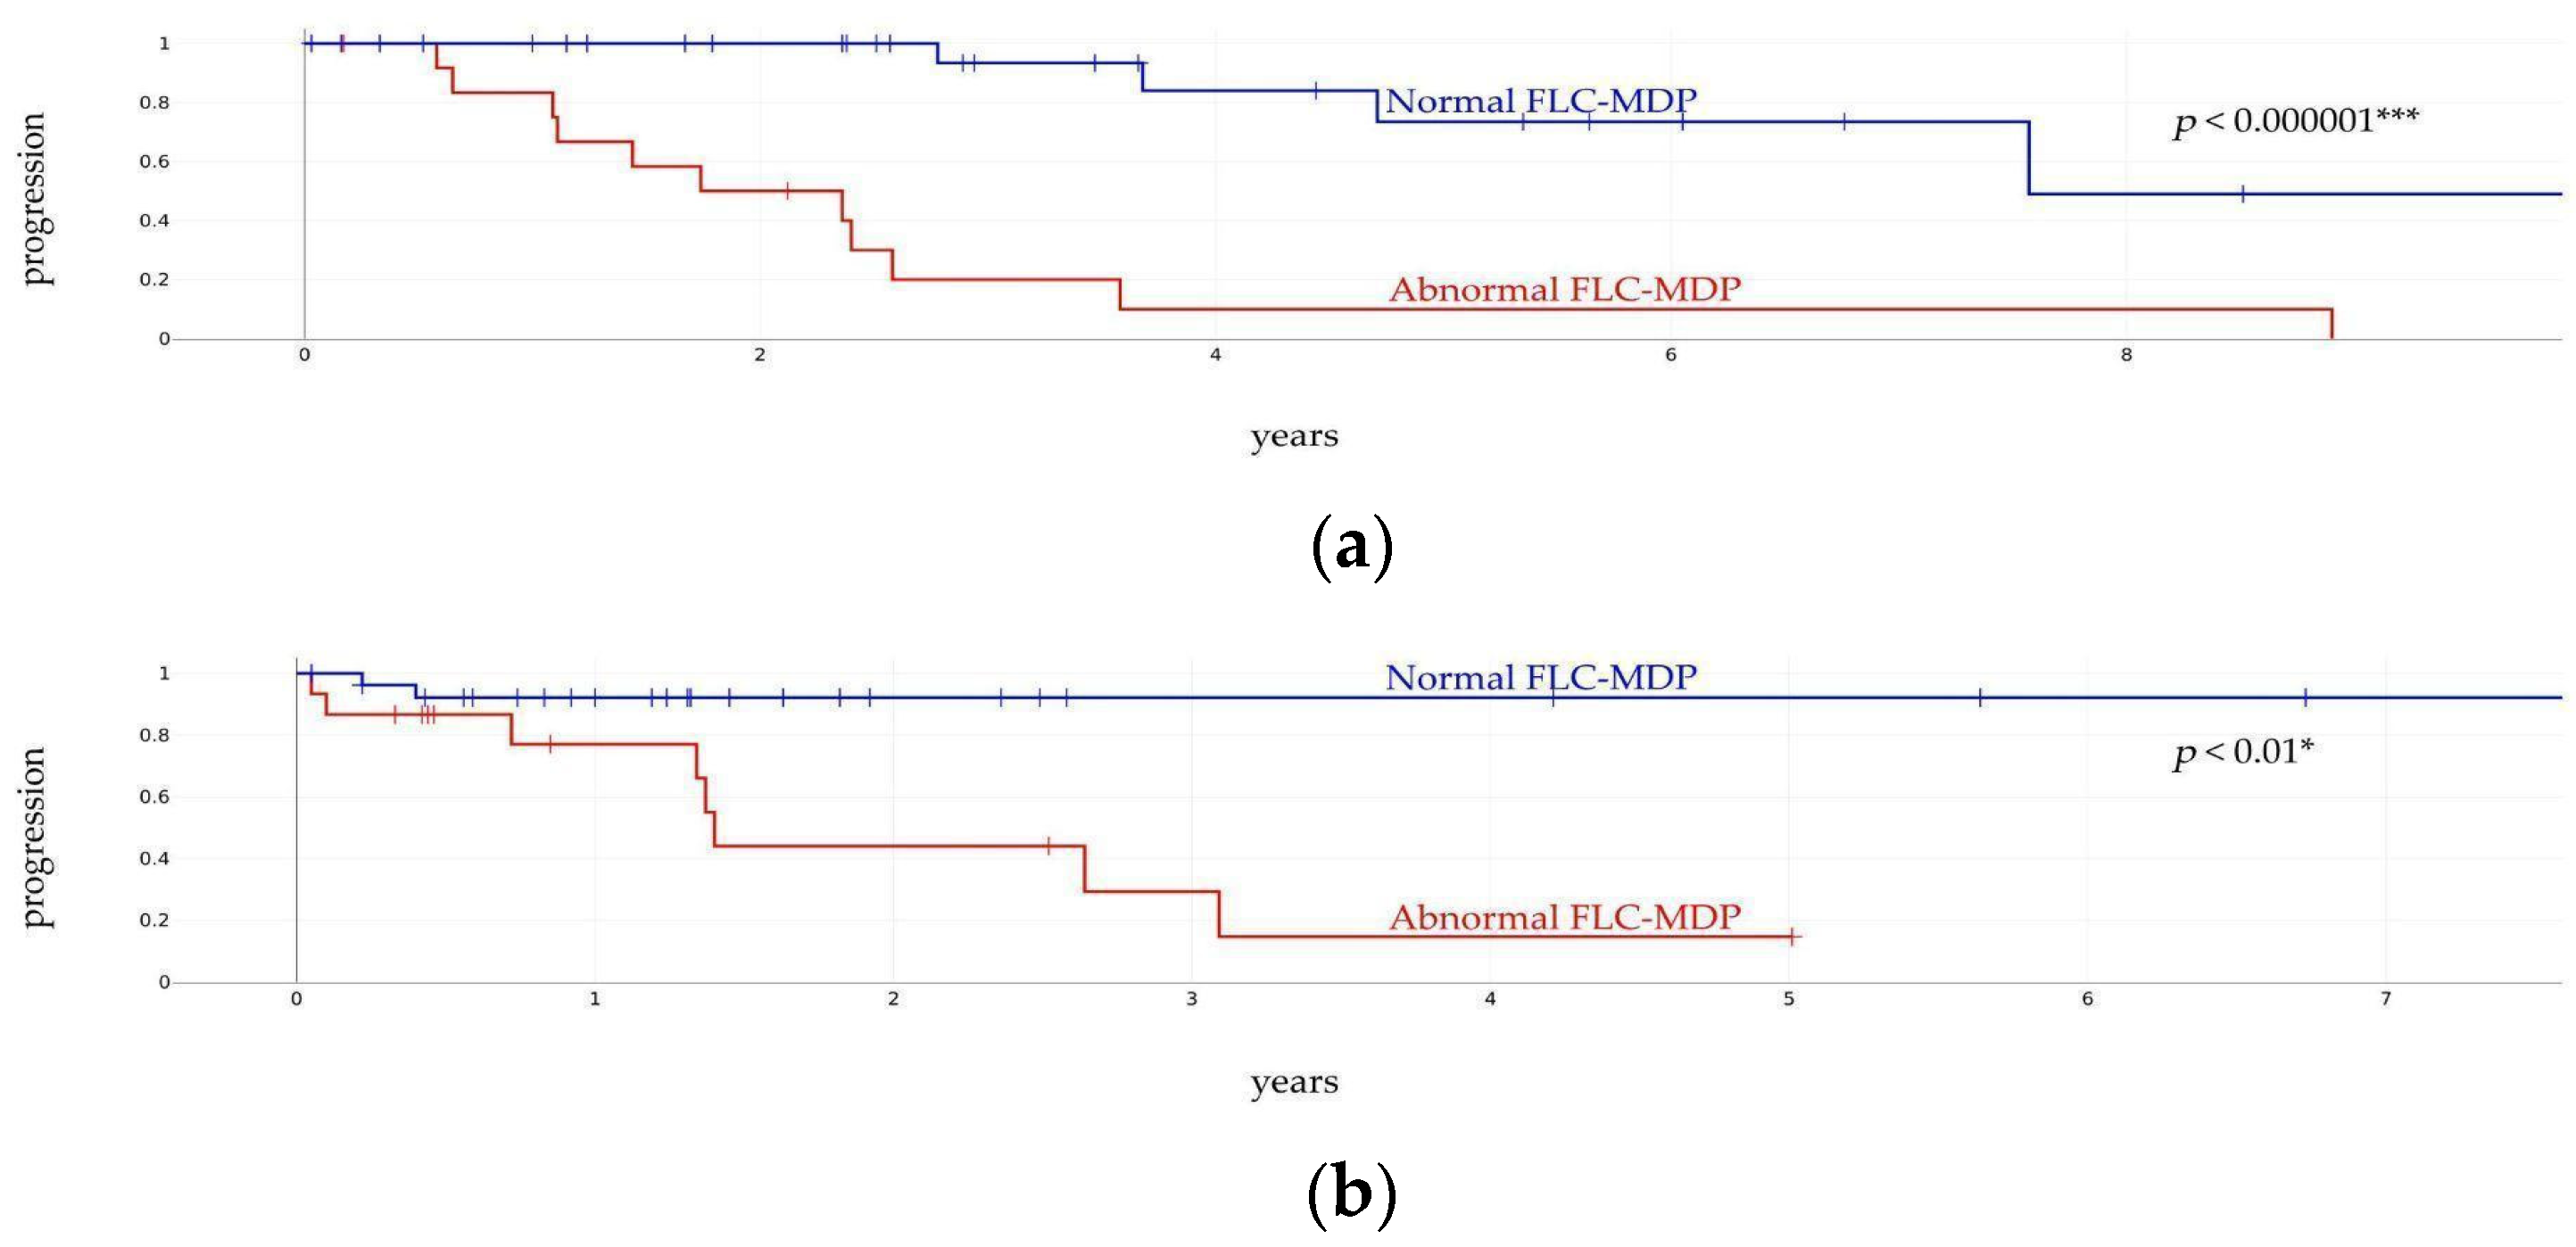
| Normal FLC M–D pattern b (n, %) | 26 (79%) | 2 (15%) | <0.0001 *** | 24 (92%) | 4 (21%) | <0.000001 *** | 1 | |
| Abnormal FLC M–D pattern b (n, %) | 7 (21%) | 11 (84%) | 2 (8%) | 15 (79%) | ||||
| Metrics | Prediction of Clinical Progression | Prediction of Biochemical Progression | ||||
|---|---|---|---|---|---|---|
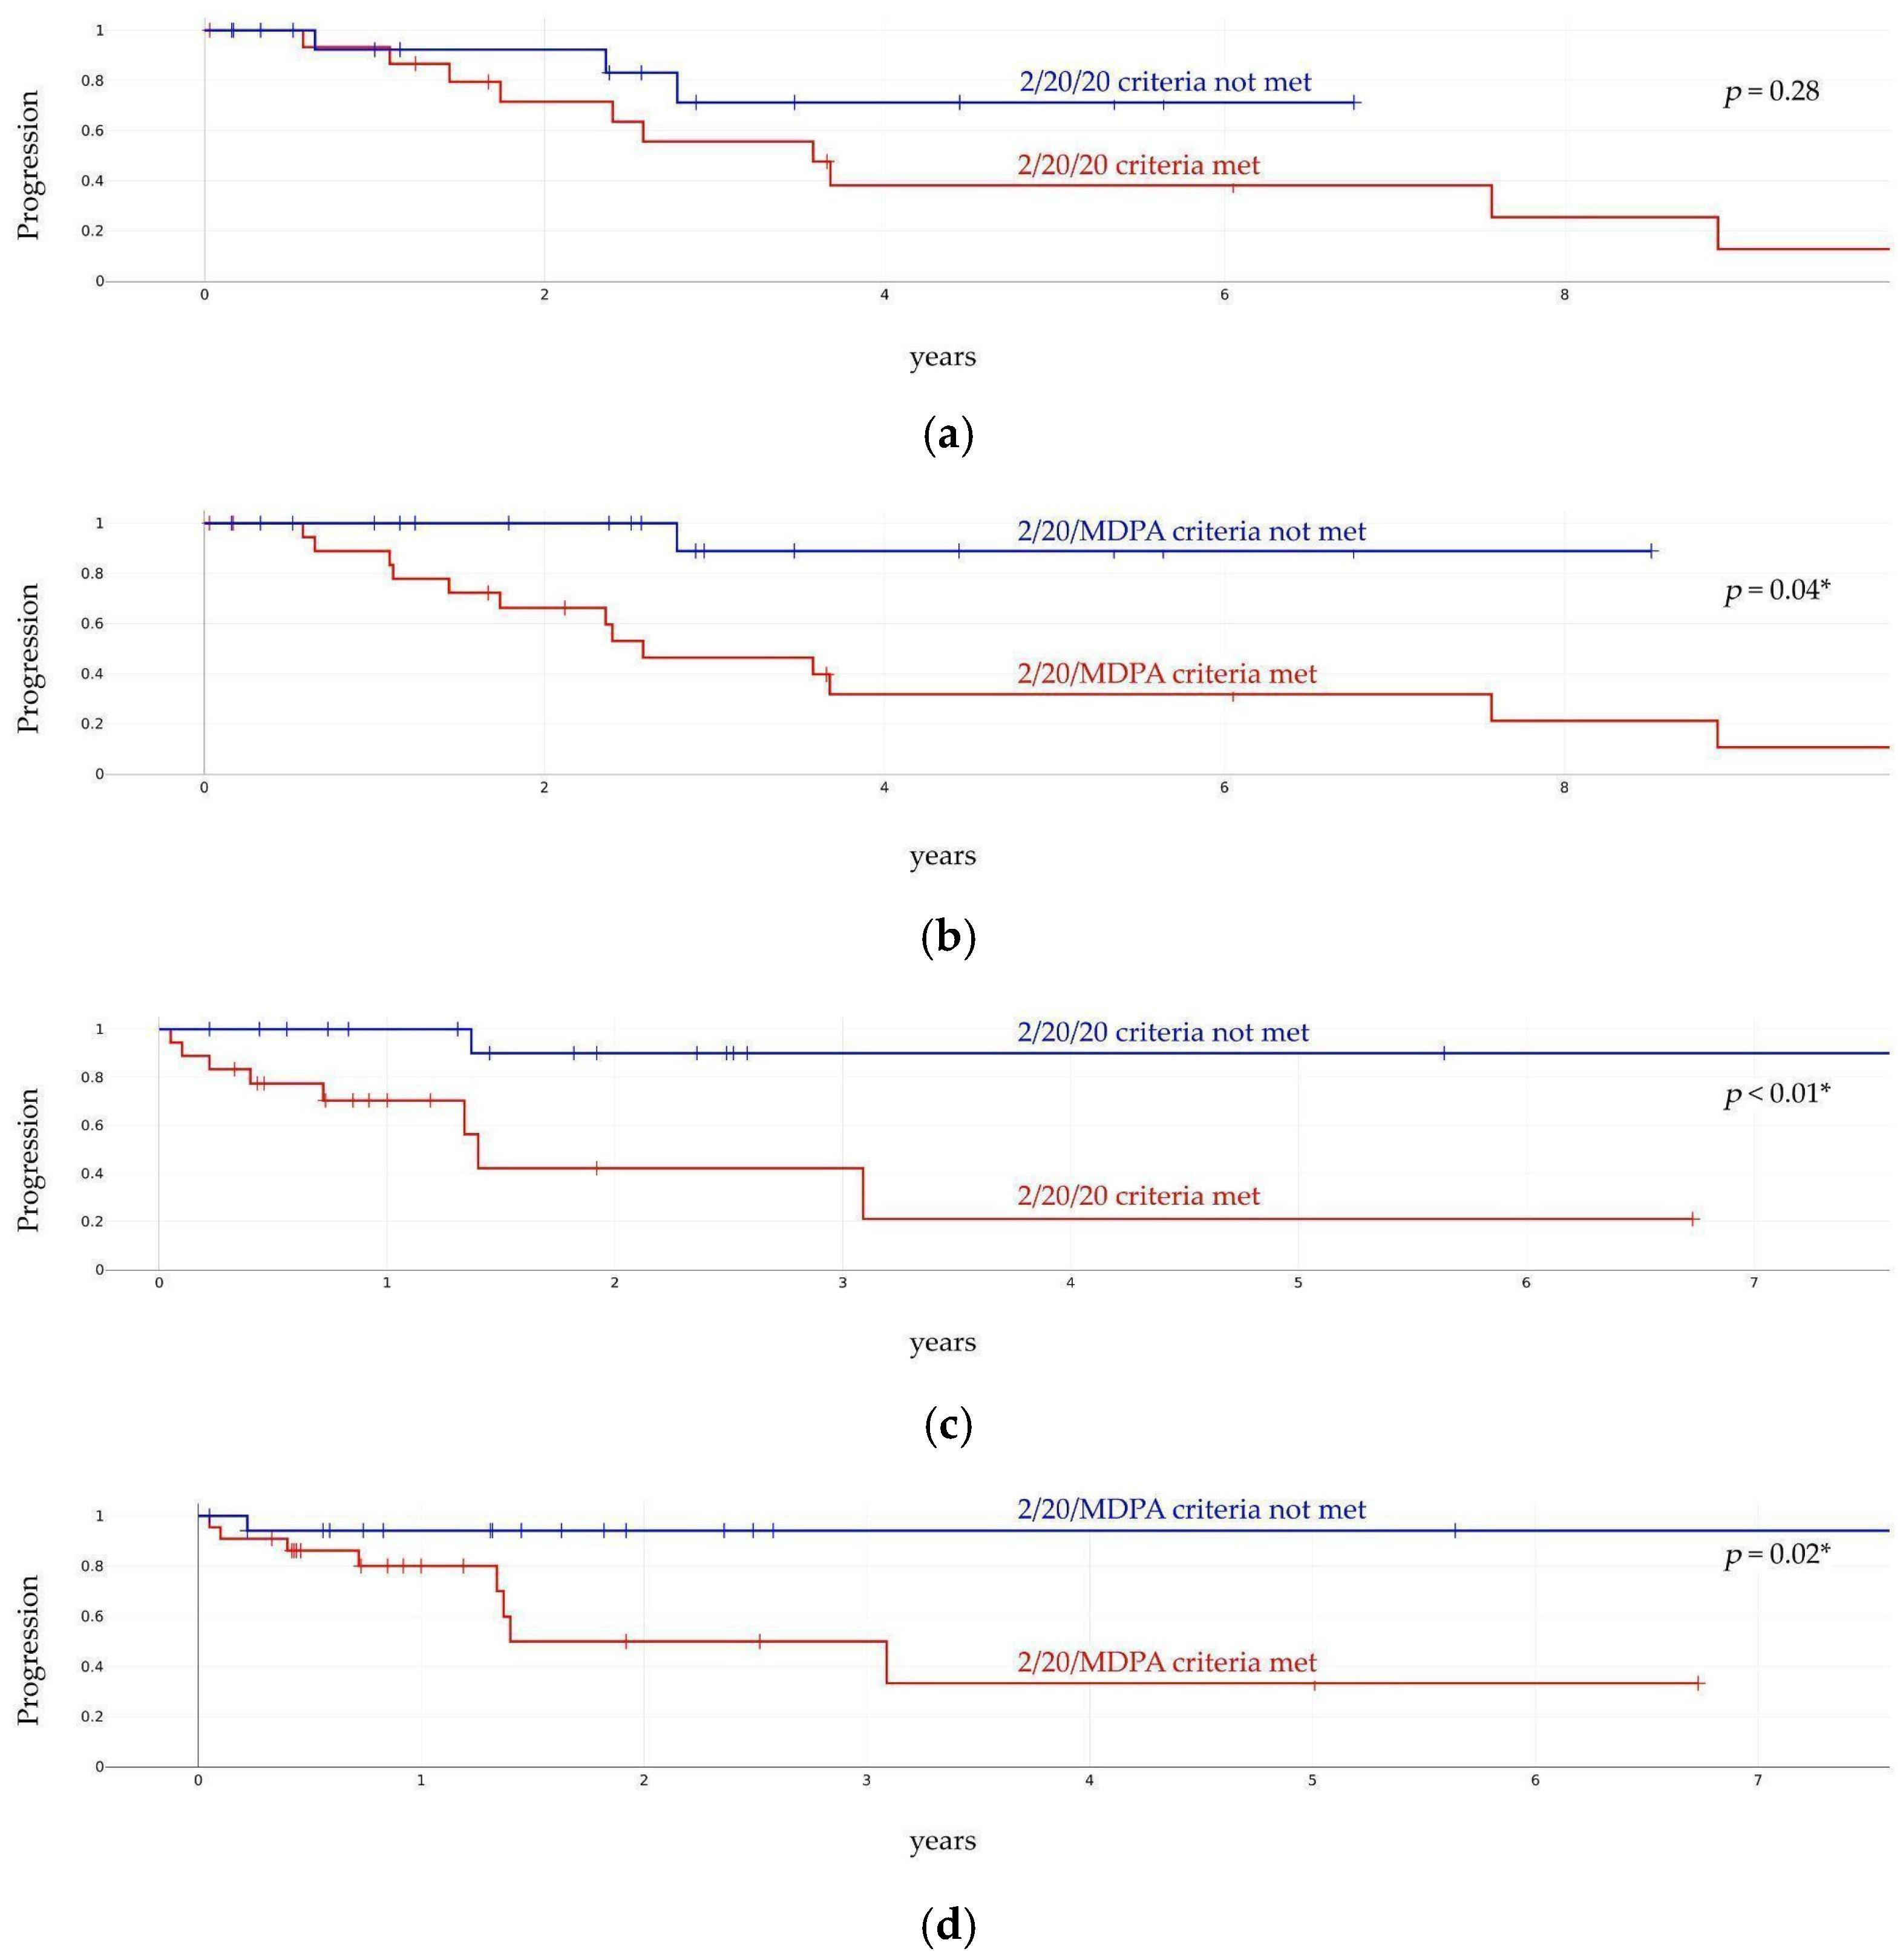
| MDPA | 2/20/20 | 2/20/MDPA | MDPA | 2/20/20 | 2/20/MDPA | |
| Sensitivity | 0.84 | 0.88 | 0.92 | 0.79 | 0.78 | 0.93 |
| Specificity | 0.79 | 0.61 | 0.56 | 0.92 | 0.7 | 0.72 |
| PPV | 0.61 | 0.44 | 0.44 | 0.88 | 0.65 | 0.66 |
| NPV | 0.93 | 0.94 | 0.95 | 0.86 | 0.82 | 0.95 |
| Log-rank p value | <0.01 * | <0.01 * | 0.02 * | <0.000001 *** | 0.28 | 0.04 * |
| HR (C.I.) | 13.52 (3.68–49.64) | 5.73 (1.23–26) | 6.8 (1.6–28.5) | 19.96 (4.31–92) | 2.07 (0.55–7.84) | 9.89 (1.28–76.67) |
| Variable | Clinical Progression OR (95% CI) | p | Biochemical Progression OR (95% CI) | p | |
|---|---|---|---|---|---|
| 3-Variable Model | M-protein > 2 g/dL | 5.79 (0.45–73.71) | 0.18 | Not estimable | — |
| FLC ratio > 20 | 4.03 (0.44–36.96) | 0.22 | Not estimable | — | |
| MDPA | 4.03 (0.44–36.96) | 0.22 | Not estimable | — | |
| 2-Variable Model | FLC ratio > 20 | 4.94 (0.61–39.87) | 0.13 | 1.02 (0.06–17.9) | 0.99 |
| MDPA | 8.21 (1.12–60.25) | 0.04 * | 74.69 (5.65–987.61) | 0.001 ** |
Disclaimer/Publisher’s Note: The statements, opinions and data contained in all publications are solely those of the individual author(s) and contributor(s) and not of MDPI and/or the editor(s). MDPI and/or the editor(s) disclaim responsibility for any injury to people or property resulting from any ideas, methods, instructions or products referred to in the content. |
© 2026 by the authors. Licensee MDPI, Basel, Switzerland. This article is an open access article distributed under the terms and conditions of the Creative Commons Attribution (CC BY) license.
Share and Cite
Serok, A.; Kukuy, L.; Shaked, O.; Weinstein, O.; Pick, M.; Serok, A.; Ostrovsky, A.; Goldis, R.; Lebel, E.; Kaplan, B.; et al. Free Light Chain Monomer—Dimer Pattern Analysis as Non-Invasive Tool in Predicting MGUS and SMM Progression. Cancers 2026, 18, 2409. https://doi.org/10.3390/cancers18152409
Serok A, Kukuy L, Shaked O, Weinstein O, Pick M, Serok A, Ostrovsky A, Goldis R, Lebel E, Kaplan B, et al. Free Light Chain Monomer—Dimer Pattern Analysis as Non-Invasive Tool in Predicting MGUS and SMM Progression. Cancers. 2026; 18(15):2409. https://doi.org/10.3390/cancers18152409
Chicago/Turabian StyleSerok, Avshalom, Lesya (Olga) Kukuy, Omer Shaked, Omer Weinstein, Marjorie Pick, Amir Serok, Alina Ostrovsky, Rivka Goldis, Eyal Lebel, Batia Kaplan, and et al. 2026. "Free Light Chain Monomer—Dimer Pattern Analysis as Non-Invasive Tool in Predicting MGUS and SMM Progression" Cancers 18, no. 15: 2409. https://doi.org/10.3390/cancers18152409
APA StyleSerok, A., Kukuy, L., Shaked, O., Weinstein, O., Pick, M., Serok, A., Ostrovsky, A., Goldis, R., Lebel, E., Kaplan, B., & Gatt, M. E. (2026). Free Light Chain Monomer—Dimer Pattern Analysis as Non-Invasive Tool in Predicting MGUS and SMM Progression. Cancers, 18(15), 2409. https://doi.org/10.3390/cancers18152409