
Prognostic Significance of Key Molecular Markers in Thyroid Cancer: A Systematic Literature Review and Meta-Analysis
 , , ,
, , ,  , and
, and
Simple Summary
Abstract
1. Introduction
2. Materials and Methods
2.1. Literature Search
2.2. Selection Criteria and Abstract Screening
2.3. Outcomes Definition
2.4. Full-Text Screening and Data Extraction
- (1)
- If both adjusted and unadjusted HRs were provided, the unadjusted HR was used.
- (2)
- The HR was estimated using the number of patients and events in each group and the log-rank p-value.
- (3)
- The HR was estimated from the KMC and data on the number of patients at risk. Individual patient data were reconstructed using the Guyot algorithm, and KMC points were extracted using the DigitizeIt software (https://www.digitizeit.xyz, version 2.6).
- (4)
- HRs estimated from the KMC without data on patients at risk were calculated using a single time point or median survival time and the log-rank p-value.
2.5. Quality Assessment
2.6. Analysis
2.7. Assessing the Quality of Evidence
3. Results
3.1. Study Selection
3.2. Characteristics of Included Studies
3.3. Prevalence of Mutations
3.3.1. Differentiated and Poorly Differentiated Thyroid Cancer
3.3.2. Anaplastic Thyroid Cancer
3.3.3. Co-Mutations
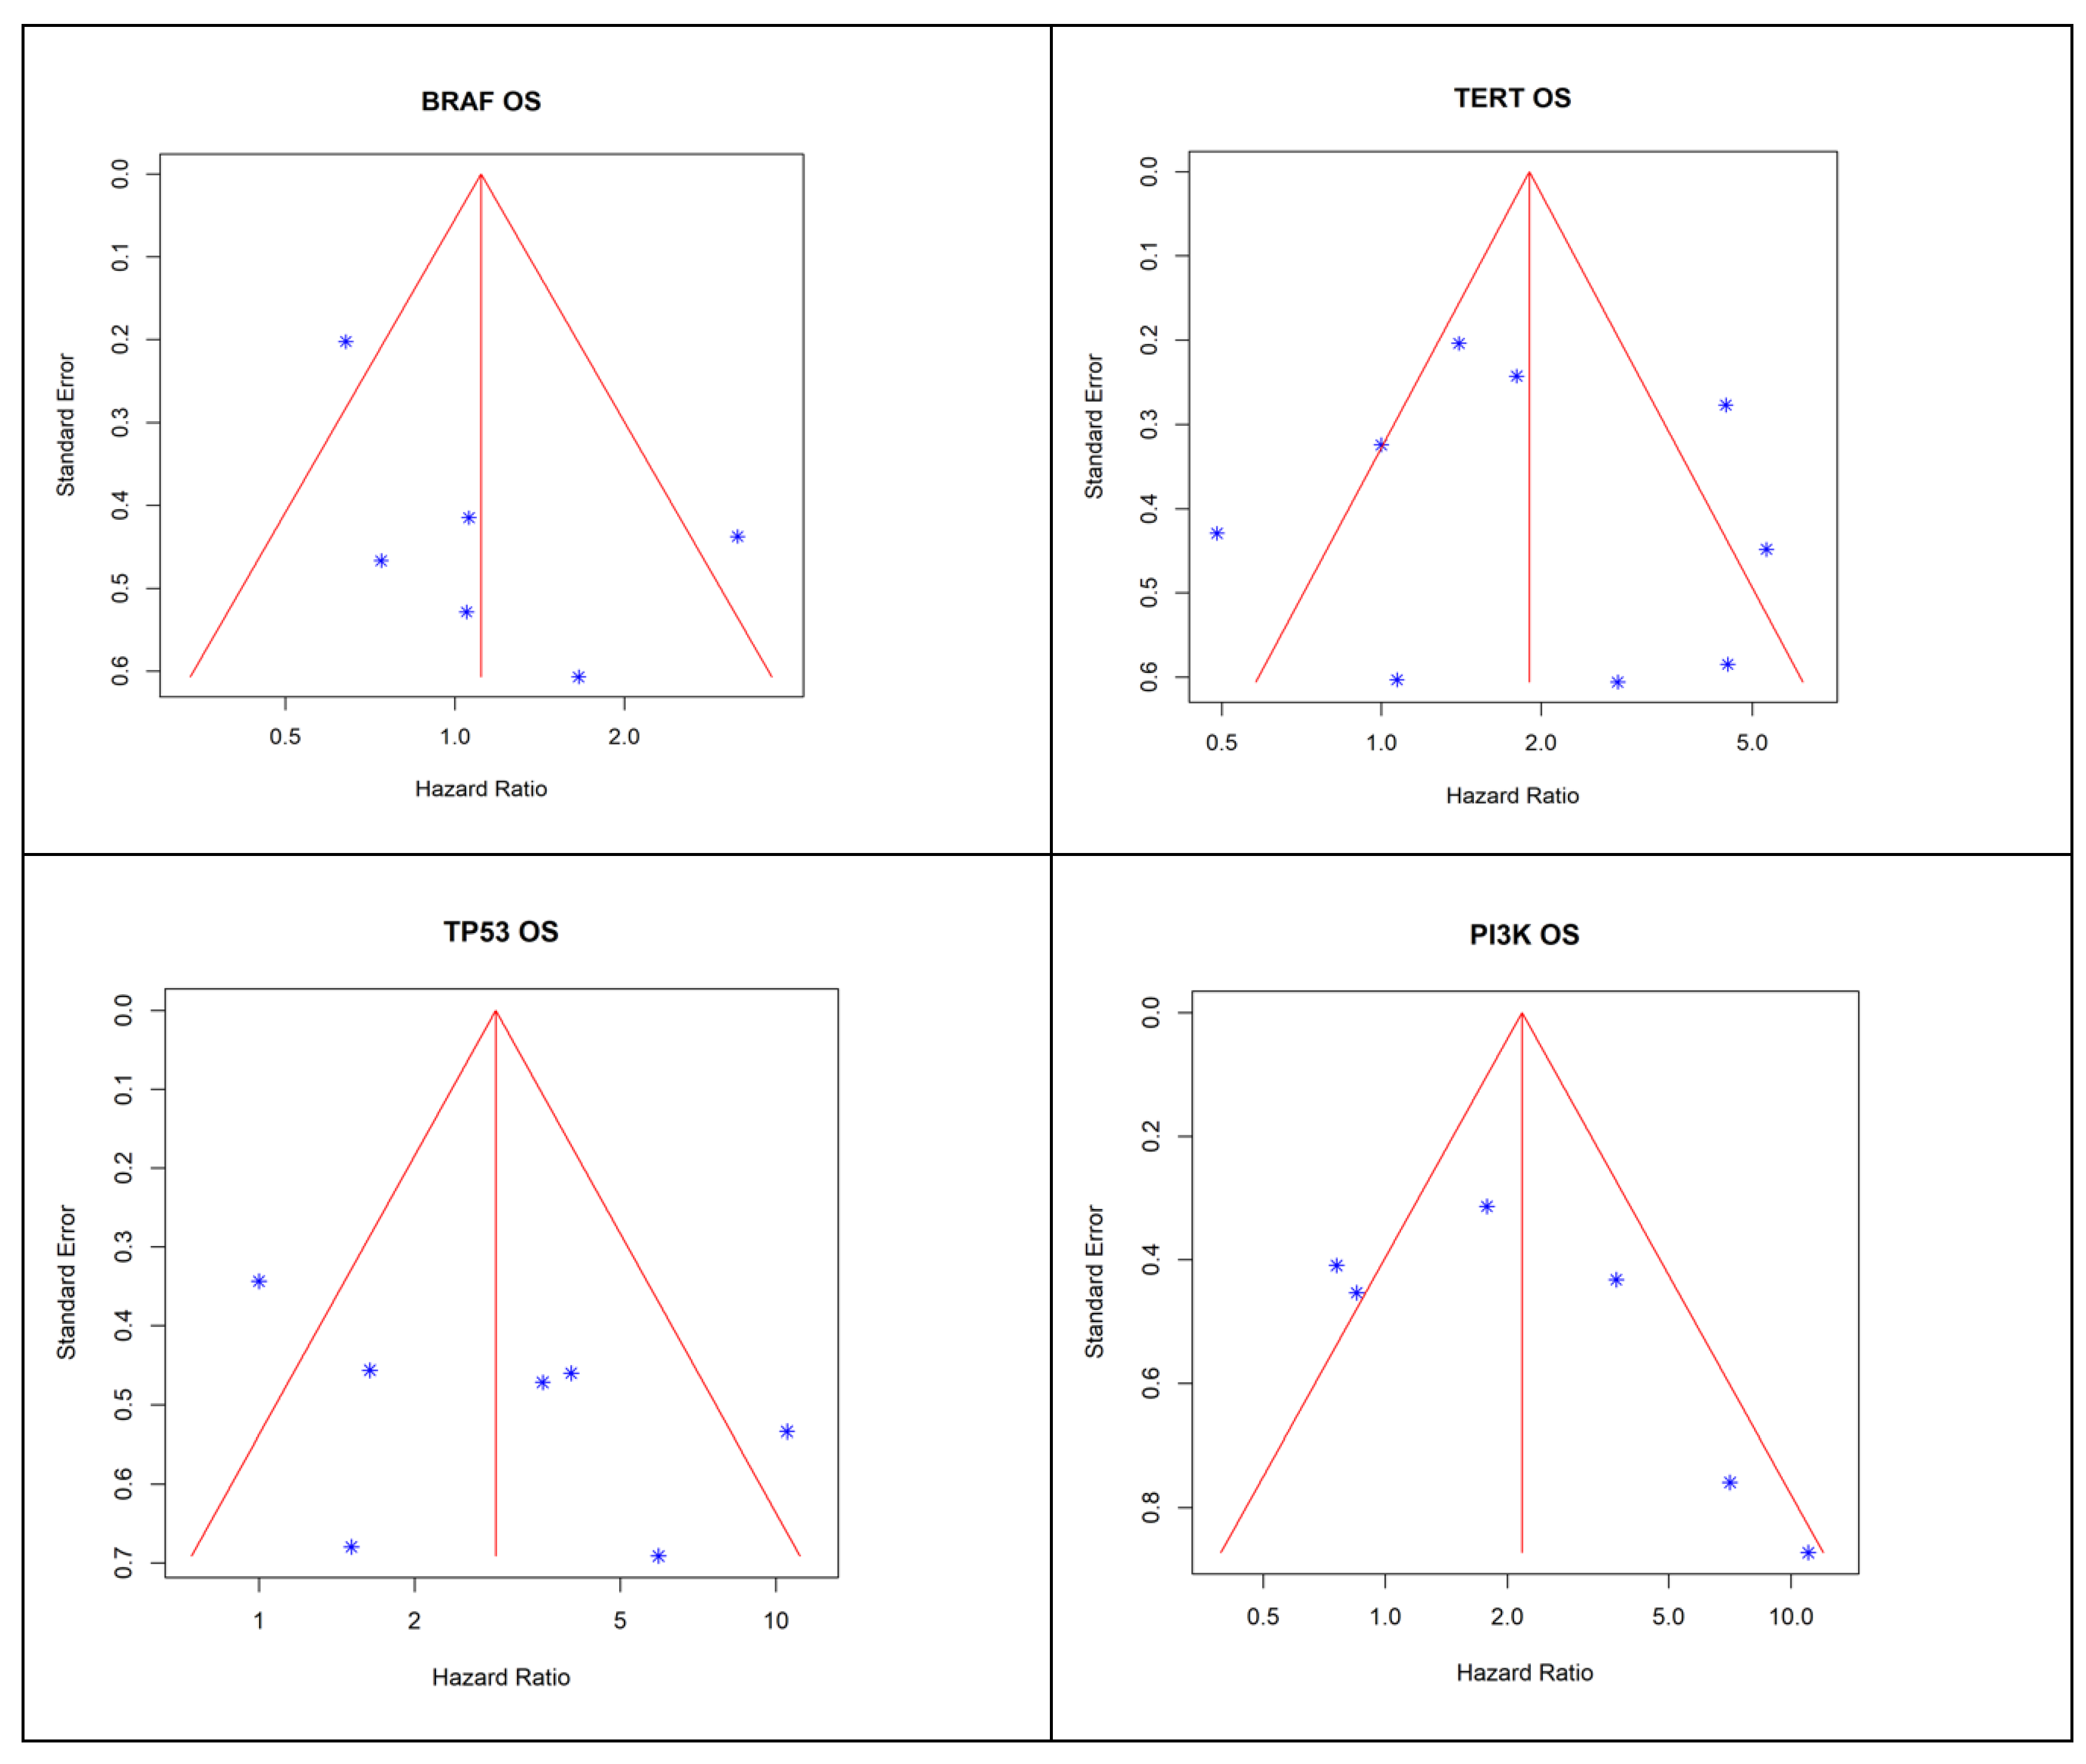
3.4. Risk of Bias Assessment
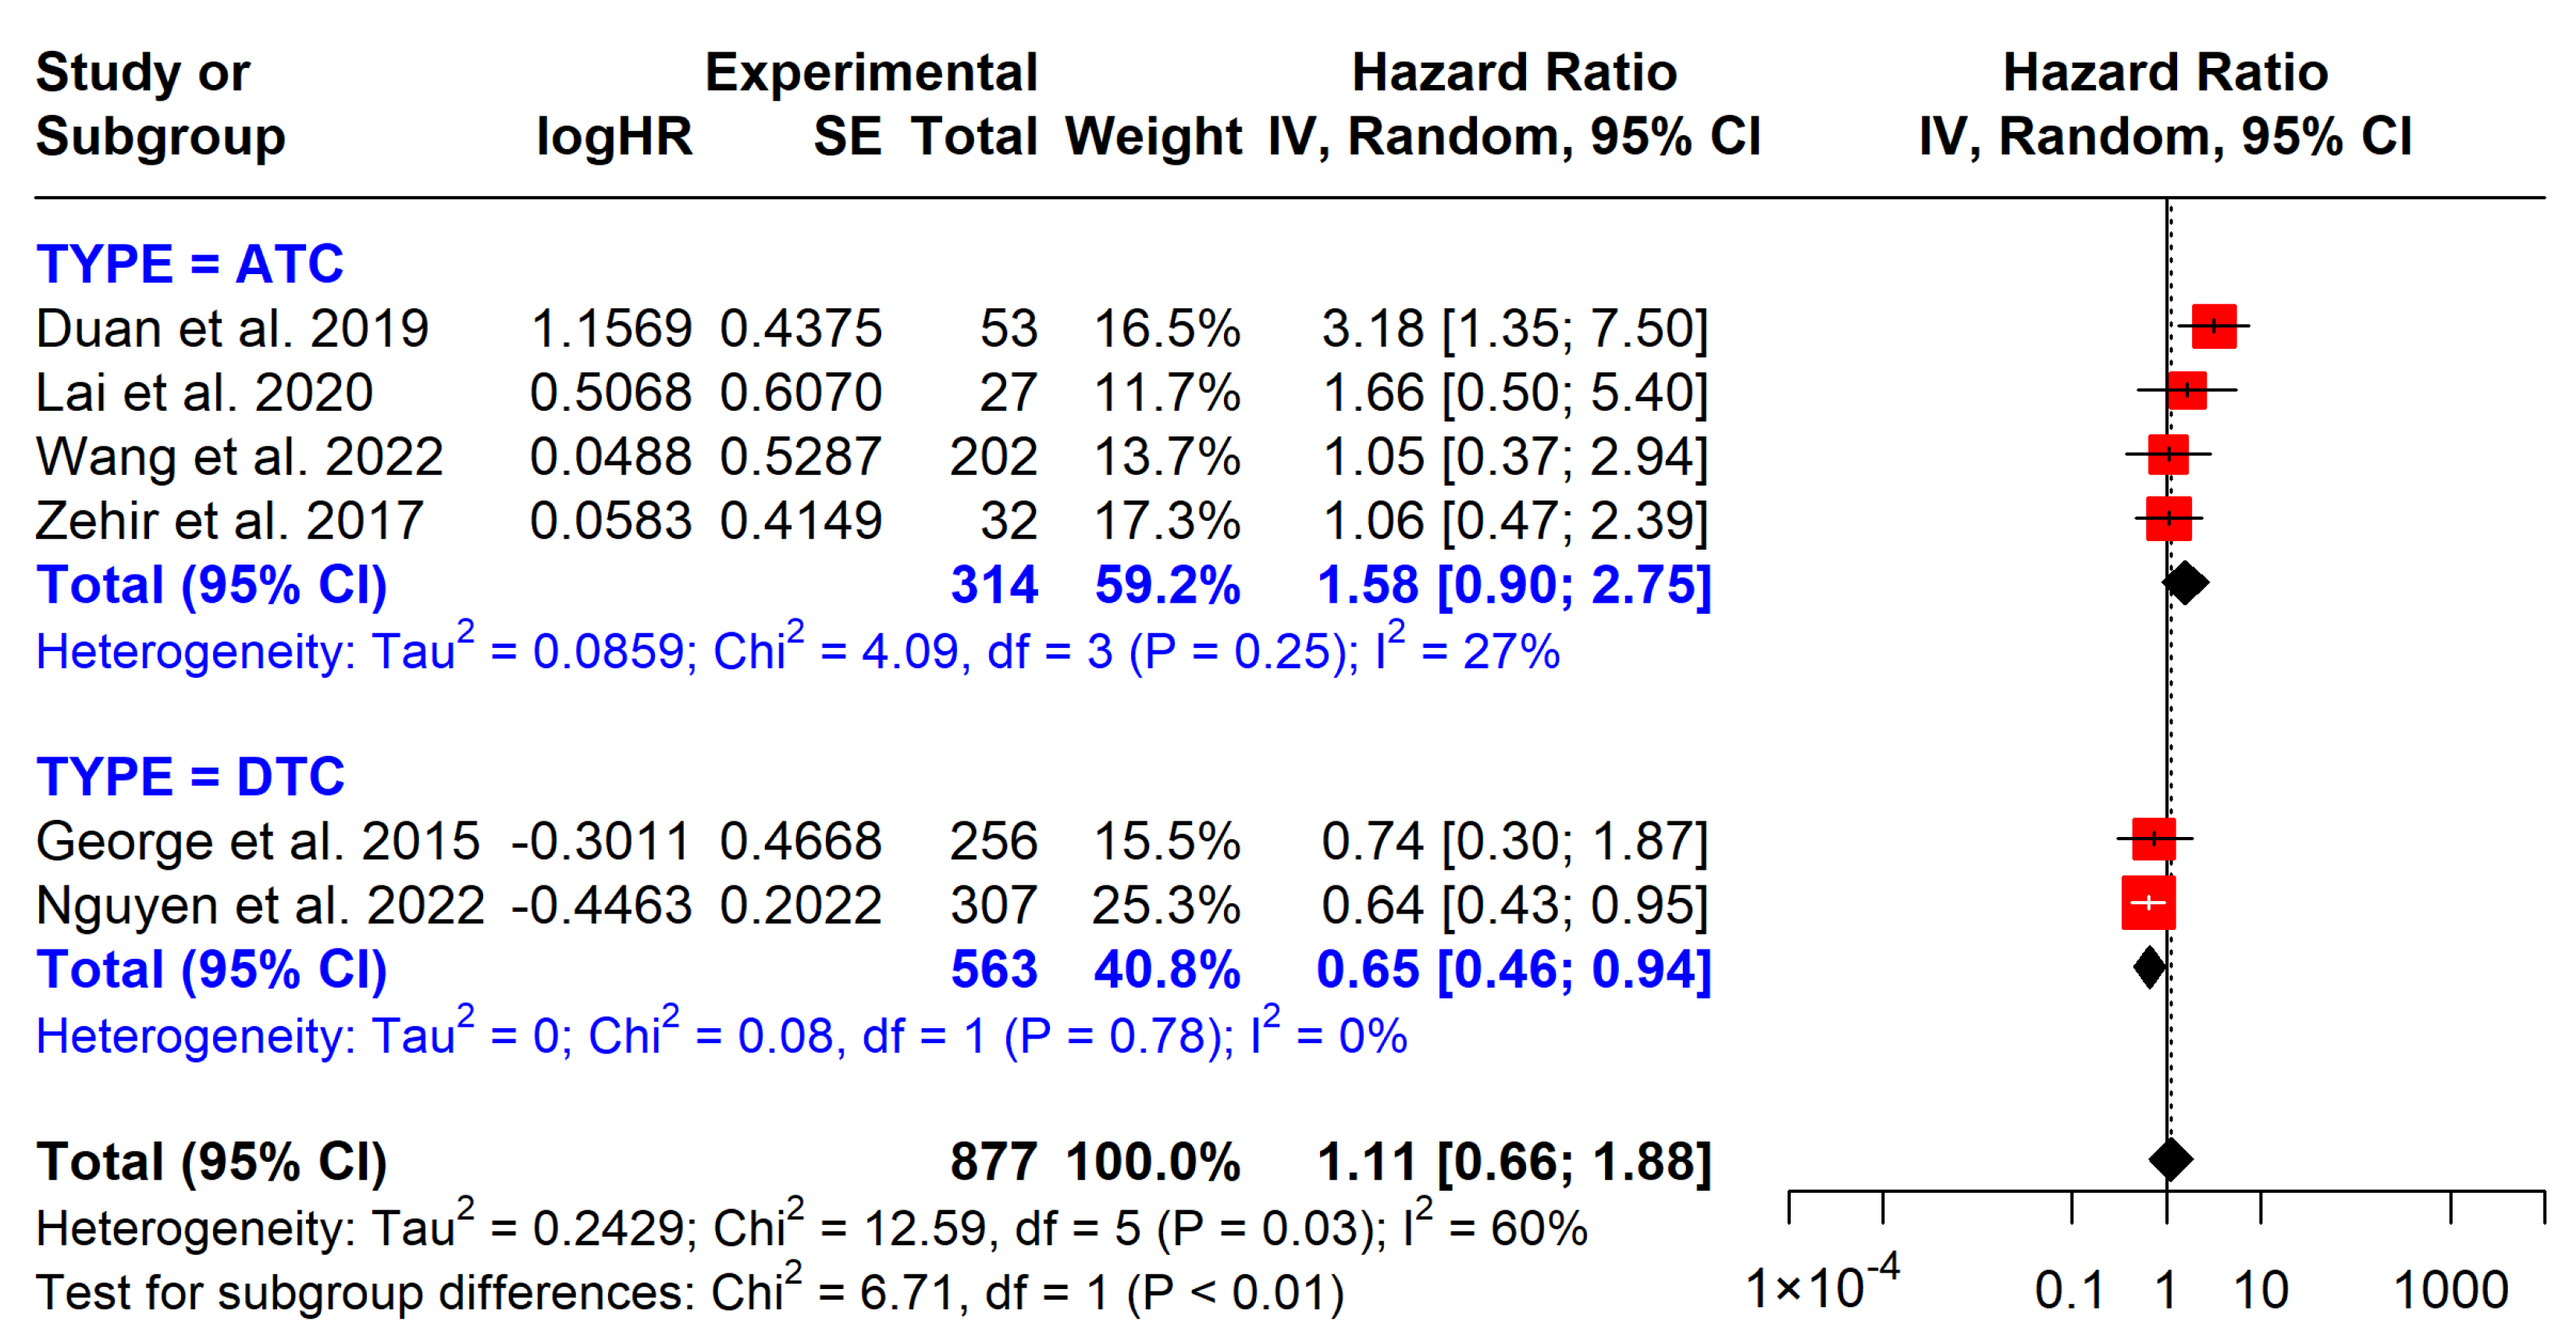
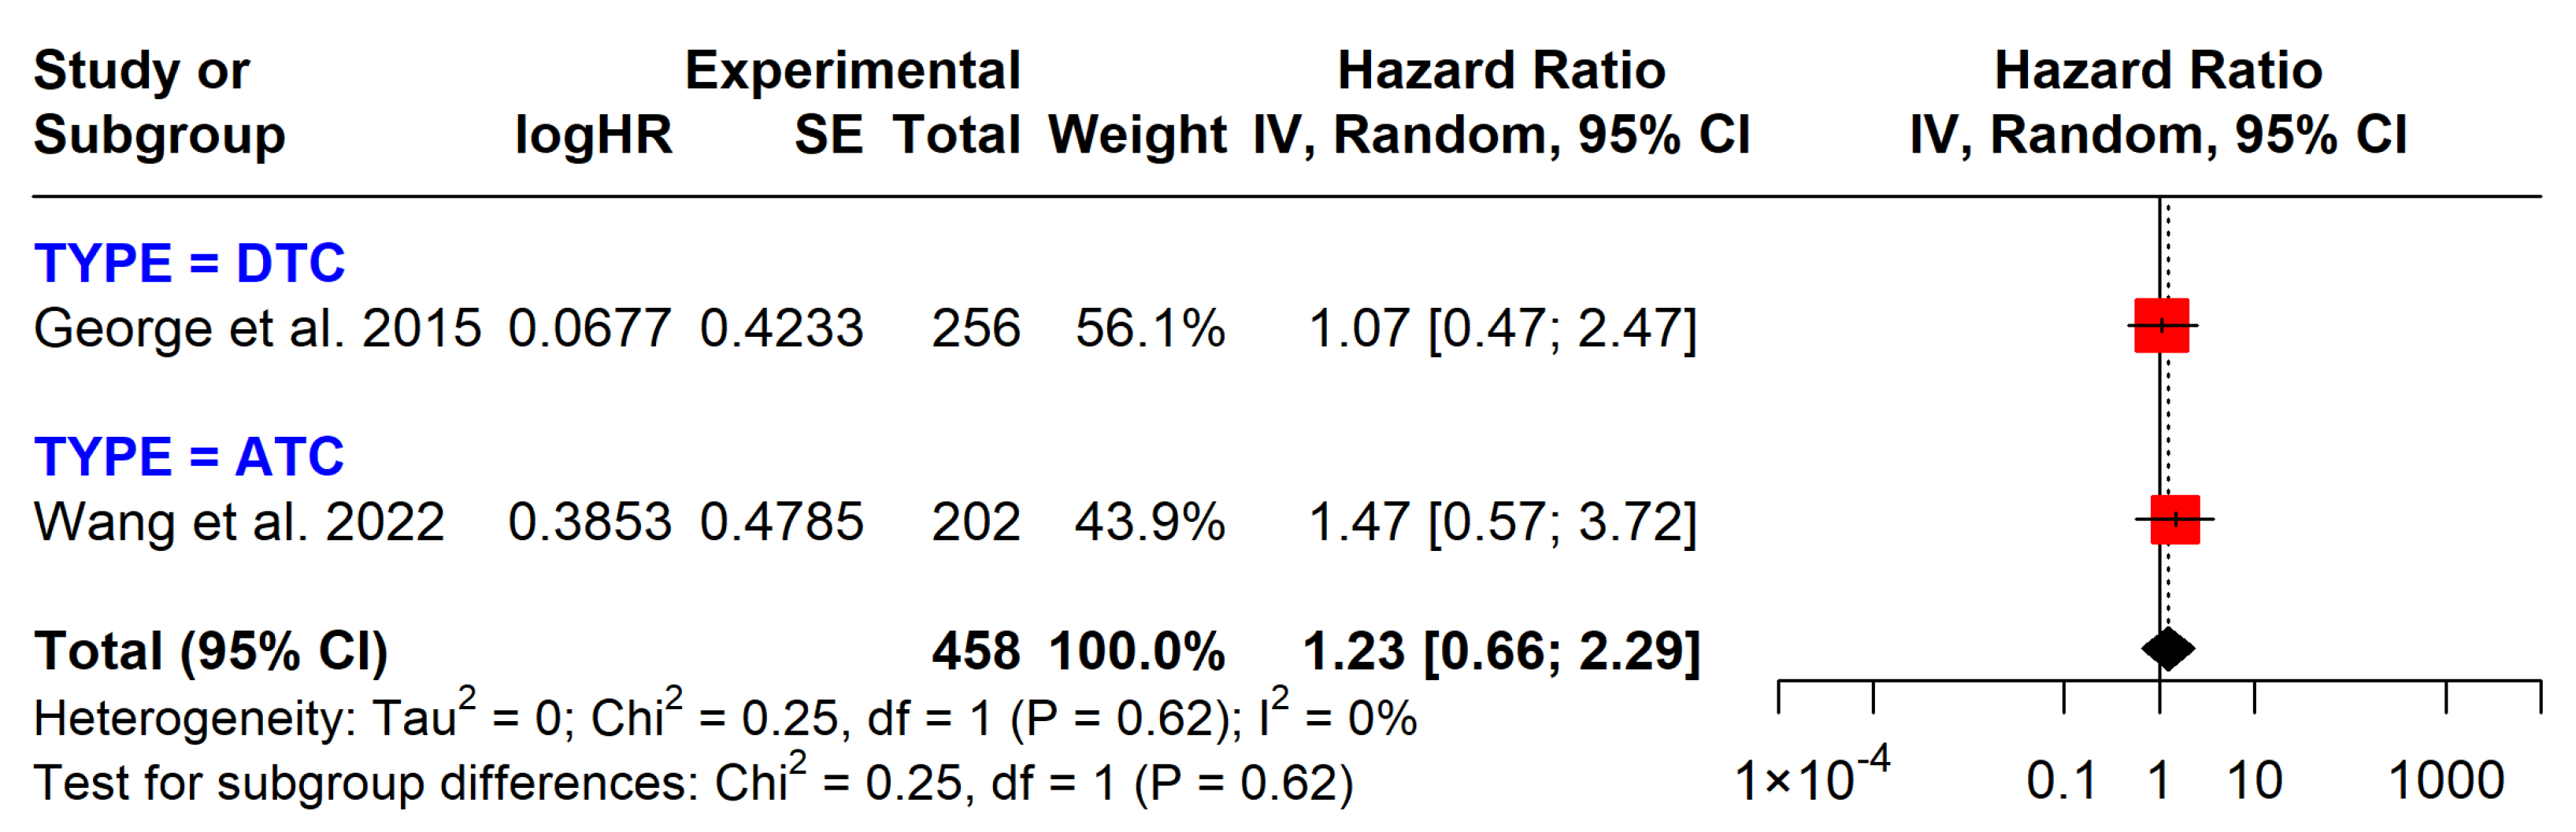
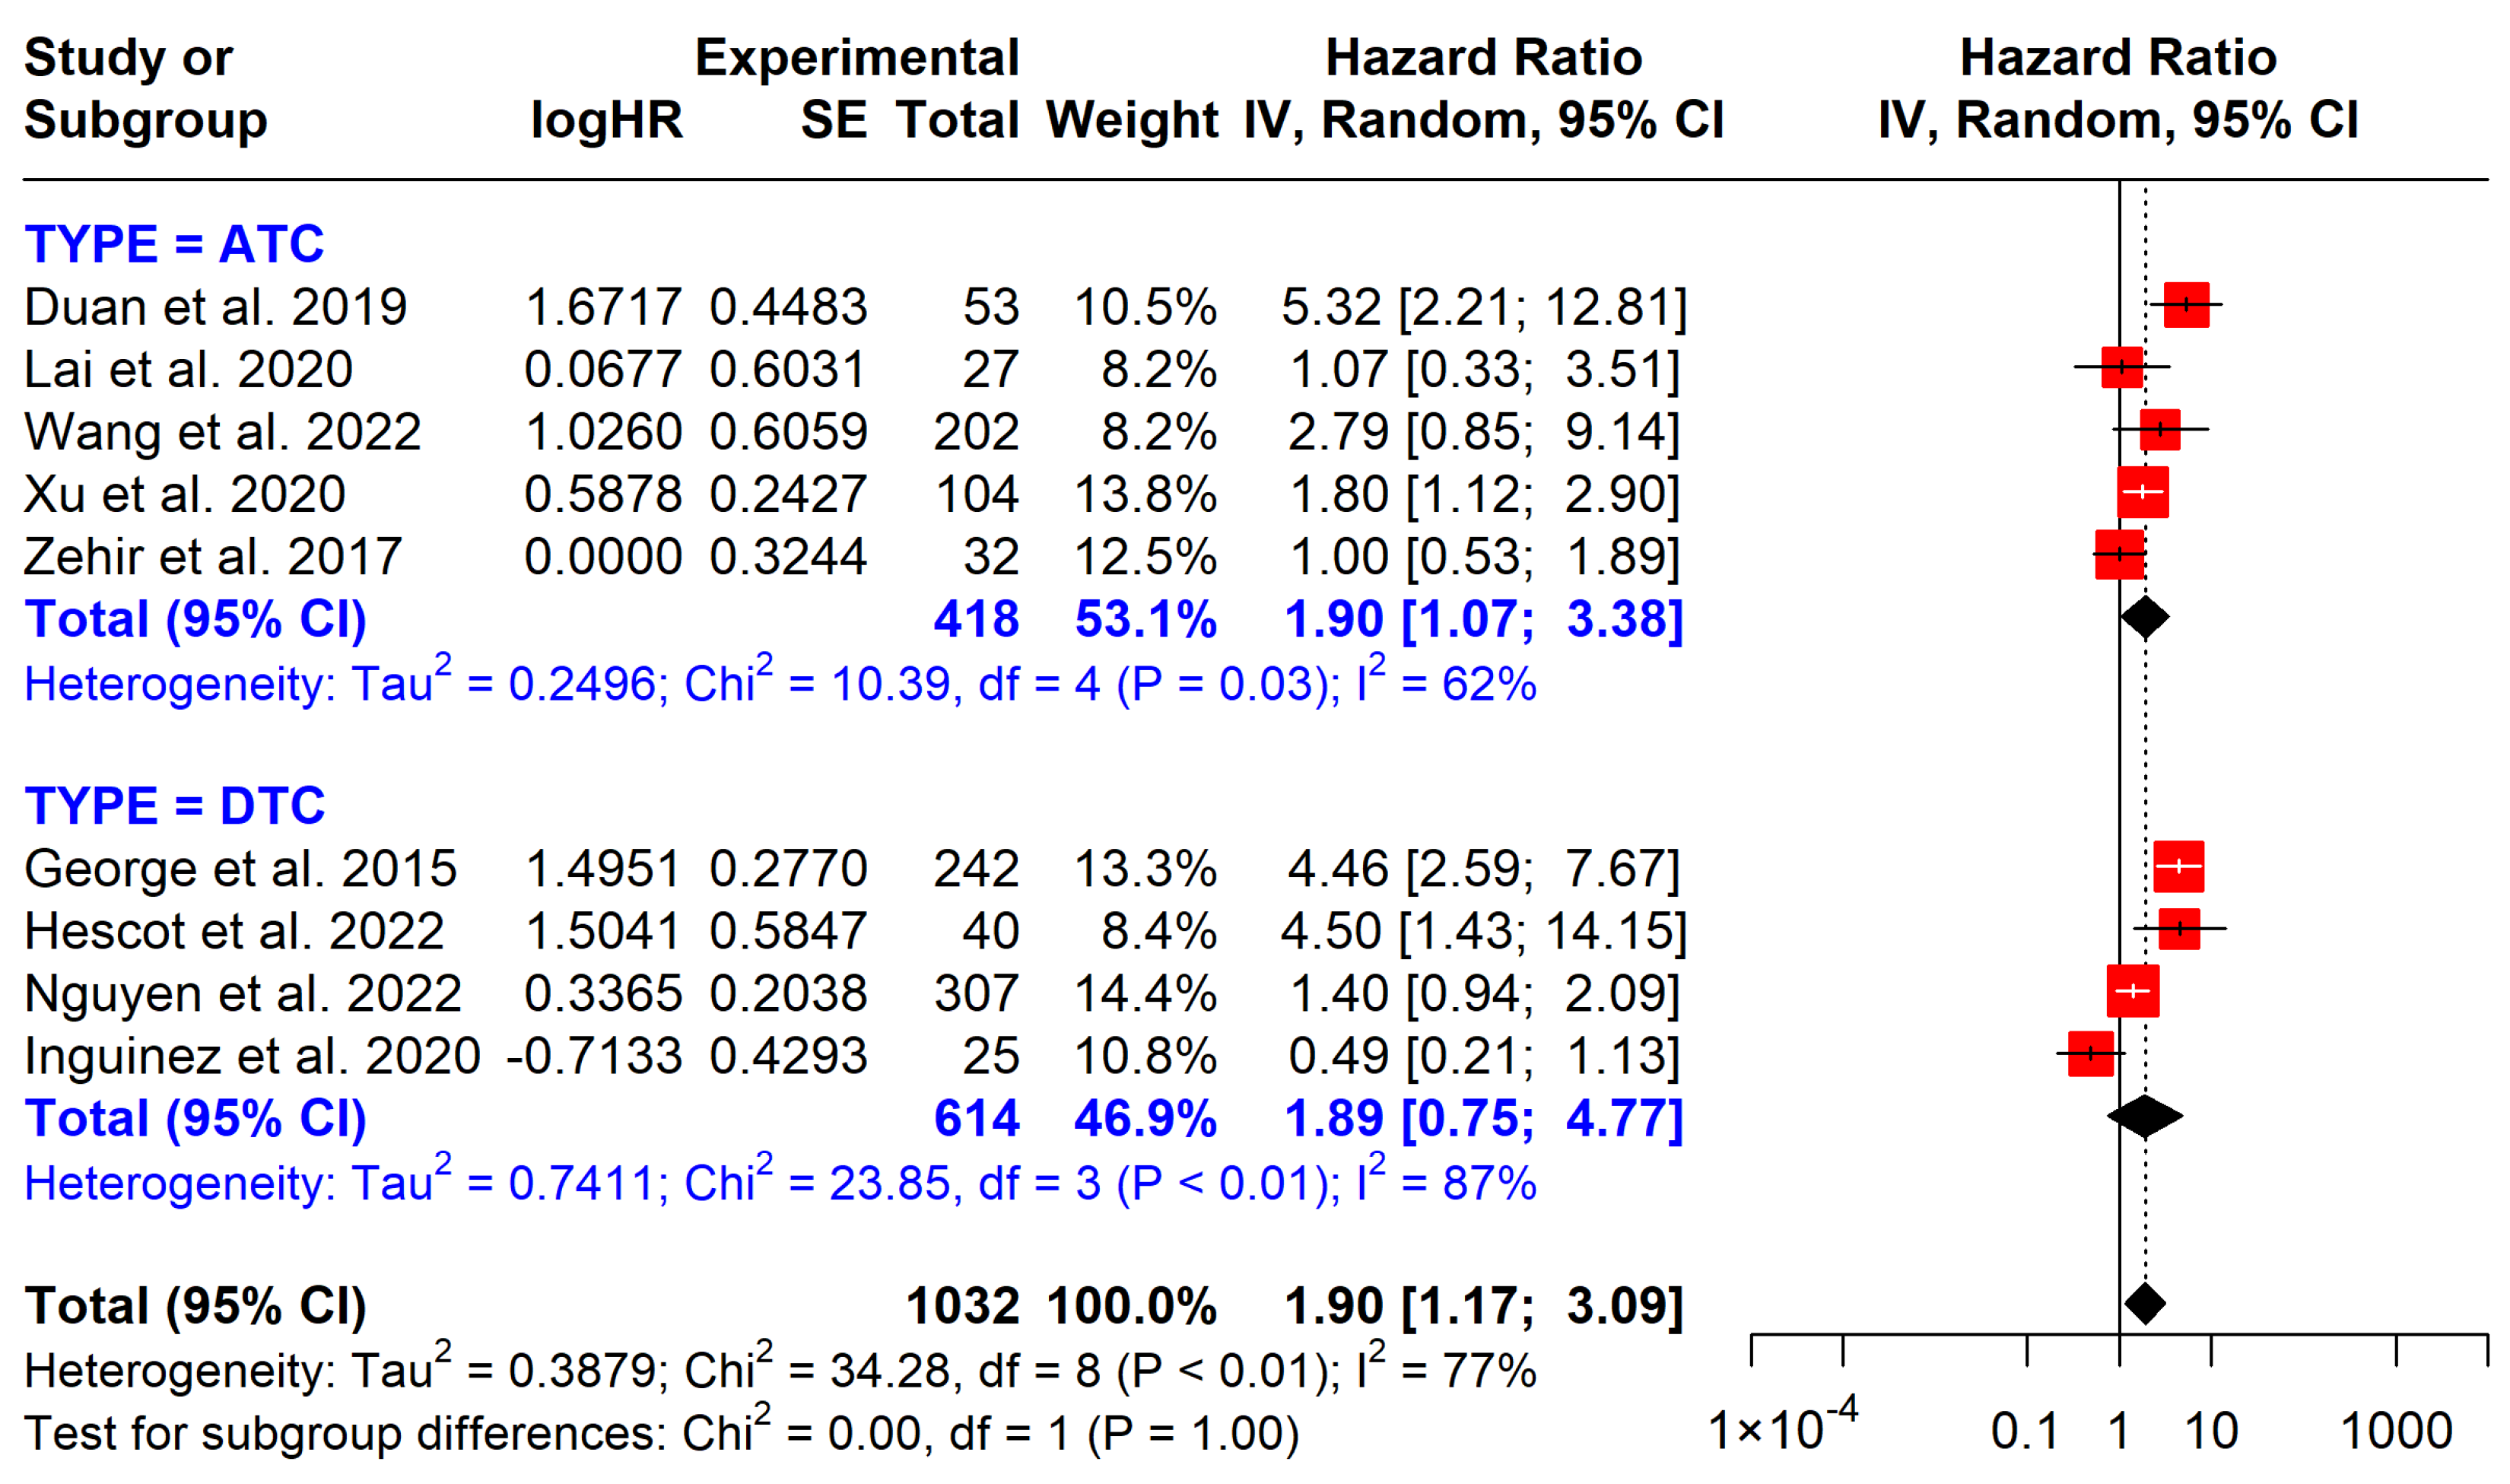
3.5. Survival Outcomes Associated with Mutations
3.5.1. BRAF Mutations
3.5.2. TERT Promoter Mutations
3.5.3. PI3K Pathway Mutations
3.5.4. TP53 Mutations
3.6. Summary of Findings
4. Discussion
5. Conclusions
Supplementary Materials
Author Contributions
Funding
Data Availability Statement
Acknowledgments
Conflicts of Interest
References
- Sung, H.; Ferlay, J.; Siegel, R.L.; Laversanne, M.; Soerjomataram, I.; Jemal, A.; Bray, F. Global Cancer Statistics 2020: GLOBOCAN Estimates of Incidence and Mortality Worldwide for 36 Cancers in 185 Countries. CA A Cancer J. Clin. 2021, 71, 209–249. [Google Scholar] [CrossRef] [PubMed]
- Xing, M. Molecular pathogenesis and mechanisms of thyroid cancer. Nat. Rev. Cancer 2013, 13, 184–199. [Google Scholar] [CrossRef] [PubMed]
- Haugen, B.R.; Alexander, E.K.; Bible, K.C.; Doherty, G.M.; Mandel, S.J.; Nikiforov, Y.F.; Pacini, F.; Randolph, G.W.; Sawka, A.M.; Schlumberger, M.; et al. 2015 American Thyroid Association Management Guidelines for Adult Patients with Thyroid Nodules and Differentiated Thyroid Cancer: The American Thyroid Association Guidelines Task Force on Thyroid Nodules and Differentiated Thyroid Cancer. Thyroid 2016, 26, 1–133. [Google Scholar] [CrossRef] [PubMed]
- Liu, R.; Xing, M. TERT promoter mutations in thyroid cancer. Endocr. Relat. Cancer 2016, 23, R143–R155. [Google Scholar] [CrossRef]
- Liu, C.; Liu, Z.; Chen, T.; Zeng, W.; Guo, Y.; Huang, T. TERT promoter Mutation and Its Association with Clinicopathological Features and Prognosis of Papillary Thyroid Cancer: A Meta-analysis. Sci. Rep. 2016, 6, 36990. [Google Scholar] [CrossRef]
- de Moura, A.C.; da Silva, M.A.; Meira, M.C.; de Almeida, T.A.; da Silva, T.R.; Ward, L.S. Worldwide prevalence of PI3K-AKT-mTOR pathway mutations in head and neck cancer: A systematic review and meta-analysis. Crit. Rev. Oncol. Hematol. 2021, 160, 103284. [Google Scholar] [CrossRef]
- Zhang, Y.; Kleinstreuer, S.J.; Vachon, N.; Vasbinder, G.; Smith, J.; Weinberg, R.A. A Pan-Cancer Proteogenomic Atlas of PI3K/AKT/mTOR Pathway Alterations. Cancer Cell 2017, 31, 820–832.e3. [Google Scholar] [CrossRef]
- Pozdeyev, N.; Gay, L.M.; Sokol, E.S.; Hartmaier, R.; Deaver, K.L.; Davis, S.; French, J.D.; Borre, M.J.; LaBarbera, D.V.; Tan, A.L.; et al. Genetic Analysis of 779 Advanced Differentiated and Anaplastic Thyroid Cancers. Clin. Cancer Res. 2018, 24, 3059–3068. [Google Scholar] [CrossRef]
- Maniakas, A.; Dadu, Y.; Busaidy, N.L.; Wang, J.R.; Ferrarotto, R.; Lu, C.; Williams, M.D.; Gunn, G.G.; Lee, J.E.; Zafereo, M.E. Evaluation of Overall Survival in Patients with Anaplastic Thyroid Carcinoma, 2000–2019. JAMA Oncol. 2020, 6, 1. [Google Scholar] [CrossRef]
- Lin, B.; Ma, X.; Yan, T.; Lin, Y.; Hussain, M.; Zhang, J.; Yang, S. The incidence and survival analysis for anaplastic thyroid cancer: A SEER database analysis. Am. J. Transl. Res. 2019, 11, 5888. Available online: https://pmc.ncbi.nlm.nih.gov/articles/PMC6789224/ (accessed on 22 January 2025).
- Jannin, E.; Lamartina, A.; Al Ghuzlan, M.; Bidault, S.; de la Fouchardiere, C.; Ghandili, B.; Ladoire, I.; Taieb, D.; Leenhardt, L. Anaplastic Thyroid Carcinoma: An Update. Cancers 2022, 14, 1061. [Google Scholar] [CrossRef] [PubMed]
- Bible, K.C.; Kebebew, E.; Brierley, J.; Brito, J.P.; Cabanillas, M.E.; Clark, T.J., Jr.; Di Cristofano, A.; Foote, R.; Giordano, T.; Kasperbauer, J.; et al. 2021 American Thyroid Association Guidelines for Management of Patients with Anaplastic Thyroid Cancer. Thyroid 2021, 31, 337–386. [Google Scholar] [CrossRef] [PubMed]
- Hebert, A.E.; Benjamin, A.M.; Khatua, S.R.; Wagner, J.L. Methodology to standardize heterogeneous statistical data presentations for combining time-to-event oncologic outcomes. PLoS ONE 2022, 17, e0263661. [Google Scholar] [CrossRef]
- Schünemann, H.J.; Oxman, A.D.; Brozek, J.; Glasziou, P.; Jaeschke, R.; Vist, G.; Williams, J.W.; Kunz, R., Jr.; Craig, J.; Montori, V.; et al. Grading quality of evidence and strength of recommendations for diagnostic tests and strategies. BMJ 2008, 336, 503–508. [Google Scholar] [CrossRef] [PubMed]
- Page, M.J.; McKenzie, J.E.; Bossuyt, P.M.; Boutron, I.; Hoffmann, T.C.; Mulrow, C.D.; Shamseer, L.; Tetzlaff, J.M.; Akl, E.A.; Brennan, S.E.; et al. The PRISMA 2020 statement: An updated guideline for reporting systematic reviews. Syst. Rev. 2021, 10, 89. [Google Scholar] [CrossRef]
- Duan, H.; Li, Y.; Chen, X.; Wang, Q.; Dong, X.; Liu, Z. Mutational profiling of poorly differentiated and anaplastic thyroid carcinoma by the use of targeted next-generation sequencing. Histopathology 2019, 75, 890–899. [Google Scholar] [CrossRef]
- Hescot, S.; Al Ghuzlan, A.; Henry, C.; de la Fouchardiere, C.; Bidault, S.; Baudin, E.; Schlumberger, M. Prognostic of recurrence and survival in poorly differentiated thyroid cancer. Endocr. Relat. Cancer 2022, 29, 625–634. [Google Scholar] [CrossRef]
- Iñiguez-Ariza, N.M.; Bible, K.L.P.; Clarke, B.L.; Smallridge, R.C.; Stan, M.N. Foundation One Genomic Interrogation of Thyroid Cancers in Patients with Metastatic Disease Requiring Systemic Therapy. J. Clin. Endocrinol. Metab. 2020, 105, e2346–e2357. [Google Scholar] [CrossRef]
- Lai, W.-A.; Liu, C.-Y.; Lin, S.-Y.; Chen, C.-C.; Hang, J.-F. Characterization of Driver Mutations in Anaplastic Thyroid Carcinoma Identifies RAS and PIK3CA Mutations as Negative Survival Predictors. Cancers 2020, 12, 1973. [Google Scholar] [CrossRef]
- Wang, J.R.; Zafereo, M.; Busaidy, N.; Williams, M.D.; Gunn, G.B.; Lee, J.E.; Maniakas, A. Impact of Somatic Mutations on Survival Outcomes in Patients with Anaplastic Thyroid Carcinoma. JCO Precis. Oncol. 2022, 6, e2100504. [Google Scholar] [CrossRef]
- Xu, B.; Fuchs, T.; Dogan, S.; Landa, I.; Katabi, N.; Fagin, J.A.; Tuttle, R.M.; Ghossein, R. Dissecting Anaplastic Thyroid Carcinoma: A Comprehensive Clinical, Histologic, Immunophenotypic, and Molecular Study of 360 Cases. Thyroid 2020, 30, 1505–1517. [Google Scholar] [CrossRef] [PubMed]
- Nguyen, B.; Andreassen, K.; Brown, L.C.; Chakravarty, S.; Chute, R.; Lee, N. Genomic characterization of metastatic patterns from prospective clinical sequencing of 25,000 patients. Cell 2022, 185, 563–575.e11. [Google Scholar] [CrossRef] [PubMed]
- George, J.R.; Nikiforov, Y.E.; Randolph, G.W.; Haugen, B.R.; Tuttle, R.M. Association of TERT Promoter Mutation, But Not BRAF Mutation, With Increased Mortality in PTC. J. Clin. Endocrinol. Metab. 2015, 100, E1550–E1559. [Google Scholar] [CrossRef] [PubMed]
- Zehir, A.; Benayed, R.; Shah, R.H.; Syed, A.; Middha, S.; Kim, H.R.; Srinivasan, P.; Gao, J.; Chakravarty, D.; Devlin, S.M.; et al. Mutational landscape of metastatic cancer revealed from prospective clinical sequencing of 10,000 patients. Nat. Med. 2017, 23, 703–713. [Google Scholar] [CrossRef]
- Tao, Y.; Liu, Z.; Zhang, Y.; Chen, X. BRAF V600E Status Sharply Differentiates Lymph Node Metastasis-associated Mortality Risk in Papillary Thyroid Cancer. J. Clin. Endocrinol. Metab. 2021, 106, 3228. [Google Scholar] [CrossRef]
- Xing, M.M.; Liu, R.; Liu, X.; Murugan, A.K.; Zhu, G.; Zeiger, M. Association between BRAF V600E mutation and mortality in patients with papillary thyroid cancer. JAMA 2013, 309, 1493–1501. [Google Scholar] [CrossRef]
- Chen, B.; Shi, Y.; Xu, Y.; Zhang, J. The predictive value of coexisting BRAFV600E and TERT promoter mutations on poor outcomes and high tumour aggressiveness in papillary thyroid carcinoma: A systematic review and meta-analysis. Clin. Endocrinol. 2021, 94, 731–742. [Google Scholar] [CrossRef]
- Song, Y.S.; Lim, Y.J.; Lim, H.J.; Kim, S.J.; Chung, J.H. Prognostic effects of TERT promoter mutations are enhanced by coexistence with BRAF or RAS mutations and strengthen the risk prediction by the ATA or TNM staging system in differentiated thyroid cancer patients. Cancer 2016, 122, 1370–1379. [Google Scholar] [CrossRef]
- Melo, M.; da Rocha, A.G.; Vinagre, J.; Batista, R.; Peixoto, J.; Soares, P. TERT promoter mutations are a major indicator of poor outcome in differentiated thyroid carcinomas. J. Clin. Endocrinol. Metab. 2014, 99, E754–E765. [Google Scholar] [CrossRef]
- Ricarte-Filho, J.C.; Ryder, M.; Chia, D.A.; Fagin, J.A. Mutational Profile of Advanced Primary and Metastatic Radioactive Iodine-Refractory Thyroid Cancers Reveals Distinct Pathogenetic Roles for BRAF, PIK3CA and AKT1. Cancer Res. 2009, 69, 4885. [Google Scholar] [CrossRef]
- Petrulea, M.S.; Plantinga, T.S.; Smit, J.W.; Georgescu, C.E.; Netea-Maier, R.T. PI3K/Akt/mTOR: A promising therapeutic target for non-medullary thyroid carcinoma. Cancer Treat. Rev. 2015, 41, 707–713. [Google Scholar] [CrossRef] [PubMed]
- Sobhani, N.; Roviello, G.; Nesi, G.; D’Angelo, A. The prognostic value of PI3K mutational status in breast cancer: A meta-analysis. J. Cell. Biochem. 2018, 119, 4287. [Google Scholar] [CrossRef]
- Lim, B.; Kim, J.H.; Kim, M.; Kim, S.Y. Genomic and epigenomic heterogeneity in molecular subtypes of gastric cancer. World J. Gastroenterol. 2016, 22, 1190. [Google Scholar] [CrossRef] [PubMed]
- Li, X.; Dai, D.; Chen, B.; Tang, H.; Xie, X.; Wei, W. Efficacy of PI3K/AKT/mTOR pathway inhibitors for the treatment of advanced solid cancers: A literature-based meta-analysis of 46 randomised control trials. PLoS ONE 2018, 13, e0192464. [Google Scholar] [CrossRef] [PubMed]
- Wang, C.; Tan, J.Y.M.; Chitkara, N.; Bhatt, S. TP53 Mutation-Mediated Immune Evasion in Cancer: Mechanisms and Therapeutic Implications. Cancers 2024, 16, 3069. [Google Scholar] [CrossRef]
- Marei, H.E.; Althani, A.; Afifi, N.; Hasan, A.; Caceci, T.; Pozzoli, G.; Morrione, A.; Giordano, C. p53 signaling in cancer progression and therapy. Cancer Cell Int. 2021, 21, 1–15. [Google Scholar] [CrossRef]
- Landa, I.; Ibrahimpasic, T.; Boucai, L.; Sinha, R.; Knauf, J.A. Genomic and transcriptomic hallmarks of poorly differentiated and anaplastic thyroid cancers. J. Clin. Investig. 2016, 126, 1052–1066. [Google Scholar] [CrossRef]


| Author | Publication Year | Country | Cancer Type | N. of Patient | Female | Age | Observation Period | Mutation | Outcome | Genes Panel |
|---|---|---|---|---|---|---|---|---|---|---|
| Duan et al. [16] | 2019 | China | PDTC + ATC | 66 (53 *) | 29 | NA | 6 years | BRAF, TERT, PI3K, TP53 | OS | Nextseq500, 18 genes |
| Hescot et al. [17] | 2022 | France | PDTC | 40 | 24 | 59 (51–72) a | 57.5 months | BRAF, TERT, PI3K | OS, DFS | Thyroseq V3, 12 genes |
| Inguinez et al. [18] | 2020 | US | DTC/PDTC + ATC | 55 | 26 | 55 (14) b | 30 years | BRAF, TERT.PI3K | OS | Foundation One, 315 genes |
| Lai et al. [19] | 2020 | Taiwan | ATC | 39 (27 *) | 20 | 75 (NA) a | 21 years | BRAF, PI3K, RAS, TP53 | OS | Targeted NGS, 5 genes |
| Wang et al. [20] | 2022 | US | ATC | 202 | 95 | 66 (32–92) a | 31 months | BRAF, TERT, PI3K, TP53 | OS, DFS | Targeted NGS, 19 genes, |
| Xu et al. [21] | 2020 | US + AU | ATC | 360 (102 *) | 196 | 68 (29–99) a | 9 months | BRAF, TERT, PI3K, TP53 | OS | MSK-IMPACT, 468 genes |
| Nguyen et al. [22] | 2022 | US | DTC | 25775 (307 *) | 154 | NA | 38 months | BRAF, TERT, PI3K | OS | MSK-IMPACT, 468 genes |
| Geoge et al. [23] | 2015 | US | PTC | 256 | 108 | 45.3(NA) a | 112 months | BRAF, TERT, | OS, DFS | NGS, 46 genes |
| Zehir et al. [24] | 2017 | US | ATC | 10336 (33 *) | 14 | NA | 30 months | BRAF, TERT, PI3K, TP53 | OS | MSK-IMPACT, 341 genes |
| Author | Number | BRAF (n, %) | TERT (n, %) | PI3K (n, %) | TP53 (n, %) | RET (n, %) | RAS (n, %) | TERT + BRAF (n, %) | TERT + TP53 (n, %) | TERT + PI3K (n, %) |
|---|---|---|---|---|---|---|---|---|---|---|
| Duan et al. [16] | 34 | 9 (26.5) | 9 (26.5) | 8 (23.5) | 11 (32.4) | 6 (17.6) | 4 (11.8) | 3 (8.8) | 2 (5.9) | 2 (5.9) |
| Hescot et al. [17] | 40 | 2 (5.0) | 17 (42.5) | 7 (17.5) | 9 (22.5) | - | 17 (42.5) | 2 (5.0) | 2 (4.0) | 4 (10.0) |
| Inguinez et al. [18] | 25 | 10 (40.0) | 14 (56.0) | 5 (20.0) | 9 (36.0) | 1 (4.0) | 3 (12.0) | 9 (36.0) | 3 (12.0) | 0 (0.0) |
| Nguyen et al. [22] | 307 | 212 (69.1) | 183 (59.6) | 33 (10.7) | 15 (4.9) | 22 (7.2) | 36 (11.7) | 147 (47.9) | 12 (3.9) | 18 (5.9) |
| Geoge et al. [23] | 256 | 235 (91.8) | 77 (30.1) | - | - | - | - | 77 (30.1) | - | 2 (0.8) |
| Pooled | 662 | 468 (70.7) | 300 (45.3) | 53 (13) | 44 (10.8) | 29 (7.9) | 60 (14.8) | 238 (35.9) | 19 (4.7) | 26 (3.9) |
| Author | Number | BRAF (n, %) | TERT (n, %) | PI3K (n, %) | TP53 (n, %) | RET (n, %) | RAS (n, %) | TERT + BRAF (n, %) | TERT + TP53 (n, %) | TERT + PI3K (n, %) |
|---|---|---|---|---|---|---|---|---|---|---|
| Duan et al. [16] | 19 | 14 (73.7) | 14 (73.7) | 11 (57.9) | 15 (78.9) | 0 (0) | 7 (36.8) | 8 (42.1) | 10 (52.6) | 6 (31.6) |
| Inguinez et al. [18] | 19 | 6 (31.6) | 13 (68.4) | 6 (31.6) | 14 (73.7) | 2 (10.5) | 4 (21.1) | 4 (21.1) | 11 (57.9) | 3 (15.8) |
| Lai et al. [19] | 27 | 7 (25.9) | 22 (81.5) | 4 (14.8) | 19 (70.4) | - | 11 (40.7) | 6 (22.2) | 15 (55.6) | 3 (11.1) |
| Wang et al. [20] | 202 | 84 (41.6) | 46 (22.8) | 31 (15.3) | 119 (58.9) | - | 45 (22.3) | 20 (9.9) | 31 (15.3) | 8 (4.0) |
| Xu et al. [21] | 102 | 46 (45.) | 76 (74.5) | 37 (36.3) | 64 (62.7) | 2 (2.0) | 22 (21.6) | 42 (41.2) | 48 (47.1) | 21 (20.6) |
| Zehir et al. [24] | 32 | 14 (43.8) | 5 (15.6) | 14 (43.8) | 22 (68.8) | 0 (0) | 7 (21.9) | 14 (43.8) | 19 (59.4) | 8 (25.0) |
| Pooled | 401 | 171 (42.6) | 176 (43.8) | 103 (25.7) | 253 (63.1) | 4 (2.3) | 96 (23.9) | 94 (23.4) | 134 (33.4) | 49 (12.2) |
| Author | Selection | Comparability | Outcome | NOS Total (Max. 9) |
|---|---|---|---|---|
| Duan et al. [16] | **** | * | ** | 7 |
| George et al. [23] | **** | *** | 7 | |
| Hescot et al. [17] | **** | * | 5 | |
| Inguinez-Ariza et al. [18] | ** | ** | 4 | |
| Lai et al. [19] | **** | ** | *** | 9 |
| Wang et al. [20] | **** | ** | *** | 9 |
| Xu et al. [21] | **** | ** | *** | 9 |
| Nguyen B et al. [22] | **** | ** | *** | 9 |
| Zehir et al. [24] | **** | ** | *** | 9 |
| Outcome | Number of Participants (Studies) | Relative Effect (95% CI) | Quality of Evidence (GRADE) | Comments |
|---|---|---|---|---|
| BRAF on OS | 877 (6 studies) | 1.11 (0.66 to 1.88) | Low | No significant effect, observational studies |
| BRAF on DFS | 458 (2 studies) | 1.23 (0.66 to 2.29) | Low | No significant effect, observational studies |
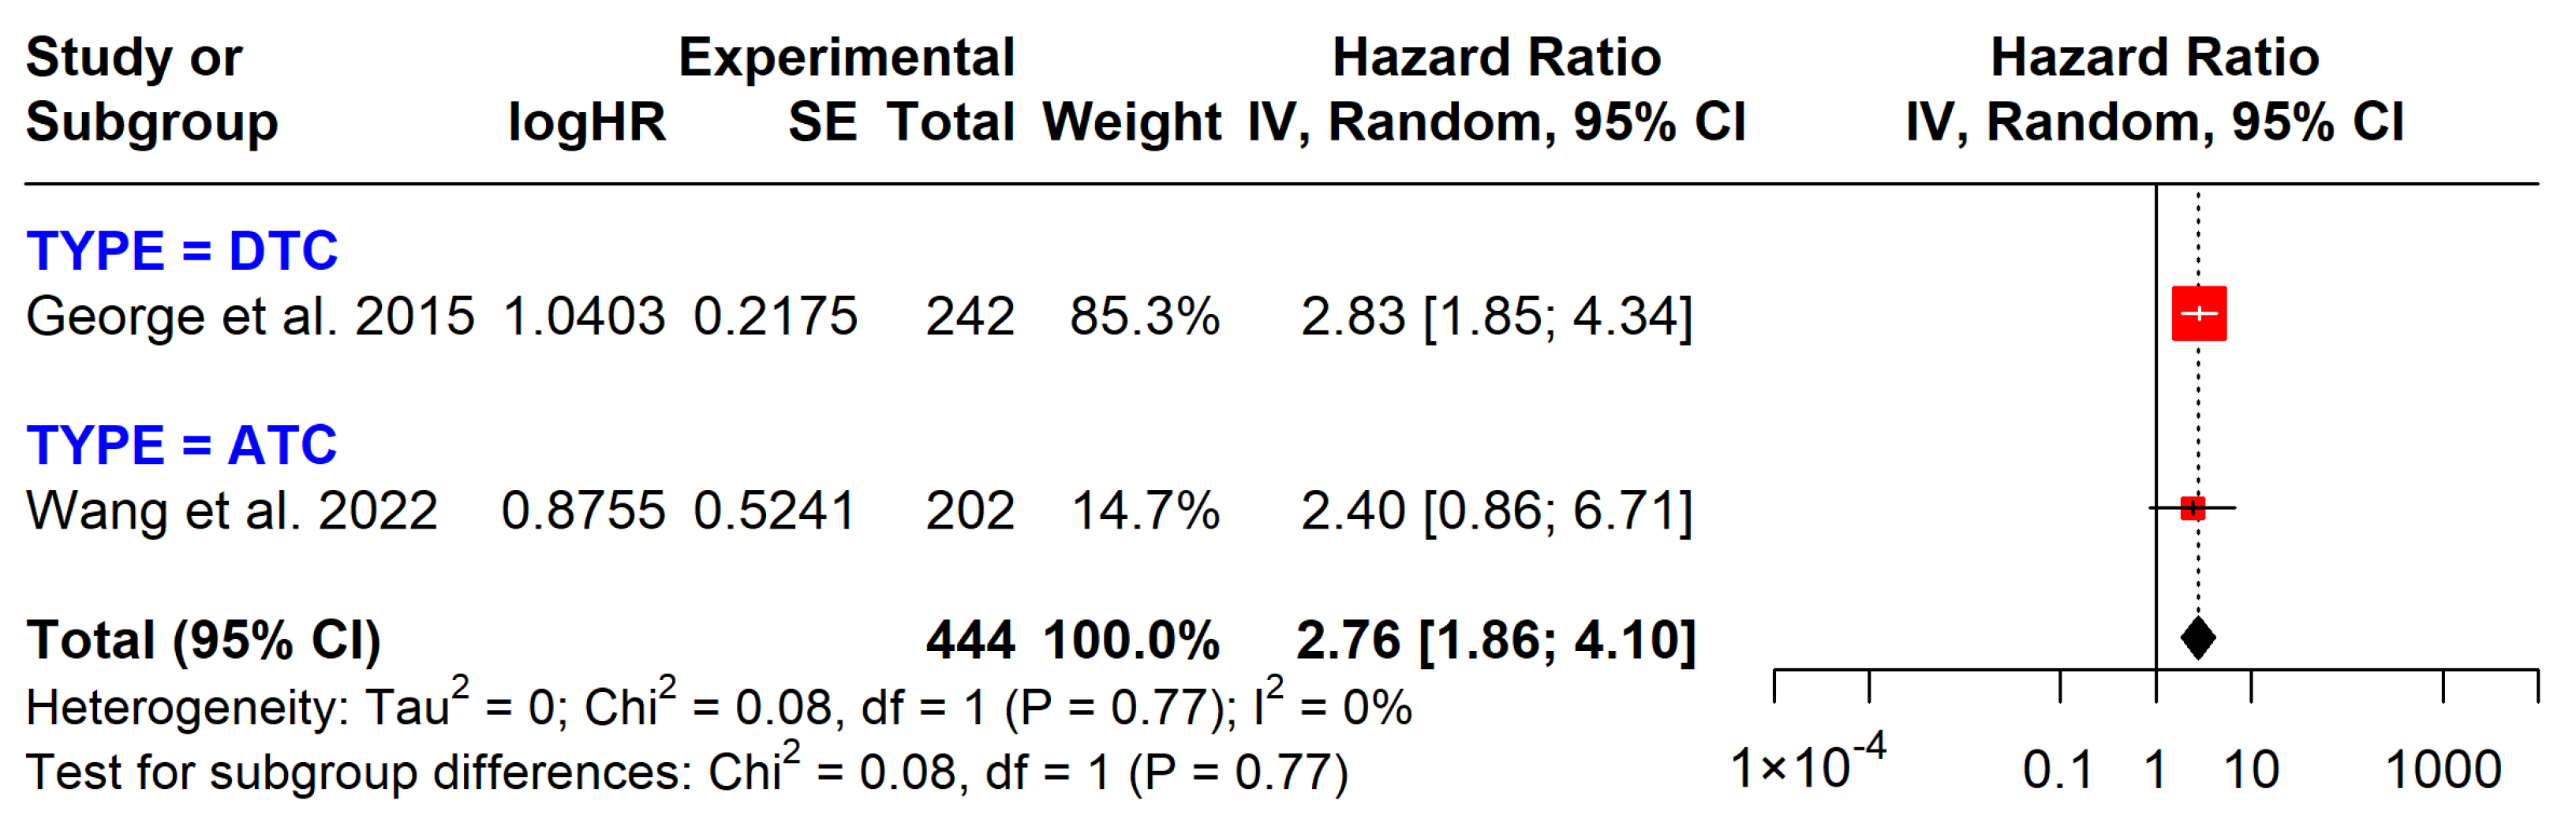
| TERT on OS | 1023 (9 studies) | 1.90 (1.17 to 3.09) | Moderate | Strong association with poorer OS, observational studies |
| TERT on DFS | 444 (2 studies) | 2.76 (1.86 to 4.10) | Moderate | Strong association with poorer DFS, observational studies |
| PI3K on OS | 661 (6 studies) | 2.17 (1.05 to 4.51) | Low | Associated with poorer OS, observational studies |
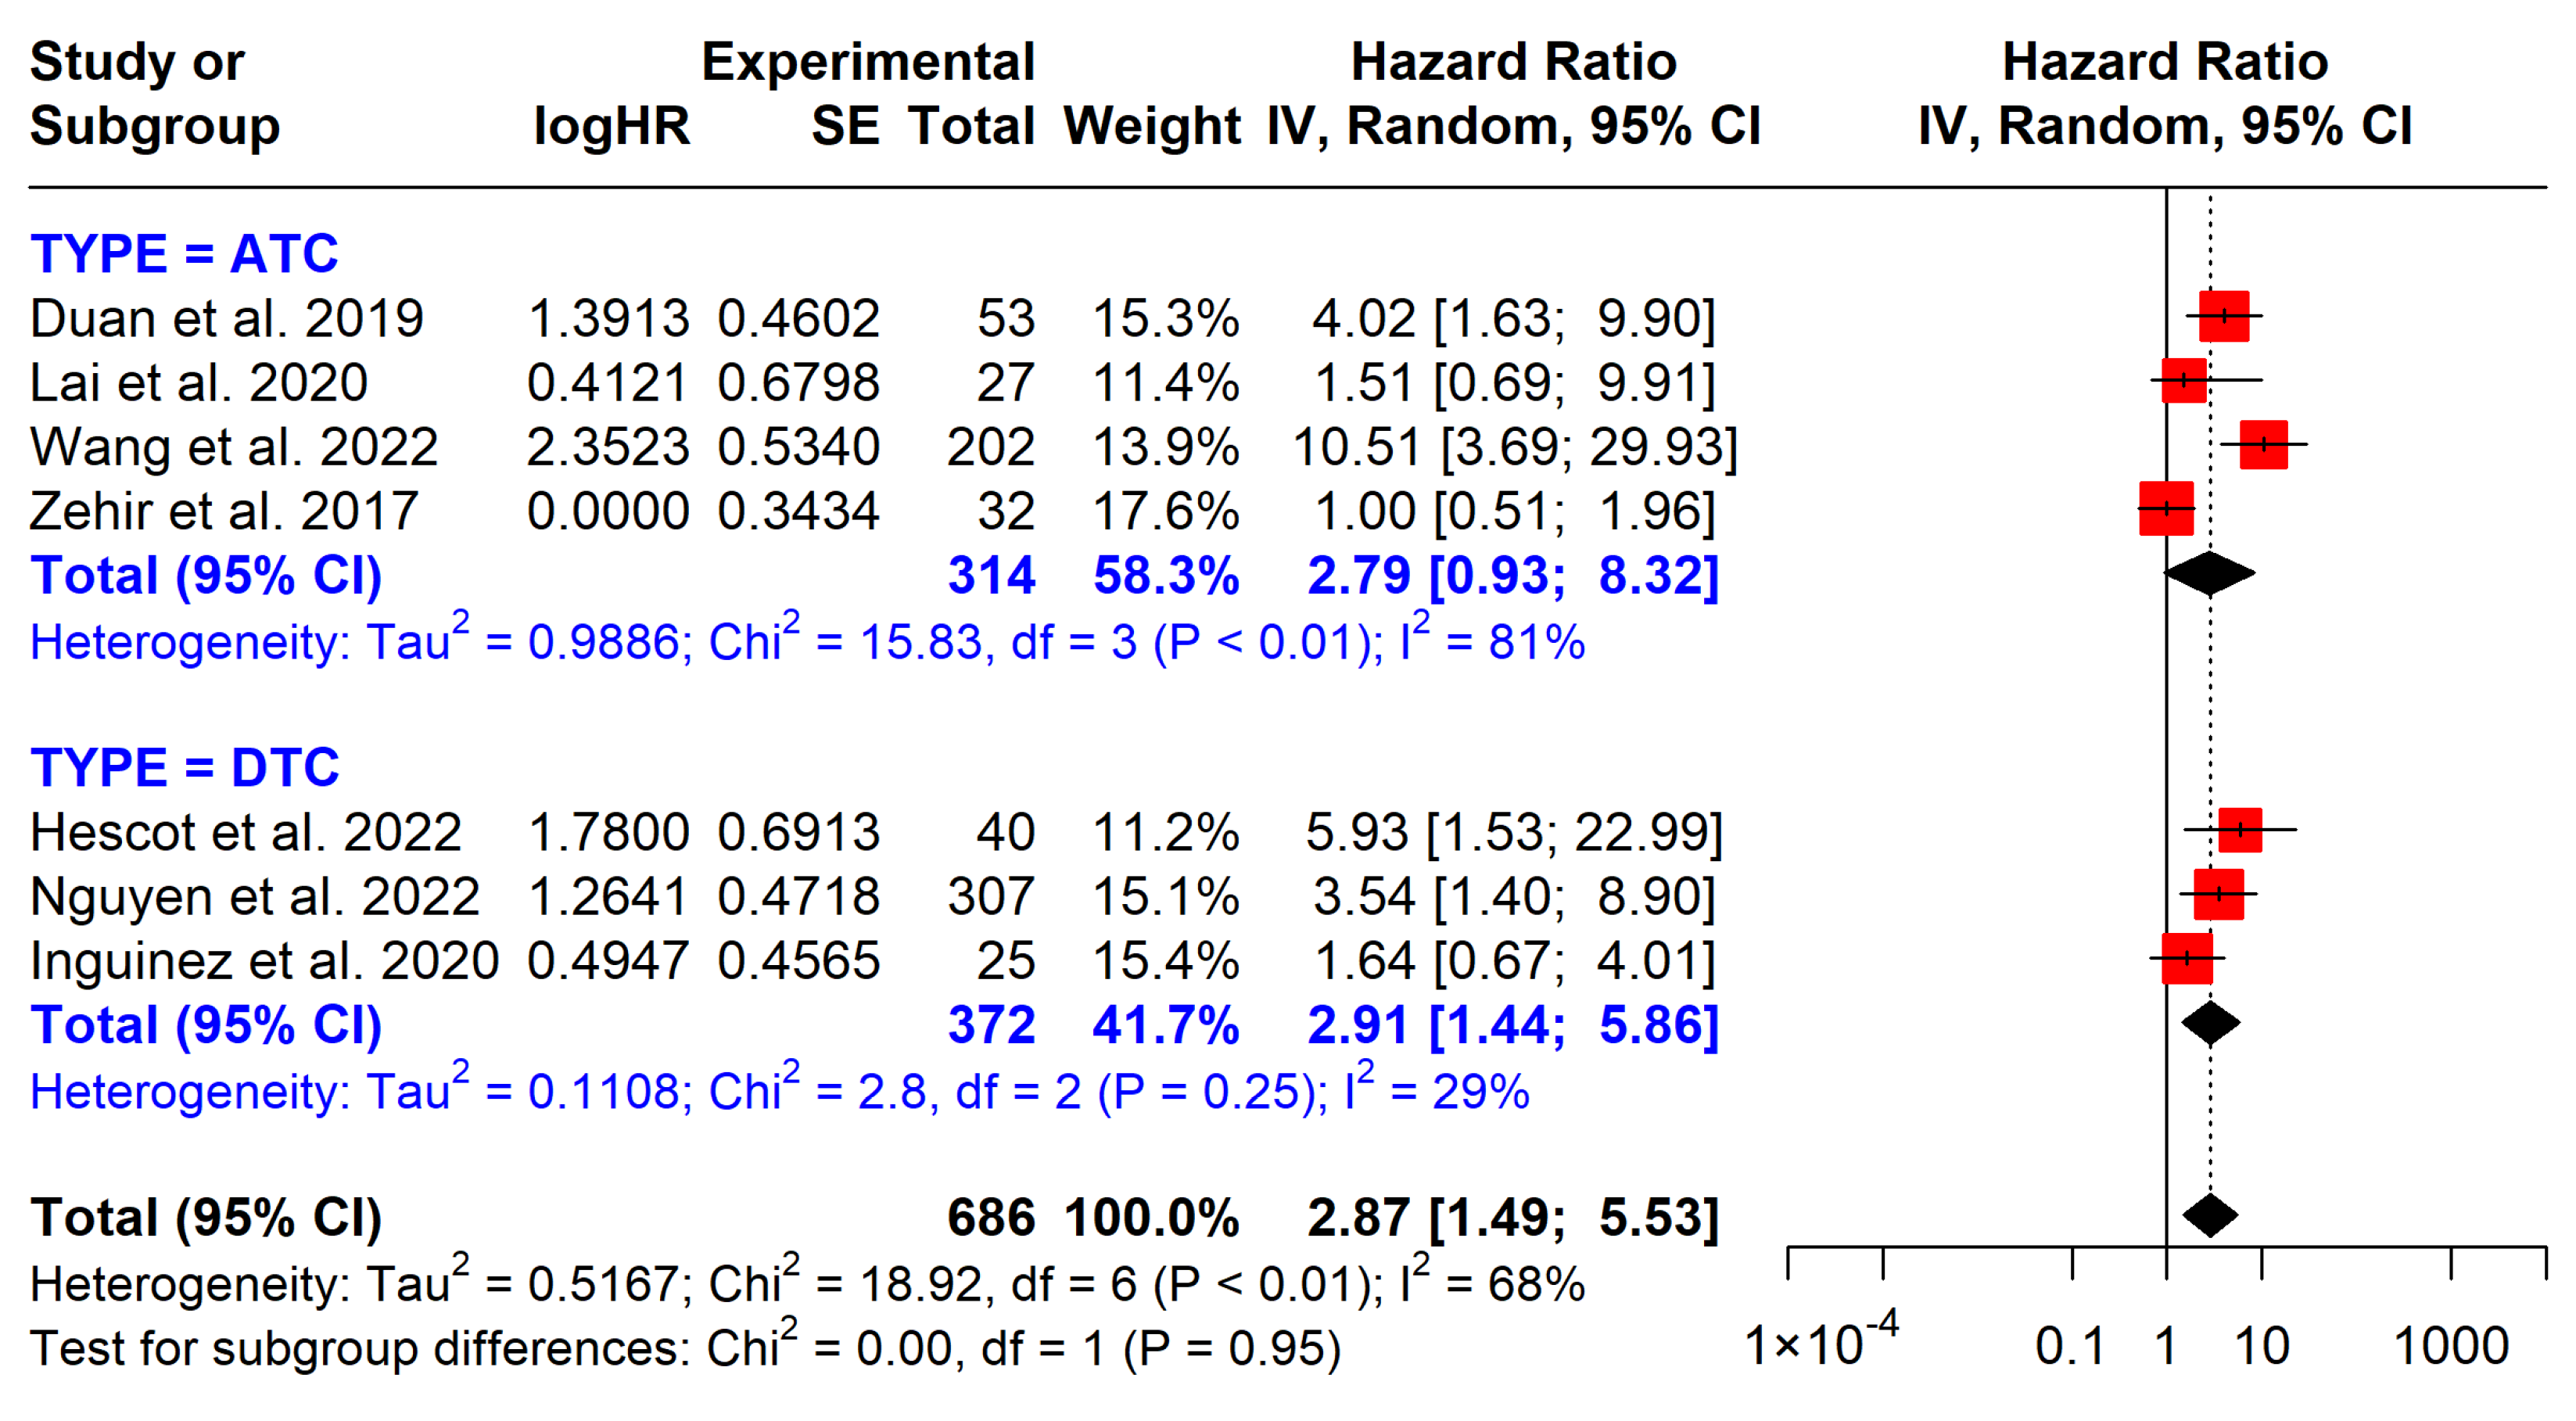
| TP53 OS | 686 (7 studies) | 2.87 (1.44 to 5.53) | Low | Associated with shorter OS, observational studies |
Disclaimer/Publisher’s Note: The statements, opinions and data contained in all publications are solely those of the individual author(s) and contributor(s) and not of MDPI and/or the editor(s). MDPI and/or the editor(s) disclaim responsibility for any injury to people or property resulting from any ideas, methods, instructions or products referred to in the content. |
© 2025 by the authors. Licensee MDPI, Basel, Switzerland. This article is an open access article distributed under the terms and conditions of the Creative Commons Attribution (CC BY) license (https://creativecommons.org/licenses/by/4.0/).
Share and Cite
Nguyen, L.T.T.; Thompson, E.K.; Bhimani, N.; Duong, M.C.; Nguyen, H.G.; Bullock, M.; Gild, M.L.; Glover, A. Prognostic Significance of Key Molecular Markers in Thyroid Cancer: A Systematic Literature Review and Meta-Analysis. Cancers 2025, 17, 939. https://doi.org/10.3390/cancers17060939
Nguyen LTT, Thompson EK, Bhimani N, Duong MC, Nguyen HG, Bullock M, Gild ML, Glover A. Prognostic Significance of Key Molecular Markers in Thyroid Cancer: A Systematic Literature Review and Meta-Analysis. Cancers. 2025; 17(6):939. https://doi.org/10.3390/cancers17060939
Chicago/Turabian StyleNguyen, Linh T. T., Emma K. Thompson, Nazim Bhimani, Minh C. Duong, Huy G. Nguyen, Martyn Bullock, Matti L. Gild, and Anthony Glover. 2025. "Prognostic Significance of Key Molecular Markers in Thyroid Cancer: A Systematic Literature Review and Meta-Analysis" Cancers 17, no. 6: 939. https://doi.org/10.3390/cancers17060939
APA StyleNguyen, L. T. T., Thompson, E. K., Bhimani, N., Duong, M. C., Nguyen, H. G., Bullock, M., Gild, M. L., & Glover, A. (2025). Prognostic Significance of Key Molecular Markers in Thyroid Cancer: A Systematic Literature Review and Meta-Analysis. Cancers, 17(6), 939. https://doi.org/10.3390/cancers17060939