

Predictors and Drivers of End-of-Life Medicare Spending Among Older Adults with Solid Tumors: A Population-Based Study
 , , , , ,
Simple Summary
Abstract
1. Introduction
2. Methods
2.1. Sample Selection and Outcomes
2.2. Covariates
2.3. Statistical Analysis
2.4. Sensitivity Analysis
3. Results
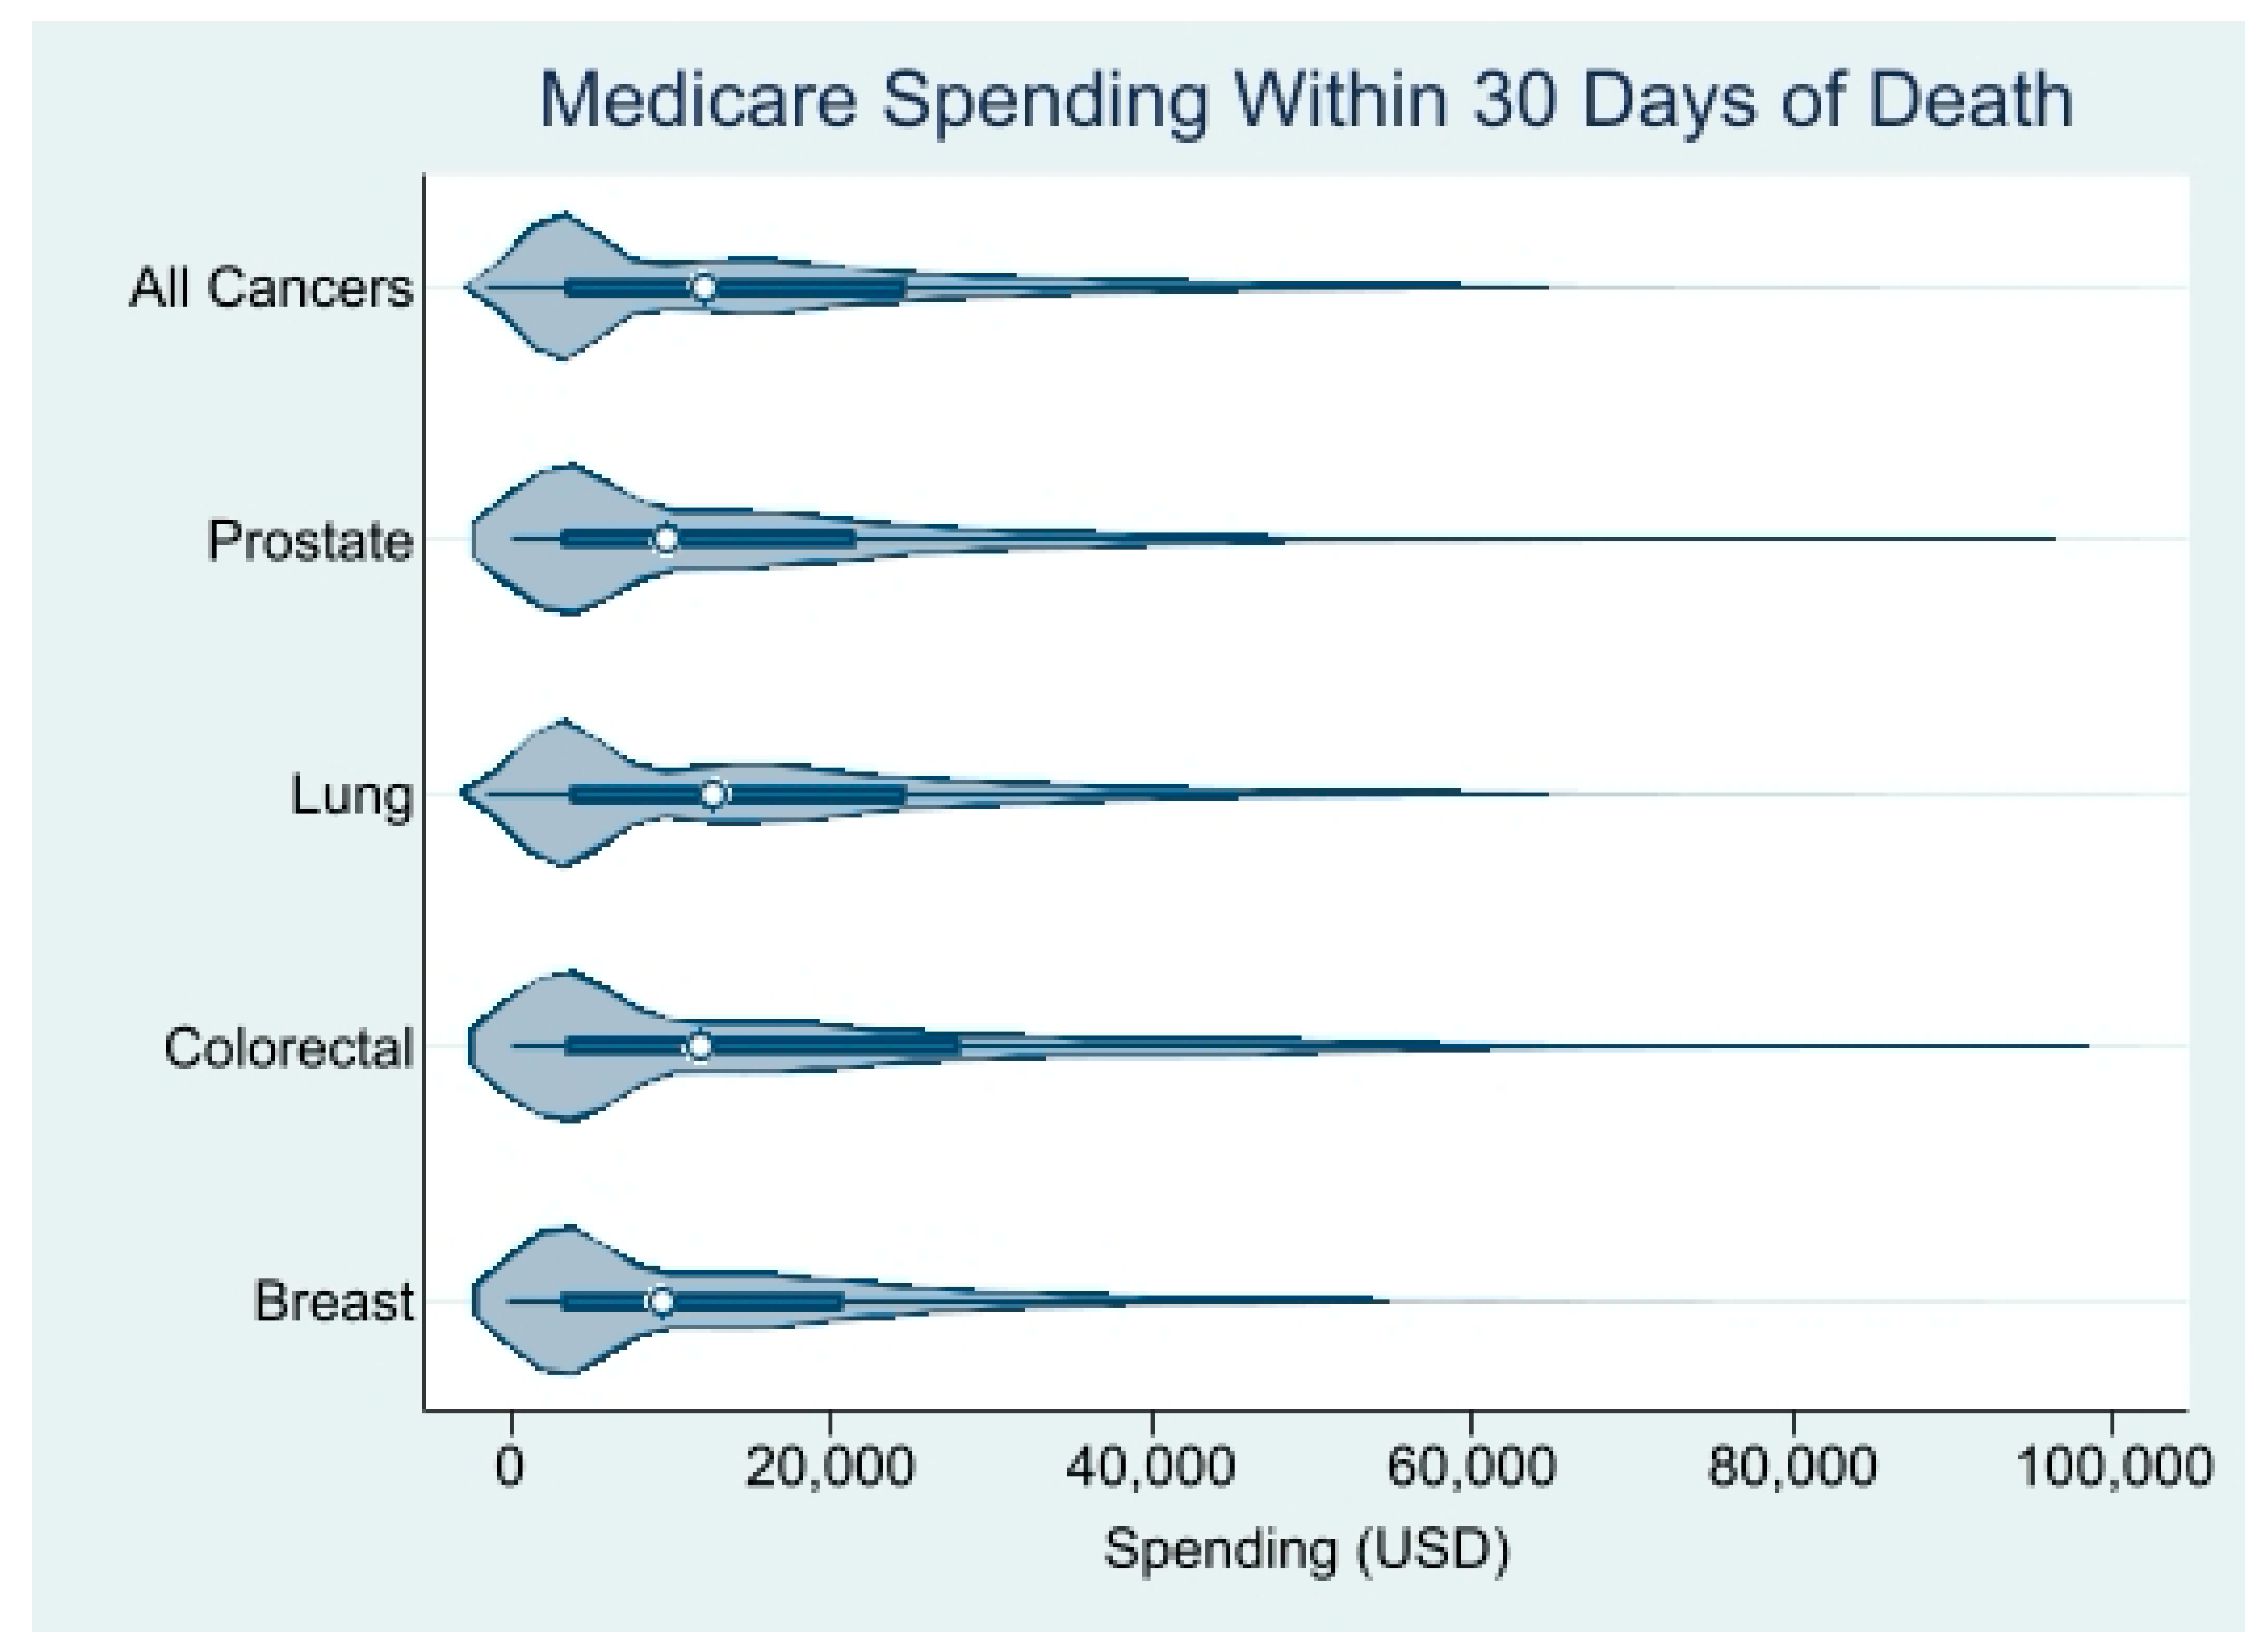
3.1. Descriptive Results
3.2. Predictor Results
3.3. Regression Results for Additional Analyses
4. Discussion
4.1. Demographic Predictors
4.2. Geographic Predictors
4.3. Sensitivity Analysis
4.4. Recommendations for Policy and Practice
5. Limitations
6. Conclusions
Author Contributions
Funding
Institutional Review Board Statement
Informed Consent Statement
Data Availability Statement
Acknowledgments
Conflicts of Interest
Appendix A
Model Fit Based on Box–Cox Transformation
Appendix B
Chemotherapy Endpoint
References
- Aldridge, M.D.; Bradley, E.H. Epidemiology and Patterns of Care at The End of Life: Rising Complexity, Shifts in Care Patterns and Sites of Death. Health Aff. 2017, 36, 1175–1183. [Google Scholar] [CrossRef] [PubMed]
- Teno, J.M.; Gozalo, P.; Trivedi, A.N.; Bunker, J.; Lima, J.; Ogarek, J.; Mor, V. Site of Death, Place of Care, and Health Care Transitions Among US Medicare Beneficiaries, 2000–2015. JAMA 2018, 320, 264–271. [Google Scholar] [CrossRef]
- Teno, J.M.; Clarridge, B.R.; Casey, V.; Welch, L.C.; Wetle, T.; Shield, R.; Mor, V. Family perspectives on end-of-life care at the last place of care. JAMA 2004, 291, 88–93. [Google Scholar] [CrossRef] [PubMed]
- Wright, A.A.; Keating, N.L.; Ayanian, J.Z.; Chrischilles, E.A.; Kahn, K.L.; Ritchie, C.S.; Weeks, J.C.; Earle, C.C.; Landrum, M.B. Family Perspectives on Aggressive Cancer Care Near the End of Life. JAMA 2016, 315, 284–292. [Google Scholar] [CrossRef] [PubMed]
- Wright, A.A.; Keating, N.L.; Balboni, T.A.; Matulonis, U.A.; Block, S.D.; Prigerson, H.G. Place of death: Correlations with quality of life of patients with cancer and predictors of bereaved caregivers’ mental health. J. Clin. Oncol. 2010, 28, 4457–4464. [Google Scholar] [CrossRef]
- Garrido, M.M.; Balboni, T.A.; Maciejewski, P.K.; Bao, Y.; Prigerson, H.G. Quality of Life and Cost of Care at the End of Life: The Role of Advance Directives. J. Pain. Symptom Manag. 2015, 49, 828–835. [Google Scholar] [CrossRef]
- Zhang, B.; Wright, A.A.; Huskamp, H.A.; Nilsson, M.E.; Maciejewski, M.L.; Earle, C.C.; Block, S.D.; Maciejewski, P.K.; Prigerson, H.G. Health care costs in the last week of life: Associations with end-of-life conversations. Arch. Intern. Med. 2009, 169, 480–488. [Google Scholar] [CrossRef]
- Lubitz, J.D.; Riley, G.F. Trends in Medicare payments in the last year of life. N. Engl. J. Med. 1993, 328, 1092–1096. [Google Scholar] [CrossRef]
- McCall, N. Utilization and costs of Medicare services by beneficiaries in their last year of life. Med. Care 1984, 22, 329–342. [Google Scholar] [CrossRef]
- Baxi, S.S.; Kale, M.; Keyhani, S.; Roman, B.R.; Yang, A.; Derosa, A.P.; Korenstein, D. Overuse of Health Care Services in the Management of Cancer: A Systematic Review. Med. Care 2017, 55, 723–733. [Google Scholar] [CrossRef]
- Scibetta, C.; Kerr, K.; McGuire, J.; Rabow, M.W. The Costs of Waiting: Implications of the Timing of Palliative Care Consultation among a Cohort of Decedents at a Comprehensive Cancer Center. J. Palliat. Med. 2016, 19, 69–75. [Google Scholar] [CrossRef] [PubMed]
- Wang, S.; Hsu, S.H.; Huang, S.; Soulos, P.R.; Gross, C.P. Longer Periods of Hospice Service Associated with Lower End-Of-Life Spending in Regions with High Expenditures. Health Aff. 2017, 36, 328–336. [Google Scholar] [CrossRef]
- Paredes, A.Z.; Hyer, J.M.; Palmer, E.; Lustberg, M.B.; Pawlik, T.M. Racial/Ethnic Disparities in Hospice Utilization Among Medicare Beneficiaries Dying from Pancreatic Cancer. J. Gastrointest. Surg. 2021, 25, 155–161. [Google Scholar] [CrossRef] [PubMed]
- Turkman, Y.E.; Williams, C.P.; Jackson, B.E.; Dionne-Odom, J.N.; Taylor, R.; Ejem, D.; Kvale, E.; Pisu, M.; Bakitas, M.; Rocque, G.B. Disparities in Hospice Utilization for Older Cancer Patients Living in the Deep South. J. Pain. Symptom Manag. 2019, 58, 86–91. [Google Scholar] [CrossRef]
- Kamal, A.H.; Bull, J.H.; Swetz, K.M.; Wolf, S.P.; Shanafelt, T.D.; Myers, E.R. Future of the Palliative Care Workforce: Preview to an Impending Crisis. Am. J. Med. 2017, 130, 113–114. [Google Scholar] [CrossRef]
- Kamal, A.H.; Wolf, S.P.; Troy, J.; Leff, V.; Dahlin, C.; Rotella, J.D.; Handzo, G.; Rodgers, P.E.; Myers, E.R. Policy Changes Key to Promoting Sustainability and Growth of The Specialty Palliative Care Workforce. Health Aff. 2019, 38, 910–918. [Google Scholar] [CrossRef] [PubMed]
- Stokes, M.E.; Black, L.; Benedict, A.; Roehrborn, C.G.; Albertsen, P. Long-term medical-care costs related to prostate cancer: Estimates from linked SEER-Medicare data. Prostate Cancer Prostatic Dis. 2010, 13, 278–284. [Google Scholar] [CrossRef]
- Sagar, B.; Lin, Y.S.; Castel, L.D. Cost drivers for breast, lung, and colorectal cancer care in a commercially insured population over a 6-month episode: An economic analysis from a health plan perspective. J. Med. Econ. 2017, 20, 1018–1023. [Google Scholar] [CrossRef]
- Yabroff, K.R.; Lamont, E.B.; Mariotto, A.; Warren, J.L.; Topor, M.; Meekins, A.; Brown, M.L. Cost of care for elderly cancer patients in the United States. J. Natl. Cancer Inst. 2008, 100, 630–641. [Google Scholar] [CrossRef]
- Keating, N.L.; Huskamp, H.A.; Kouri, E.; Schrag, D.; Hornbrook, M.C.; Haggstrom, D.A.; Landrum, M.B. Factors Contributing to Geographic Variation in End-Of-Life Expenditures for Cancer Patients. Health Aff. 2018, 37, 1136–1143. [Google Scholar] [CrossRef]
- Shugarman, L.R.; Bird, C.E.; Schuster, C.R.; Lynn, J. Age and gender differences in Medicare expenditures at the end of life for colorectal cancer decedents. J. Womens Health 2007, 16, 214–227. [Google Scholar] [CrossRef]
- Shugarman, L.R.; Bird, C.E.; Schuster, C.R.; Lynn, J. Age and gender differences in medicare expenditures and service utilization at the end of life for lung cancer decedents. Womens Health Issues 2008, 18, 199–209. [Google Scholar] [CrossRef] [PubMed]
- Wang, H.; Qiu, F.; Boilesen, E.; Nayar, P.; Lander, L.; Watkins, K.; Watanabe-Galloway, S. Rural-Urban Differences in Costs of End-of-Life Care for Elderly Cancer Patients in the United States. J. Rural. Health 2016, 32, 353–362. [Google Scholar] [CrossRef]
- Karanth, S.; Rajan, S.S.; Revere, F.L.; Sharma, G. Factors Affecting Racial Disparities in End-of-Life Care Costs Among Lung Cancer Patients: A SEER-Medicare-based Study. Am. J. Clin. Oncol. 2019, 42, 143–153. [Google Scholar] [CrossRef] [PubMed]
- Cancer Stat Facts: Common Cancer Sites. Available online: https://seer.cancer.gov/statfacts/html/common.html (accessed on 24 February 2025).
- Kelley, A.S.; Morrison, R.S.; Wenger, N.S.; Ettner, S.L.; Sarkisian, C.A. Determinants of treatment intensity for patients with serious illness: A new conceptual framework. J. Palliat. Med. 2010, 13, 807–813. [Google Scholar] [CrossRef]
- Davidoff, A.J.; Gardner, L.D.; Zuckerman, I.H.; Hendrick, F.; Ke, X.; Edelman, M.J. Validation of disability status, a claims-based measure of functional status for cancer treatment and outcomes studies. Med. Care 2014, 52, 500–510. [Google Scholar] [CrossRef] [PubMed]
- Klabunde, C.N.; Legler, J.M.; Warren, J.L.; Baldwin, L.M.; Schrag, D. A refined comorbidity measurement algorithm for claims-based studies of breast, prostate, colorectal, and lung cancer patients. Ann. Epidemiol. 2007, 17, 584–590. [Google Scholar] [CrossRef]
- Box, G.E.P.; Cox, D.R. An Analysis of Transformations. J. Roy. Stat. Soc. B. 1964, 26, 211–252. [Google Scholar] [CrossRef]
- Earle, C.C.; Neville, B.A.; Landrum, M.B.; Ayanian, J.Z.; Block, S.D.; Weeks, J.C. Trends in the aggressiveness of cancer care near the end of life. J. Clin. Oncol. 2004, 22, 315–321. [Google Scholar] [CrossRef]
- Earle, C.C.; Park, E.R.; Lai, B.; Weeks, J.C.; Ayanian, J.Z.; Block, S. Identifying potential indicators of the quality of end-of-life cancer care from administrative data. J. Clin. Oncol. 2003, 21, 1133–1138. [Google Scholar] [CrossRef]
- Baird, C.E.; Wulff-Burchfield, E.; Egan, P.C.; Hugar, L.A.; Vyas, A.; Trikalinos, N.A.; Liu, M.A.; Belanger, E.; Olszewski, A.J.; Bantis, L.E.; et al. Predictors of high-intensity care at the end of life among older adults with solid tumors: A population-based study. J. Geriatr. Oncol. 2024, 15, 101774. [Google Scholar] [CrossRef] [PubMed]
- National Quality Forum Measures. Available online: https://www.qualityforum.org/Qps/QpsTool.aspx#qpsPageState=%7B%22TabType%22%3A1,%22TabContentType%22%3A1,%22SearchCriteriaForStandard%22%3A%7B%22TaxonomyIDs%22%3A%5B%2211%3A37%22%5D,%22SelectedTypeAheadFilterOption%22%3Anull,%22Keyword%22%3A%22%22,%22PageSize%22%3A%2225%22,%22OrderType%22%3A3,%22OrderBy%22%3A%22ASC%22,%22PageNo%22%3A1,%22IsExactMatch%22%3Afalse,%22QueryStringType%22%3A%22%22,%22ProjectActivityId%22%3A%220%22,%22FederalProgramYear%22%3A%220%22,%22FederalFiscalYear%22%3A%220%22,%22FilterTypes%22%3A0,%22EndorsementStatus%22%3A%22%22,%22MSAIDs%22%3A%5B%5D%7D,%22SearchCriteriaForForPortfolio%22%3A%7B%22Tags%22%3A%5B%5D,%22FilterTypes%22%3A0,%22PageStartIndex%22%3A1,%22PageEndIndex%22%3A25,%22PageNumber%22%3Anull,%22PageSize%22%3A%2225%22,%22SortBy%22%3A%22Title%22,%22SortOrder%22%3A%22ASC%22,%22SearchTerm%22%3A%22%22%7D,%22ItemsToCompare%22%3A%5B%5D,%22SelectedStandardIdList%22%3A%5B%5D%7D (accessed on 24 February 2025).
- Miesfeldt, S.; Murray, K.; Lucas, L.; Chang, C.H.; Goodman, D.; Morden, N.E. Association of age, gender, and race with intensity of end-of-life care for Medicare beneficiaries with cancer. J. Palliat. Med. 2012, 15, 548–554. [Google Scholar] [CrossRef] [PubMed]
- Seow, H.; Barbera, L.C.; McGrail, K.; Burge, F.; Guthrie, D.M.; Lawson, B.; Chan, K.K.W.; Peacock, S.J.; Sutradhar, R. Effect of Early Palliative Care on End-of-Life Health Care Costs: A Population-Based, Propensity Score-Matched Cohort Study. JCO Oncol. Pract. 2022, 18, e183–e192. [Google Scholar] [CrossRef] [PubMed]
- Hamel, M.B.; Lynn, J.; Teno, J.M.; Covinsky, K.E.; Wu, A.W.; Galanos, A.; Desbiens, N.A.; Phillips, R.S. Age-related differences in care preferences, treatment decisions, and clinical outcomes of seriously ill hospitalized adults: Lessons from SUPPORT. J. Am. Geriatr. Soc. 2000, 48, S176–S182. [Google Scholar] [CrossRef]
- Lissauer, M.; Smitz-Naranjo, L.; Johnson, S. Gender influences end-of-life decisions. Crit. Care 2011, 15 (Suppl. S1), P522. [Google Scholar] [CrossRef]
- Bayer, W.; Mallinger, J.B.; Krishnan, A.; Shields, C.G. Attitudes toward life-sustaining interventions among ambulatory black and white patients. Ethn. Dis. 2006, 16, 914–919. [Google Scholar]
- Caralis, P.V.; Davis, B.; Wright, K.; Marcial, E. The influence of ethnicity and race on attitudes toward advance directives, life-prolonging treatments, and euthanasia. J. Clin. Ethics 1993, 4, 155–165. [Google Scholar] [CrossRef]
- McKinley, E.D.; Garrett, J.M.; Evans, A.T.; Danis, M. Differences in end-of-life decision making among black and white ambulatory cancer patients. J. Gen. Intern. Med. 1996, 11, 651–656. [Google Scholar] [CrossRef]
- Coombs, N.C.; Campbell, D.G.; Caringi, J. A qualitative study of rural healthcare providers’ views of social, cultural, and programmatic barriers to healthcare access. BMC Health Serv. Res. 2022, 22, 438. [Google Scholar] [CrossRef]
- Christakis, N.A.; Lamont, E.B. Extent and determinants of error in doctors’ prognoses in terminally ill patients: Prospective cohort study. BMJ 2000, 320, 469–472. [Google Scholar] [CrossRef]
- Poses, R.M.; McClish, D.K.; Bekes, C.; Scott, W.E.; Morley, J.N. Ego bias, reverse ego bias, and physicians’ prognostic. Crit. Care Med. 1991, 19, 1533–1539. [Google Scholar] [CrossRef]
- Brooks, G.A.; Cronin, A.M.; Uno, H.; Schrag, D.; Keating, N.L.; Mack, J.W. Intensity of Medical Interventions between Diagnosis and Death in Patients with Advanced Lung and Colorectal Cancer: A CanCORS Analysis. J. Palliat. Med. 2016, 19, 42–50. [Google Scholar] [CrossRef] [PubMed]
- Check, D.K.; Samuel, C.A.; Rosenstein, D.L.; Dusetzina, S.B. Investigation of Racial Disparities in Early Supportive Medication Use and End-of-Life Care Among Medicare Beneficiaries with Stage IV Breast Cancer. J. Clin. Oncol. 2016, 34, 2265–2270. [Google Scholar] [CrossRef] [PubMed]
- Hugar, L.A.; Yabes, J.G.; Filippou, P.; Wulff-Burchfield, E.M.; Lopa, S.H.; Gore, J.; Davies, B.J.; Jacobs, B.L. High-intensity end-of-life care among Medicare beneficiaries with bladder cancer. Urol. Oncol. 2021, 39, 731.e17–731.e24. [Google Scholar] [CrossRef]
- Keating, N.L.; Jhatakia, S.; Brooks, G.A.; Tripp, A.S.; Cintina, I.; Landrum, M.B.; Zheng, Q.; Christian, T.J.; Glass, R.; Hsu, V.D.; et al. Association of Participation in the Oncology Care Model with Medicare Payments, Utilization, Care Delivery, and Quality Outcomes. JAMA 2021, 326, 1829–1839. [Google Scholar] [CrossRef]
- Walker, B.; Frytak, J.; Hayes, J.; Neubauer, M.; Robert, N.; Wilfong, L. Evaluation of Practice Patterns Among Oncologists Participating in the Oncology Care Model. JAMA Netw. Open 2020, 3, e205165. [Google Scholar] [CrossRef] [PubMed]
- Connors, A.F.; Jr Dawson, N.V.; Desbiens, N.A.; Fulkerson, W.J.; Goldman, L.; Knaus, W.A.; Lynn, J.; Oye, R.K.; Bergner, M.; Damiano, A.; et al. A Controlled Trial to Improve Care for Seriously III Hospitalized Patients: The Study to Understand Prognoses and Preferences for Outcomes and Risks of Treatments (SUPPORT). JAMA 1995, 274, 1591–1598. [Google Scholar] [CrossRef]
- Manz, C.R.; Parikh, R.B.; Small, D.S.; Evans, C.N.; Chivers, C.; Regli, S.H.; Hanson, C.W.; Bekelman, J.E.; Rareshide, C.A.L.; O’Connor, N.; et al. Effect of Integrating Machine Learning Mortality Estimates with Behavioral Nudges to Clinicians on Serious Illness Conversations Among Patients with Cancer: A Stepped-Wedge Cluster Randomized Clinical Trial. JAMA Oncol. 2020, 6, e204759. [Google Scholar] [CrossRef]
- Ferrario, A.; Xu, X.; Zhang, F.; Ross-Degnan, D.; Wharam, J.F.; Wagner, A.K. Intensity of End-of-Life Care in a Cohort of Commercially Insured Women with Metastatic Breast Cancer in the United States. JCO Oncol. Pract. 2021, 17, e194–e203. [Google Scholar] [CrossRef]


| All Cancers (n = 59,355) | Breast Cancer (n = 4862) | Colorectal Cancer (n = 11,806) | Lung Cancer (n = 39,330) | Prostate Cancer (n = 3357) | |
|---|---|---|---|---|---|
| Clinical Characteristics | |||||
| NCI comorbidity index, mean (SD) | 3 (2) | 3 (2) | 3 (3) | 3 (2) | 3 (3) |
| Performance status, No. (%) | |||||
| Not poor | 35,753 (60.2%) | 2449 (50.4%) | 6132 (51.9%) | 25,022 (63.6%) | 2150 (64.0%) |
| Poor | 23,602 (39.8%) | 2413 (49.6%) | 5674 (48.1%) | 14,308 (36.4%) | 1207 (36.0%) |
| Stage at diagnosis, No. (%) | |||||
| I–II | 10,182 (17.2%) | 1540 (31.7%) | 2554 (21.6%) | 5173 (13.2%) | 915 (27.3%) |
| III | 13,391 (22.6%) | 920 (18.9%) | 2649 (22.4%) | 9722 (24.7%) | 100 (3.0%) |
| IV | 31,874 (53.7%) | 1825 (37.5%) | 5495 (46.5%) | 22,614 (57.5%) | 1940 (57.8%) |
| Death within 6 months of diagnosis, No. (%) | |||||
| No | 31,534 (53.1%) | 3595 (73.9%) | 6677 (56.6%) | 18,512 (47.1%) | 2750 (81.9%) |
| Yes | 27,821 (46.9%) | 1267 (26.1%) | 5129 (43.4%) | 20,818 (52.9%) | 607 (18.1%) |
| Demographic Characteristics | |||||
| Age at diagnosis, mean years (SD) | 76 (8) | 77 (9) | 79 (8) | 76 (7) | 77 (8) |
| Age at death, mean years (SD) | 77 (8) | 79 (9) | 80 (8) | 76 (7) | 79 (8) |
| Year of death, No. (%) | |||||
| 2011 | 5994 (10.1%) | 311 (6.4%) | 1187 (10.1%) | 4318 (11.0%) | 178 (5.3%) |
| 2012 | 11,099 (18.7%) | 679 (14.0%) | 2078 (17.6%) | 7859 (20.0%) | 483 (14.4%) |
| 2013 | 13,267 (22.4%) | 1044 (21.5%) | 2597 (22.0%) | 8933 (22.7%) | 693 (20.6%) |
| 2014 | 14,130 (23.8%) | 1286 (26.5%) | 2883 (24.4%) | 9016 (22.9%) | 945 (28.2%) |
| 2015 | 14,865 (25.0%) | 1542 (31.7%) | 3061 (25.9%) | 9204 (23.4%) | 1058 (31.5%) |
| Sex, No. (%) | |||||
| Female | 29,187 (49.2%) | 4809 (98.9%) | 6209 (52.6%) | 18,169 (46.2%) | 0.00 (0.0%) |
| Male | 30,168 (50.8%) | 53 (1.1%) | 5597 (47.4%) | 21,161 (53.8%) | 3357 (100.0%) |
| Race/ethnicity, No. (%) | |||||
| White | 46,765 (78.8%) | 3758 (77.3%) | 8844 (74.9%) | 31,665 (80.5%) | 2498 (74.4%) |
| Black | 5863 (9.9%) | 616 (12.7%) | 1328 (11.2%) | 3453 (8.8%) | 466 (13.9%) |
| Hispanic | 3261 (5.5%) | 274 (5.6%) | 855 (7.2%) | 1892 (4.8%) | 240 (7.1%) |
| Other ^ | 3466 (5.8%) | 214 (4.4%) | 779 (6.6%) | 2320 (5.9%) | 153 (4.6%) |
| Marital status, No. (%) | |||||
| Married | 27,345 (46.1%) | 1556 (32.0%) | 4851 (41.1%) | 19,123 (48.6%) | 1815 (54.1%) |
| Not married | 28,942 (48.8%) | 2957 (60.8%) | 6340 (53.7%) | 18,507 (47.1%) | 1138 (33.9%) |
| Geographic/Socioeconomic Characteristics | |||||
| U.S. region at death, No. (%) | |||||
| Northeast | 10,936 (18.4%) | 968 (19.9%) | 2297 (19.5%) | 7056 (17.9%) | 615 (18.3%) |
| Midwest | 7337 (12.4%) | 606 (12.5%) | 1436 (12.2%) | 4898 (12.5%) | 397 (11.8%) |
| South | 17,370 (29.3%) | 1349 (27.7%) | 3113 (26.4%) | 12,050 (30.6%) | 858 (25.6%) |
| West | 23,679 (39.9%) | 1936 (39.8%) | 4951 (41.9%) | 15,306 (38.9%) | 1486 (44.3%) |
| Population in county of residence, No. (%) | |||||
| 249,999 or less | 16,477 (27.8%) | 1231 (25.3%) | 3136 (26.6%) | 11,195 (28.5%) | 915 (27.3%) |
| 250,000 to 999,999 | 12,507 (21.1%) | 1014 (20.9%) | 2473 (20.9%) | 8298 (21.1%) | 722 (21.5%) |
| 1,000,000 or more | 30,318 (51.1%) | 2613 (53.7%) | 6183 (52.4%) | 19,804 (50.4%) | 1718 (51.2%) |
| Rural/urban area at diagnosis, No. (%) | |||||
| All rural | 5425 (9.1%) | 374 (7.7%) | 993 (8.4%) | 3761 (9.6%) | 297 (8.8%) |
| All urban | 34,935 (58.9%) | 2917 (60.0%) | 7194 (60.9%) | 22,907 (58.2%) | 1917 (57.1%) |
| Mostly rural | 5100 (8.6%) | 348 (7.2%) | 889 (7.5%) | 3564 (9.1%) | 299 (8.9%) |
| Mostly urban | 13,058 (22.0%) | 1,021 (21.0%) | 2590 (21.9%) | 8731 (22.2%) | 716 (21.3%) |
| Poverty, No. (%) | |||||
| 0% to <5% poverty | 10,204 (17.2%) | 918 (18.9%) | 2032 (17.2%) | 6634 (16.9%) | 620 (18.5%) |
| 5% to <10% poverty | 14,420 (24.3%) | 1234 (25.4%) | 2856 (24.2%) | 9497 (24.1%) | 833 (24.8%) |
| 10% to <20% poverty | 18,223 (30.7%) | 1371 (28.2%) | 3625 (30.7%) | 12,237 (31.1%) | 990 (29.5%) |
| 20% to 100% poverty | 15,092 (25.4%) | 1243 (25.6%) | 3048 (25.8%) | 9943 (25.3%) | 858 (25.6%) |
| State buy-in, No. (%) | |||||
| No | 45,838 (77.2%) | 3640 (74.9%) | 8748 (74.1%) | 30,745 (78.2%) | 2705 (80.6%) |
| Yes | 13,517 (22.8%) | 1222 (25.1%) | 3058 (25.9%) | 8585 (21.8%) | 652 (19.4%) |
| All Cancers | Breast | Colorectal | Lung | Prostate | |
|---|---|---|---|---|---|
| Coefficient (95% CI) | Coefficient (95% CI) | Coefficient (95% CI) | Coefficient (95% CI) | Coefficient (95% CI) | |
| Clinical Predictors | |||||
| NCI Comorbidity Index | 1.06 *** (1.03 to 1.09) | 0.99 *** (0.87 to 1.10) | 1.07 *** (0.99 to 1.15) | 1.10 *** (1.06 to 1.14) | 0.94 *** (0.80 to 1.08) |
| Performance Status | |||||
| Not poor | 0 [Reference] | 0 [Reference] | 0 [Reference] | 0 [Reference] | 0 [Reference] |
| Poor | −5.36 *** (−5.53 to −5.20) | −4.62 *** (−5.18 to −4.06) | −6.31 *** (−6.71 to −5.92) | −5.33 *** (−5.52 to −5.13) | −4.43 *** (−5.17 to −3.68) |
| Stage at Diagnosis | |||||
| I–II | 0 [Reference] | 0 [Reference] | 0 [Reference] | 0 [Reference] | 0 [Reference] |
| III | 0.37 ** (0.13 to 0.61) | 0.52 (−0.20 to 1.25) | −0.83 ** (−1.38 to −0.29) | 0.89 *,** (0.58 to 1.19) | 0.82 (−1.21 to 2.85) |
| IV | 0.39 *** (0.18 to 0.60) | 1.62 *** (1.01 to 2.23) | −1.72 *** (−2.20 to −1.24) | 1.09 *** (0.81 to 1.37) | 1.04 ** (0.26 to 1.81) |
| Demographic Predictors | |||||
| Age at Diagnosis | −0.05 *** (−0.06 to −0.04) | −0.16 *** (−0.19 to −0.13) | −0.04 ** (−0.06 to −0.01) | −0.06 *** (−0.07 to −0.05) | −0.08 *** (−0.12 to −0.03) |
| Sex | |||||
| Male | 0 [Reference] | 0 [Reference] | 0 [Reference] | 0 [Reference] | |
| Female | 0.33 *** (0.16 to 0.49) | 1.97 (−0.69 to 4.62) | 0.18 (−0.22 to 0.58) | 0.34 *** (0.15 to 0.54) | |
| Race/Ethnicity | |||||
| White | 0 [Reference] | 0 [Reference] | 0 [Reference] | 0 [Reference] | 0 [Reference] |
| Black | 0.91 *** (0.63 to 1.19) | 1.72 *** (0.83 to 2.61) | 0.50 (−0.15 to 1.15) | 0.87 *** (0.52 to 1.21) | 0.80 (−0.36 to 1.96) |
| Hispanic | 0.03 (−0.33 to 0.38) | −0.33 (−1.53 to 0.88) | −0.46 (−1.23 to 0.31) | 0.18 (−0.26 to 0.63) | −0.66 (−2.11 to 0.79) |
| Other ^ | 0.91 *** (0.56 to 1.27) | −0.17 (−1.55 to 1.22) | 0.13 (−0.68 to 0.95) | 1.20 *** (0.78 to 1.62) | 1.07 (−0.69 to 2.82) |
| Marital Status | |||||
| Married | 0 [Reference] | 0 [Reference] | 0 [Reference] | 0 [Reference] | 0 [Reference] |
| Not married | 0.16 (−0.01 to 0.33) | −0.33 (−0.92 to 0.27) | 0.14 (−0.27 to 0.55) | 0.20 * (0.00 to 0.40) | 0.15 (−0.60 to 0.89) |
| Geographic/Socioeconomic Predictors | |||||
| U.S. Region at Death | |||||
| Northeast | 0 [Reference] | 0 [Reference] | 0 [Reference] | 0 [Reference] | 0 [Reference] |
| Midwest | −1.40 *** (−1.69 to −1.11) | −1.25 ** (−2.22 to −0.27) | −1.62 *** (−2.33 to −0.92) | −1.36 *** (−1.70 to −1.01) | −1.18 (−2.5 to 0.14) |
| South | −2.32 *** (−2.59 to −2.06) | −2.16 *** (−3.06 to −1.27) | −2.30 *** (−2.94 to −1.66) | −2.26 *** (−2.57 to −1.95) | −2.53 *** (−3.74 to −1.32) |
| West | −0.66 *** (−0.89 to −0.43) | −0.37 (−1.14 to 0.41) | −0.74 ** (−1.28 to −0.19) | −0.67 *** (−0.94 to −0.40) | −0.21 (−1.23 to 0.82) |
| Population in County of Residence | |||||
| 249,999 or less | 0 [Reference] | 0 [Reference] | 0 [Reference] | 0 [Reference] | 0 [Reference] |
| 250,000–999,999 | 0.56 *** (0.32 to 0.81) | 0.83 (−0.03 to 1.70) | 1.07 *** (0.46 to 1.68) | 0.46 ** (0.17 to 0.75) | −0.18 (−1.29 to 0.93) |
| 1,000,000 or more | 1.33 *** (1.10 to 1.57) | 1.91 *** (1.09 to 2.73) | 1.44 *** (0.86 to 2.03) | 1.23 *** (0.95 to 1.51) | 1.17 * (0.11 to 2.24) |
| Rural/Urban Area at Diagnosis | |||||
| All urban | 0 [Reference] | 0 [Reference] | 0 [Reference] | 0 [Reference] | 0 [Reference] |
| All rural | −0.62 *** (−0.95 to −0.30) | 0.09 (−1.09 to 1.27) | −0.65 (−1.45 to 0.15) | −0.61 *** (−0.98 to −0.23) | −1.97 ** (−3.4 to −0.53) |
| Mostly rural | −0.77 *** (−1.08 to −0.46) | 0.79 (−0.33 to 1.91) | −0.65 (−1.45 to 0.15) | −0.93 *** (-1.29 to -0.57) | −0.87 (−2.22 to 0.48) |
| Mostly urban | −0.55 *** (−0.76 to −0.34) | −0.43 (−1.15 to 0.29) | −0.39 (−0.91 to 0.13) | −0.59 *** (−0.84 to −0.34) | −1.15 * (−2.11 to −0.19) |
| Poverty | |||||
| 0–<5% poverty | 0 [Reference] | 0 [Reference] | 0 [Reference] | 0 [Reference] | 0 [Reference] |
| 5–<10% poverty | −0.10 (−0.35 to 0.14) | −0.27 (−1.08 to 0.53) | 0.16 (−0.44 to 0.76) | −0.11 (−0.40 to 0.18) | −1.22 * (−2.3 to −0.15) |
| 10–<20% poverty | 0.07 (−0.18 to 0.31) | 0.48 (−0.35 to 1.31) | 0.76 * (0.16 to 1.35) | −0.19 (−0.48 to 0.10) | −0.45 (−1.55 to 0.65) |
| 20–100% poverty | 0.09 (−0.18 to 0.36) | −0.03 (−0.94 to 0.89) | 1.05 ** (0.40 to 1.70) | −0.14 (−0.46 to 0.18) | −0.90 (−2.09 to 0.3) |
| State Buy-In | |||||
| No | 0 [Reference] | 0 [Reference] | 0 [Reference] | 0 [Reference] | 0 [Reference] |
| Yes | 0.72 *** (0.52 to 0.93) | 0.31 (−0.38 to 1.00) | 0.18 (−0.30 to 0.66) | 0.86 *** (0.61 to 1.10) | 1.19 * (0.2 to 2.18) |
| All Cancers | Breast | Colorectal | Lung | Prostate | |
|---|---|---|---|---|---|
| Coefficient (95% CI) | Coefficient (95% CI) | Coefficient (95% CI) | Coefficient (95% CI) | Coefficient (95% CI) | |
| Clinical Predictors | |||||
| NCI Comorbidity Index | 0.94 *** (0.89 to 0.98) | 0.90 *** (0.69 to 1.11) | 0.82 *** (0.71 to 0.93) | 1.01 *** (0.96 to 1.07) | 0.79 *** (0.49 to 1.09) |
| Performance Status | |||||
| Not poor | 0 [Reference] | 0 [Reference] | 0 [Reference] | 0 [Reference] | 0 [Reference] |
| Poor | −4.98 *** (−5.24 to −4.73) | −3.83 *** (−4.89 to −2.76) | −5.81 *** (−6.41 to −5.20) | −5.00 *** (−5.29 to −4.72) | −4.39 *** (−6.08 to −2.69) |
| Stage at Diagnosis | |||||
| I–II | 0 [Reference] | 0 [Reference] | 0 [Reference] | 0 [Reference] | 0 [Reference] |
| III | −1.35 *** (−1.78 to −0.92) | 0.81 (−1.09 to 2.70) | −0.55 (−1.41 to 0.32) | −0.25 (−0.80 to 0.29) | 7.53 (−2.20 to 17.26) |
| IV | −2.24 *** (−2.62 to −1.86) | 0.86 (−0.58 to 2.30) | −4.71 *** (−5.43 to −4.00) | −0.60 * (−1.10 to −0.10) | 4.02 *** (1.90 to 6.14) |
| Demographic Predictors | |||||
| Age at Diagnosis | −0.08 *** (−0.10 to −0.06) | −0.20 *** (−0.26 to −0.13) | −0.05 ** (−0.09 to −0.02) | −0.12 *** (−0.14 to −0.10) | −0.04 (−0.14 to 0.06) |
| Sex | |||||
| Male | 0 [Reference] | 0 [Reference] | 0 [Reference] | 0 [Reference] | |
| Female | 0.49 *** (0.26 to 0.72) | 1.44 (−3.87 to 6.76) | −0.12 (−0.71 to 0.46) | 0.59 *** (0.33 to 0.85) | |
| Race/Ethnicity | |||||
| White | 0 [Reference] | 0 [Reference] | 0 [Reference] | 0 [Reference] | 0 [Reference] |
| Black | 0.66 ** (0.26 to 1.07) | 0.83 (−0.79 to 2.45) | 0.23 (−0.74 to 1.20) | 0.66 ** (0.19 to 1.12) | 0.87 (−1.57 to 3.31) |
| Hispanic | −0.12 (−0.64 to 0.40) | −1.89 (−4.28 to 0.50) | −1.37 * (−2.55 to −0.19) | 0.27 (−0.33 to 0.86) | −1.07 (−4.36 to 2.22) |
| Other ^ | 0.72 ** (0.20 to 1.23) | −1.28 (−4.00 to 1.44) | 0.27 (−0.98 to 1.52) | 0.97 *** (0.40 to 1.54) | 2.67 (−2.85 to 8.19) |
| Marital Status | |||||
| Married | 0 [Reference] | 0 [Reference] | 0 [Reference] | 0 [Reference] | 0 [Reference] |
| Not married | 0.08 (−0.16 to 0.32) | 0.42 (−0.70 to 1.55) | 0.06 (−0.54 to 0.66) | 0.01 (−0.26 to 0.27) | −0.25 (−1.83 to 1.34) |
| Geographic/Socioeconomic Predictors | |||||
| U.S. Region at Death | |||||
| Northeast | 0 [Reference] | 0 [Reference] | 0 [Reference] | 0 [Reference] | 0 [Reference] |
| Midwest | −1.66 *** (−2.07 to −1.24) | −2.08 * (−3.81 to −0.35) | −1.58 ** (−2.60 to −0.57) | −1.65 *** (−2.12 to −1.18) | −2.36 (−5.37 to 0.65) |
| South | −2.83 *** (−3.21 to −2.46) | −3.71 *** (−5.29 to −2.12) | −2.27 *** (−3.21 to −1.34) | −2.72 *** (−3.15 to −2.30) | −5.02 *** (−7.71 to −2.34) |
| West | −0.92 *** (−1.25 to −0.59) | −1.26 (−2.66 to 0.14) | −0.97 * (−1.77 to −0.17) | −0.85 *** (−1.22 to −0.47) | −1.50 (−3.81 to 0.82) |
| Population in County of Residence | |||||
| 249,999 or less | 0 [Reference] | 0 [Reference] | 0 [Reference] | 0 [Reference] | 0 [Reference] |
| 250,000–999,999 | 0.42 * (0.07 to 0.77) | 1.19 (−0.42 to 2.80) | 0.60 (−0.28 to 1.48) | 0.36 (−0.03 to 0.75) | −0.10 (−2.53 to 2.34) |
| 1,000,000 or more | 1.25 *** (0.91 to 1.58) | 1.67 * (0.15 to 3.19) | 1.34 ** (0.49 to 2.20) | 1.22 *** (0.85 to 1.60) | 1.31 (−0.99 to 3.61) |
| Rural/Urban Area at Diagnosis | |||||
| All urban | 0 [Reference] | 0 [Reference] | 0 [Reference] | 0 [Reference] | 0 [Reference] |
| All rural | −0.60 * (−1.05 to −0.14) | 1.00 (−1.16 to 3.16) | −1.20 * (−2.35 to −0.04) | −0.58 * (−1.09 to −0.07) | −2.05 (−5.51 to 1.41) |
| Mostly rural | −0.79 ** (−1.23 to −0.34) | 1.24 (−0.83 to 3.31) | −1.24 * (−2.41 to −0.08) | −0.76 ** (−1.26 to −0.27) | −0.68 (−3.90 to 2.55) |
| Mostly urban | −0.48 ** (−0.79 to −0.18) | −0.17 (−1.53 to 1.19) | −0.85 * (−1.60 to −0.09) | −0.49 ** (−0.83 to −0.15) | −0.61 (−2.61 to 1.38) |
| Poverty | |||||
| 0–<5% poverty | 0 [Reference] | 0 [Reference] | 0 [Reference] | 0 [Reference] | 0 [Reference] |
| 5–<10% poverty | −0.02 (−0.38 to 0.34) | −0.62 (−2.11 to 0.86) | 0.09 (−0.79 to 0.97) | 0.02 (−0.38 to 0.42) | 0.23 (−2.19 to 2.65) |
| 10–<20% poverty | 0.08 (−0.28 to 0.43) | −0.50 (−2.03 to 1.03) | 0.84 (−0.04 to 1.71) | −0.12 (−0.52 to 0.28) | 1.29 (−1.31 to 3.89) |
| 20–100% poverty | 0.12 (−0.27 to 0.51) | 0.34 (−1.40 to 2.07) | 0.76 (−0.19 to 1.72) | −0.10 (−0.54 to 0.34) | 1.73 (−0.92 to 4.39) |
| State Buy-In | |||||
| No | 0 [Reference] | 0 [Reference] | 0 [Reference] | 0 [Reference] | 0 [Reference] |
| Yes | 0.75 *** (0.46 to 1.04) | 0.02 (−1.27 to 1.31) | 0.54 (−0.17 to 1.25) | 0.83 *** (0.50 to 1.16) | 0.00 (−2.19 to 2.20) |
Disclaimer/Publisher’s Note: The statements, opinions and data contained in all publications are solely those of the individual author(s) and contributor(s) and not of MDPI and/or the editor(s). MDPI and/or the editor(s) disclaim responsibility for any injury to people or property resulting from any ideas, methods, instructions or products referred to in the content. |
© 2025 by the authors. Licensee MDPI, Basel, Switzerland. This article is an open access article distributed under the terms and conditions of the Creative Commons Attribution (CC BY) license (https://creativecommons.org/licenses/by/4.0/).
Share and Cite
Baird, C.E.; Wulff-Burchfield, E.; Egan, P.C.; Hugar, L.A.; Vyas, A.; Trikalinos, N.A.; Liu, M.A.; Olszewski, A.J.; Bantis, L.E.; Panagiotou, O.A.; et al. Predictors and Drivers of End-of-Life Medicare Spending Among Older Adults with Solid Tumors: A Population-Based Study. Cancers 2025, 17, 1016. https://doi.org/10.3390/cancers17061016
Baird CE, Wulff-Burchfield E, Egan PC, Hugar LA, Vyas A, Trikalinos NA, Liu MA, Olszewski AJ, Bantis LE, Panagiotou OA, et al. Predictors and Drivers of End-of-Life Medicare Spending Among Older Adults with Solid Tumors: A Population-Based Study. Cancers. 2025; 17(6):1016. https://doi.org/10.3390/cancers17061016
Chicago/Turabian StyleBaird, Courtney E., Elizabeth Wulff-Burchfield, Pamela C. Egan, Lee A. Hugar, Ami Vyas, Nikolaos A. Trikalinos, Michael A. Liu, Adam J. Olszewski, Leonidas E. Bantis, Orestis A. Panagiotou, and et al. 2025. "Predictors and Drivers of End-of-Life Medicare Spending Among Older Adults with Solid Tumors: A Population-Based Study" Cancers 17, no. 6: 1016. https://doi.org/10.3390/cancers17061016
APA StyleBaird, C. E., Wulff-Burchfield, E., Egan, P. C., Hugar, L. A., Vyas, A., Trikalinos, N. A., Liu, M. A., Olszewski, A. J., Bantis, L. E., Panagiotou, O. A., & Bélanger, E. (2025). Predictors and Drivers of End-of-Life Medicare Spending Among Older Adults with Solid Tumors: A Population-Based Study. Cancers, 17(6), 1016. https://doi.org/10.3390/cancers17061016