
IBCar: Potent Orally Bioavailable Methyl N-[5-(3′-Iodobenzoyl)-1H-Benzimidazol-2-yl]Carbamate for Breast Cancer Therapy


Simple Summary
Abstract
1. Introduction
2. Materials and Methods
2.1. Cell Lines
2.2. Chemicals, Reagents, and Antibodies
2.3. Computational Methods
2.4. Cell Proliferation, GI50 Determination, and Cytotoxicity Assays
2.5. Protein Extraction and Western Blotting
2.6. Effects of IBCar on the Integrity of Microtubules
2.7. Cell Cycle Analyses
2.8. Caspases Monitoring, Apoptosis, and Riptosome Analyses
2.8.1. Caspases and Apoptosis
2.8.2. Riptosome Evaluation
2.9. Evaluation of Endoplasmic Reticulum Stress and Mitochondrial Membrane Potential
2.9.1. Endoplasmic Reticulum Stress
2.9.2. Mitochondrial Membrane Potential
2.10. Mouse Tumor Models and Treatments
2.10.1. MMTV-PyMT Transgenic Breast Cancer Mouse Model
2.10.2. Human Xenograft Mouse Models
2.11. Statistical Analyses
3. Results
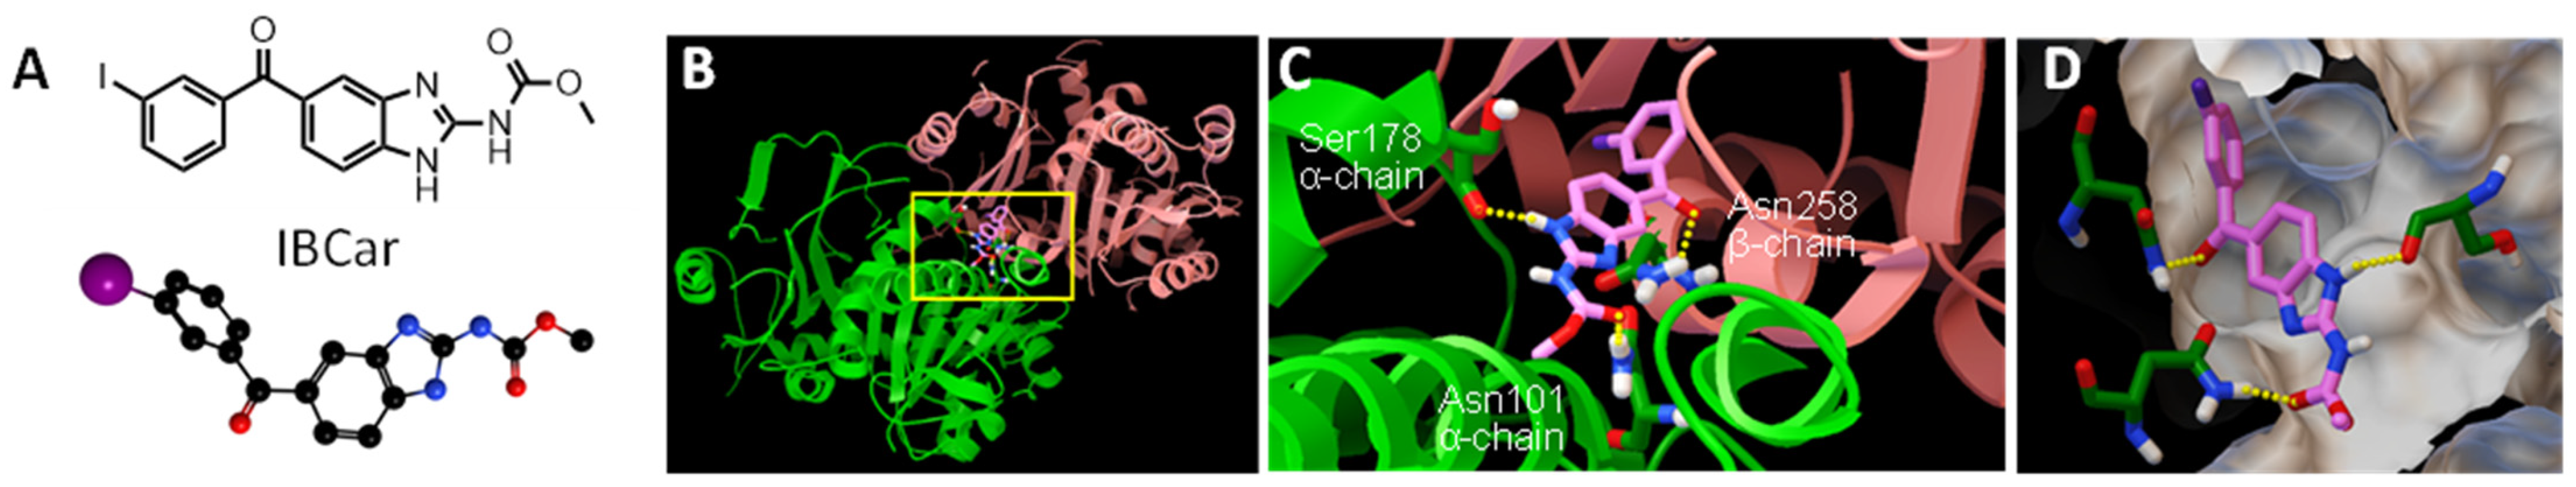
3.1. Molecular Docking Studies
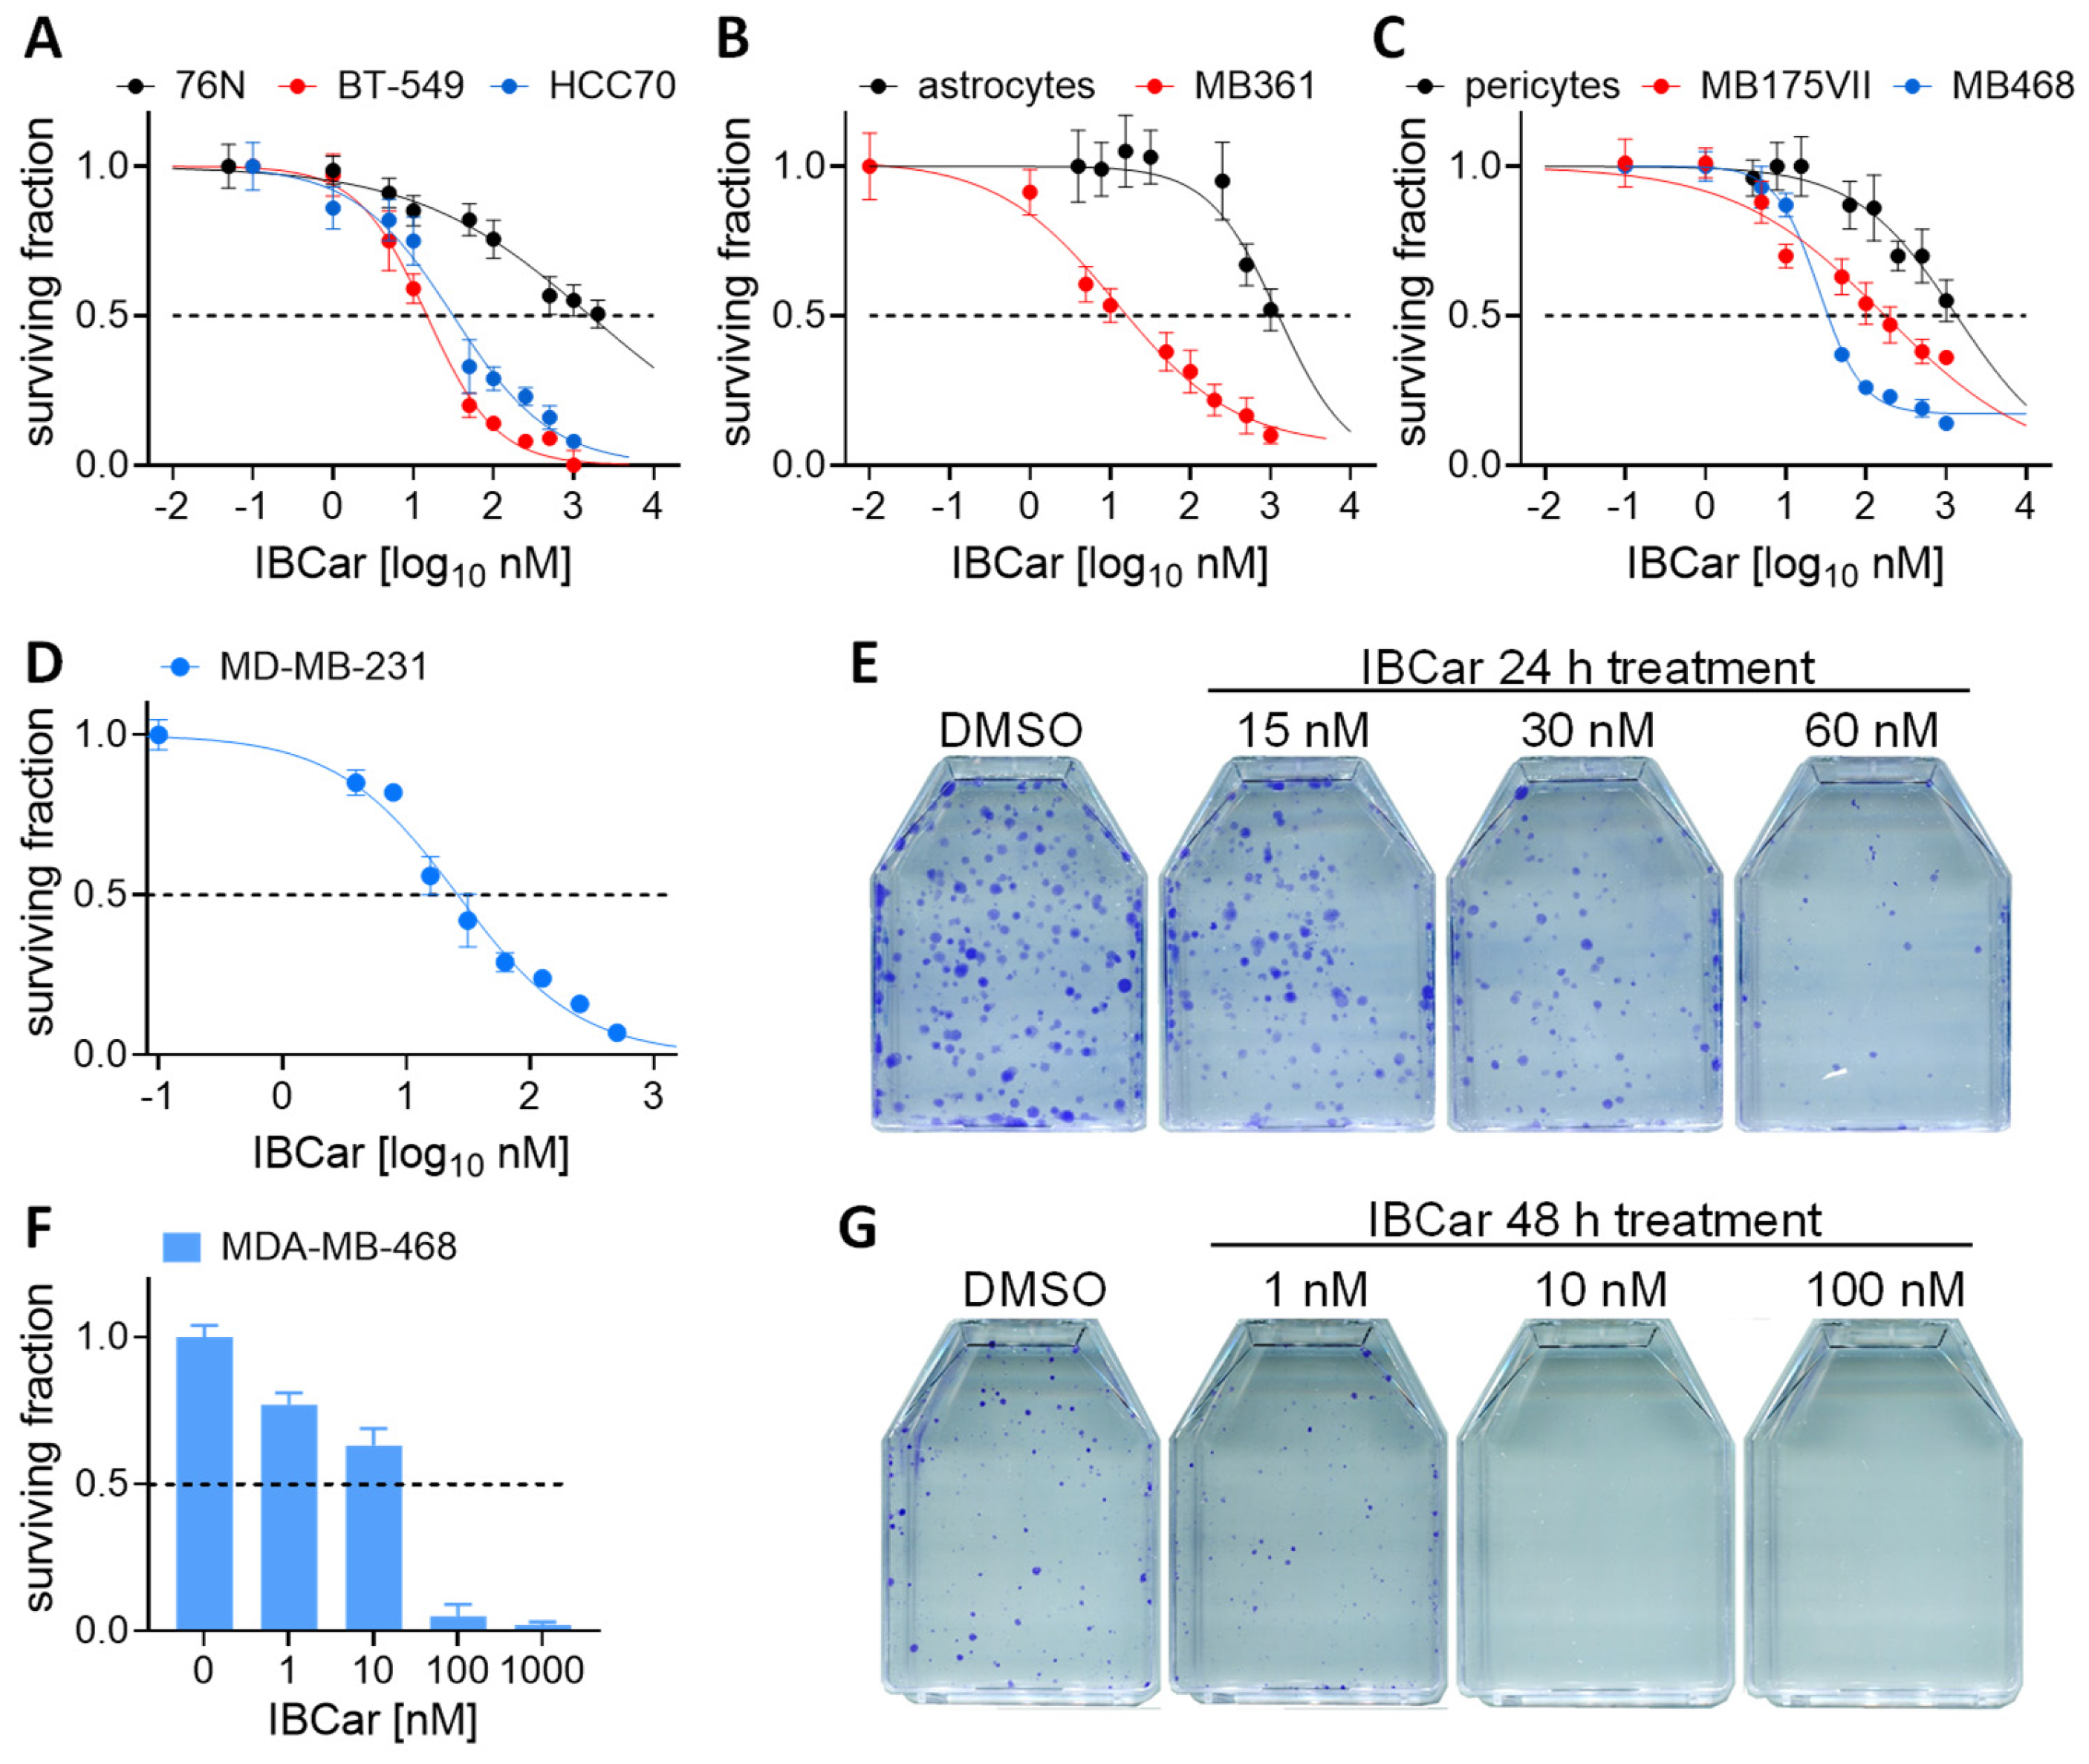
3.2. Selective Cytotoxic Effects of IBCar in Normal Versus Breast Cancer Cells
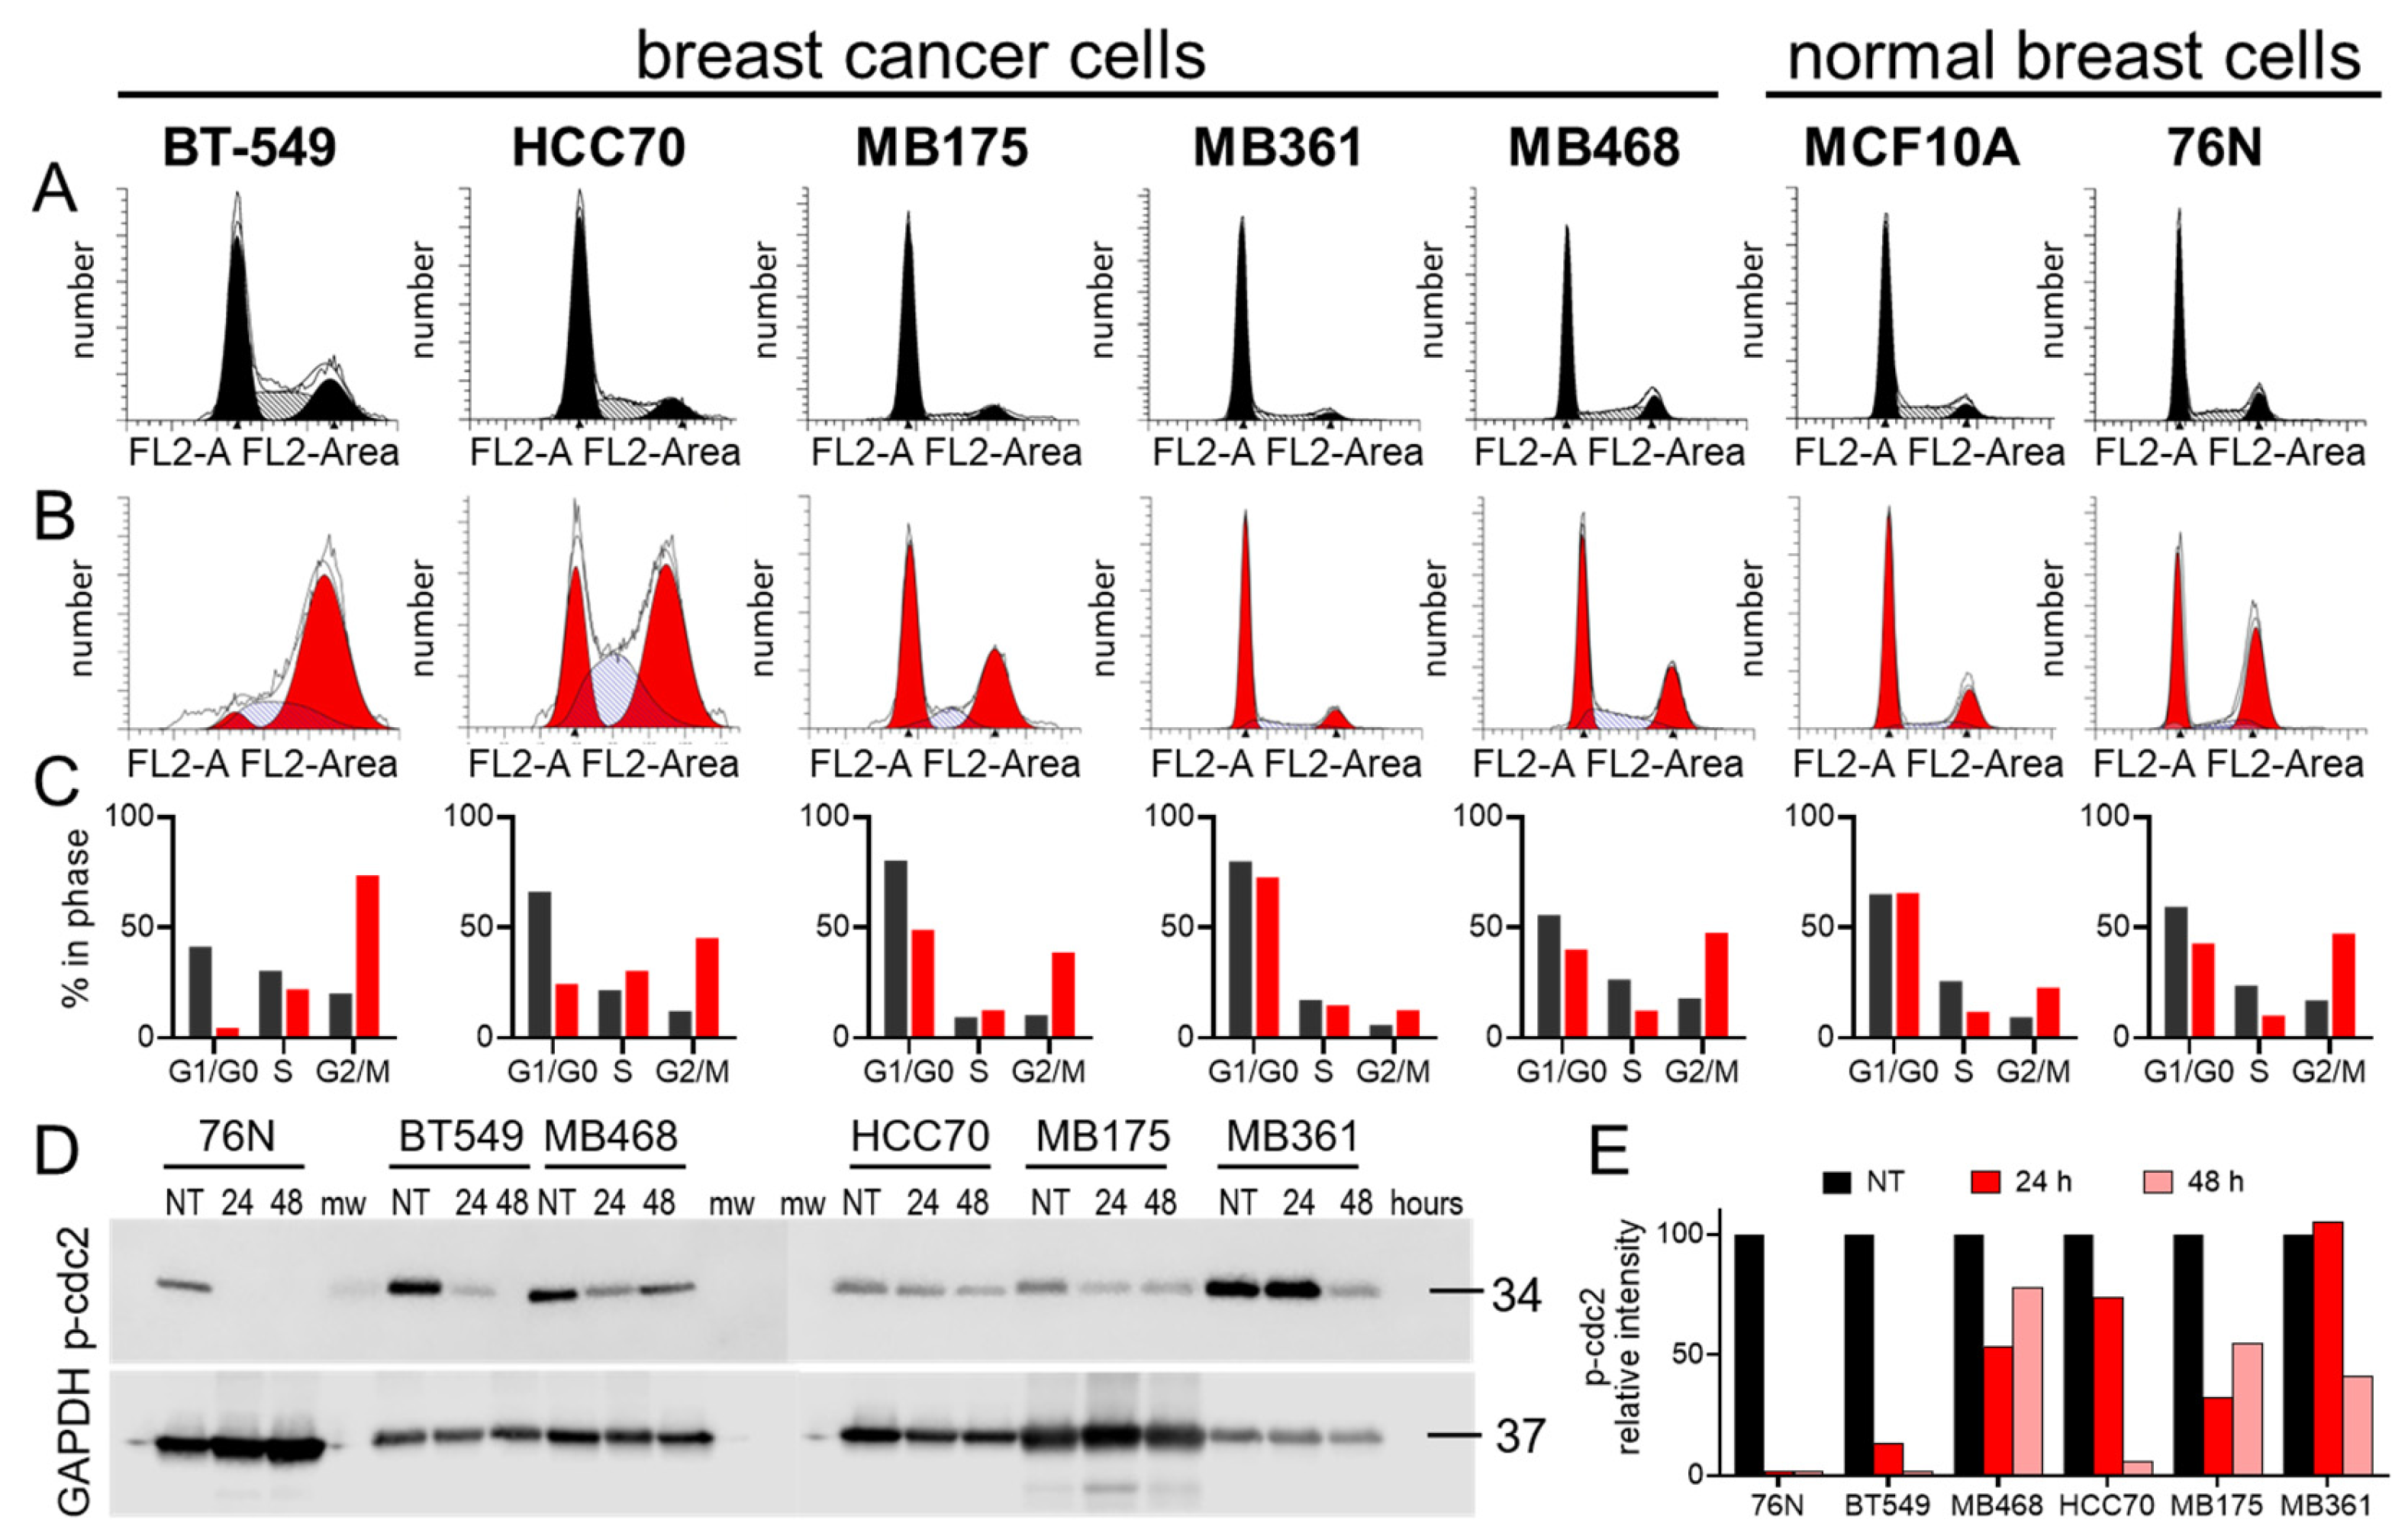
3.3. Cell Cycle Effect of IBCar
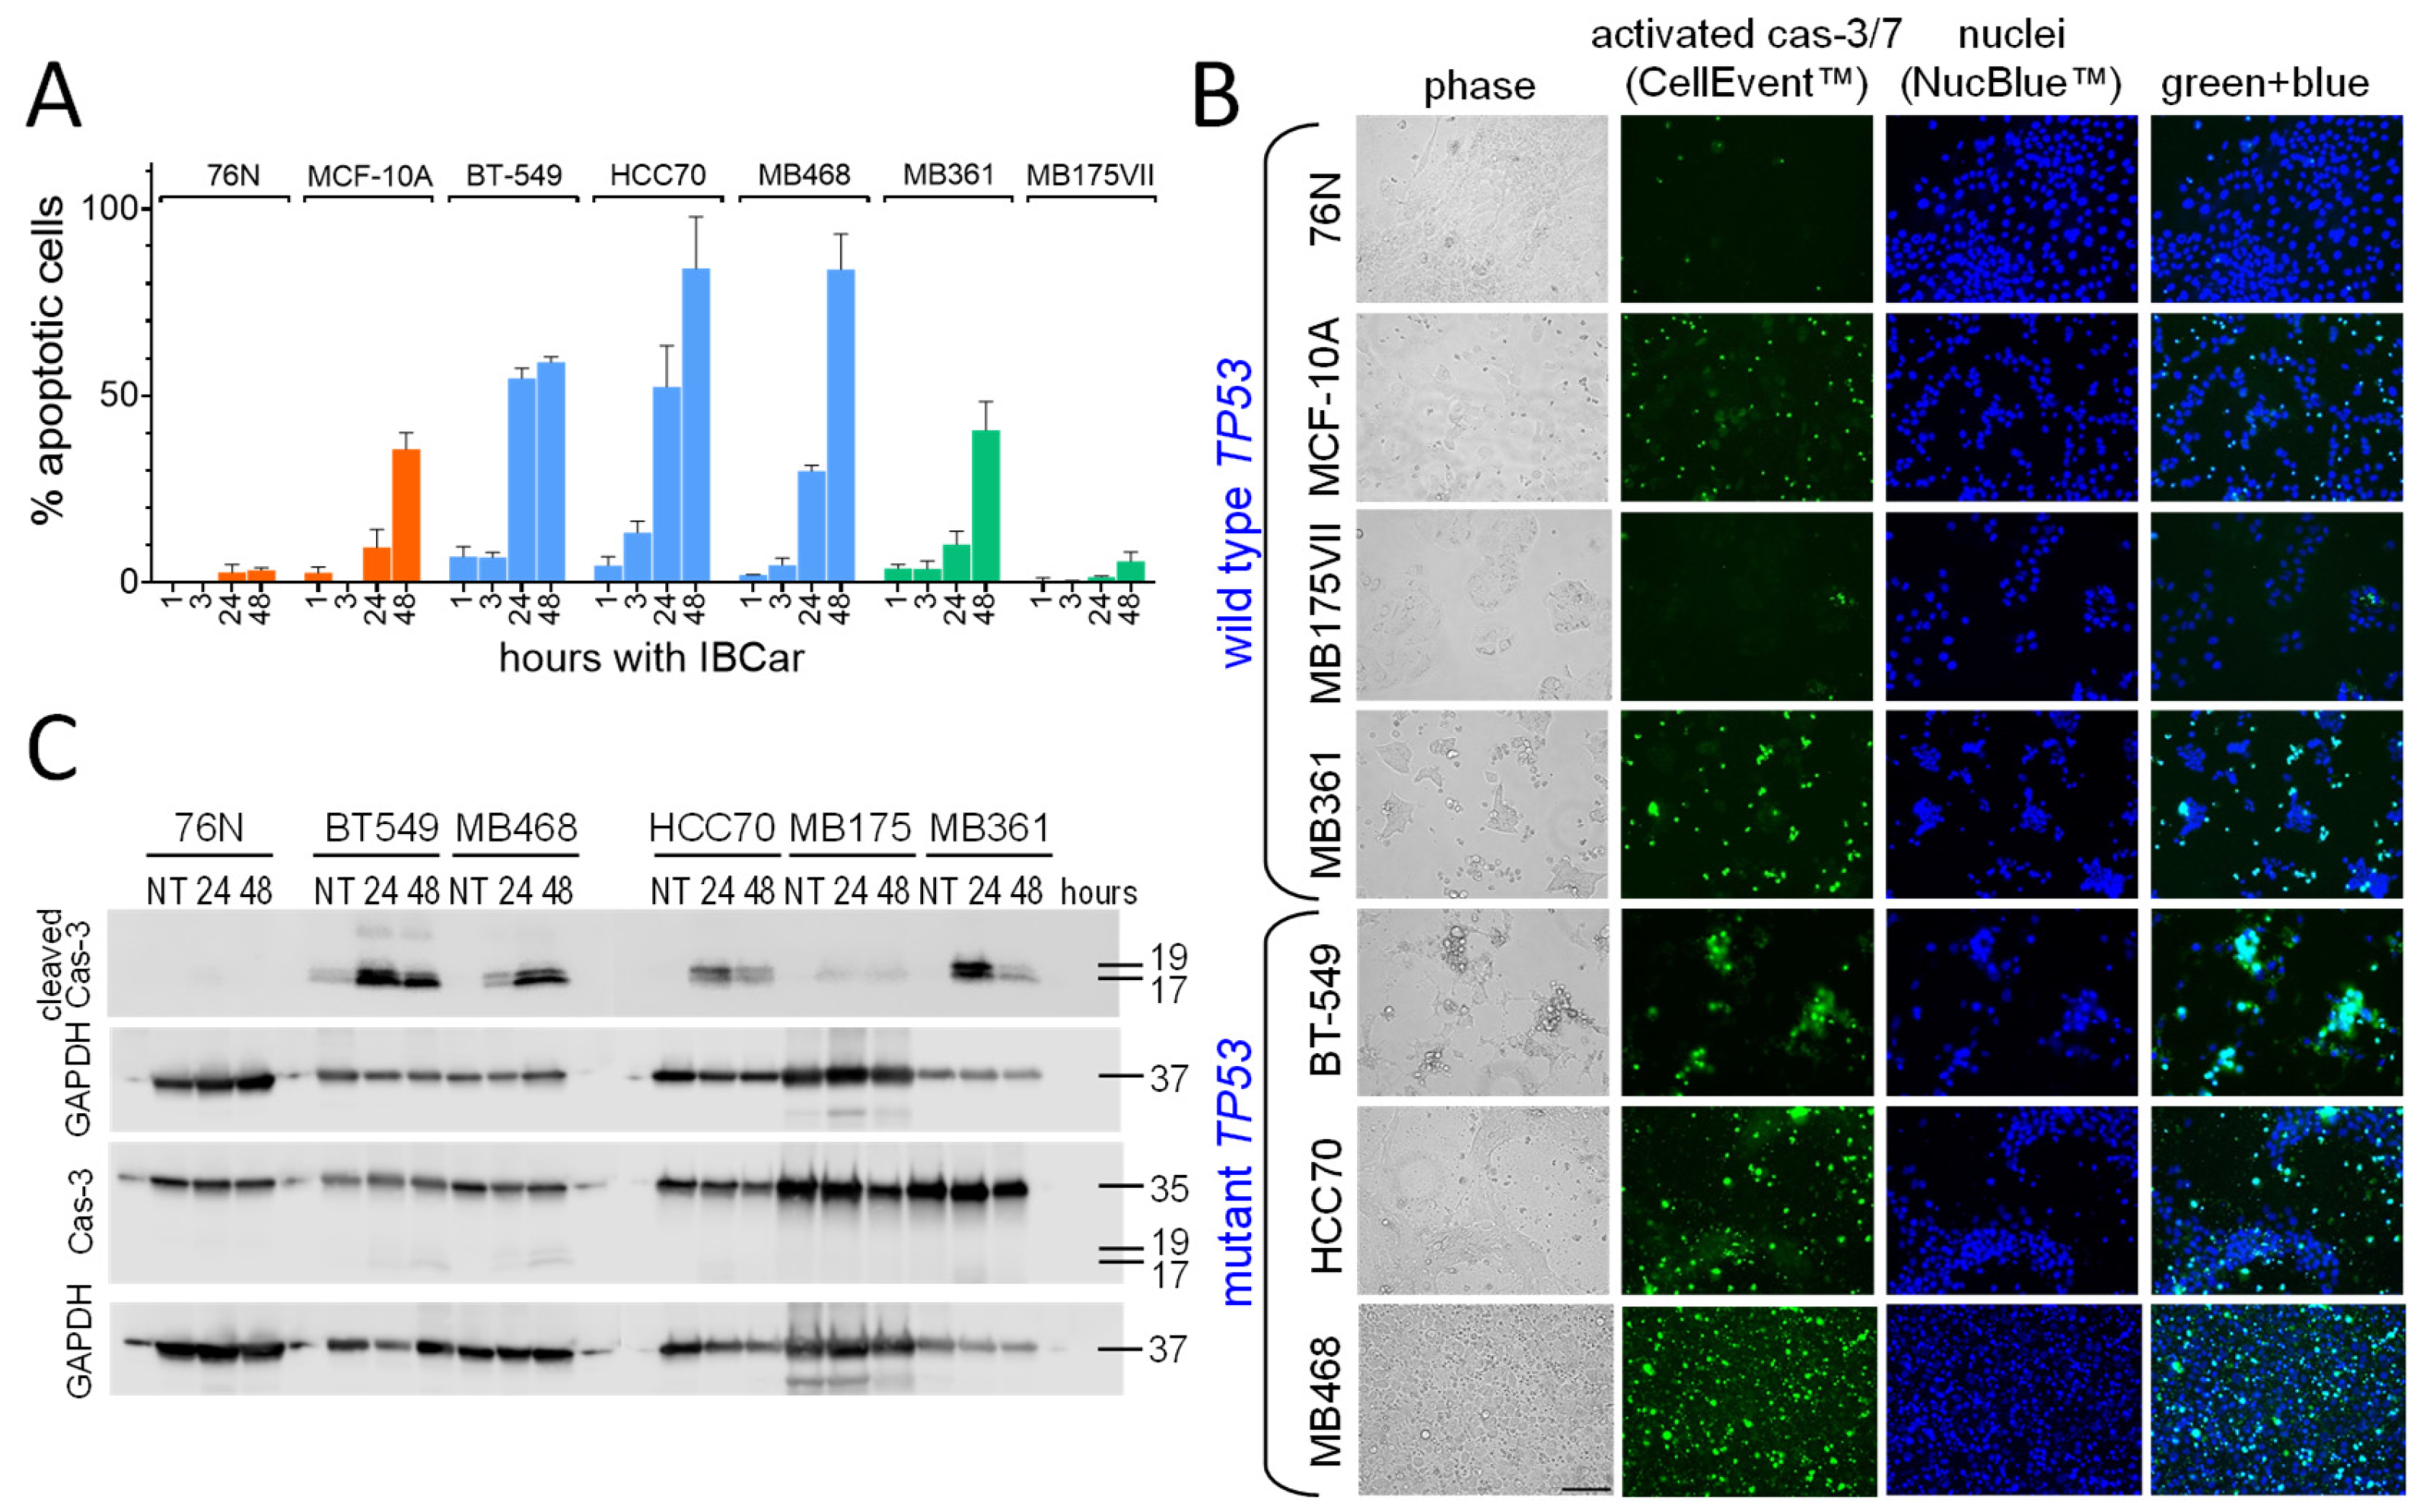
3.4. Cell Death Mechanisms
3.4.1. Caspase-3 and Caspase-7 Activation
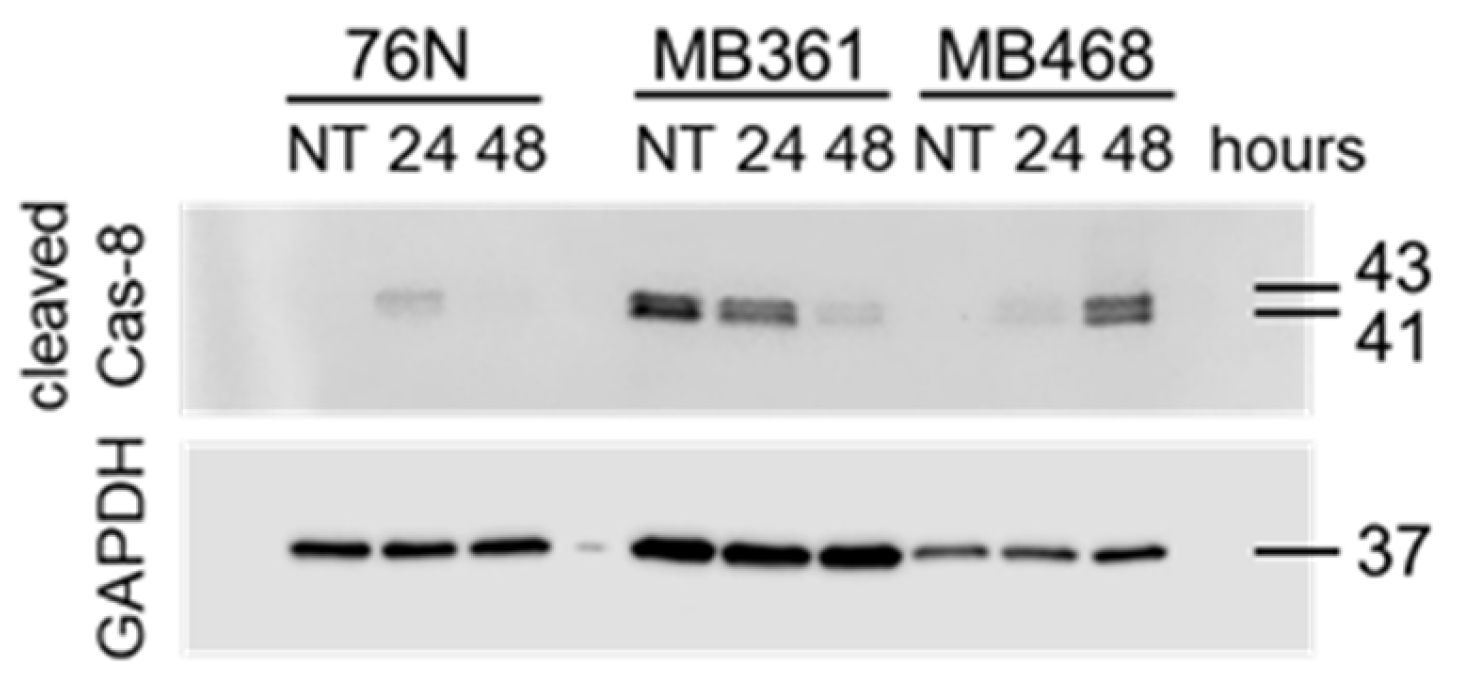
3.4.2. Caspase-8
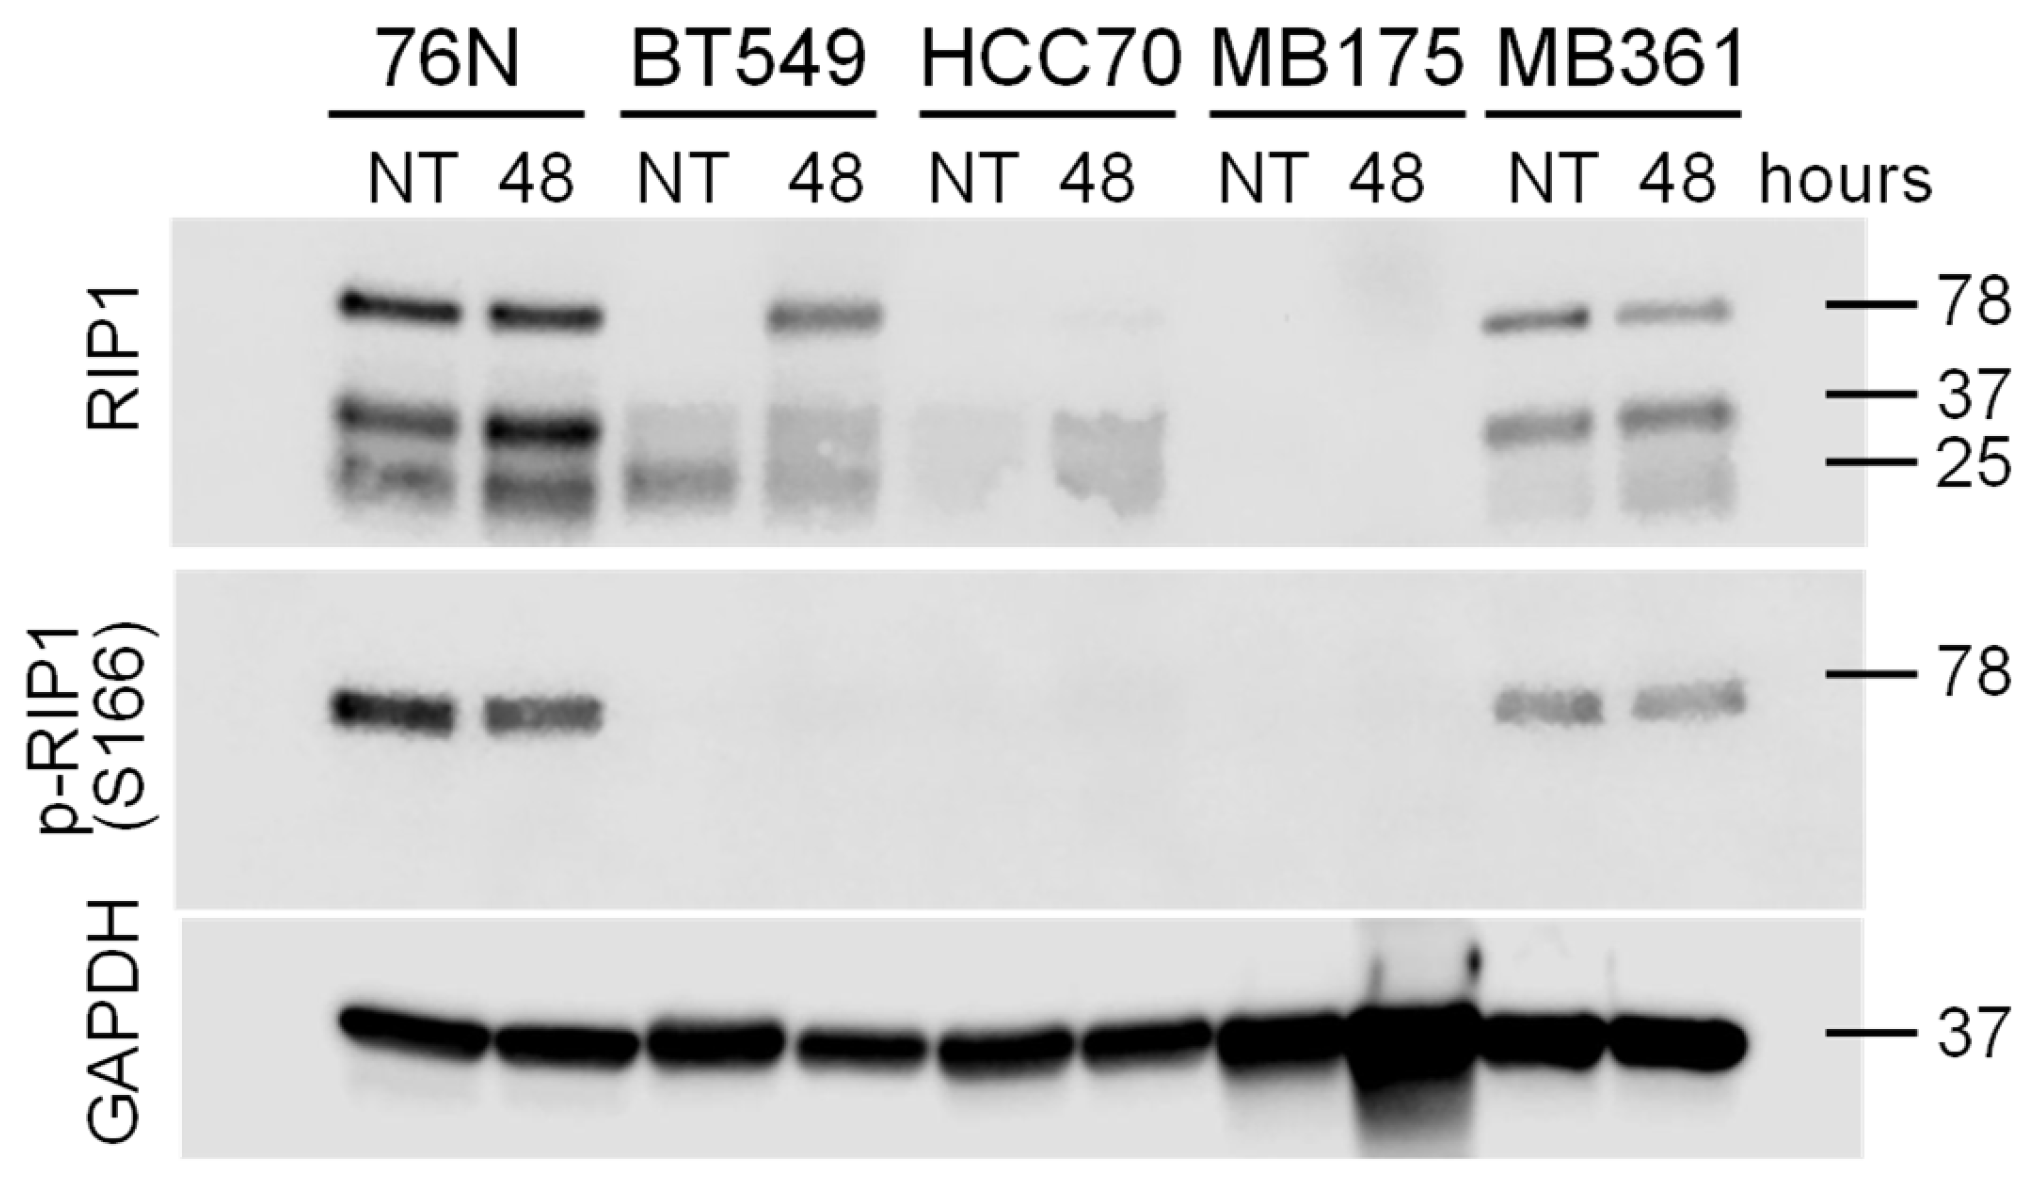
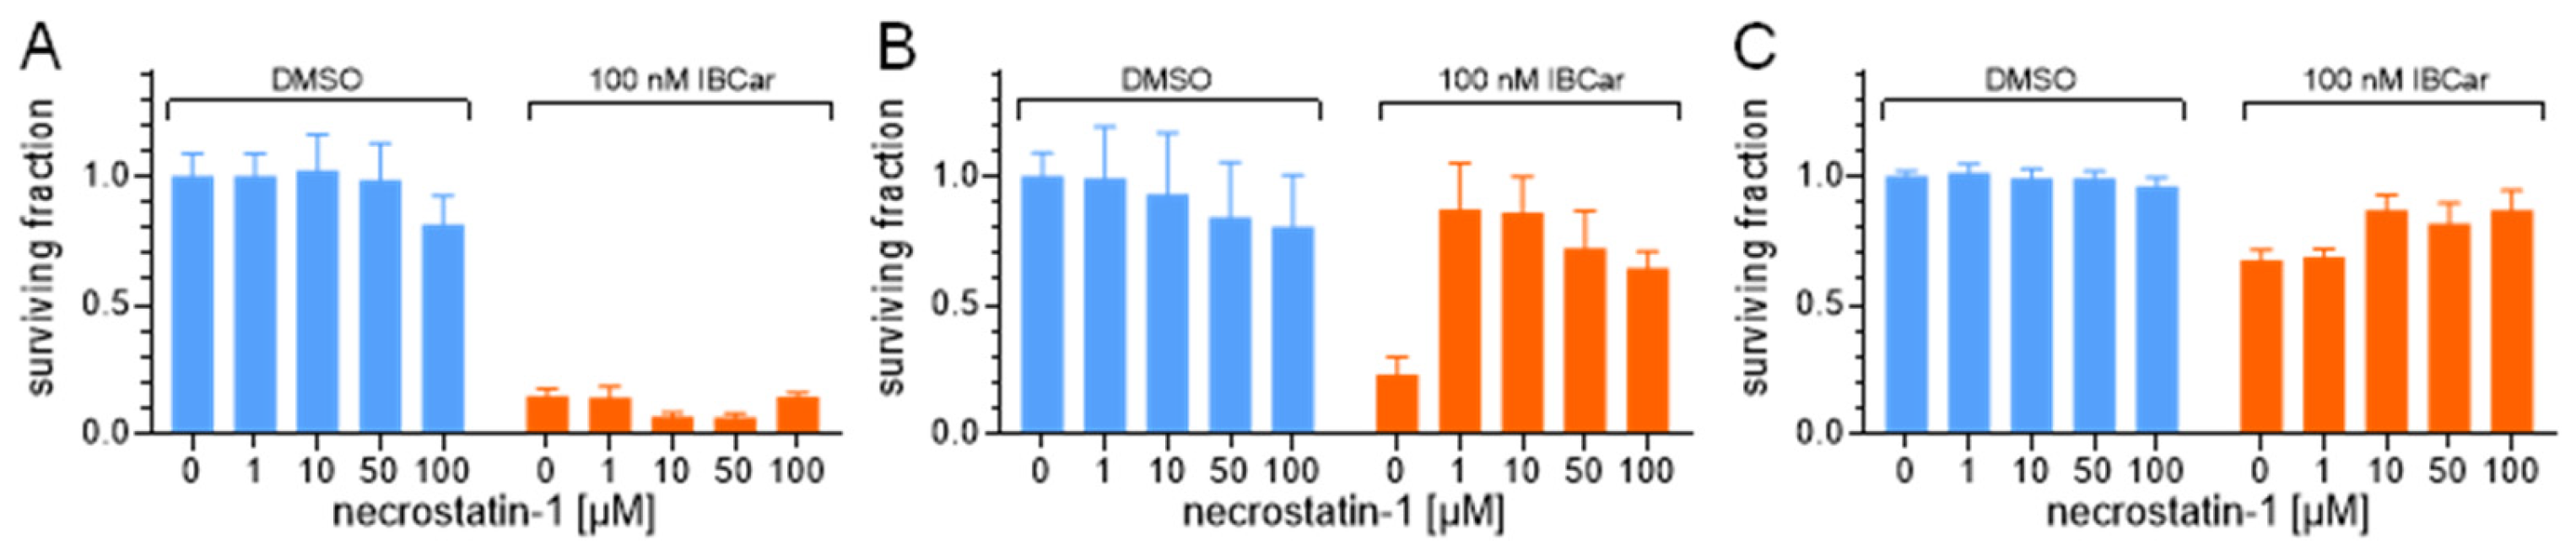
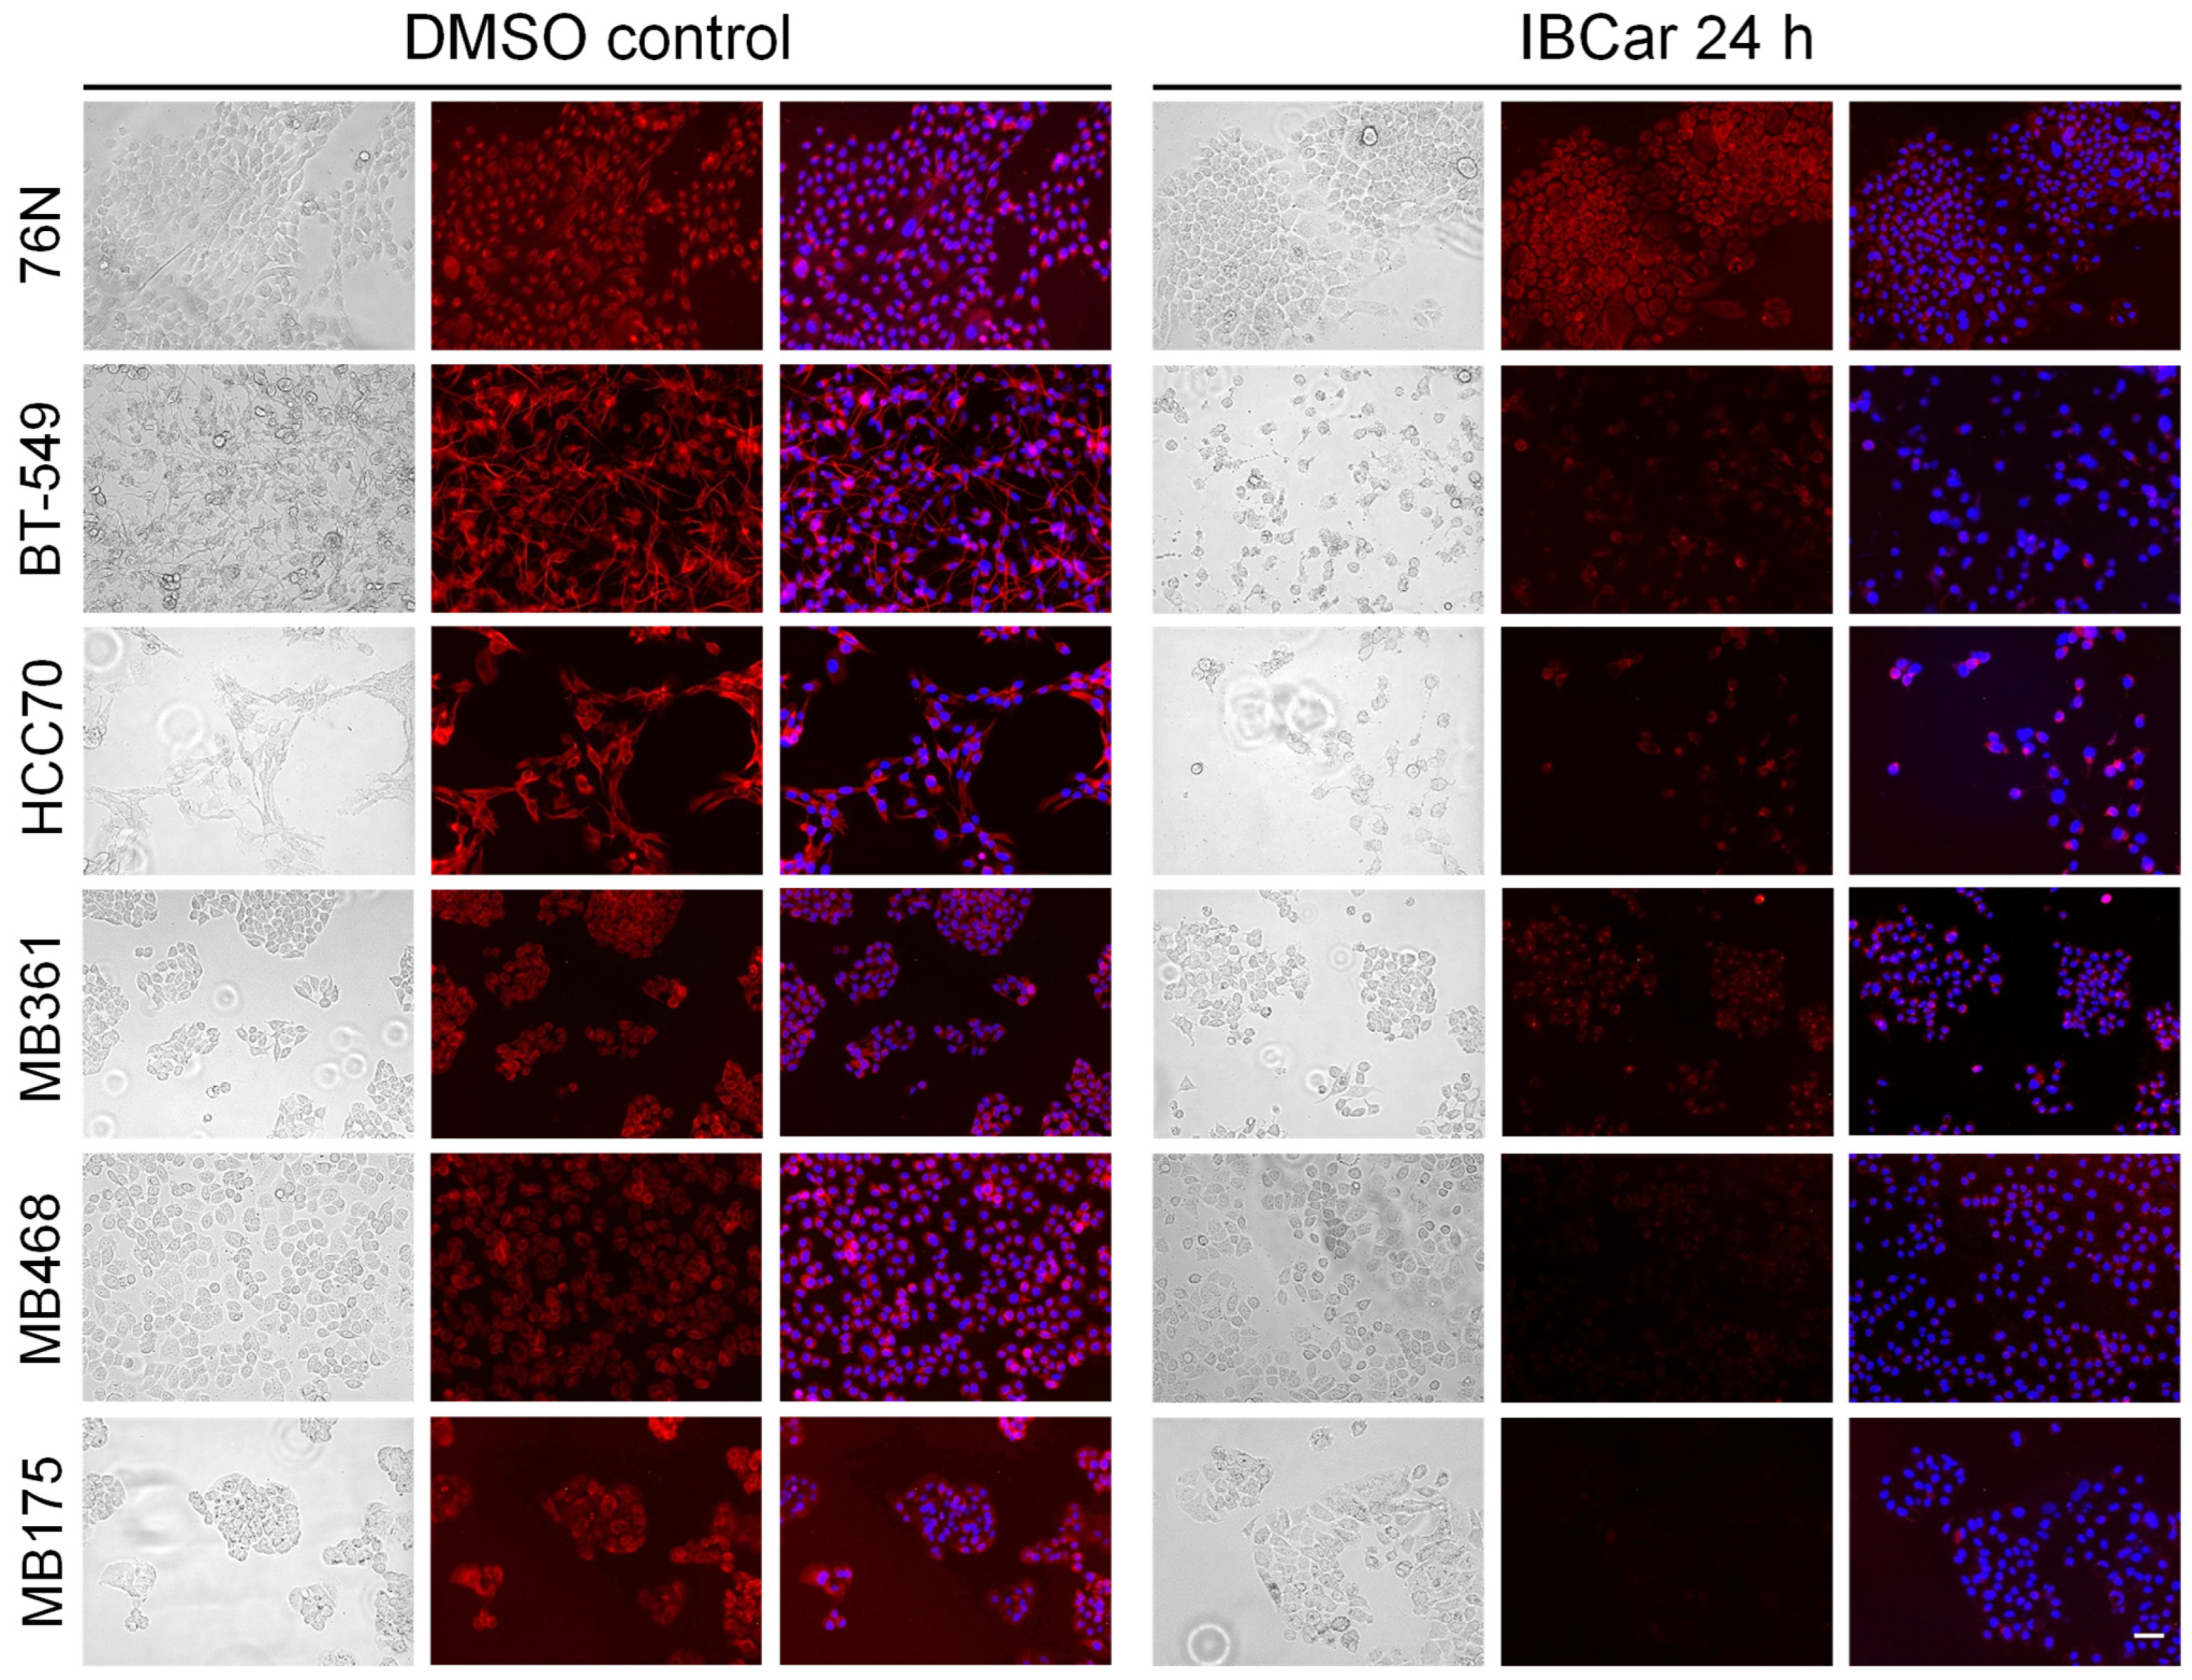
3.5. Riptosome
3.6. Microtubule Integrity
3.7. Endoplasmic Reticulum Stress and Mitochondrial Membrane Potential
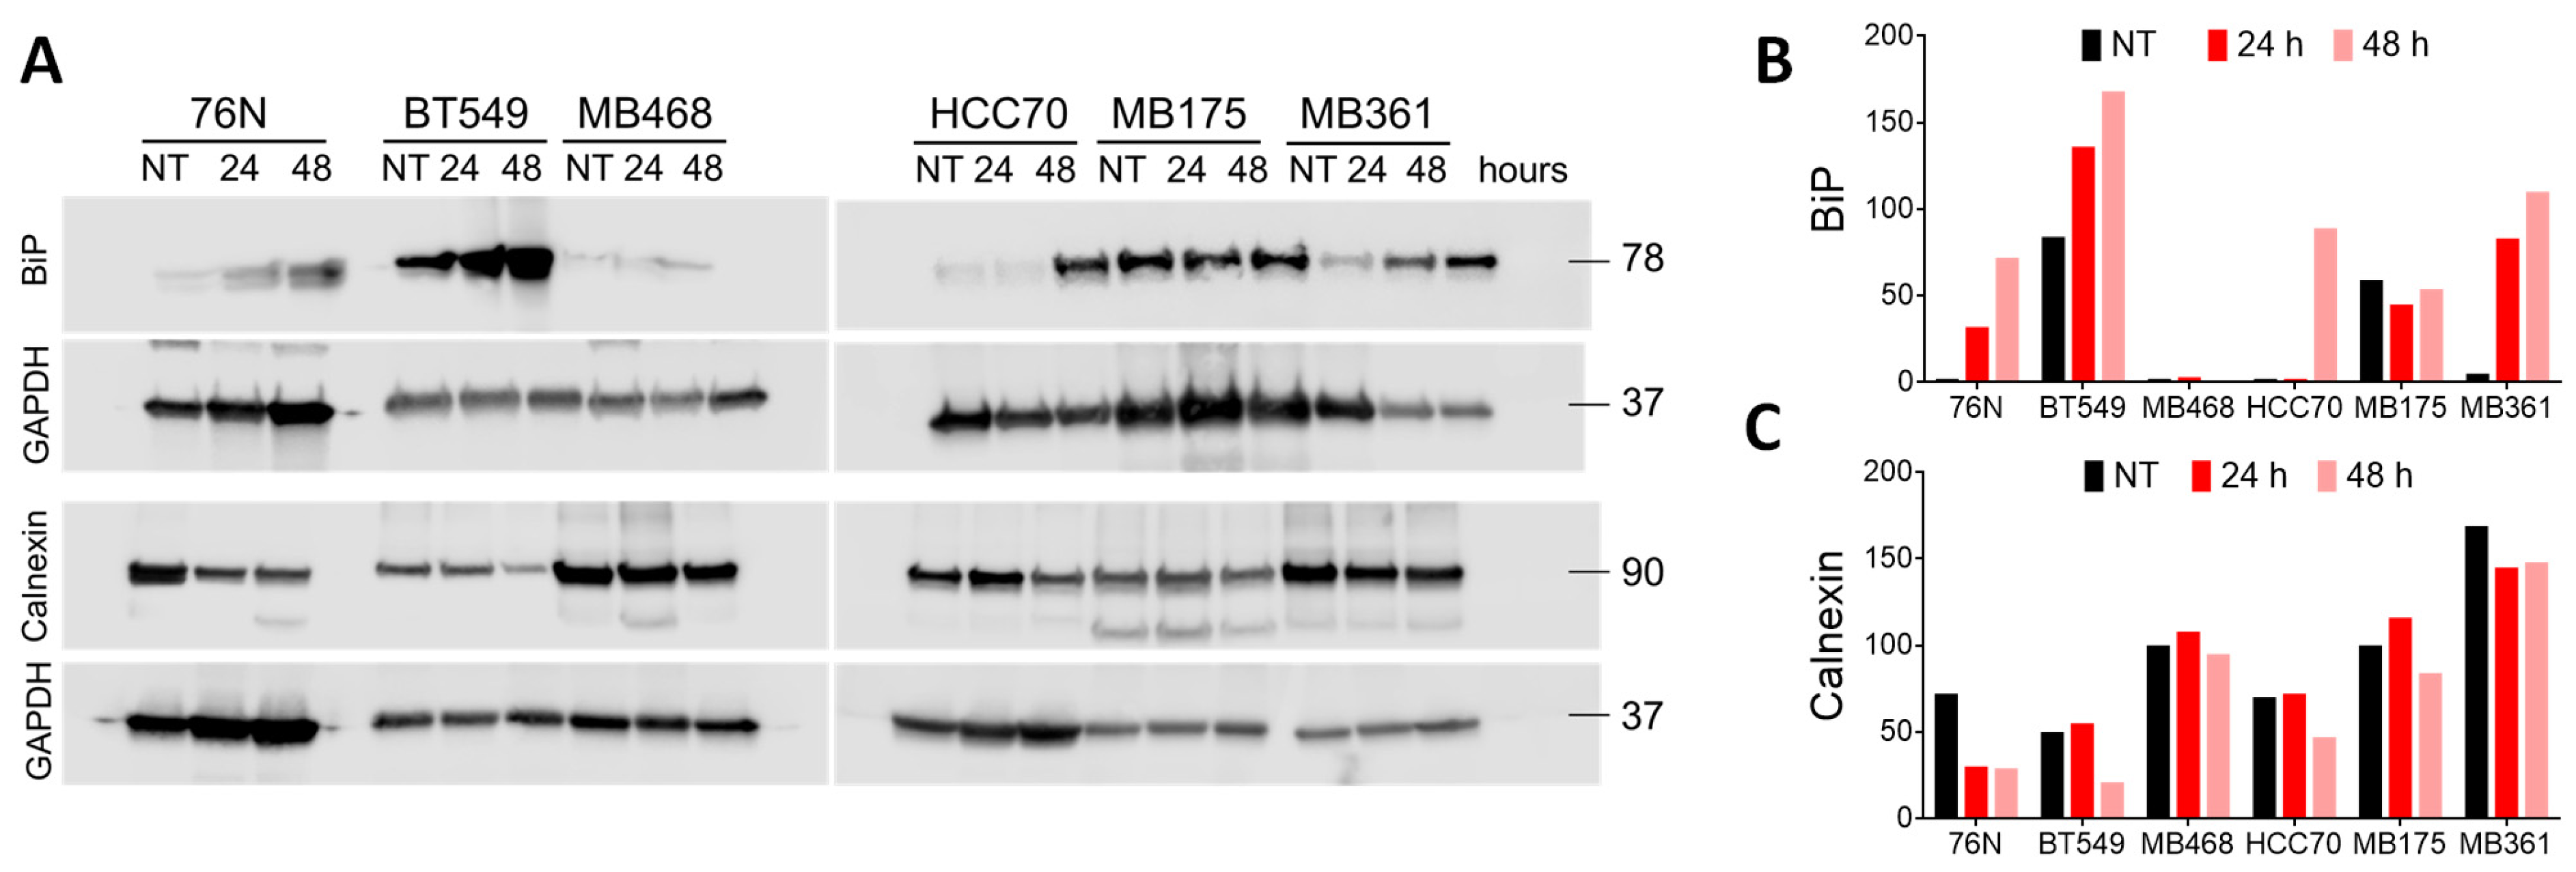
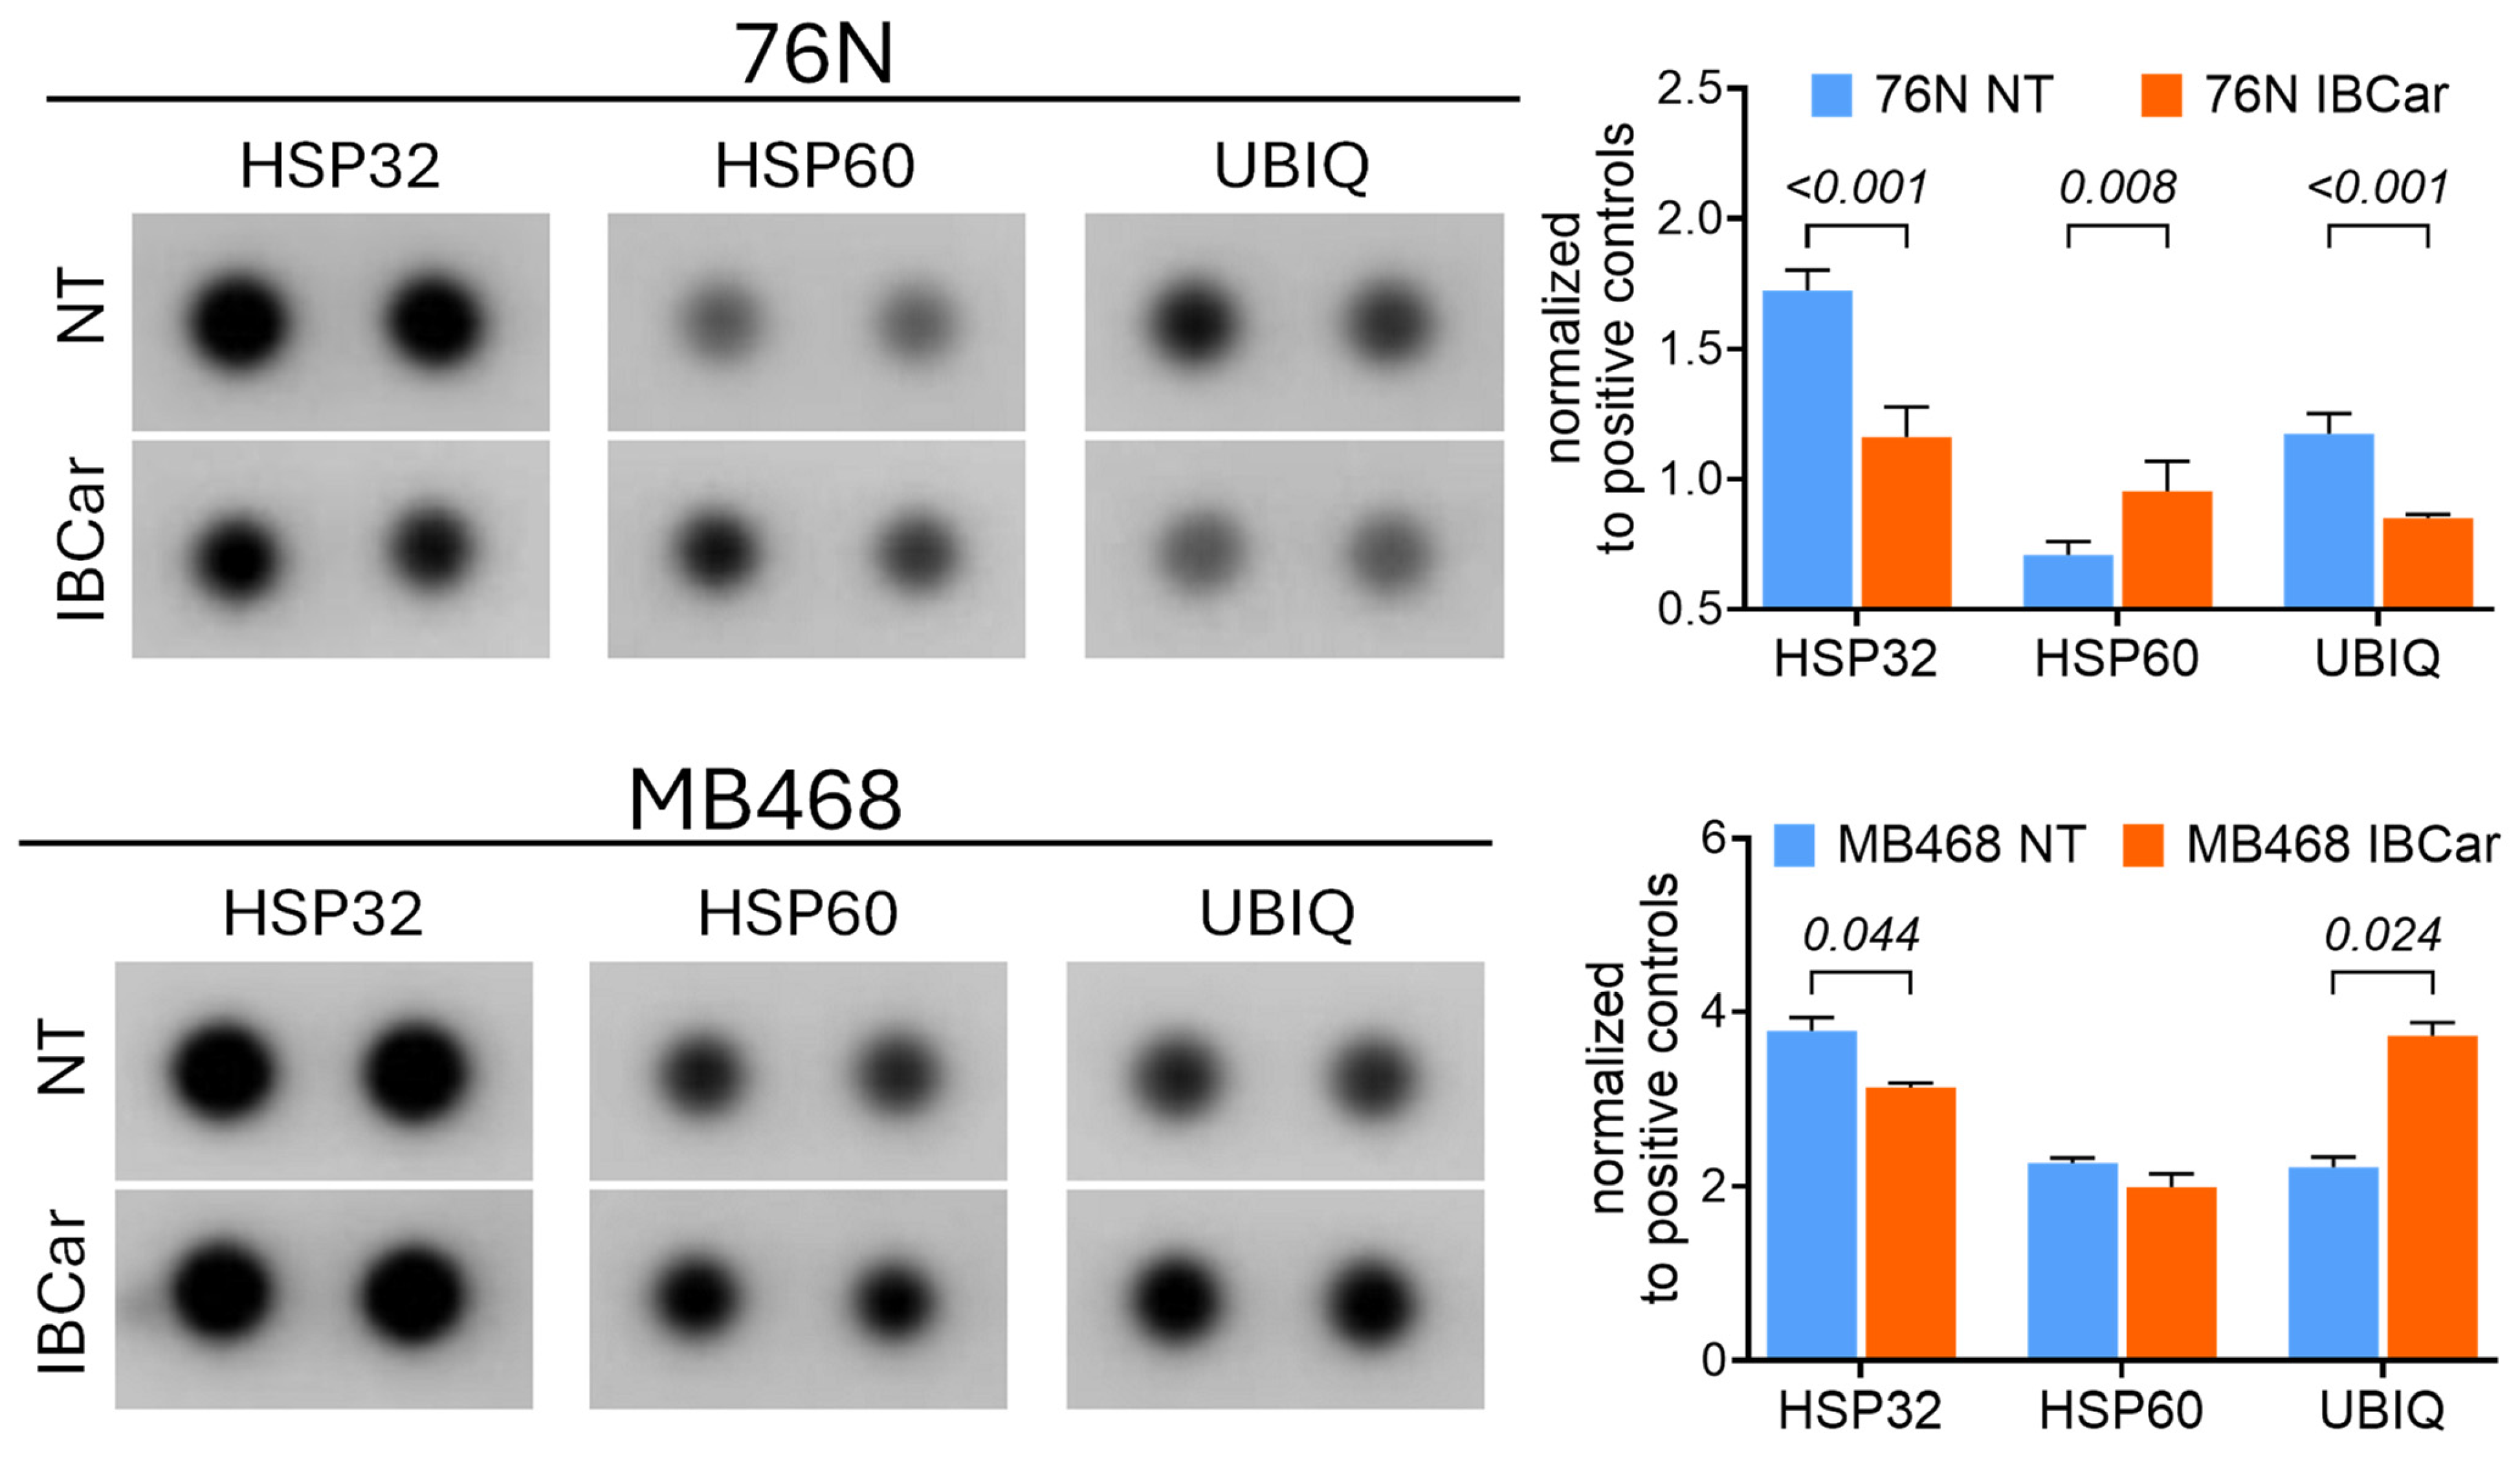
3.7.1. Endoplasmic Reticulum Stress Pathways Evaluation
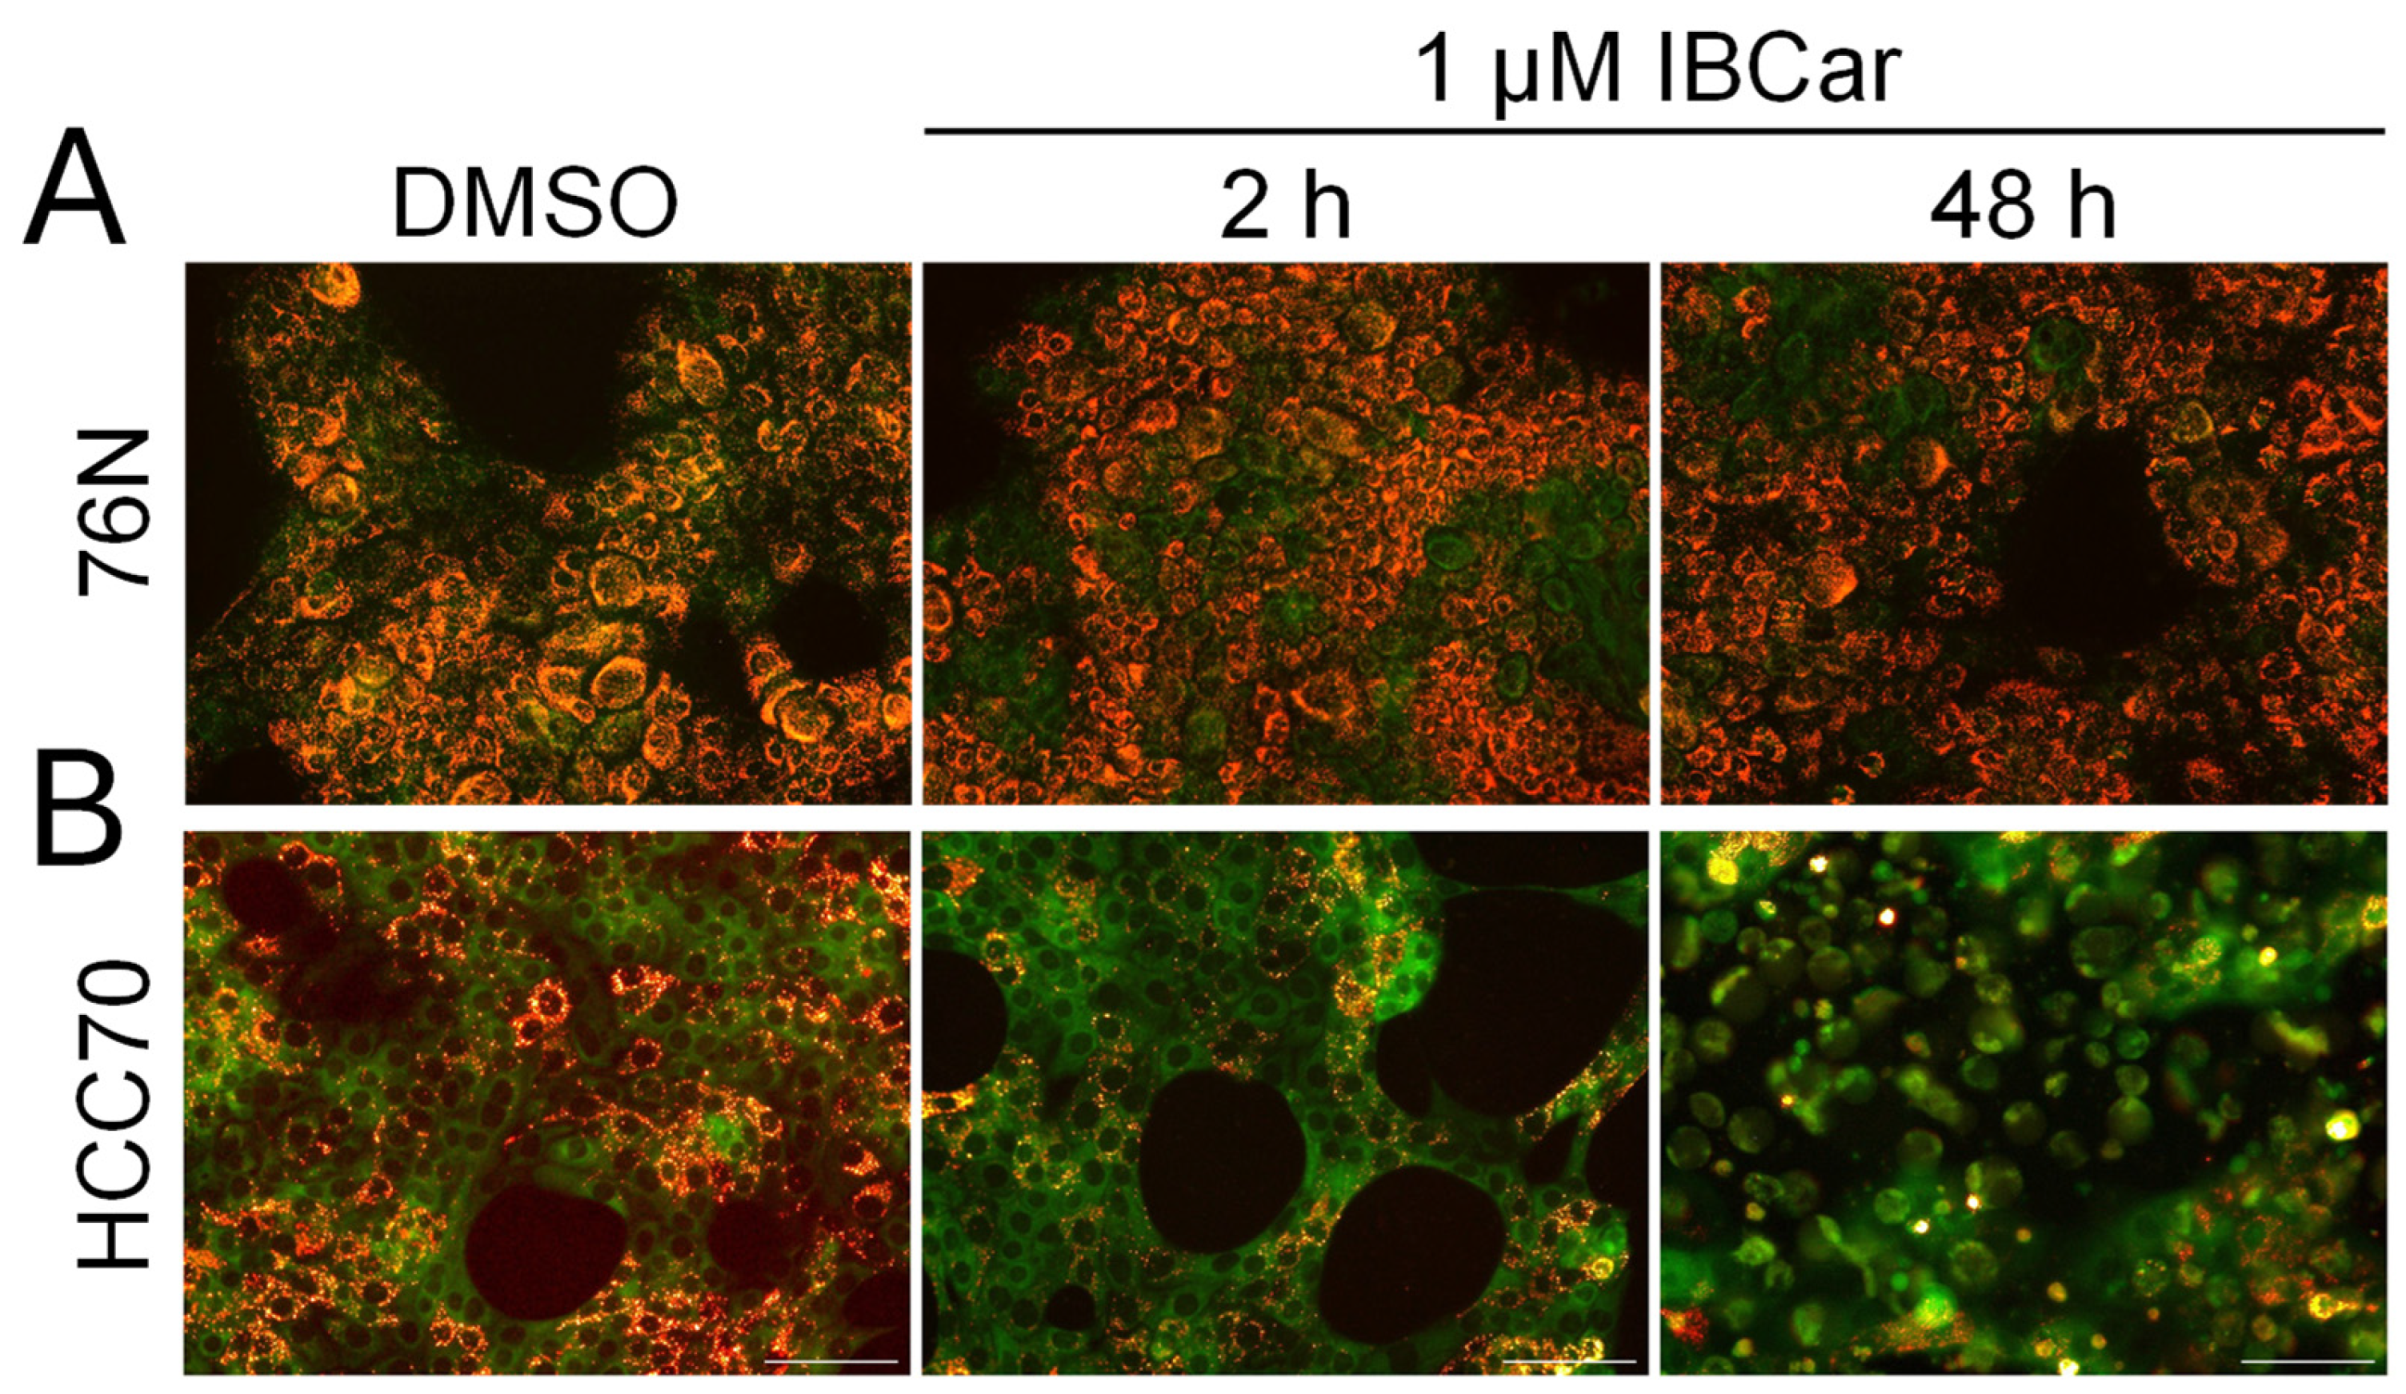
3.7.2. Mitochondrial Membrane Potential
3.8. Efficacy of IBCar in Mice Models of BC
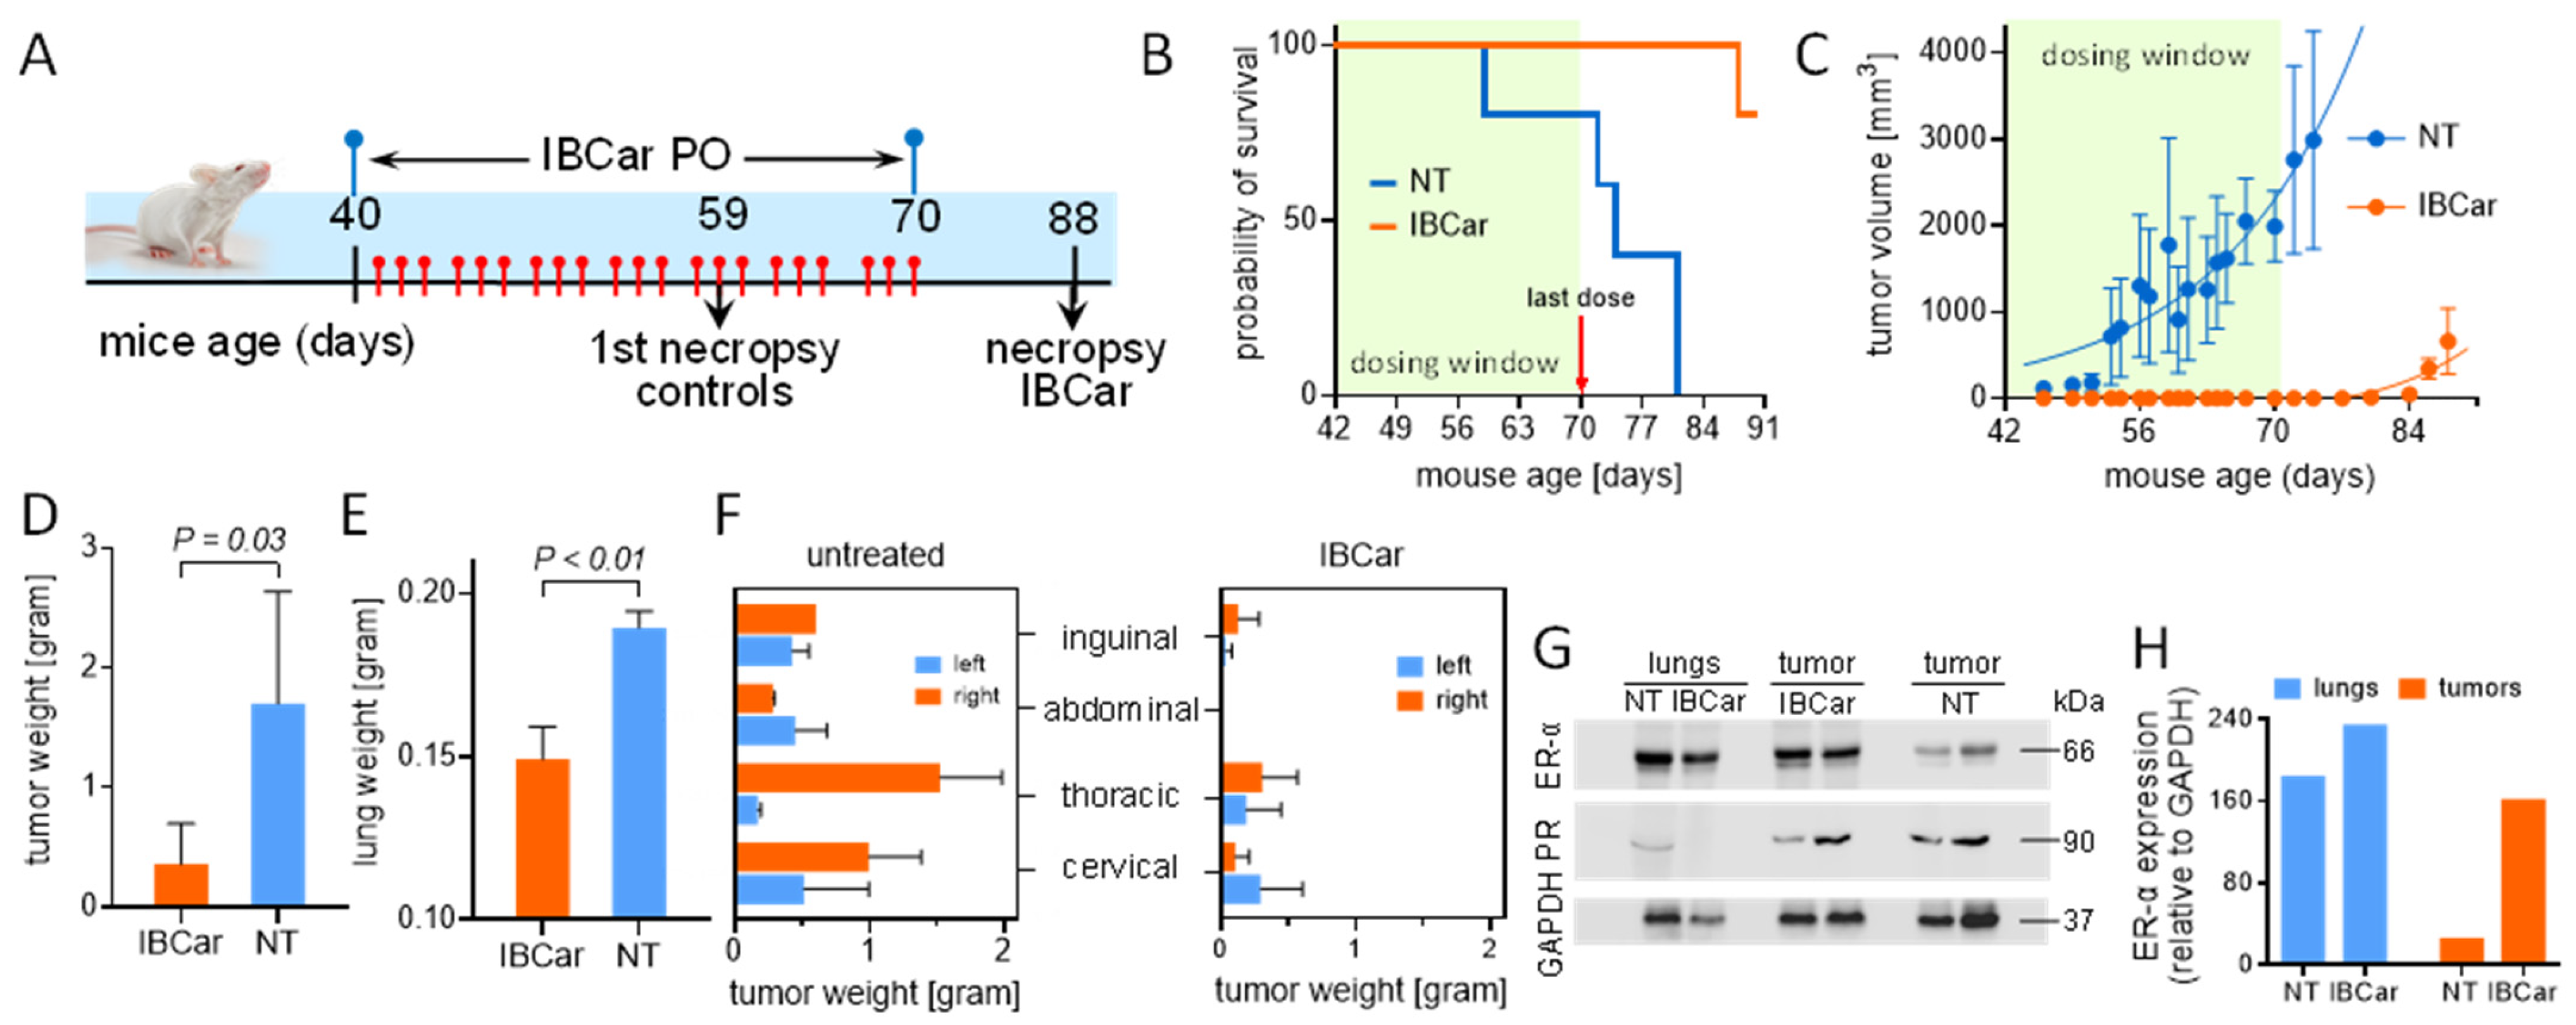
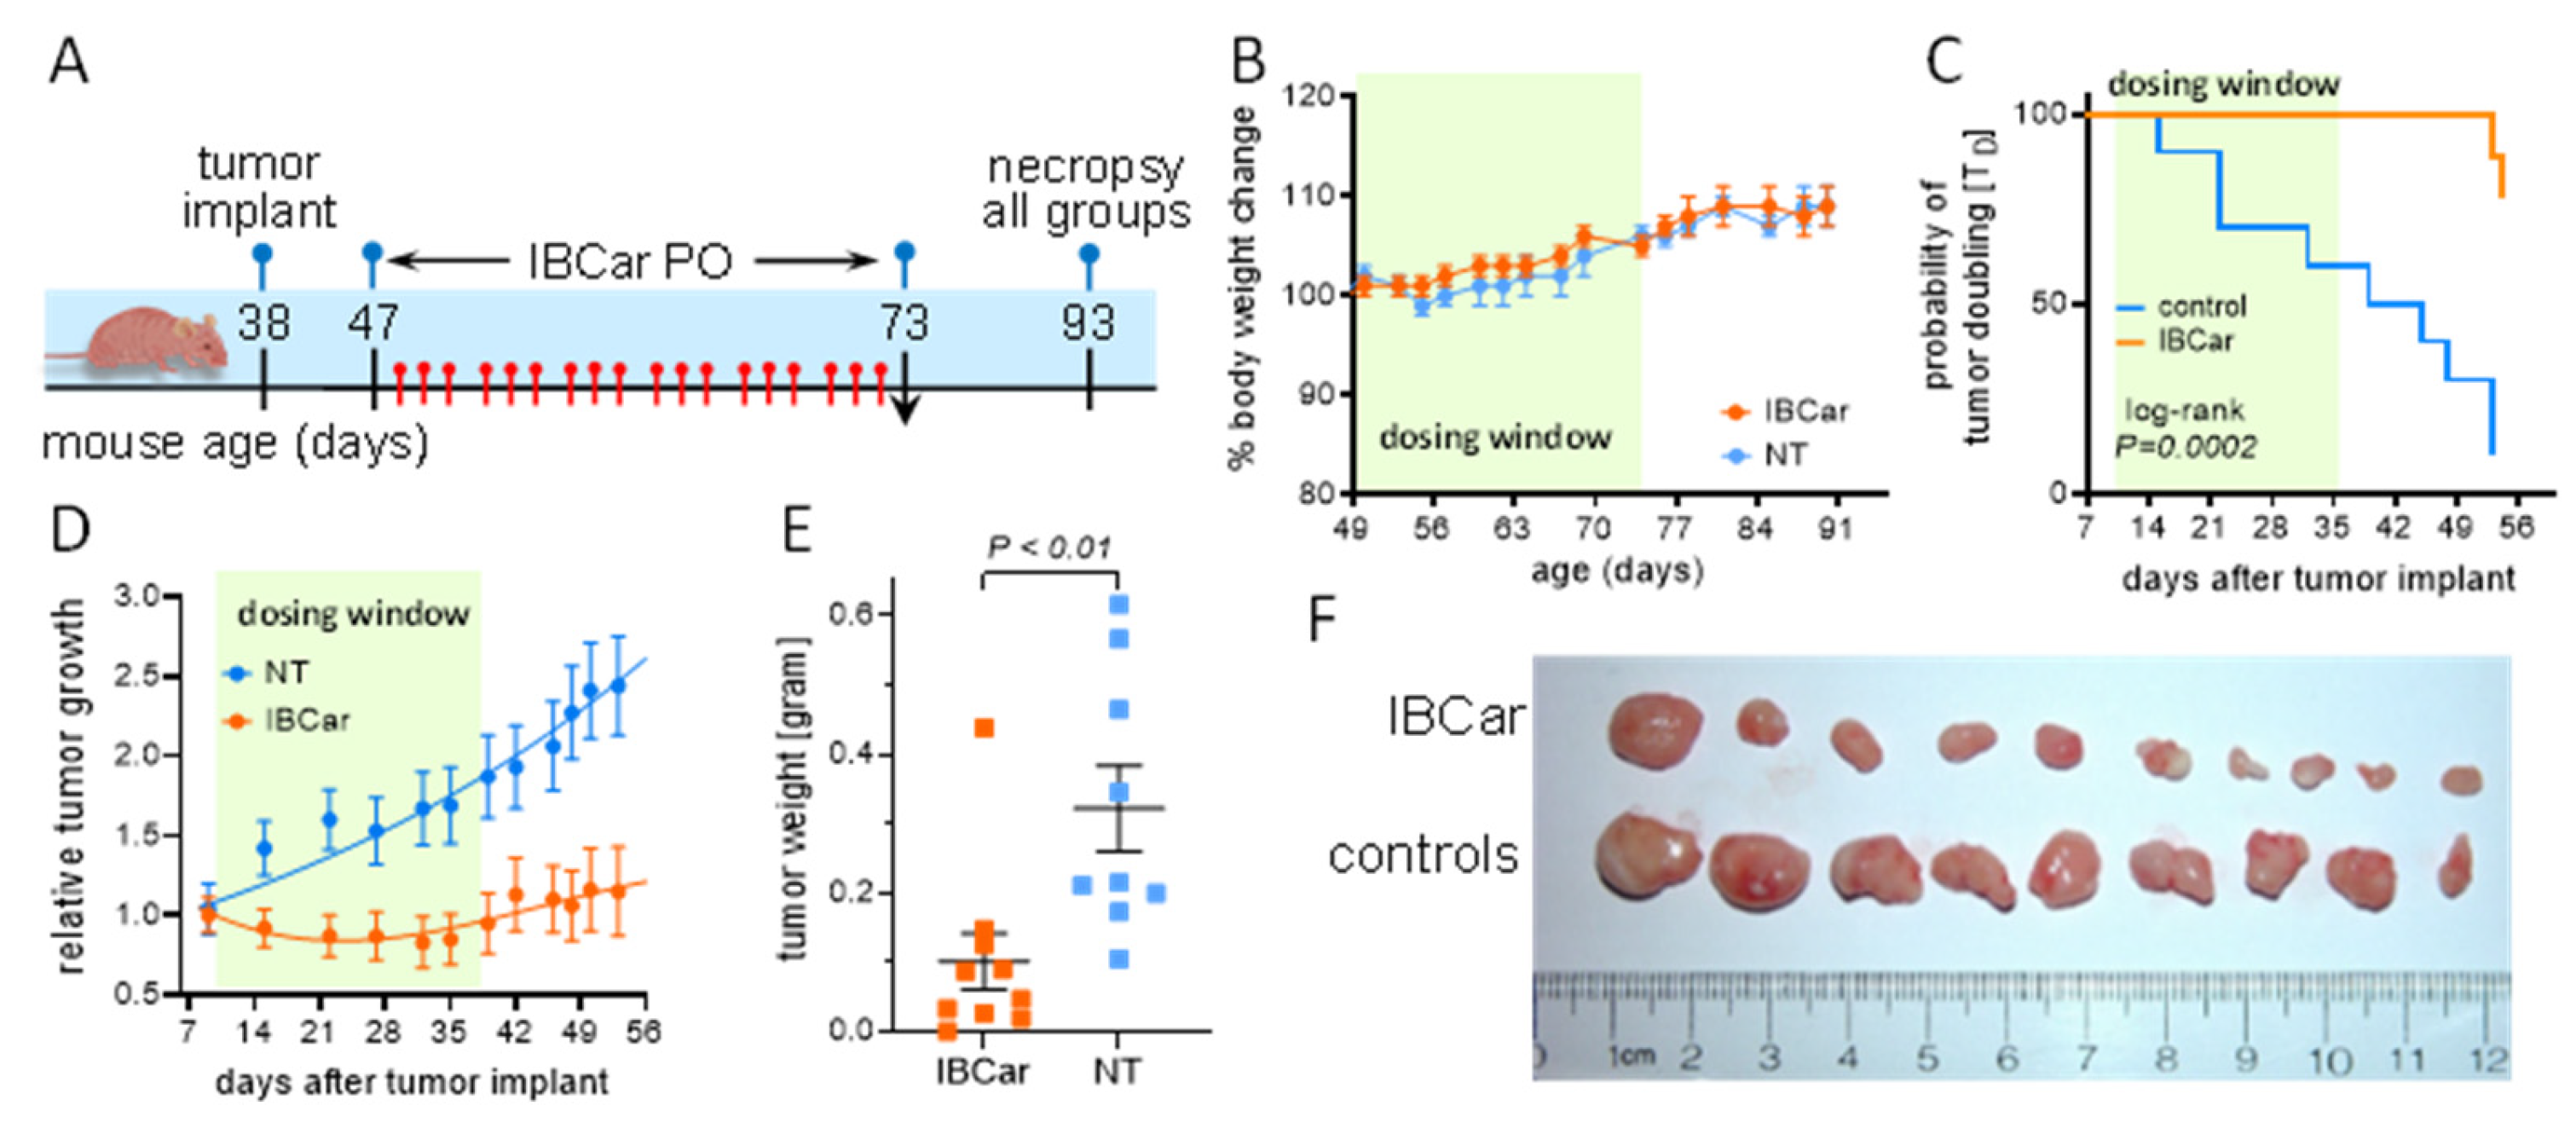
3.8.1. Transgenic Breast Cancer Model
3.8.2. Subcutaneous Breast Cancer Model MDA-MB-468
4. Discussion
5. Conclusions
Supplementary Materials
Author Contributions
Funding
Institutional Review Board Statement
Informed Consent Statement
Data Availability Statement
Acknowledgments
Conflicts of Interest
References
- American Cancer Society. Cancer Facts & Figures 2025. 2025. Available online: https://www.cancer.org/research/cancer-facts-statistics/all-cancer-facts-figures/2025-cancer-facts-figures.html (accessed on 4 January 2025).
- Sung, H.; Ferlay, J.; Siegel, R.L.; Laversanne, M.; Soerjomataram, I.; Jemal, A.; Bray, F. Global cancer statistics 2020: Globocan estimates of incidence and mortality worldwide for 36 cancers in 185 countries. CA Cancer J. Clin. 2021, 71, 209–249. [Google Scholar] [CrossRef]
- Arnold, M.; Morgan, E.; Rumgay, H.; Mafra, A.; Singh, D.; Laversanne, M.; Vignat, J.; Gralow, J.R.; Cardoso, F.; Siesling, S.; et al. Current and future burden of breast cancer: Global statistics for 2020 and 2040. Breast 2022, 66, 15–23. [Google Scholar] [CrossRef]
- Siegel, R.L.; Giaquinto, A.N.; Jemal, A. Cancer statistics, 2024. CA Cancer J. Clin. 2024, 74, 12–49. [Google Scholar] [CrossRef]
- Giaquinto, A.N.; Sung, H.; Miller, K.D.; Kramer, J.L.; Newman, L.A.; Minihan, A.; Jemal, A.; Siegel, R.L. Breast cancer statistics, 2022. CA Cancer J. Clin. 2022, 72, 524–541. [Google Scholar] [CrossRef] [PubMed]
- Hendrick, R.E.; Monticciolo, D.L. Surveillance, epidemiology, and end results data show increasing rates of distant-stage breast cancer at presentation in u.S. Women. Radiology 2024, 313, e241397. [Google Scholar] [CrossRef] [PubMed]
- The Breast Cancer Landscape. 2023. Available online: https://www.stopbreastcancer.org/wp-content/uploads/2025/02/BCRP-Program-Book_Feb24.pdf (accessed on 4 July 2025).
- Gobbini, E.; Ezzalfani, M.; Dieras, V.; Bachelot, T.; Brain, E.; Debled, M.; Jacot, W.; Mouret-Reynier, M.A.; Goncalves, A.; Dalenc, F.; et al. Time trends of overall survival among metastatic breast cancer patients in the real-life esme cohort. Eur. J. Cancer 2018, 96, 17–24. [Google Scholar] [CrossRef]
- Cortes, J.; O’Shaughnessy, J.; Loesch, D.; Blum, J.L.; Vahdat, L.T.; Petrakova, K.; Chollet, P.; Manikas, A.; Dieras, V.; Delozier, T.; et al. Eribulin monotherapy versus treatment of physician’s choice in patients with metastatic breast cancer (embrace): A phase 3 open-label randomised study. Lancet 2011, 377, 914–923. [Google Scholar] [CrossRef] [PubMed]
- Lin, N.U.; Murthy, R.K.; Abramson, V.; Anders, C.; Bachelot, T.; Bedard, P.L.; Borges, V.; Cameron, D.; Carey, L.A.; Chien, A.J.; et al. Tucatinib vs. placebo, both in combination with trastuzumab and capecitabine, for previously treated erbb2 (her2)-positive metastatic breast cancer in patients with brain metastases: Updated exploratory analysis of the her2climb randomized clinical trial. JAMA Oncol. 2023, 9, 197–205. [Google Scholar] [CrossRef]
- Lin, N.U.; Borges, V.; Anders, C.; Murthy, R.K.; Paplomata, E.; Hamilton, E.; Hurvitz, S.; Loi, S.; Okines, A.; Abramson, V.; et al. Intracranial efficacy and survival with tucatinib plus trastuzumab and capecitabine for previously treated her2-positive breast cancer with brain metastases in the her2climb trial. J. Clin. Oncol. 2020, 38, 2610–2619. [Google Scholar] [CrossRef]
- Buisseret, L.; Loirat, D.; Aftimos, P.; Maurer, C.; Punie, K.; Debien, V.; Kristanto, P.; Eiger, D.; Goncalves, A.; Ghiringhelli, F.; et al. Paclitaxel plus carboplatin and durvalumab with or without oleclumab for women with previously untreated locally advanced or metastatic triple-negative breast cancer: The randomized synergy phase i/ii trial. Nat. Commun. 2023, 14, 7018. [Google Scholar] [CrossRef]
- Mougalian, S.S.; Kish, J.K.; Zhang, J.; Liassou, D.; Feinberg, B.A. Effectiveness of eribulin in metastatic breast cancer: 10 years of real-world clinical experience in the united states. Adv. Ther. 2021, 38, 2213–2225. [Google Scholar] [CrossRef]
- Gumusay, O.; Huppert, L.A.; Magbanua, M.J.M.; Wabl, C.A.; Assefa, M.; Chien, A.J.; Melisko, M.E.; Majure, M.C.; Moasser, M.; Park, J.; et al. A phase ib/ii study of eribulin in combination with cyclophosphamide in patients with advanced breast cancer. Breast Cancer Res. Treat. 2024, 203, 197–204. [Google Scholar] [CrossRef]
- La Verde, N.; Damia, G.; Garrone, O.; Santini, D.; Fabi, A.; Ciccarese, M.; Generali, D.G.; Nunzi, M.; Poletto, E.; Ferraris, E.; et al. Tolerability of eribulin and correlation between polymorphisms and neuropathy in an unselected population of female patients with metastatic breast cancer: Results of the multicenter, single arm, phase iv painter study. Breast Cancer Res. 2022, 24, 71. [Google Scholar] [CrossRef]
- Rugo, H.S.; Barry, W.T.; Moreno-Aspitia, A.; Lyss, A.P.; Cirrincione, C.; Leung, E.; Mayer, E.L.; Naughton, M.; Toppmeyer, D.; Carey, L.A.; et al. Randomized phase iii trial of paclitaxel once per week compared with nanoparticle albumin-bound nab-paclitaxel once per week or ixabepilone with bevacizumab as first-line chemotherapy for locally recurrent or metastatic breast cancer: Calgb 40502/ncctg n063h (alliance). J. Clin. Oncol. 2015, 33, 2361–2369. [Google Scholar] [PubMed]
- Rugo, H.S.; Roche, H.; Thomas, E.; Chung, H.C.; Lerzo, G.L.; Vasyutin, I.; Patel, A.; Vahdat, L. Efficacy and safety of ixabepilone and capecitabine in patients with advanced triple-negative breast cancer: A pooled analysis from two large phase iii, randomized clinical trials. Clin. Breast Cancer 2018, 18, 489–497. [Google Scholar] [CrossRef] [PubMed]
- Yardley, D.A.; Arrowsmith, E.R.; Daniel, B.R.; Eakle, J.; Brufsky, A.; Drosick, D.R.; Kudrik, F.; Bosserman, L.D.; Keaton, M.R.; Goble, S.A.; et al. Titan: Phase iii study of doxorubicin/cyclophosphamide followed by ixabepilone or paclitaxel in early-stage triple-negative breast cancer. Breast Cancer Res. Treat. 2017, 164, 649–658. [Google Scholar] [CrossRef] [PubMed]
- Ohi, R.; Zanic, M. Ahead of the curve: New insights into microtubule dynamics. F1000Research 2016, 5, 314. [Google Scholar] [CrossRef]
- Cirillo, L.; Gotta, M.; Meraldi, P. The elephant in the room: The role of microtubules in cancer. Adv. Exp. Med. Biol. 2017, 1002, 93–124. [Google Scholar]
- Goodson, H.V.; Jonasson, E.M. Microtubules and microtubule-associated proteins. Cold Spring Harb. Perspect. Biol. 2018, 10, a022608. [Google Scholar] [CrossRef]
- Vicente, J.J.; Wordeman, L. The quantification and regulation of microtubule dynamics in the mitotic spindle. Curr. Opin. Cell Biol. 2019, 60, 36–43. [Google Scholar] [CrossRef]
- Jordan, M.A.; Wilson, L. Microtubules as a target for anticancer drugs. Nat. Rev. Cancer 2004, 4, 253–265. [Google Scholar] [CrossRef]
- Mukhtar, E.; Adhami, V.M.; Mukhtar, H. Targeting microtubules by natural agents for cancer therapy. Mol. Cancer Ther. 2014, 13, 275–284. [Google Scholar] [CrossRef]
- Masci, D.; Naro, C.; Puxeddu, M.; Urbani, A.; Sette, C.; La Regina, G.; Silvestri, R. Recent advances in drug discovery for triple-negative breast cancer treatment. Molecules 2023, 28, 7513. [Google Scholar] [CrossRef]
- Stanton, R.A.; Gernert, K.M.; Nettles, J.H.; Aneja, R. Drugs that target dynamic microtubules: A new molecular perspective. Med. Res. Rev. 2011, 31, 443–481. [Google Scholar] [CrossRef] [PubMed]
- Christensen, S.B. Drugs that changed society: Microtubule-targeting agents belonging to taxanoids, macrolides and non-ribosomal peptides. Molecules 2022, 27, 5648. [Google Scholar] [CrossRef] [PubMed]
- Cavaletti, G.; Alberti, P.; Argyriou, A.A.; Lustberg, M.; Staff, N.P.; Tamburin, S.; Toxic Neuropathy Consortium of the Peripheral Nerve, S. Chemotherapy-induced peripheral neurotoxicity: A multifaceted, still unsolved issue. J. Peripher. Nerv. Syst. 2019, 24 (Suppl. S2), S6–S12. [Google Scholar] [CrossRef] [PubMed]
- Park, S.B.; Goldstein, D.; Krishnan, A.V.; Lin, C.S.; Friedlander, M.L.; Cassidy, J.; Koltzenburg, M.; Kiernan, M.C. Chemotherapy-induced peripheral neurotoxicity: A critical analysis. CA Cancer J. Clin. 2013, 63, 419–437. [Google Scholar] [CrossRef]
- Bao, T.; Basal, C.; Seluzicki, C.; Li, S.Q.; Seidman, A.D.; Mao, J.J. Long-term chemotherapy-induced peripheral neuropathy among breast cancer survivors: Prevalence, risk factors, and fall risk. Breast Cancer Res. Treat. 2016, 159, 327–333. [Google Scholar] [CrossRef]
- Flatters, S.J.L.; Dougherty, P.M.; Colvin, L.A. Clinical and preclinical perspectives on chemotherapy-induced peripheral neuropathy (cipn): A narrative review. Br. J. Anaesth. 2017, 119, 737–749. [Google Scholar] [CrossRef]
- Ma, J.; Kavelaars, A.; Dougherty, P.M.; Heijnen, C.J. Beyond symptomatic relief for chemotherapy-induced peripheral neuropathy: Targeting the source. Cancer 2018, 124, 2289–2298. [Google Scholar] [CrossRef]
- Kortylewicz, Z.P.; Coulter, D.W.; Baranowska-Kortylewicz, J. Biological evaluation of a potential anticancer agent methyl n-[5-(3′-iodobenzoyl)-1h-benzimidazol-2-yl]carbamate. Cancer Biother. Radiopharm. 2020, 35, 16–25. [Google Scholar]
- Jung, H.; Hurtado, M.; Sanchez, M.; Medina, M.T.; Sotelo, J. Clinical pharmacokinetics of albendazole in patients with brain cysticercosis. J. Clin. Pharmacol. 1992, 32, 28–31. [Google Scholar] [CrossRef]
- Zhao, X.; Malhotra, G.K.; Lele, S.M.; Lele, M.S.; West, W.W.; Eudy, J.D.; Band, H.; Band, V. Telomerase-immortalized human mammary stem/progenitor cells with ability to self-renew and differentiate. Proc. Natl. Acad. Sci. USA 2010, 107, 14146–14151. [Google Scholar] [CrossRef]
- Kortylewicz, Z.P.; Baranowska-Kortylewicz, J. Radiosynthesis of microtubule-targeted theranostic methyl n-[5-(3′-radiohalobenzoyl)-1h-benzimidazol-2-yl]carbamates. J. Label. Comp. Radiopharm. 2018, 61, 749–756. [Google Scholar] [CrossRef]
- Kortylewicz, Z.P.; Coulter, D.W.; Baranowska-Kortylewicz, J. In vitro and in vivo evaluation of radiolabeled methyl n-[5-(3′-halobenzoyl)-1h-benzimidazol-2-yl]carbamate for cancer radiotherapy. Drug Dev. Res. 2020, 81, 62–69. [Google Scholar] [CrossRef]
- PDB Protein Data Bank. 2018. Available online: https://www.rcsb.org/structure/6BRY (accessed on 5 July 2025).
- Morris, G.M.; Huey, R.; Lindstrom, W.; Sanner, M.F.; Belew, R.K.; Goodsell, D.S.; Olson, A.J. Autodock4 and autodocktools4: Automated docking with selective receptor flexibility. J. Comput. Chem. 2009, 30, 2785–2791. [Google Scholar] [CrossRef]
- The Scripps Research Institute. 2018. Available online: https://autodock.scripps.edu/resources/ (accessed on 7 July 2024).
- Guy, C.T.; Cardiff, R.D.; Muller, W.J. Induction of mammary tumors by expression of polyomavirus middle t oncogene: A transgenic mouse model for metastatic disease. Mol. Cell Biol. 1992, 12, 954–961. [Google Scholar] [PubMed]
- The Jackson Laboratory. 2024. Available online: https://www.jax.org/strain/002374 (accessed on 7 July 2024).
- Graff, B.T.; Palanivel, C.; Jenkins, C.B.; Baranowska-Kortylewicz, J.; Yan, Y. Benzimidazole carbamate induces cytotoxicity in breast cancer cells via two distinct cell death mechanisms. Cell Death Discov. 2023, 9, 162. [Google Scholar] [CrossRef] [PubMed]
- Perkins, D.W.; Steiner, I.; Haider, S.; Robertson, D.; Buus, R.; O’Leary, L.; Isacke, C.M. Therapy-induced normal tissue damage promotes breast cancer metastasis. iScience 2024, 27, 108503. [Google Scholar] [CrossRef] [PubMed]
- Cooke, V.G.; LeBleu, V.S.; Keskin, D.; Khan, Z.; O’Connell, J.T.; Teng, Y.; Duncan, M.B.; Xie, L.; Maeda, G.; Vong, S.; et al. Pericyte depletion results in hypoxia-associated epithelial-to-mesenchymal transition and metastasis mediated by met signaling pathway. Cancer Cell 2012, 21, 66–81. [Google Scholar] [CrossRef]
- Ippolitov, D.; Arreza, L.; Munir, M.N.; Hombach-Klonisch, S. Brain microvascular pericytes-more than bystanders in breast cancer brain metastasis. Cells 2022, 11, 1263. [Google Scholar] [CrossRef]
- Pieterse, Z.; Sinha, D.; Kaur, P. Pericytes in metastasis. Adv. Exp. Med. Biol. 2019, 1147, 125–135. [Google Scholar]
- Nigro, J.M.; Baker, S.J.; Preisinger, A.C.; Jessup, J.M.; Hostetter, R.; Cleary, K.; Bigner, S.H.; Davidson, N.; Baylin, S.; Devilee, P.; et al. Mutations in the p53 gene occur in diverse human tumour types. Nature 1989, 342, 705–708. [Google Scholar] [CrossRef]
- Wang, H.; Liao, P.; Zeng, S.X.; Lu, H. It takes a team: A gain-of-function story of p53-r249s. J. Mol. Cell Biol. 2019, 11, 277–283. [Google Scholar] [CrossRef]
- Norbury, C.; Blow, J.; Nurse, P. Regulatory phosphorylation of the p34cdc2 protein kinase in vertebrates. EMBO J. 1991, 10, 3321–3329. [Google Scholar] [CrossRef]
- Medema, J.P.; Scaffidi, C.; Kischkel, F.C.; Shevchenko, A.; Mann, M.; Krammer, P.H.; Peter, M.E. Flice is activated by association with the cd95 death-inducing signaling complex (disc). EMBO J. 1997, 16, 2794–2804. [Google Scholar] [CrossRef] [PubMed]
- Chang, D.W.; Xing, Z.; Capacio, V.L.; Peter, M.E.; Yang, X. Interdimer processing mechanism of procaspase-8 activation. EMBO J. 2003, 22, 4132–4142. [Google Scholar] [CrossRef] [PubMed]
- Hoffmann, J.C.; Pappa, A.; Krammer, P.H.; Lavrik, I.N. A new c-terminal cleavage product of procaspase-8, p30, defines an alternative pathway of procaspase-8 activation. Mol. Cell Biol. 2009, 29, 4431–4440. [Google Scholar] [CrossRef]
- Kallenberger, S.M.; Beaudouin, J.; Claus, J.; Fischer, C.; Sorger, P.K.; Legewie, S.; Eils, R. Intra- and interdimeric caspase-8 self-cleavage controls strength and timing of cd95-induced apoptosis. Sci. Signal 2014, 7, ra23. [Google Scholar] [CrossRef] [PubMed]
- Hughes, M.A.; Harper, N.; Butterworth, M.; Cain, K.; Cohen, G.M.; MacFarlane, M. Reconstitution of the death-inducing signaling complex reveals a substrate switch that determines cd95-mediated death or survival. Mol. Cell 2009, 35, 265–279. [Google Scholar] [CrossRef]
- Meylan, E.; Tschopp, J. The rip kinases: Crucial integrators of cellular stress. Trends Biochem. Sci. 2005, 30, 151–159. [Google Scholar] [CrossRef]
- Festjens, N.; Vanden Berghe, T.; Cornelis, S.; Vandenabeele, P. Rip1, a kinase on the crossroads of a cell’s decision to live or die. Cell Death Differ. 2007, 14, 400–410. [Google Scholar] [CrossRef]
- Schilling, R.; Geserick, P.; Leverkus, M. Characterization of the ripoptosome and its components: Implications for anti-inflammatory and cancer therapy. Methods Enzymol. 2014, 545, 83–102. [Google Scholar]
- Zhang, L.; Blackwell, K.; Workman, L.M.; Chen, S.; Pope, M.R.; Janz, S.; Habelhah, H. Rip1 cleavage in the kinase domain regulates trail-induced nf-kappab activation and lymphoma survival. Mol. Cell Biol. 2015, 35, 3324–3338. [Google Scholar] [CrossRef] [PubMed]
- Liccardi, G.; Ramos Garcia, L.; Tenev, T.; Annibaldi, A.; Legrand, A.J.; Robertson, D.; Feltham, R.; Anderton, H.; Darding, M.; Peltzer, N.; et al. Ripk1 and caspase-8 ensure chromosome stability independently of their role in cell death and inflammation. Mol. Cell 2019, 73, 413–428.e7. [Google Scholar] [CrossRef] [PubMed]
- Koo, G.B.; Morgan, M.J.; Lee, D.G.; Kim, W.J.; Yoon, J.H.; Koo, J.S.; Kim, S.I.; Kim, S.J.; Son, M.K.; Hong, S.S.; et al. Methylation-dependent loss of rip3 expression in cancer represses programmed necrosis in response to chemotherapeutics. Cell Res. 2015, 25, 707–725. [Google Scholar] [CrossRef] [PubMed]
- Rodriguez, D.A.; Weinlich, R.; Brown, S.; Guy, C.; Fitzgerald, P.; Dillon, C.P.; Oberst, A.; Quarato, G.; Low, J.; Cripps, J.G.; et al. Characterization of ripk3-mediated phosphorylation of the activation loop of mlkl during necroptosis. Cell Death Differ. 2016, 23, 76–88. [Google Scholar] [CrossRef]
- van Raam, B.J.; Ehrnhoefer, D.E.; Hayden, M.R.; Salvesen, G.S. Intrinsic cleavage of receptor-interacting protein kinase-1 by caspase-6. Cell Death Differ. 2013, 20, 86–96. [Google Scholar] [CrossRef]
- Slee, E.A.; Adrain, C.; Martin, S.J. Executioner caspase-3, -6, and -7 perform distinct, non-redundant roles during the demolition phase of apoptosis. J. Biol. Chem. 2001, 276, 7320–7326. [Google Scholar] [CrossRef]
- Deng, X.X.; Li, S.S.; Sun, F.Y. Necrostatin-1 prevents necroptosis in brains after ischemic stroke via inhibition of ripk1-mediated ripk3/mlkl signaling. Aging Dis. 2019, 10, 807–817. [Google Scholar] [CrossRef]
- Zhou, H.; Liu, L.; Ma, X.; Wang, J.; Yang, J.; Zhou, X.; Yang, Y.; Liu, H. Rip1/rip3/mlkl-mediated necroptosis contributes to vinblastine-induced myocardial damage. Mol. Cell Biochem. 2021, 476, 1233–1243. [Google Scholar] [CrossRef] [PubMed]
- Degterev, A.; Hitomi, J.; Germscheid, M.; Ch’en, I.L.; Korkina, O.; Teng, X.; Abbott, D.; Cuny, G.D.; Yuan, C.; Wagner, G.; et al. Identification of rip1 kinase as a specific cellular target of necrostatins. Nat. Chem. Biol. 2008, 4, 313–321. [Google Scholar] [CrossRef] [PubMed]
- Pyrko, P.; Schonthal, A.H.; Hofman, F.M.; Chen, T.C.; Lee, A.S. The unfolded protein response regulator grp78/bip as a novel target for increasing chemosensitivity in malignant gliomas. Cancer Res. 2007, 67, 9809–9816. [Google Scholar] [CrossRef] [PubMed]
- Roller, C.; Maddalo, D. The molecular chaperone grp78/bip in the development of chemoresistance: Mechanism and possible treatment. Front. Pharmacol. 2013, 4, 10. [Google Scholar] [CrossRef]
- Xie, J.; Tao, Z.H.; Zhao, J.; Li, T.; Wu, Z.H.; Zhang, J.F.; Zhang, J.; Hu, X.C. Glucose regulated protein 78 (grp78) inhibits apoptosis and attentinutes chemosensitivity of gemcitabine in breast cancer cell via akt/mitochondrial apoptotic pathway. Biochem. Biophys. Res. Commun. 2016, 474, 612–619. [Google Scholar] [CrossRef]
- Kohno, K.; Normington, K.; Sambrook, J.; Gething, M.J.; Mori, K. The promoter region of the yeast kar2 (bip) gene contains a regulatory domain that responds to the presence of unfolded proteins in the endoplasmic reticulum. Mol. Cell Biol. 1993, 13, 877–890. [Google Scholar]
- Gething, M.J. Role and regulation of the er chaperone bip. Semin. Cell Dev. Biol. 1999, 10, 465–472. [Google Scholar] [CrossRef]
- Lee, A.S. Grp78 induction in cancer: Therapeutic and prognostic implications. Cancer Res. 2007, 67, 3496–3499. [Google Scholar] [CrossRef]
- Wang, J.; Yin, Y.; Hua, H.; Li, M.; Luo, T.; Xu, L.; Wang, R.; Liu, D.; Zhang, Y.; Jiang, Y. Blockade of grp78 sensitizes breast cancer cells to microtubules-interfering agents that induce the unfolded protein response. J. Cell Mol. Med. 2009, 13, 3888–3897. [Google Scholar] [CrossRef]
- Gutierrez, T.; Qi, H.; Yap, M.C.; Tahbaz, N.; Milburn, L.A.; Lucchinetti, E.; Lou, P.H.; Zaugg, M.; LaPointe, P.G.; Mercier, P.; et al. The er chaperone calnexin controls mitochondrial positioning and respiration. Sci. Signal 2020, 13, eaax6660. [Google Scholar] [CrossRef]
- Brewer, J.W.; Diehl, J.A. Perk mediates cell-cycle exit during the mammalian unfolded protein response. Proc. Natl. Acad. Sci. USA 2000, 97, 12625–12630. [Google Scholar] [CrossRef]
- Donnelly, N.; Gorman, A.M.; Gupta, S.; Samali, A. The eif2alpha kinases: Their structures and functions. Cell Mol. Life Sci. 2013, 70, 3493–3511. [Google Scholar] [CrossRef] [PubMed]
- Liu, Z.; Lv, Y.; Zhao, N.; Guan, G.; Wang, J. Protein kinase r-like er kinase and its role in endoplasmic reticulum stress-decided cell fate. Cell Death Dis. 2015, 6, e1822. [Google Scholar] [CrossRef]
- Chen, L.; He, J.; Zhou, J.; Xiao, Z.; Ding, N.; Duan, Y.; Li, W.; Sun, L.Q. EIF2A promotes cell survival during paclitaxel treatment in vitro and in vivo. J. Cell. Mol. Med. 2019, 23, 6060–6071. [Google Scholar] [CrossRef]
- Cai, W.; Rong, D.; Ding, J.; Zhang, X.; Wang, Y.; Fang, Y.; Xiao, J.; Yang, S.; Wang, H. Activation of the PERK/eIF2α axis is a pivotal prerequisite of taxanes to cancer cell apoptosis and renders synergism to overcome paclitaxel resistance in breast cancer cells. Cancer Cell Int. 2024, 24, 249. [Google Scholar] [CrossRef]
- Li, H.; Korennykh, A.V.; Behrman, S.L.; Walter, P. Mammalian endoplasmic reticulum stress sensor ire1 signals by dynamic clustering. Proc. Natl. Acad. Sci. USA 2010, 107, 16113–16118. [Google Scholar] [CrossRef]
- Han, D.; Lerner, A.G.; Vande Walle, L.; Upton, J.P.; Xu, W.; Hagen, A.; Backes, B.J.; Oakes, S.A.; Papa, F.R. Ire1alpha kinase activation modes control alternate endoribonuclease outputs to determine divergent cell fates. Cell 2009, 138, 562–575. [Google Scholar] [CrossRef]
- Li, H.; Zhang, H.; Huang, G.; Bing, Z.; Xu, D.; Liu, J.; Luo, H.; An, X. Loss of rps27a expression regulates the cell cycle, apoptosis, and proliferation via the rpl11-mdm2-p53 pathway in lung adenocarcinoma cells. J. Exp. Clin. Cancer Res. 2022, 41, 33. [Google Scholar] [CrossRef]
- Wang, H.; Feng, J.; Zhou, T.; Wei, L.; Zhou, J. P-3f, a microtubule polymerization inhibitor enhances p53 stability through the change in localization of rps27a. Int. J. Biochem. Cell Biol. 2017, 92, 53–62. [Google Scholar] [CrossRef] [PubMed]
- Bernier-Valentin, F.; Rousset, B. Interaction of tubulin with rat liver mitochondria. J. Biol. Chem. 1982, 257, 7092–7099. [Google Scholar] [CrossRef] [PubMed]
- Carre, M.; Andre, N.; Carles, G.; Borghi, H.; Brichese, L.; Briand, C.; Braguer, D. Tubulin is an inherent component of mitochondrial membranes that interacts with the voltage-dependent anion channel. J. Biol. Chem. 2002, 277, 33664–33669. [Google Scholar] [CrossRef] [PubMed]
- Maldonado, E.N.; Patnaik, J.; Mullins, M.R.; Lemasters, J.J. Free tubulin modulates mitochondrial membrane potential in cancer cells. Cancer Res. 2010, 70, 10192–10201. [Google Scholar] [CrossRef]
- Pfefferle, A.D.; Herschkowitz, J.I.; Usary, J.; Harrell, J.C.; Spike, B.T.; Adams, J.R.; Torres-Arzayus, M.I.; Brown, M.; Egan, S.E.; Wahl, G.M.; et al. Transcriptomic classification of genetically engineered mouse models of breast cancer identifies human subtype counterparts. Genome Biol. 2013, 14, R125. [Google Scholar] [CrossRef] [PubMed]
- Lin, E.Y.; Jones, J.G.; Li, P.; Zhu, L.; Whitney, K.D.; Muller, W.J.; Pollard, J.W. Progression to malignancy in the polyoma middle t oncoprotein mouse breast cancer model provides a reliable model for human diseases. Am. J. Pathol. 2003, 163, 2113–2126. [Google Scholar] [CrossRef] [PubMed]
- Attalla, S.; Taifour, T.; Bui, T.; Muller, W. Insights from transgenic mouse models of pymt-induced breast cancer: Recapitulating human breast cancer progression in vivo. Oncogene 2021, 40, 475–491. [Google Scholar] [CrossRef]
- Sopik, V.; Sun, P.; Narod, S.A. The prognostic effect of estrogen receptor status differs for younger versus older breast cancer patients. Breast Cancer Res. Treat. 2017, 165, 391–402. [Google Scholar] [CrossRef]
- Charles River Laboratories. 2025. Available online: https://assets.www.criver.com/storage-account-container/resource-files/RM-C57-aged-mouse-data-hematology.pdf (accessed on 23 July 2025).
- Seretny, M.; Currie, G.L.; Sena, E.S.; Ramnarine, S.; Grant, R.; MacLeod, M.R.; Colvin, L.A.; Fallon, M. Incidence, prevalence, and predictors of chemotherapy-induced peripheral neuropathy: A systematic review and meta-analysis. Pain 2014, 155, 2461–2470. [Google Scholar] [CrossRef]
- Key Statistics for Breast Cancer. Available online: https://www.Cancer.Org/cancer/types/breast-cancer/about/how-common-is-breast-cancer.Html (accessed on 23 July 2025).
- McDivitt, R.W.; Stone, K.R.; Craig, R.B.; Palmer, J.O.; Meyer, J.S.; Bauer, W.C. A proposed classification of breast cancer based on kinetic information: Derived from a comparison of risk factors in 168 primary operable breast cancers. Cancer 1986, 57, 269–276. [Google Scholar] [CrossRef]
- Dressler, L.G.; Seamer, L.C.; Owens, M.A.; Clark, G.M.; McGuire, W.L. DNA flow cytometry and prognostic factors in 1331 frozen breast cancer specimens. Cancer 1988, 61, 420–427. [Google Scholar] [CrossRef]
- Aaltomaa, S.; Lipponen, P.; Papinaho, S.; Syrjanen, K. Proliferating-cell nuclear antigen (pc10) immunolabelling and other proliferation indices as prognostic factors in breast cancer. J. Cancer Res. Clin. Oncol. 1993, 119, 288–294. [Google Scholar] [CrossRef]
- von Fournier, D.; Weber, E.; Hoeffken, W.; Bauer, M.; Kubli, F.; Barth, V. Growth rate of 147 mammary carcinomas. Cancer 1980, 45, 2198–2207. [Google Scholar] [CrossRef] [PubMed]
- Ungerleider, N.A.; Rao, S.G.; Shahbandi, A.; Yee, D.; Niu, T.; Frey, W.D.; Jackson, J.G. Breast cancer survival predicted by tp53 mutation status differs markedly depending on treatment. Breast Cancer Res. 2018, 20, 115. [Google Scholar] [CrossRef] [PubMed]
- Cancer Genome Atlas, N. Comprehensive molecular portraits of human breast tumours. Nature 2012, 490, 61–70. [Google Scholar] [CrossRef]
- Desmedt, C.; Voet, T.; Sotiriou, C.; Campbell, P.J. Next-generation sequencing in breast cancer: First take home messages. Curr. Opin. Oncol. 2012, 24, 597–604. [Google Scholar] [CrossRef] [PubMed]
- Berg, T.; Ahlborn, L.; Jensen, M.B.; Knoop, A.S.; Ejlertsen, B.; Rossing, M. Comprehensive mapping elucidates high risk genotypes in primary metastatic breast cancer. Neoplasia 2025, 63, 101162. [Google Scholar] [CrossRef]
- Weiss, M.B.; Vitolo, M.I.; Mohseni, M.; Rosen, D.M.; Denmeade, S.R.; Park, B.H.; Weber, D.J.; Bachman, K.E. Deletion of p53 in human mammary epithelial cells causes chromosomal instability and altered therapeutic response. Oncogene 2010, 29, 4715–4724. [Google Scholar] [CrossRef]
- Orning, P.; Lien, E. Multiple roles of caspase-8 in cell death, inflammation, and innate immunity. J. Leukoc. Biol. 2021, 109, 121–141. [Google Scholar] [CrossRef]
- Contadini, C.; Ferri, A.; Cirotti, C.; Stupack, D.; Barila, D. Caspase-8 and tyrosine kinases: A dangerous liaison in cancer. Cancers 2023, 15, 3271. [Google Scholar] [CrossRef]
- Martinon, F.; Holler, N.; Richard, C.; Tschopp, J. Activation of a pro-apoptotic amplification loop through inhibition of nf-kappab-dependent survival signals by caspase-mediated inactivation of rip. FEBS Lett. 2000, 468, 134–136. [Google Scholar] [CrossRef]
- Duan, X.; Liu, X.; Liu, N.; Huang, Y.; Jin, Z.; Zhang, S.; Ming, Z.; Chen, H. Inhibition of keratinocyte necroptosis mediated by ripk1/ripk3/mlkl provides a protective effect against psoriatic inflammation. Cell Death Dis. 2020, 11, 134. [Google Scholar] [CrossRef]
- Lin, Y.; Devin, A.; Rodriguez, Y.; Liu, Z.G. Cleavage of the death domain kinase rip by caspase-8 prompts tnf-induced apoptosis. Genes Dev. 1999, 13, 2514–2526. [Google Scholar] [CrossRef] [PubMed]
- Kim, J.W.; Choi, E.J.; Joe, C.O. Activation of death-inducing signaling complex (disc) by pro-apoptotic c-terminal fragment of rip. Oncogene 2000, 19, 4491–4499. [Google Scholar] [CrossRef] [PubMed]
- Schrek, R. Sensitivity of leukaemic lymphocytes to microtubular reagents. Br. J. Exp. Pathol. 1975, 56, 280–285. [Google Scholar] [PubMed]
- DeAngelis, L.M.; Gnecco, C.; Taylor, L.; Warrell, R.P., Jr. Evolution of neuropathy and myopathy during intensive vincristine/corticosteroid chemotherapy for non-hodgkin’s lymphoma. Cancer 1991, 67, 2241–2246. [Google Scholar] [CrossRef]
- Salerni, B.L.; Bates, D.J.; Albershardt, T.C.; Lowrey, C.H.; Eastman, A. Vinblastine induces acute, cell cycle phase-independent apoptosis in some leukemias and lymphomas and can induce acute apoptosis in others when mcl-1 is suppressed. Mol. Cancer Ther. 2010, 9, 791–802. [Google Scholar] [CrossRef]
- Horton, J.K.; Houghton, P.J.; Houghton, J.A. Relationships between tumor responsiveness, vincristine pharmacokinetics and arrest of mitosis in human tumor xenografts. Biochem. Pharmacol. 1988, 37, 3995–4000. [Google Scholar] [CrossRef]
- Milas, L.; Hunter, N.R.; Kurdoglu, B.; Mason, K.A.; Meyn, R.E.; Stephens, L.C.; Peters, L.J. Kinetics of mitotic arrest and apoptosis in murine mammary and ovarian tumors treated with taxol. Cancer Chemother. Pharmacol. 1995, 35, 297–303. [Google Scholar] [CrossRef]
- Gascoigne, K.E.; Taylor, S.S. Cancer cells display profound intra- and interline variation following prolonged exposure to antimitotic drugs. Cancer Cell 2008, 14, 111–122. [Google Scholar] [CrossRef]
- Mitchison, T.J. The proliferation rate paradox in antimitotic chemotherapy. Mol. Biol. Cell 2012, 23, 1–6. [Google Scholar] [CrossRef]
- Rostovtseva, T.K.; Sheldon, K.L.; Hassanzadeh, E.; Monge, C.; Saks, V.; Bezrukov, S.M.; Sackett, D.L. Tubulin binding blocks mitochondrial voltage-dependent anion channel and regulates respiration. Proc. Natl. Acad. Sci. USA 2008, 105, 18746–18751. [Google Scholar] [CrossRef]
- Lee, A.S. Glucose-regulated proteins in cancer: Molecular mechanisms and therapeutic potential. Nat. Rev. Cancer 2014, 14, 263–276. [Google Scholar] [CrossRef]
- Hammond, C.; Helenius, A. Folding of vsv g protein: Sequential interaction with bip and calnexin. Science 1994, 266, 456–458. [Google Scholar] [CrossRef]
- Kim, P.S.; Arvan, P. Calnexin and bip act as sequential molecular chaperones during thyroglobulin folding in the endoplasmic reticulum. J. Cell Biol. 1995, 128, 29–38. [Google Scholar] [CrossRef] [PubMed]
- Molinari, M.; Galli, C.; Piccaluga, V.; Pieren, M.; Paganetti, P. Sequential assistance of molecular chaperones and transient formation of covalent complexes during protein degradation from the ER. J. Cell Biol. 2002, 158, 247–257. [Google Scholar] [CrossRef]
- Inic, Z.; Zegarac, M.; Inic, M.; Markovic, I.; Kozomara, Z.; Djurisic, I.; Inic, I.; Pupic, G.; Jancic, S. Difference between luminal a and luminal b subtypes according to ki-67, tumor size, and progesterone receptor negativity providing prognostic information. Clin. Med. Insights Oncol. 2014, 8, 107–111. [Google Scholar] [CrossRef] [PubMed]
- Metzger-Filho, O.; Sun, Z.; Viale, G.; Price, K.N.; Crivellari, D.; Snyder, R.D.; Gelber, R.D.; Castiglione-Gertsch, M.; Coates, A.S.; Goldhirsch, A.; et al. Patterns of recurrence and outcome according to breast cancer subtypes in lymph node-negative disease: Results from international breast cancer study group trials viii and ix. J. Clin. Oncol. 2013, 31, 3083–3090. [Google Scholar] [CrossRef] [PubMed]
- Lindman, H.; Wiklund, F.; Andersen, K.K. Long-term treatment patterns and survival in metastatic breast cancer by intrinsic subtypes—An observational cohort study in Sweden. BMC Cancer 2022, 22, 1006. [Google Scholar] [CrossRef]
- Park, C.; Park, K.; Kim, J.; Sin, Y.; Park, I.; Cho, H.; Yang, K.; Bae, B.N.; Kim, K.W.; Ahn, S.; et al. Prognostic values of negative estrogen or progesterone receptor expression in patients with luminal b her2-negative breast cancer. World J. Surg. Oncol. 2016, 14, 244. [Google Scholar] [CrossRef]
- NCCN. 2025. Available online: https://www.nccn.org/professionals/physician_gls/pdf/breast.pdf (accessed on 3 January 2025).
- Li, C.H.; Karantza, V.; Aktan, G.; Lala, M. Current treatment landscape for patients with locally recurrent inoperable or metastatic triple-negative breast cancer: A systematic literature review. Breast Cancer Res. 2019, 21, 143. [Google Scholar] [CrossRef]
- Id Said, B.; Jerzak, K.J.; Chen, H.; Moravan, V.; Warner, E.; Myrehaug, S.; Tseng, C.L.; Detsky, J.; Dinakaran, D.; Heyn, C.; et al. Survival outcomes among patients with breast cancer and leptomeningeal disease. Sci. Rep. 2025, 15, 24170. [Google Scholar] [CrossRef]
- Punie, K.; Kurian, A.W.; Ntalla, I.; Sjekloca, N.; Estrin, A.; Dabrowski, E.C.; Lai, C.; Hurvitz, S. Unmet need for previously untreated metastatic triple-negative breast cancer: A real-world study of patients diagnosed from 2011 to 2022 in the united states. Oncologist 2025, 30, oyaf034. [Google Scholar] [CrossRef]


| Compound | EB [kcal/mol] | Ki [nM] |
|---|---|---|
| colchicine | −9.86 | 59.0 |
| mebendazole | −7.90 | 1630.0 |
| IBCar | −11.44 | 4.08 |
| GI50 [nM] | GI50 [nM] | |||
|---|---|---|---|---|
| 96-Well MTS Assay | Clonogenic | |||
| Cell Line | 24 h | 48 h | 72 h | 48 h Treatment |
| BT-549 | 57.5 ± 6.0 | 14.8 ± 1.2 | 12.9 ± 1.3 | 22.9 ± 1.4 |
| HCC70 | 177.5 ± 16.2 | 33.7 ± 6.9 | 17.8 ± 2.2 | 12.3 ± 2.8 |
| MDA-MB-175-VII | nd * | 172.4 ± 36.5 | 24.2 ± 3.5 | 24.0 ± 6.6 |
| MDA-MB-231 | nd | 41.4 ± 7.8 | nd | 19.5 ± 3.4 |
| MDA-MB-361 | nd | 21.9 ± 3.1 | nd | 3.0 ± 2.1 |
| MDA-MB-468 | nd | 25.3 ± 1.5 | nd | 7.3 ± 1.9 |
| MCF-10A | 1149 ± 357 | 149.9 ± 49.7 | nd | nd |
| 76N | 2561 ± 315 | 1786 ± 389 | 1622 ± 580 | nd |
| IBCar | Control | Standard Values | ||
|---|---|---|---|---|
| Parameter | Units | Average (std dev) | Average (std dev) | Range |
| Albumin (ALB) | g/dL | 4.4 (0.3) | 4.7 (0.4) | 2.5–4.9 |
| Alkaline phosphatase (ALP) | U/L | 90.0 (11.1) | 68.0 (19.9) | 16–291 |
| Alanine aminotransferase (ALT) | U/L | 84.3 (43.0) | 57.0 (17.6) | 7–277 |
| Amylase (AMY) | U/L | 847.8 (92.3) | 876.7 (73.4) | na * |
| Bilirubin, total (total bil) | mg/dL | 0.4 (0.1) | 0.3 (0.1) | 0.1–1.1 |
| Bood urea nitrogen (BUN) | mg/dL | 17.8 (1.3) | 18.0 (2.6) | 2–71 |
| Calcium (Ca) | mg/dL | 11.3 (0.9) | 11.9 (0.2) | 6.8–11.9 |
| Phosphorus (PHOS) | mg/dL | 11.8 (0.6) | 11.0 (1.3) | 5.3–11.3 |
| Creatinine (CRE) | mg/dL | 0.4 (0.1) | 0.3 (0.1) | 0.1–2.1 |
| Glucose (GLU) | mg/dL | 310.3 (47.2) | 258.7 (12.1) | 173–376 |
| Sodium (Na+) | mmol/L | 157.3 (11.1) | 160.0 (4.4) | 145–176 |
| Potassium (K+) | mmol/L | 8.5 (0.0) | 8.5 (0.0) | 6.5–9.7 |
| Total protein (TP) | g/dL | 5.4 (0.5) | 5.9 (0.5) | 3.3–7.6 |
| Globulin (GLOB) | g/dL | 1.1 (0.2) | 1.2 (0.2) | na |
Disclaimer/Publisher’s Note: The statements, opinions and data contained in all publications are solely those of the individual author(s) and contributor(s) and not of MDPI and/or the editor(s). MDPI and/or the editor(s) disclaim responsibility for any injury to people or property resulting from any ideas, methods, instructions or products referred to in the content. |
© 2025 by the authors. Licensee MDPI, Basel, Switzerland. This article is an open access article distributed under the terms and conditions of the Creative Commons Attribution (CC BY) license (https://creativecommons.org/licenses/by/4.0/).
Share and Cite
Baranowska-Kortylewicz, J.; Yan, Y. IBCar: Potent Orally Bioavailable Methyl N-[5-(3′-Iodobenzoyl)-1H-Benzimidazol-2-yl]Carbamate for Breast Cancer Therapy. Cancers 2025, 17, 2526. https://doi.org/10.3390/cancers17152526
Baranowska-Kortylewicz J, Yan Y. IBCar: Potent Orally Bioavailable Methyl N-[5-(3′-Iodobenzoyl)-1H-Benzimidazol-2-yl]Carbamate for Breast Cancer Therapy. Cancers. 2025; 17(15):2526. https://doi.org/10.3390/cancers17152526
Chicago/Turabian StyleBaranowska-Kortylewicz, Janina, and Ying Yan. 2025. "IBCar: Potent Orally Bioavailable Methyl N-[5-(3′-Iodobenzoyl)-1H-Benzimidazol-2-yl]Carbamate for Breast Cancer Therapy" Cancers 17, no. 15: 2526. https://doi.org/10.3390/cancers17152526
APA StyleBaranowska-Kortylewicz, J., & Yan, Y. (2025). IBCar: Potent Orally Bioavailable Methyl N-[5-(3′-Iodobenzoyl)-1H-Benzimidazol-2-yl]Carbamate for Breast Cancer Therapy. Cancers, 17(15), 2526. https://doi.org/10.3390/cancers17152526