
Identification of Key Genes Associated with Tumor Microenvironment Infiltration and Survival in Gastric Adenocarcinoma via Bioinformatics Analysis
 , , , , , ,
Abstract
Simple Summary
Abstract
1. Introduction
2. Materials and Methods
2.1. Microarray Data
2.2. Identification of DEGs between Normal and GC Tissue
2.3. Functional Enrichment Analyses of the GC-Related DEGs
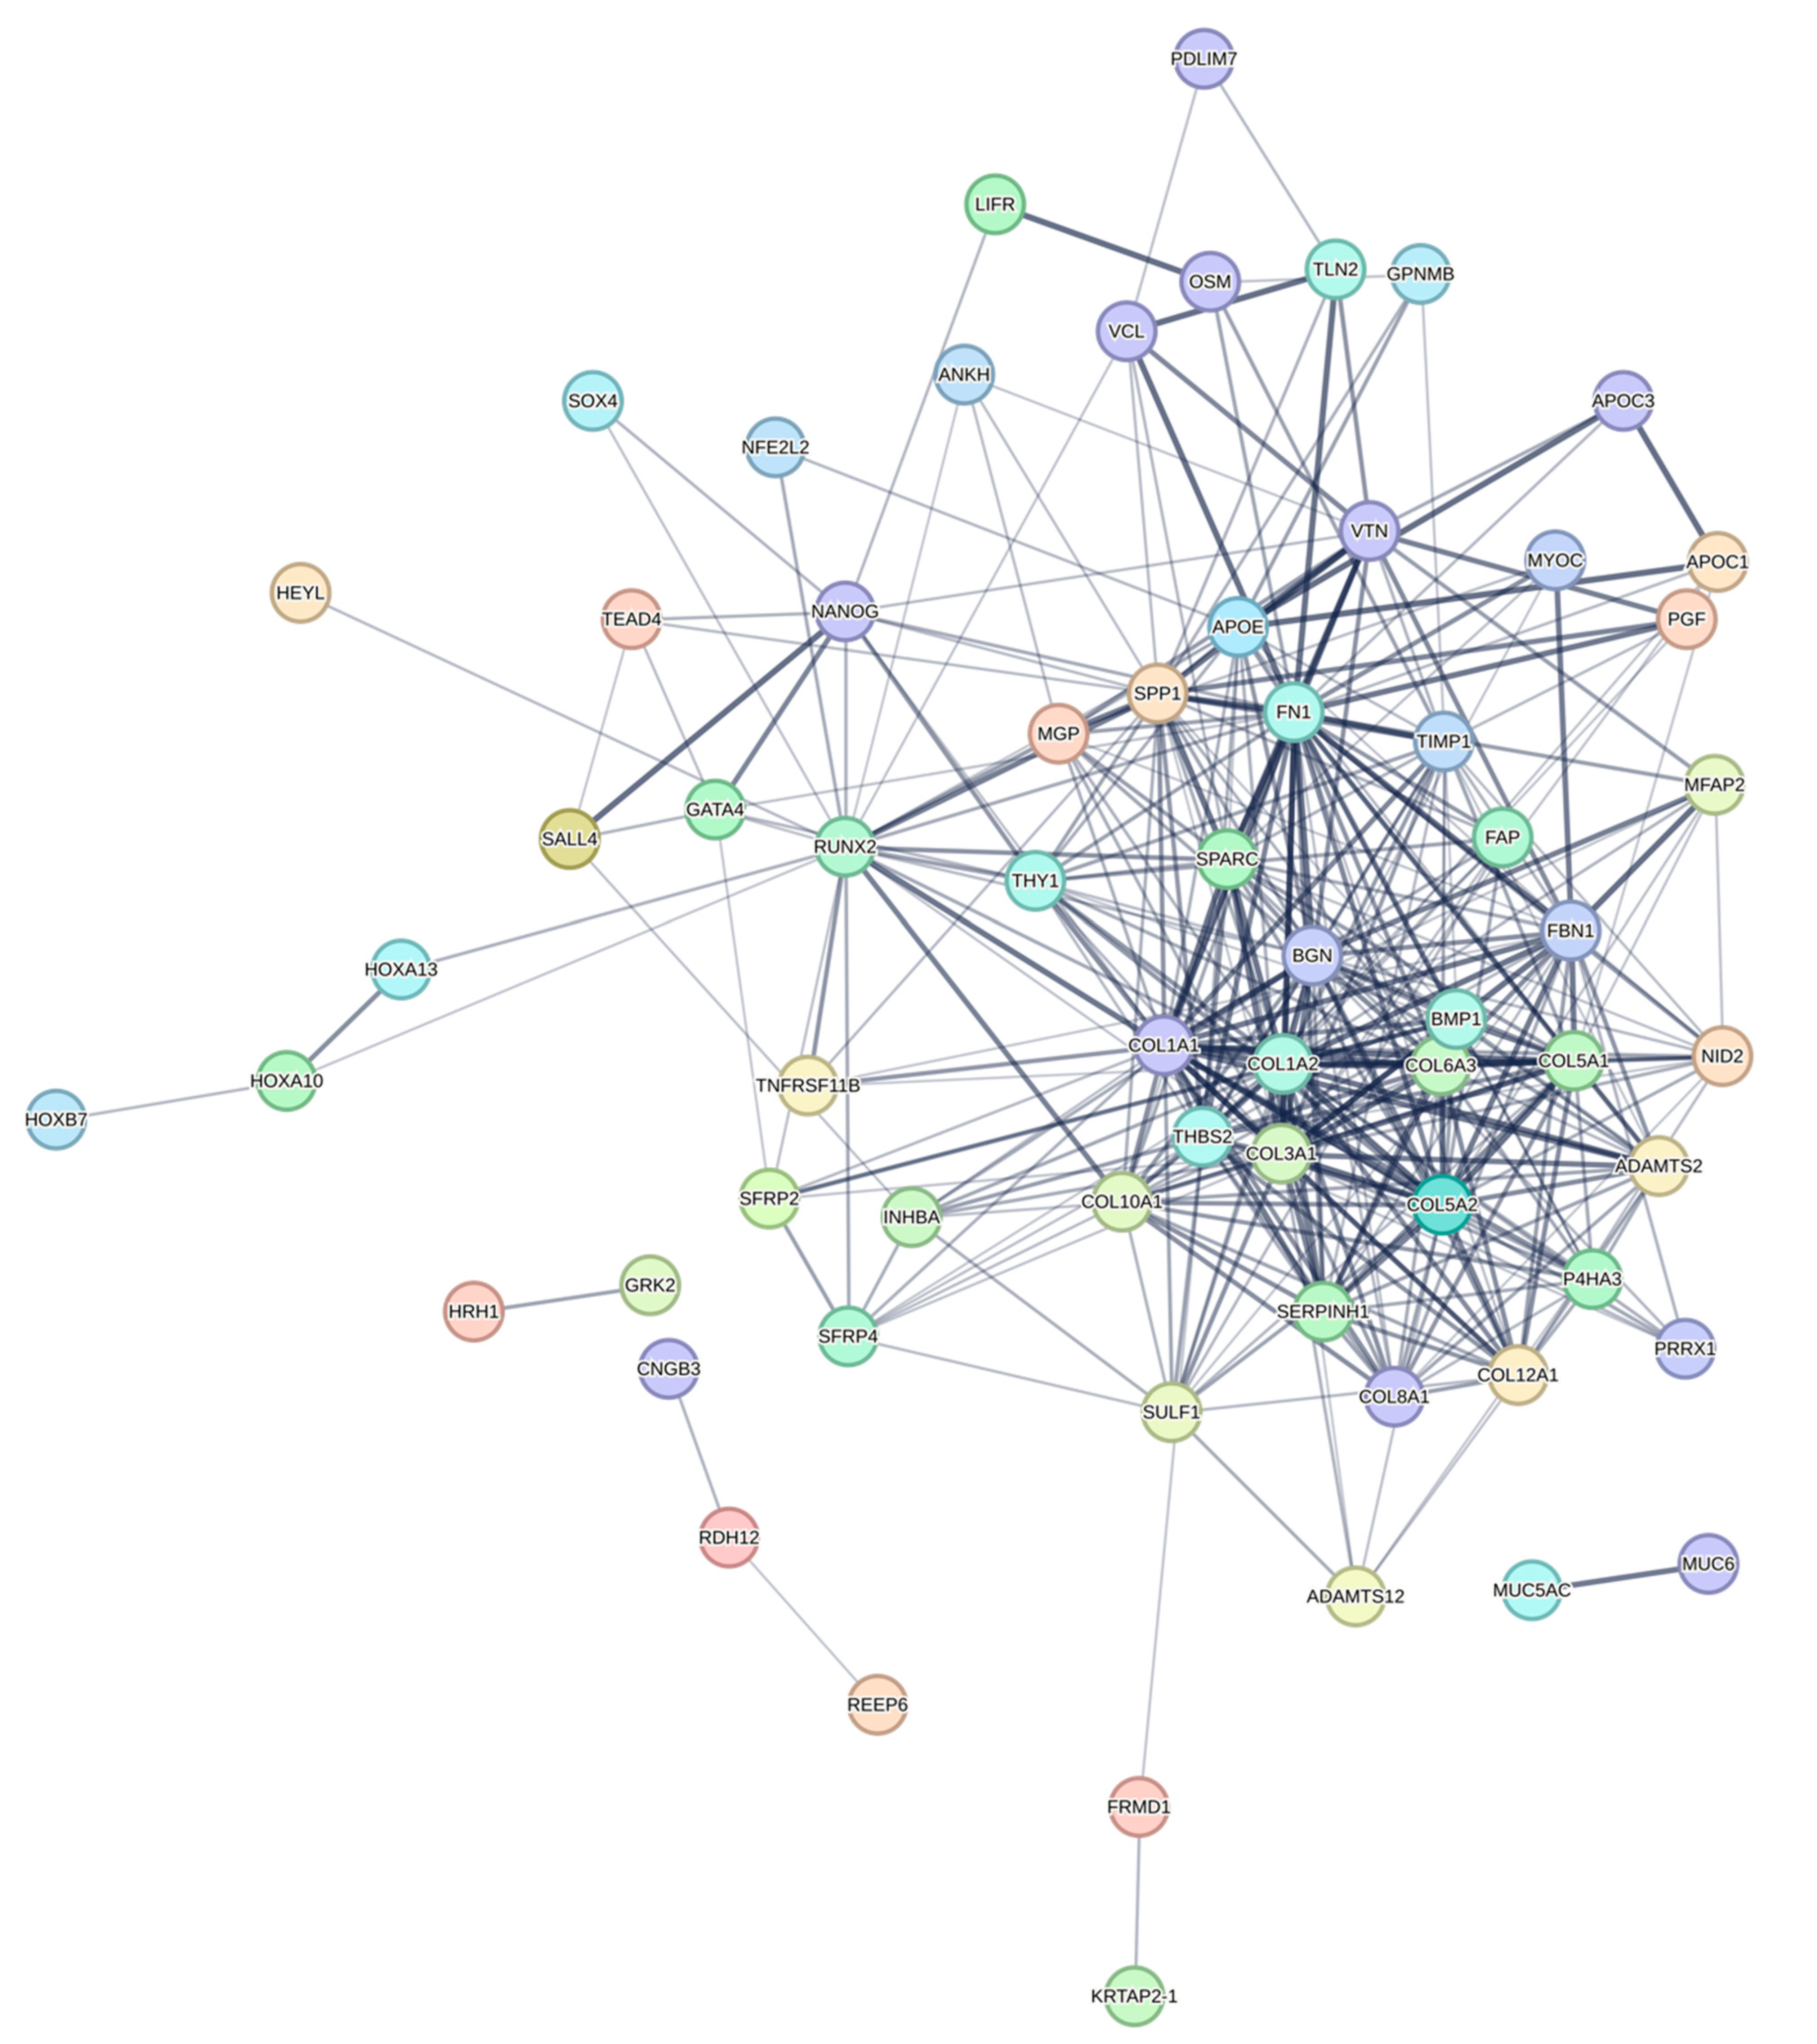
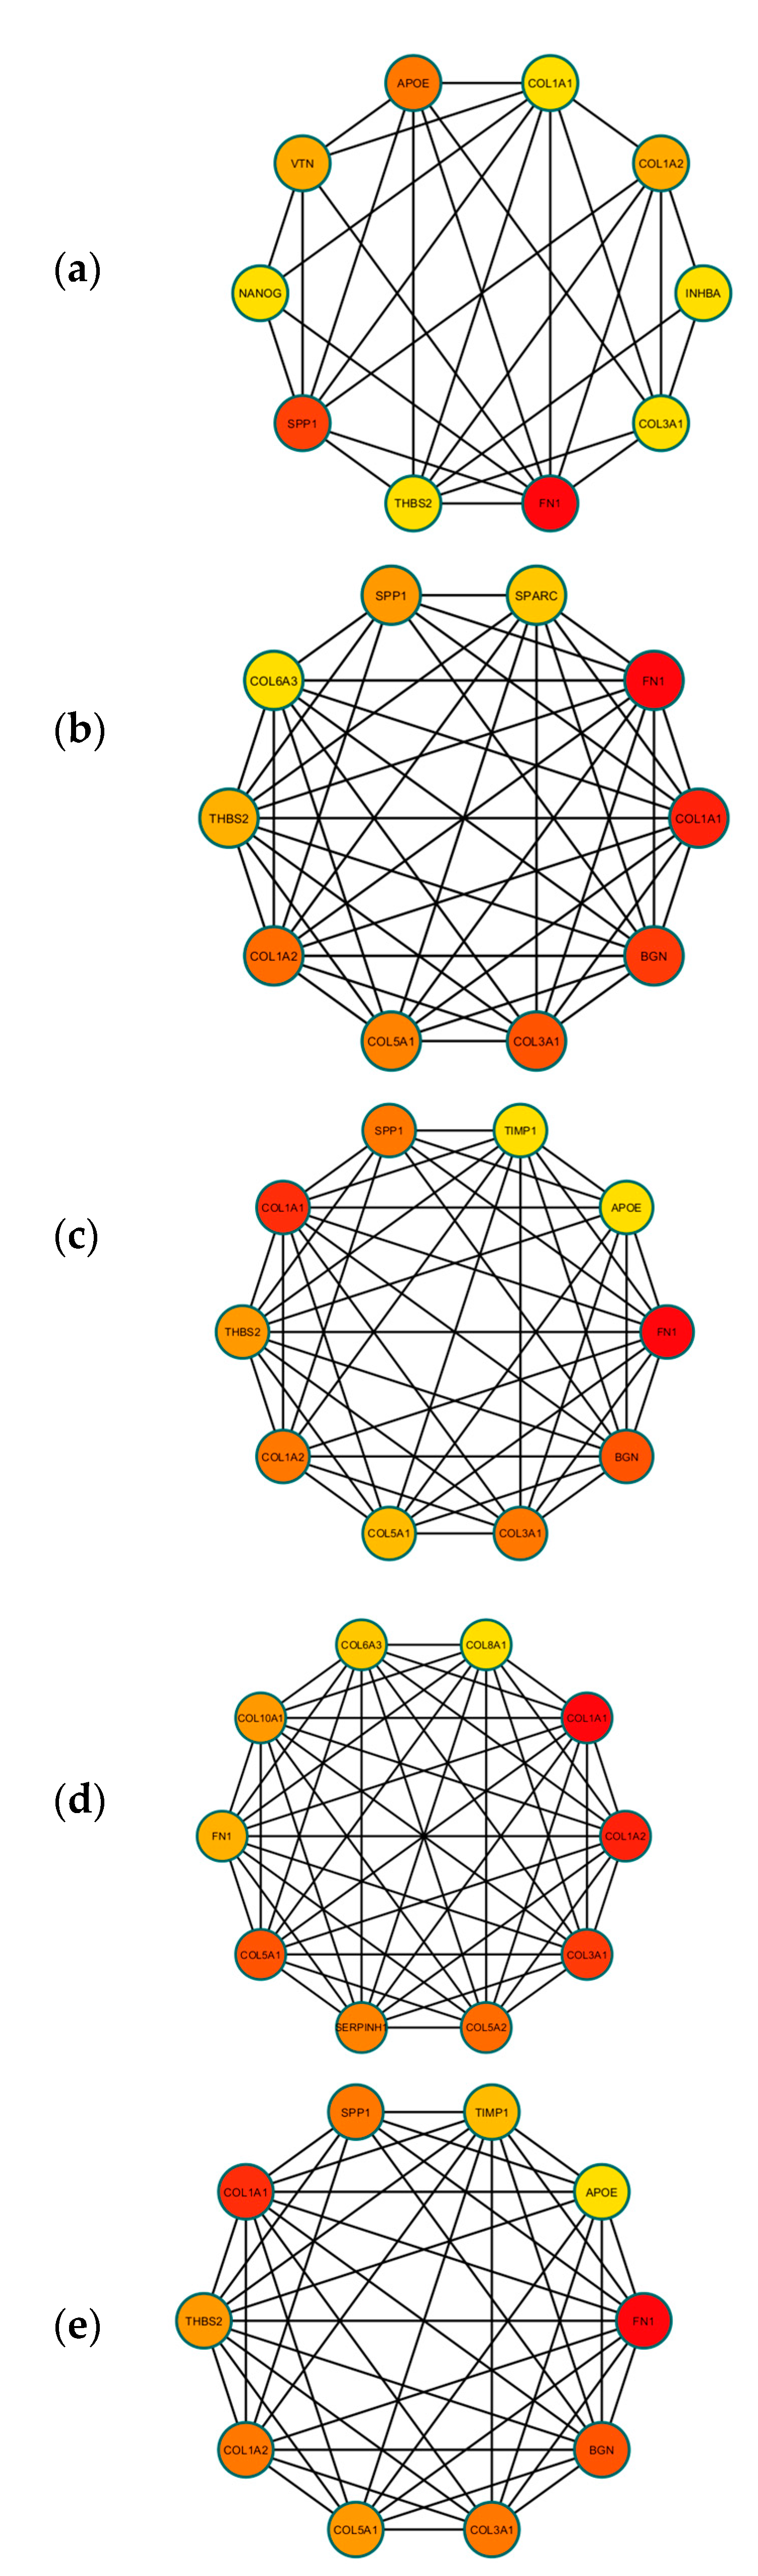
2.4. Construction of PPI Network and Identification of Hub DEGs
2.5. Prognostic Value of Hub DEGs as Biomarkers in GC
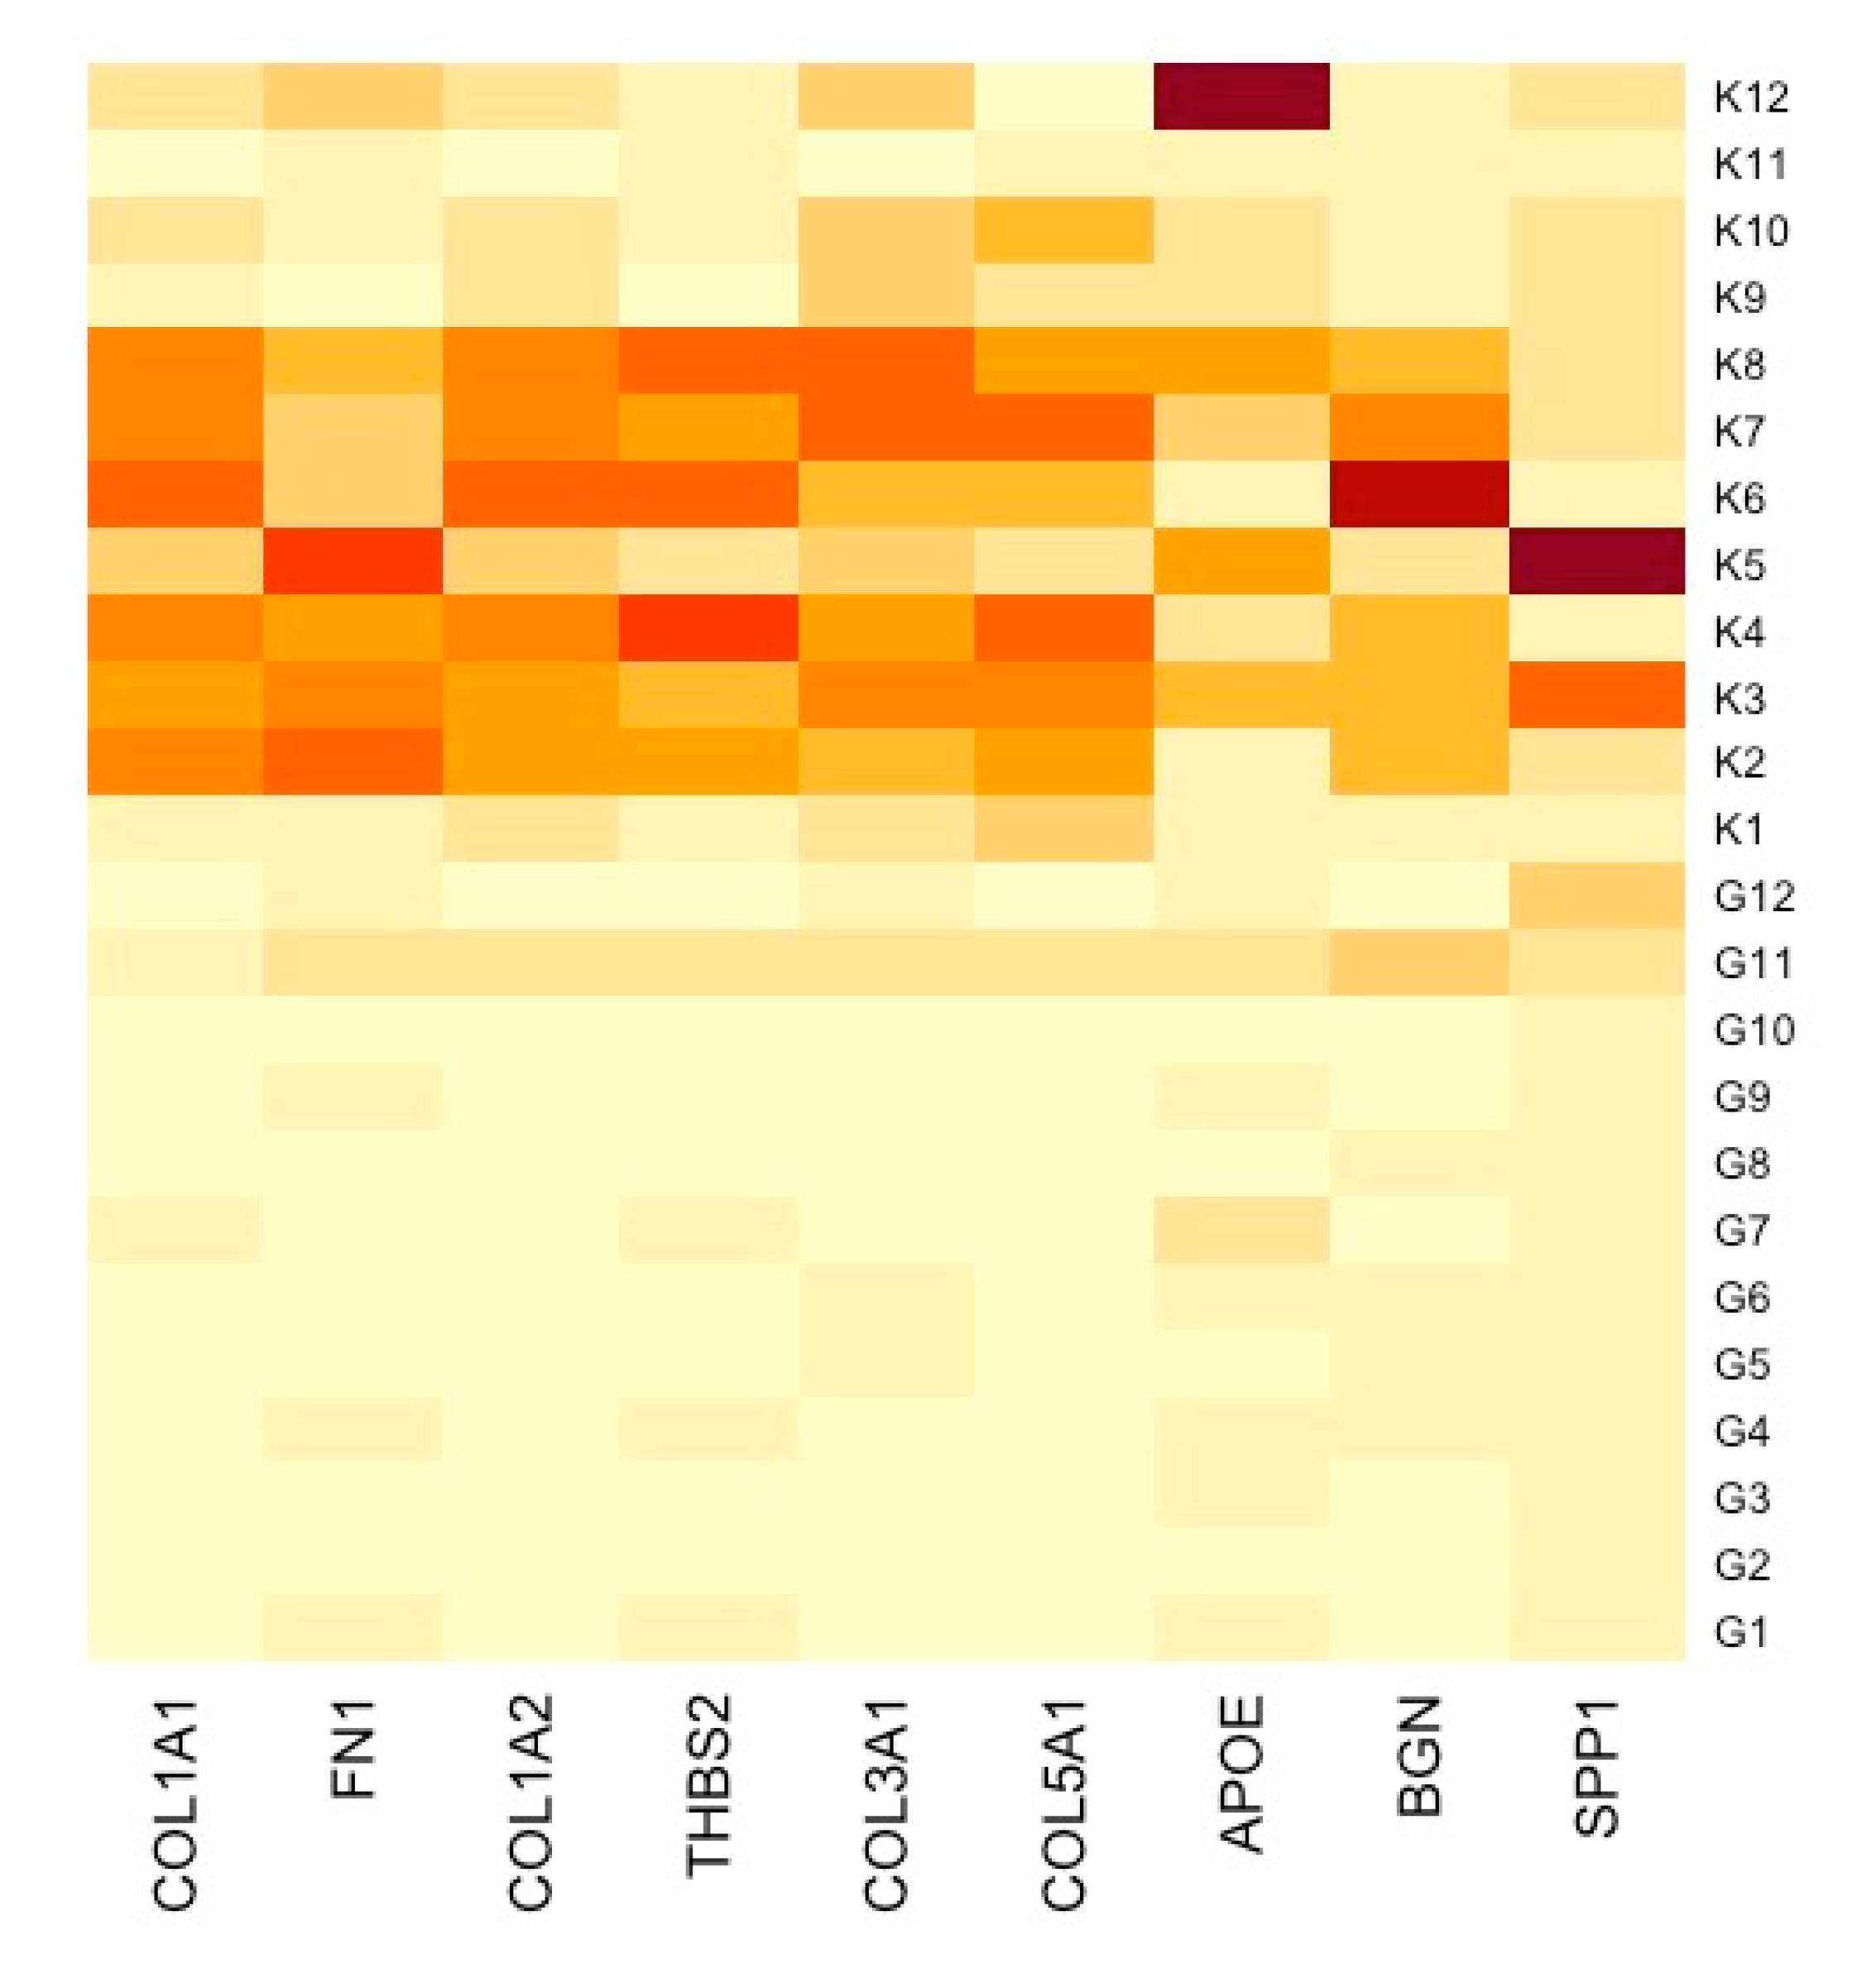
2.6. Correlation Analyses between Hub DEGs and Infiltrating Immune Cells
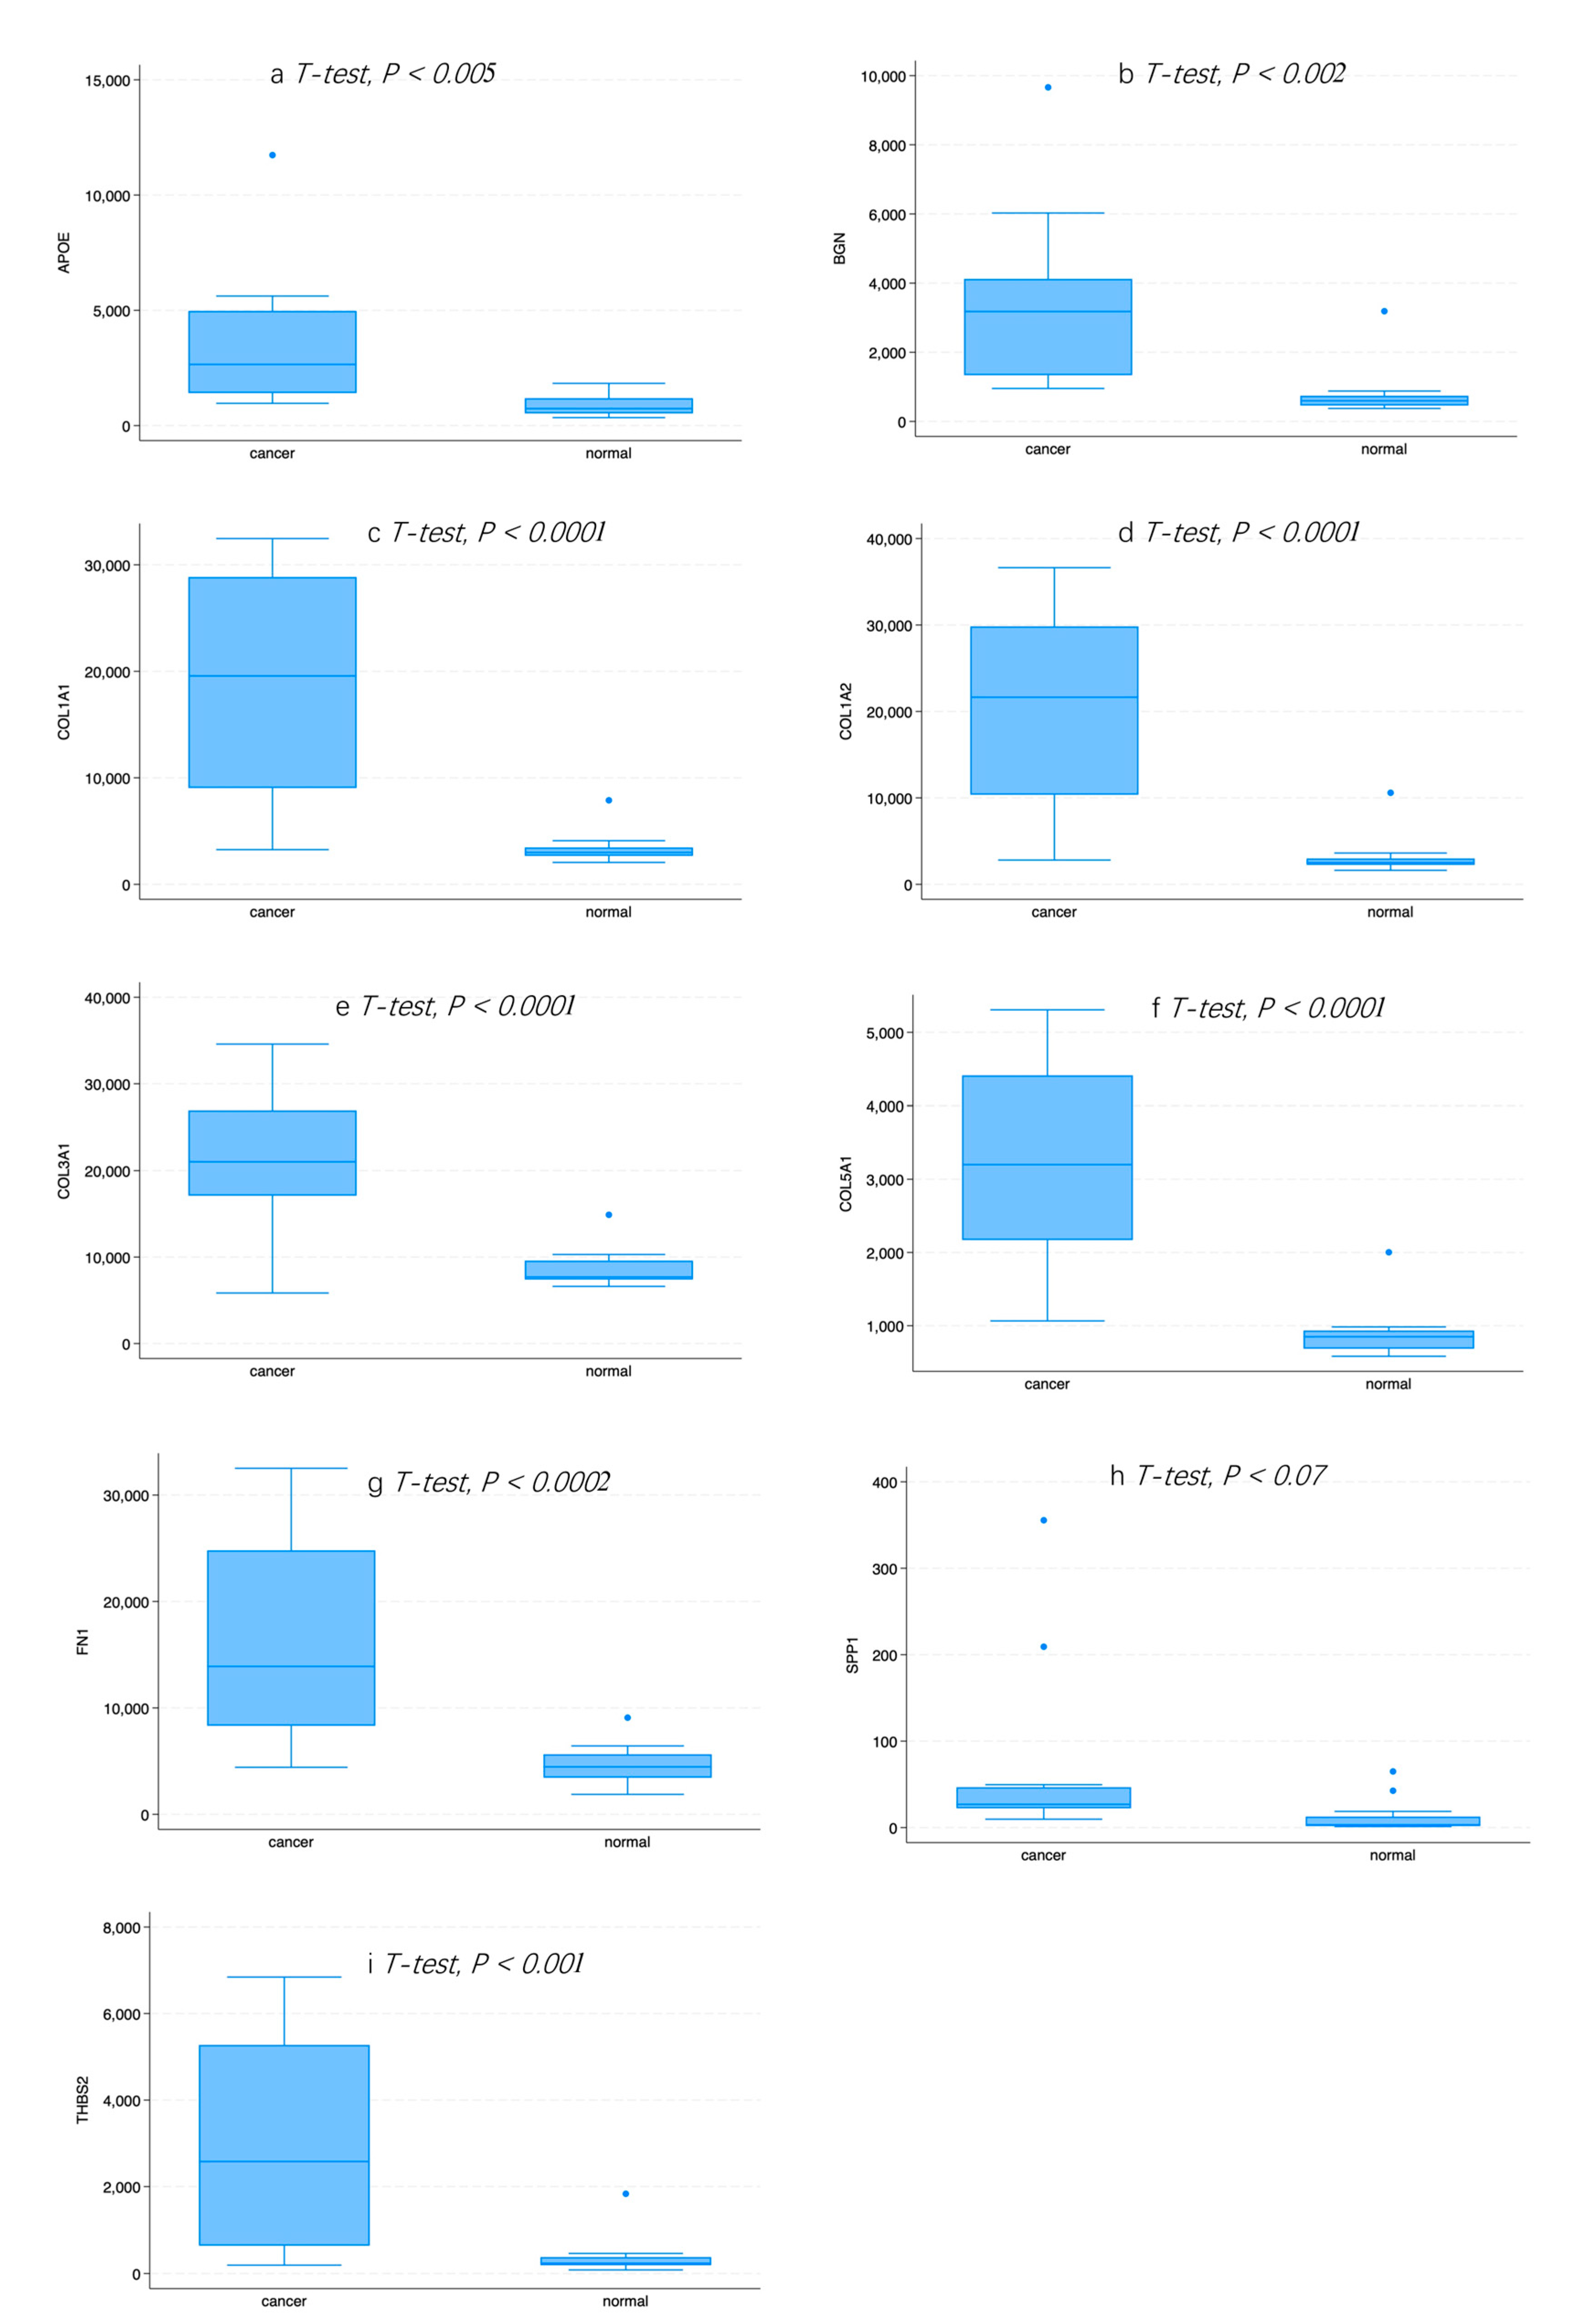
2.7. Expression of Hub Genes in Normal or GC Tissue
3. Results
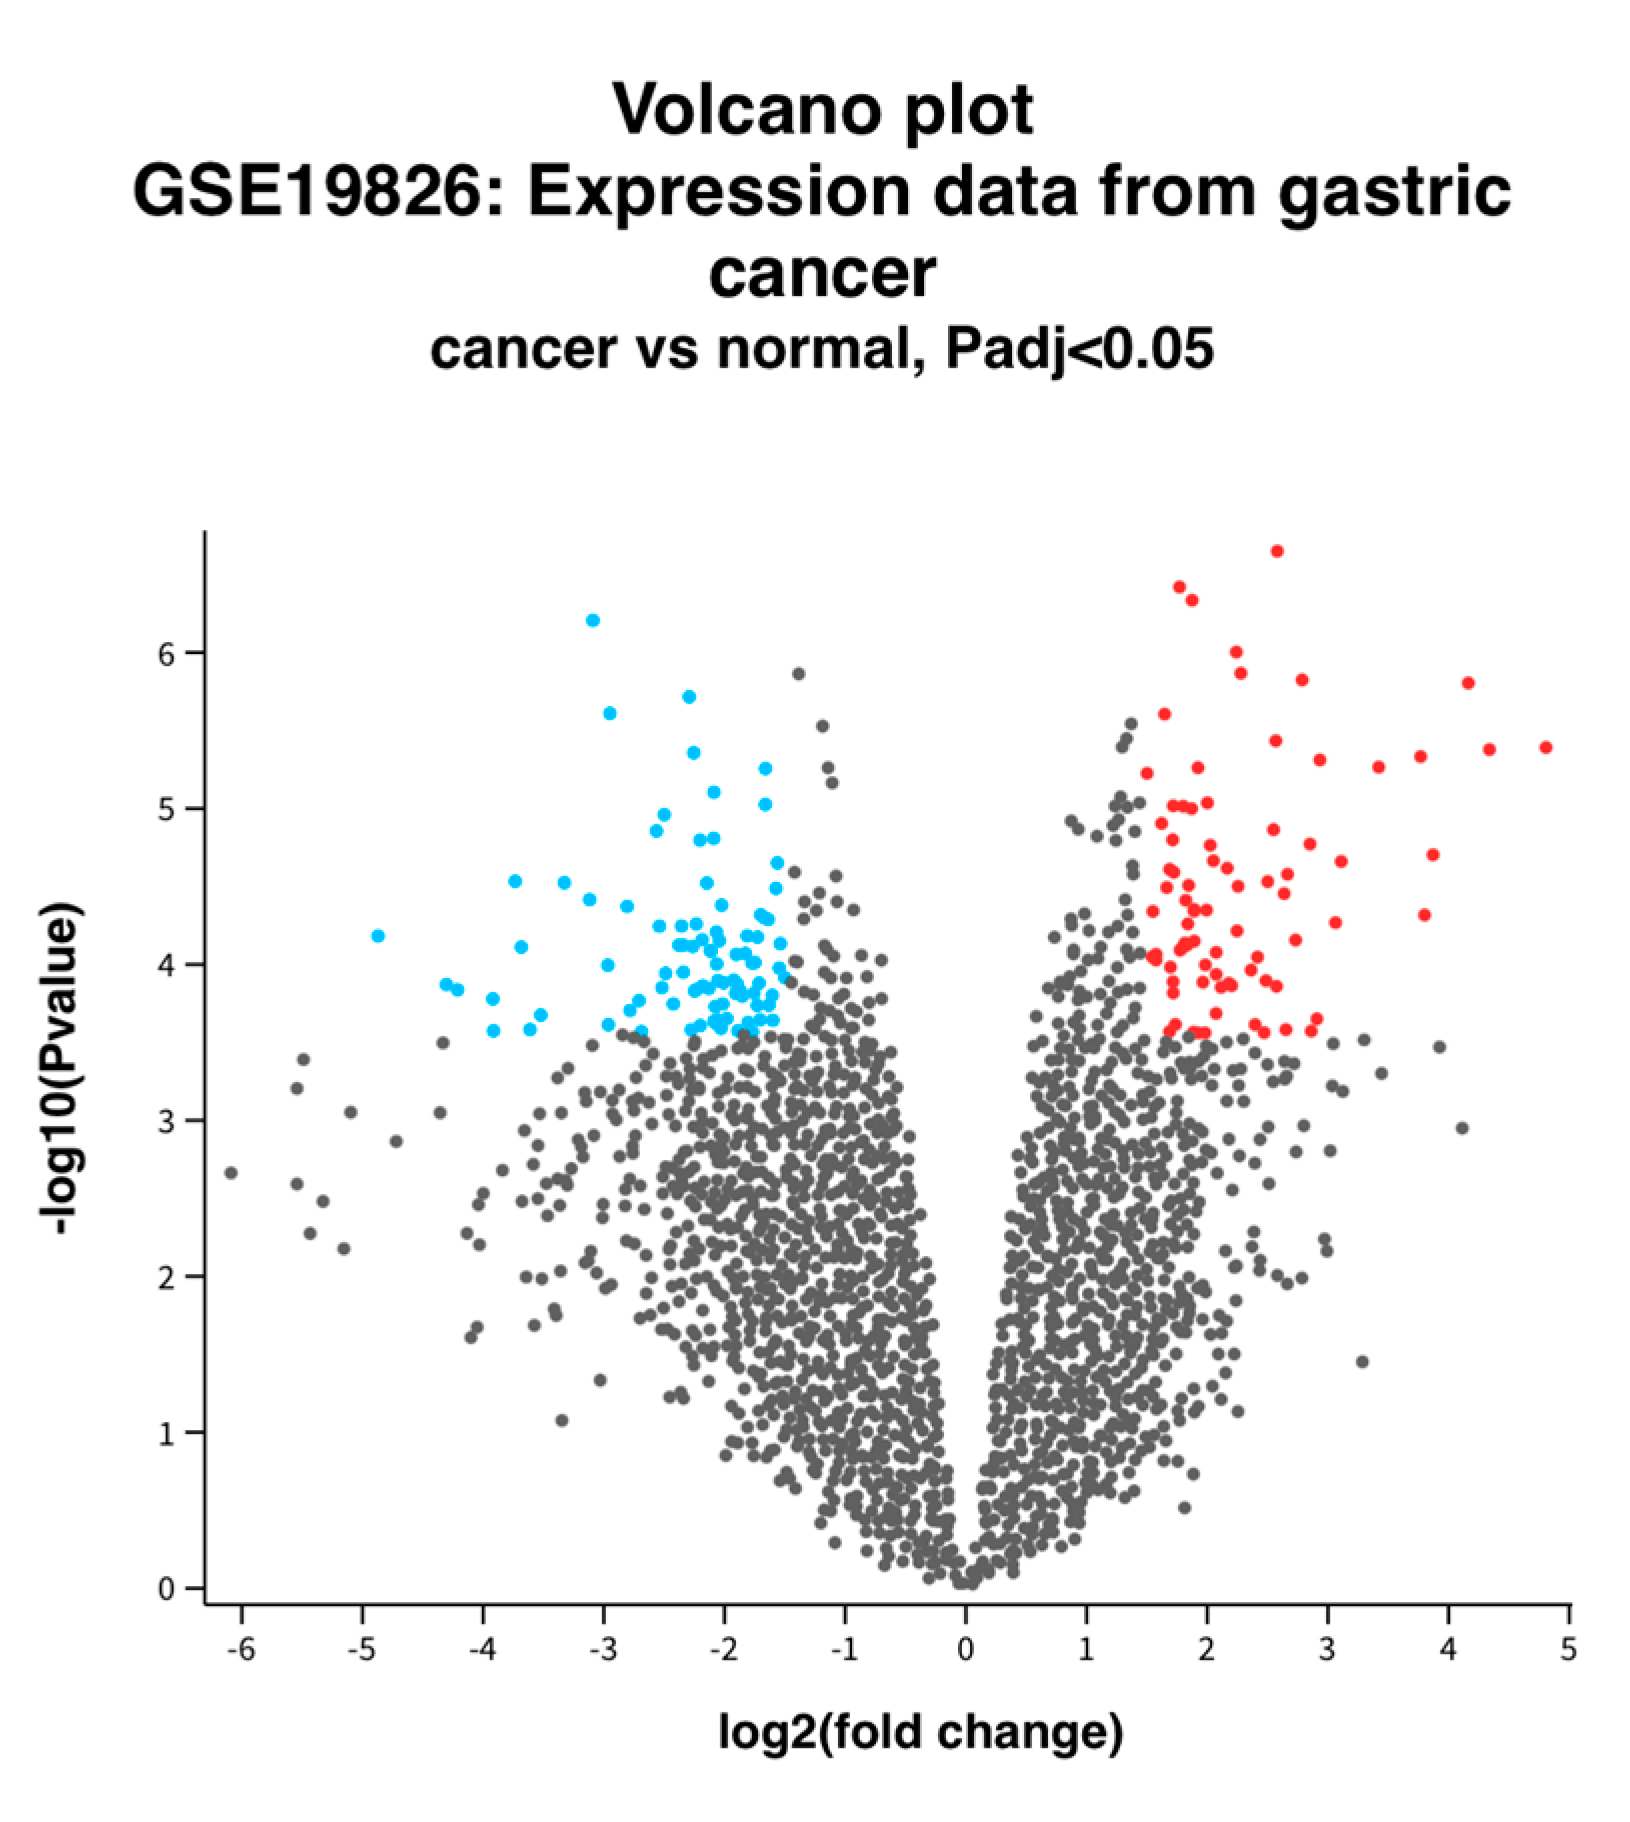
3.1. Identification of DEGs between Normal and GC Tissue
3.2. Functional Enrichment Analyses
3.3. Construction of PPI Network and Identification of Hub DEGs
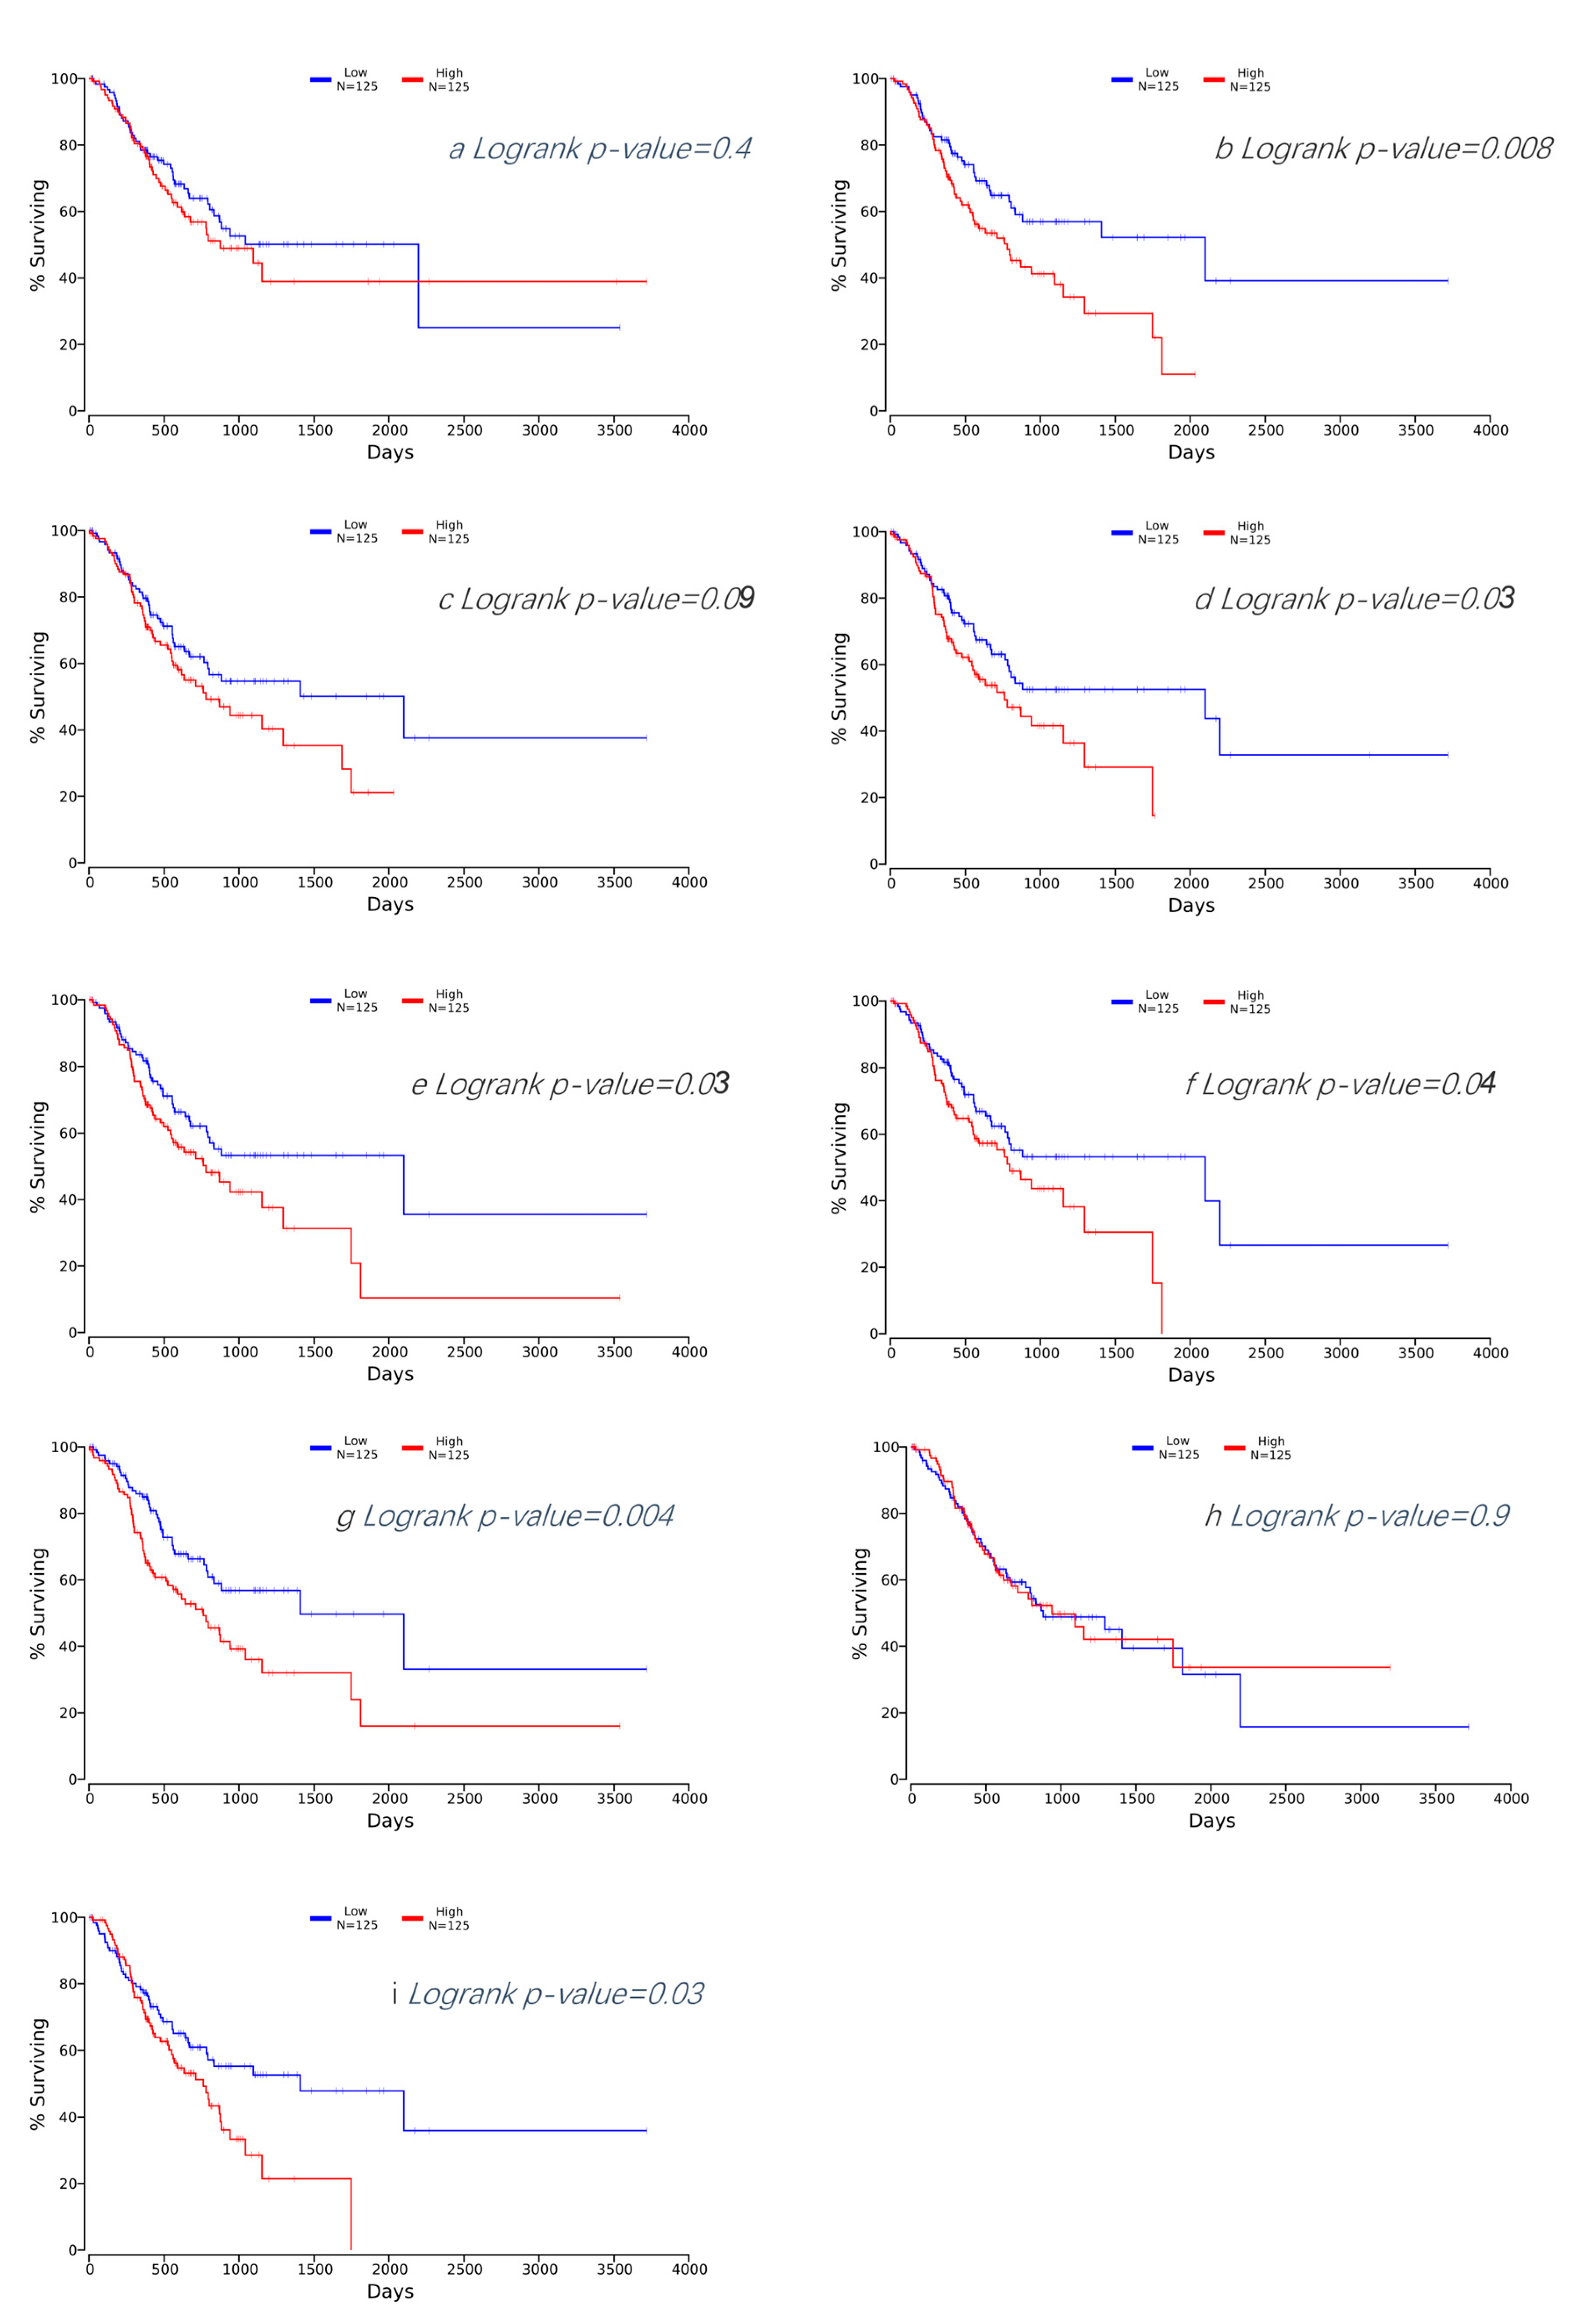
3.4. Survival Analysis of Hub DEGs in GC
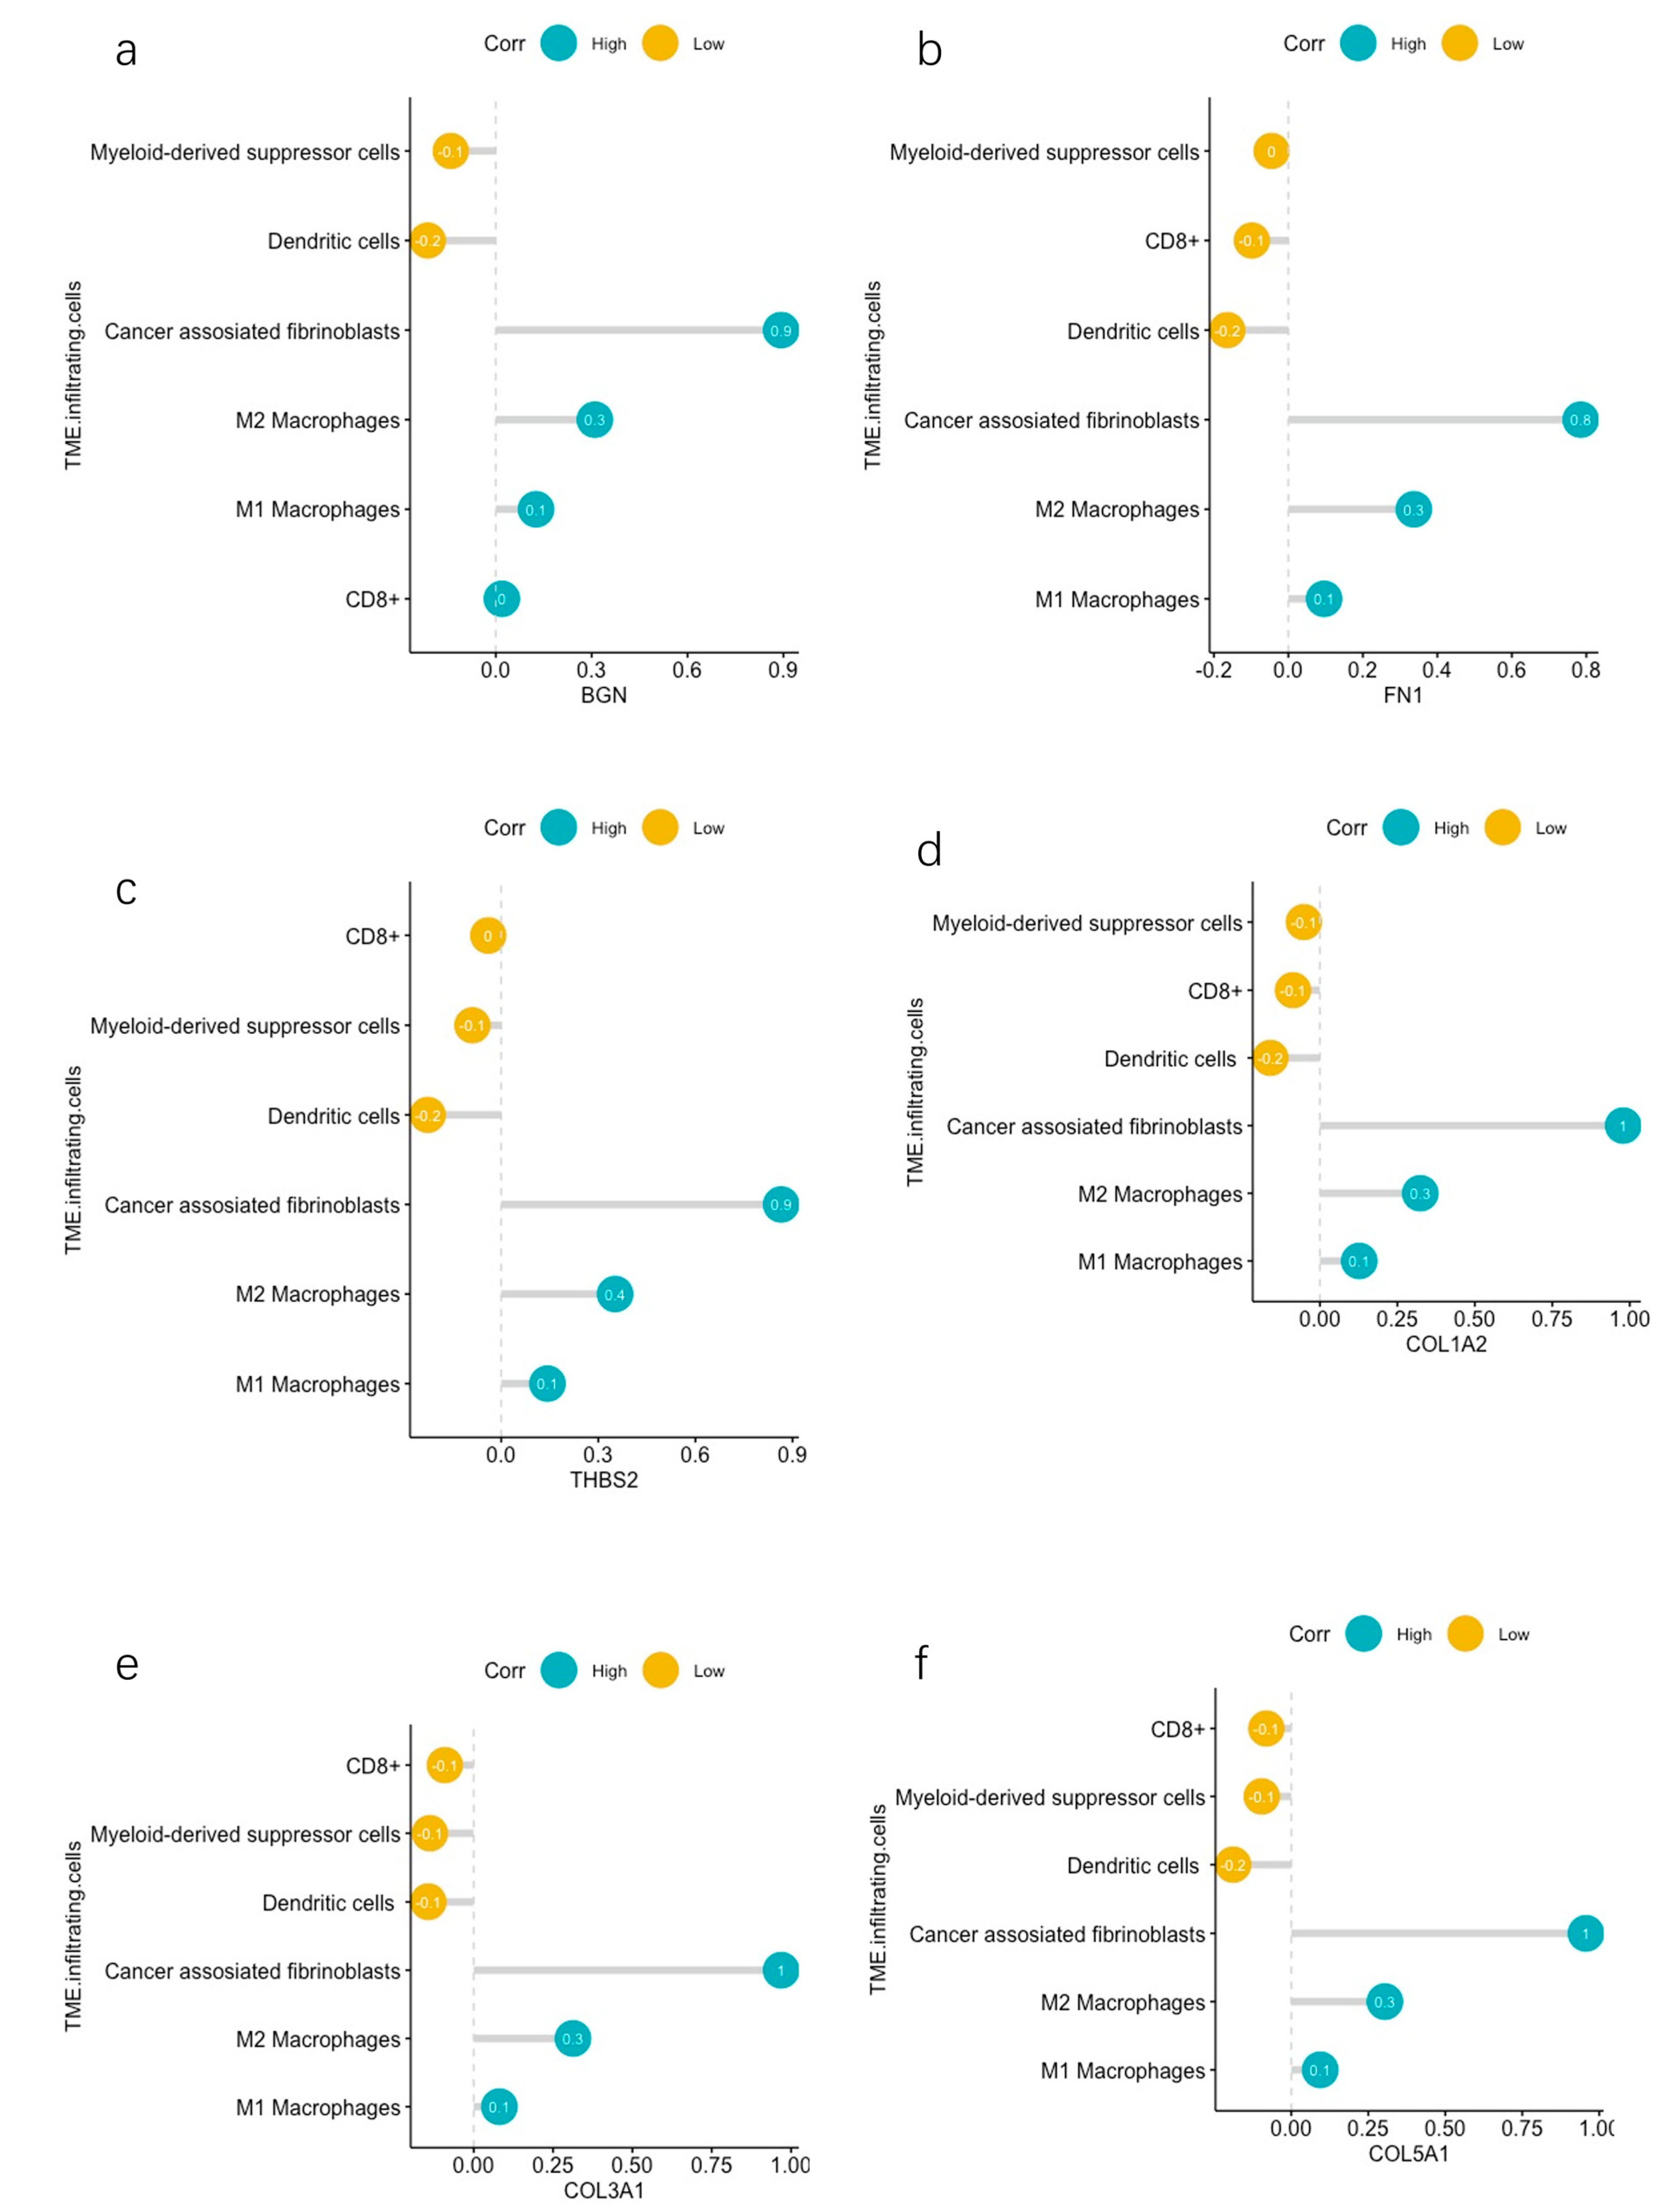
3.5. TME Evaluation in GC
4. Discussion
5. Conclusions and Limitations
Supplementary Materials
Author Contributions
Funding
Institutional Review Board Statement
Informed Consent Statement
Data Availability Statement
Acknowledgments
Conflicts of Interest
Abbreviations
| BPs | Biological Processes |
| CAFs | Cancer-associated Fibroblasts |
| CCs | Cellular Components |
| DEGs | Differentially Expressed Genes |
| ECM | Extracellular Matrix |
| ECX | Epirubicin, Cisplatin, and Capecitabine |
| EMR | Endoscopic Mucosal Resection |
| ESD | Endoscopic Submucosal Dissection |
| FDA | Food and Drug Administration |
| FLOT | Fluorouracil, Oxaliplatin, Docetaxel, and Leucovorin |
| GC | Gastric Cancer/Gastric Carcinoma |
| GEO | Gene Expression Omnibus |
| GO | Gene Ontology |
| KEGG | Kyoto Encyclopedia of Genes and Genomes |
| MDSCs | Myeloid-derived Suppressor Cells |
| MFs | Molecular Functions |
| NFs | Normal Fibroblasts |
| PD-L1 | Programmed Death-ligand 1 |
| PPI | Protein–Protein Interaction |
| TAMs | Tumor-associated Macrophages |
| TIMER | Tumor Immune Evaluation Resource |
| TME | Tumor Microenvironment |
References
- Bray, F.; Ferlay, J.; Soerjomataram, I.; Siegel, R.L.; Torre, L.A.; Jemal, A. Global cancer statistics 2018: GLOBOCAN estimates of incidence and mortality worldwide for 36 cancers in 185 countries. CA Cancer J. Clin. 2018, 68, 394–424. [Google Scholar] [CrossRef] [PubMed]
- Carcas, L.P. Gastric cancer review. J. Carcinog. 2014, 13, 635–648. [Google Scholar] [CrossRef] [PubMed]
- Smyth, E.C.; Nilsson, M.; Grabsch, H.I.; van Grieken, N.C.; Lordick, F. Gastric cancer. Lancet 2020, 396, 635–648. [Google Scholar] [CrossRef]
- Joshi, S.S.; Badgwell, B.D. Current treatment and recent progress in gastric cancer. CA Cancer J. Clin. 2021, 71, 264–279. [Google Scholar] [CrossRef] [PubMed]
- Rha, S.Y.; Oh, D.-Y.; Yañez, P.; Bai, Y.; Ryu, M.-H.; Lee, J.; Rivera, F.; Alves, G.V.; Garrido, M.; Shiu, K.-K. Pembrolizumab plus chemotherapy versus placebo plus chemotherapy for HER2-negative advanced gastric cancer (KEYNOTE-859): A multicentre, randomised, double-blind, phase 3 trial. Lancet Oncol. 2023, 24, 1181–1195. [Google Scholar] [CrossRef] [PubMed]
- Janjigian, Y.Y.; Shitara, K.; Moehler, M.; Garrido, M.; Salman, P.; Shen, L.; Wyrwicz, L.; Yamaguchi, K.; Skoczylas, T.; Bragagnoli, A.C. First-line nivolumab plus chemotherapy versus chemotherapy alone for advanced gastric, gastro-oesophageal junction, and oesophageal adenocarcinoma (CheckMate 649): A randomised, open-label, phase 3 trial. Lancet 2021, 398, 27–40. [Google Scholar] [CrossRef] [PubMed]
- Anderson, N.M.; Simon, M.C. The tumor microenvironment. Curr. Biol. 2020, 30, R921–R925. [Google Scholar] [CrossRef] [PubMed]
- Baghban, R.; Roshangar, L.; Jahanban-Esfahlan, R.; Seidi, K.; Ebrahimi-Kalan, A.; Jaymand, M.; Kolahian, S.; Javaheri, T.; Zare, P. Tumor microenvironment complexity and therapeutic implications at a glance. Cell Commun. Signal. 2020, 18, 59. [Google Scholar] [CrossRef] [PubMed]
- Li, Y.; Hu, X.; Lin, R.; Zhou, G.; Zhao, L.; Zhao, D.; Zhang, Y.; Li, W.; Zhang, Y.; Ma, P. Single-cell landscape reveals active cell subtypes and their interaction in the tumor microenvironment of gastric cancer. Theranostics 2022, 12, 3818. [Google Scholar] [CrossRef] [PubMed]
- Oliver, G.R.; Hart, S.N.; Klee, E.W. Bioinformatics for clinical next generation sequencing. Clin. Chem. 2015, 61, 124–135. [Google Scholar] [CrossRef]
- Zeng, D.; Li, M.; Zhou, R.; Zhang, J.; Sun, H.; Shi, M.; Bin, J.; Liao, Y.; Rao, J.; Liao, W. Tumor microenvironment characterization in gastric cancer identifies prognostic and immunotherapeutically relevant gene signatures. Cancer Immunol. Res. 2019, 7, 737–750. [Google Scholar] [CrossRef] [PubMed]
- Zeng, D.; Zhou, R.; Yu, Y.; Luo, Y.; Zhang, J.; Sun, H.; Bin, J.; Liao, Y.; Rao, J.; Zhang, Y. Gene expression profiles for a prognostic immunoscore in gastric cancer. J. Br. Surg. 2018, 105, 1338–1348. [Google Scholar] [CrossRef] [PubMed]
- Wei, S.; Lu, J.; Lou, J.; Shi, C.; Mo, S.; Shao, Y.; Ni, J.; Zhang, W.; Cheng, X. Gastric cancer tumor microenvironment characterization reveals stromal-related gene signatures associated with macrophage infiltration. Front. Genet. 2020, 11, 663. [Google Scholar] [CrossRef] [PubMed]
- Wang, Q.; Wen, Y.-G.; Li, D.-P.; Xia, J.; Zhou, C.-Z.; Yan, D.-W.; Tang, H.-M.; Peng, Z.-H. Upregulated INHBA expression is associated with poor survival in gastric cancer. Med. Oncol. 2012, 29, 77–83. [Google Scholar] [CrossRef] [PubMed]
- Li, T.; Fan, J.; Wang, B.; Traugh, N.; Chen, Q.; Liu, J.S.; Li, B.; Liu, X.S. TIMER: A web server for comprehensive analysis of tumor-infiltrating immune cells. Cancer Res. 2017, 77, e108–e110. [Google Scholar] [CrossRef] [PubMed]
- Davis, S.; Meltzer, P.S. GEOquery: A bridge between the Gene Expression Omnibus (GEO) and BioConductor. Bioinformatics 2007, 23, 1846–1847. [Google Scholar] [CrossRef] [PubMed]
- Ulgen, E.; Ozisik, O.; Sezerman, O.U. pathfindR: An R package for comprehensive identification of enriched pathways in omics data through active subnetworks. Front. Genet. 2019, 10, 858. [Google Scholar] [CrossRef] [PubMed]
- Kanehisa, M.; Goto, S. KEGG: Kyoto encyclopedia of genes and genomes. Nucleic Acids Res. 2000, 28, 27–30. [Google Scholar] [CrossRef] [PubMed]
- Szklarczyk, D.; Gable, A.L.; Nastou, K.C.; Lyon, D.; Kirsch, R.; Pyysalo, S.; Doncheva, N.T.; Legeay, M.; Fang, T.; Bork, P. The STRING database in 2021: Customizable protein–protein networks, and functional characterization of user-uploaded gene/measurement sets. Nucleic Acids Res. 2021, 49, D605–D612. [Google Scholar] [CrossRef]
- Doncheva, N.T.; Morris, J.H.; Gorodkin, J.; Jensen, L.J. Cytoscape StringApp: Network analysis and visualization of proteomics data. J. Proteome Res. 2018, 18, 623–632. [Google Scholar] [CrossRef]
- Anaya, J. OncoLnc: Linking TCGA survival data to mRNAs, miRNAs, and lncRNAs. PeerJ Comput. Sci. 2016, 2, e67. [Google Scholar] [CrossRef]
- Li, T.; Fu, J.; Zeng, Z.; Cohen, D.; Li, J.; Chen, Q.; Li, B.; Liu, X.S. TIMER2. 0 for analysis of tumor-infiltrating immune cells. Nucleic Acids Res. 2020, 48, W509–W514. [Google Scholar] [CrossRef] [PubMed]
- Guo, W.; Giancotti, F.G. Integrin signalling during tumour progression. Nat. Rev. Mol. Cell Biol. 2004, 5, 816–826. [Google Scholar] [CrossRef] [PubMed]
- Petit, V.; Thiery, J.-P. Focal adhesions: Structure and dynamics. Biol. Cell 2000, 92, 477–494. [Google Scholar] [CrossRef] [PubMed]
- Peng, K.; Li, S.; Li, Q.; Zhang, C.; Yuan, Y.; Liu, M.; Zhang, L.; Wang, Y.; Yu, S.; Zhang, H. Positive Phospho-Focal Adhesion Kinase in Gastric Cancer Associates With Poor Prognosis After Curative Resection. Front. Oncol. 2022, 12, 953938. [Google Scholar] [CrossRef] [PubMed]
- Gay, L.J.; Felding-Habermann, B. Contribution of platelets to tumour metastasis. Nat. Rev. Cancer 2011, 11, 123–134. [Google Scholar] [CrossRef] [PubMed]
- Palacios-Acedo, A.L.; Mège, D.; Crescence, L.; Dignat-George, F.; Dubois, C.; Panicot-Dubois, L. Platelets, thrombo-inflammation, and cancer: Collaborating with the enemy. Front. Immunol. 2019, 10, 1805. [Google Scholar] [CrossRef] [PubMed]
- Ferroni, P.; Martini, F.; Portarena, I.; Grenga, I.; Riondino, S.; La Farina, F.; Laudisi, A.; Roselli, M.; Guadagni, F. An activated protein C-dependent thrombin generation assay predicts chemotherapy-associated venous thromboembolism in cancer patients. Thromb. Haemost. 2011, 105, 931–932. [Google Scholar] [PubMed]
- Meikle, C.K.; Kelly, C.A.; Garg, P.; Wuescher, L.M.; Ali, R.A.; Worth, R.G. Cancer and thrombosis: The platelet perspective. Front. Cell Dev. Biol. 2017, 4, 147. [Google Scholar] [CrossRef]
- Asai, K.; Hirabayashi, T.; Houjou, T.; Uozumi, N.; Taguchi, R.; Shimizu, T. Human group IVC phospholipase A2 (cPLA2γ): Roles in the membrane remodeling and activation induced by oxidative stress. J. Biol. Chem. 2003, 278, 8809–8814. [Google Scholar] [CrossRef]
- Albini, A.; Magnani, E.; Noonan, D. The tumor microenvironment: Biology of a complex cellular and tissue society. Q. J. Nucl. Med. Mol. Imaging 2010, 54, 244–248. [Google Scholar] [PubMed]
- Sun, H.; Wang, X.; Wang, X.; Xu, M.; Sheng, W. The role of cancer-associated fibroblasts in tumorigenesis of gastric cancer. Cell Death Dis. 2022, 13, 874. [Google Scholar] [CrossRef] [PubMed]
- Orimo, A.; Gupta, P.B.; Sgroi, D.C.; Arenzana-Seisdedos, F.; Delaunay, T.; Naeem, R.; Carey, V.J.; Richardson, A.L.; Weinberg, R.A. Stromal fibroblasts present in invasive human breast carcinomas promote tumor growth and angiogenesis through elevated SDF-1/CXCL12 secretion. Cell 2005, 121, 335–348. [Google Scholar] [CrossRef] [PubMed]
- Cui, X.; Shan, T.; Qiao, L. Collagen type IV alpha 1 (COL4A1) silence hampers the invasion, migration and epithelial–mesenchymal transition (EMT) of gastric cancer cells through blocking Hedgehog signaling pathway. Bioengineered 2022, 13, 8972–8981. [Google Scholar] [CrossRef] [PubMed]
- Izumi, D.; Ishimoto, T.; Miyake, K.; Sugihara, H.; Eto, K.; Sawayama, H.; Yasuda, T.; Kiyozumi, Y.; Kaida, T.; Kurashige, J. CXCL12/CXCR4 activation by cancer-associated fibroblasts promotes integrin β1 clustering and invasiveness in gastric cancer. Int. J. Cancer 2016, 138, 1207–1219. [Google Scholar] [CrossRef] [PubMed]
- Zhang, H.; Deng, T.; Liu, R.; Ning, T.; Yang, H.; Liu, D.; Zhang, Q.; Lin, D.; Ge, S.; Bai, M. CAF secreted miR-522 suppresses ferroptosis and promotes acquired chemo-resistance in gastric cancer. Mol. Cancer 2020, 19, 43. [Google Scholar] [CrossRef] [PubMed]
- Liu, X.; Yao, L.; Qu, J.; Liu, L.; Lu, N.; Wang, J.; Zhang, J. Cancer-associated fibroblast infiltration in gastric cancer: The discrepancy in subtypes pathways and immunosuppression. J. Transl. Med. 2021, 19, 325. [Google Scholar] [CrossRef] [PubMed]
- Trujillo, J.A.; Sweis, R.F.; Bao, R.; Luke, J.J. T cell–inflamed versus non-T cell–inflamed tumors: A conceptual framework for cancer immunotherapy drug development and combination therapy selection. Cancer Immunol. Res. 2018, 6, 990–1000. [Google Scholar] [CrossRef] [PubMed]
- Galon, J.; Bruni, D. Approaches to treat immune hot, altered and cold tumours with combination immunotherapies. Nat. Rev. Drug Discov. 2019, 18, 197–218. [Google Scholar] [CrossRef]
- Nolz, J.C. Molecular mechanisms of CD8+ T cell trafficking and localization. Cell. Mol. Life Sci. 2015, 72, 2461–2473. [Google Scholar] [CrossRef]
- Slaney, C.Y.; Kershaw, M.H.; Darcy, P.K. Trafficking of T cells into tumors. Cancer Res. 2014, 74, 7168–7174. [Google Scholar] [CrossRef] [PubMed]
- Li, F.; Li, C.; Cai, X.; Xie, Z.; Zhou, L.; Cheng, B.; Zhong, R.; Xiong, S.; Li, J.; Chen, Z. The association between CD8+ tumor-infiltrating lymphocytes and the clinical outcome of cancer immunotherapy: A systematic review and meta-analysis. EClinicalMedicine 2021, 41, 101134. [Google Scholar] [CrossRef] [PubMed]
- Cui, C.; Zhang, D.; Sun, K.; Zhu, Y.; Xu, J.; Kang, Y.; Zhang, G.; Cai, Y.; Mao, S.; Long, R.; et al. Propofol maintains Th17/Treg cell balance in elderly patients undergoing lung cancer surgery through GABAA receptor. BMC Immunol. 2022, 23, 58. [Google Scholar] [CrossRef] [PubMed]
- Ginhoux, F.; Jung, S. Monocytes and macrophages: Developmental pathways and tissue homeostasis. Nat. Rev. Immunol. 2014, 14, 392–404. [Google Scholar] [CrossRef] [PubMed]
- Chanmee, T.; Ontong, P.; Konno, K.; Itano, N. Tumor-associated macrophages as major players in the tumor microenvironment. Cancers 2014, 6, 1670–1690. [Google Scholar] [CrossRef] [PubMed]
- Lee, K.Y. M1 and M2 polarization of macrophages: A mini-review. Med. Biol. Sci. Eng. 2019, 2, 1–5. [Google Scholar] [CrossRef]
- Wang, N.; Liang, H.; Zen, K. Molecular mechanisms that influence the macrophage M1–M2 polarization balance. Front. Immunol. 2014, 5, 614. [Google Scholar] [CrossRef] [PubMed]
- Gao, J.; Liang, Y.; Wang, L. Shaping polarization of tumor-associated macrophages in cancer immunotherapy. Front. Immunol. 2022, 13, 888713. [Google Scholar] [CrossRef] [PubMed]
- Schulz, C.; Perdiguero, E.G.; Chorro, L.; Szabo-Rogers, H.; Cagnard, N.; Kierdorf, K.; Prinz, M.; Wu, B.; Jacobsen, S.E.W.; Pollard, J.W. A lineage of myeloid cells independent of Myb and hematopoietic stem cells. Science 2012, 336, 86–90. [Google Scholar] [CrossRef]
- Gabrilovich, D.I.; Ostrand-Rosenberg, S.; Bronte, V. Coordinated regulation of myeloid cells by tumours. Nat. Rev. Immunol. 2012, 12, 253–268. [Google Scholar] [CrossRef]
- Solito, S.; Bronte, V.; Mandruzzato, S. Antigen specificity of immune suppression by myeloid-derived suppressor cells. J. Leukoc. Biol. 2011, 90, 31–36. [Google Scholar] [CrossRef] [PubMed]
- Yang, Z.; Guo, J.; Weng, L.; Tang, W.; Jin, S.; Ma, W. Myeloid-derived suppressor cells—New and exciting players in lung cancer. J. Hematol. Oncol. 2020, 13, 10. [Google Scholar] [CrossRef] [PubMed]
- Gabitass, R.F.; Annels, N.E.; Stocken, D.D.; Pandha, H.A.; Middleton, G.W. Elevated myeloid-derived suppressor cells in pancreatic, esophageal and gastric cancer are an independent prognostic factor and are associated with significant elevation of the Th2 cytokine interleukin-13. Cancer Immunol. Immunother. 2011, 60, 1419–1430. [Google Scholar] [CrossRef] [PubMed]
- Banchereau, J.; Steinman, R.M. Dendritic cells and the control of immunity. Nature 1998, 392, 245–252. [Google Scholar] [CrossRef]
- Kurts, C.; Robinson, B.W.; Knolle, P.A. Cross-priming in health and disease. Nat. Rev. Immunol. 2010, 10, 403–414. [Google Scholar] [CrossRef] [PubMed]
- Melief, C.J. Cancer immunotherapy by dendritic cells. Immunity 2008, 29, 372–383. [Google Scholar] [CrossRef] [PubMed]
- Gottfried, E.; Kreutz, M.; Mackensen, A. Tumor-induced modulation of dendritic cell function. Cytokine Growth Factor Rev. 2008, 19, 65–77. [Google Scholar] [CrossRef] [PubMed]
- Zong, J.; Keskinov, A.A.; Shurin, G.V.; Shurin, M.R. Tumor-derived factors modulating dendritic cell function. Cancer Immunol. Immunother. 2016, 65, 821–833. [Google Scholar] [CrossRef] [PubMed]
- Bandola-Simon, J.; Roche, P.A. Dysfunction of antigen processing and presentation by dendritic cells in cancer. Mol. Immunol. 2019, 113, 31–37. [Google Scholar] [CrossRef]
- Chrisikos, T.T.; Zhou, Y.; Slone, N.; Babcock, R.; Watowich, S.S.; Li, H.S. Molecular regulation of dendritic cell development and function in homeostasis, inflammation, and cancer. Mol. Immunol. 2019, 110, 24–39. [Google Scholar] [CrossRef]
- Gupta, Y.H.; Khanom, A.; Acton, S.E. Control of dendritic cell function within the tumour microenvironment. Front. Immunol. 2022, 13, 733800. [Google Scholar] [CrossRef] [PubMed]
- Mitrović, S.; Mitrović, D.; Todorović, V. Fibronectin—A multifunctional glycoprotein. Srp. Arh. Za Celok. Lek. 1995, 123, 198–201. [Google Scholar]
- Pankov, R.; Yamada, K.M. Fibronectin at a glance. J. Cell Sci. 2002, 115, 3861–3863. [Google Scholar] [CrossRef] [PubMed]
- Grinnell, F.; Billingham, R.E.; Burgess, L. Distribution of fibronectin during wound healing in vivo. J. Investig. Dermatol. 1981, 76, 181–189. [Google Scholar] [CrossRef] [PubMed]
- Liu, J.; Ma, L.; Chen, Z.; Song, Y.; Gu, T.; Liu, X.; Zhao, H.; Yao, N. Identification of critical genes in gastric cancer to predict prognosis using bioinformatics analysis methods. Ann. Transl. Med. 2020, 8, 14. [Google Scholar] [CrossRef]
- Ucaryilmaz Metin, C.; Ozcan, G. Comprehensive bioinformatic analysis reveals a cancer-associated fibroblast gene signature as a poor prognostic factor and potential therapeutic target in gastric cancer. BMC Cancer 2022, 22, 692. [Google Scholar] [CrossRef] [PubMed]
- Gelse, K.; Pöschl, E.; Aigner, T. Collagens—Structure, function, and biosynthesis. Adv. Drug Deliv. Rev. 2003, 55, 1531–1546. [Google Scholar] [CrossRef] [PubMed]
- Adams, J.C.; Lawler, J. The thrombospondins. Int. J. Biochem. Cell Biol. 2004, 36, 961–968. [Google Scholar] [CrossRef] [PubMed]
- Liao, X.; Wang, W.; Yu, B.; Tan, S. Thrombospondin-2 acts as a bridge between tumor extracellular matrix and immune infiltration in pancreatic and stomach adenocarcinomas: An integrative pan-cancer analysis. Cancer Cell Int. 2022, 22, 213. [Google Scholar] [CrossRef]
- Zhang, S.; Yang, H.; Xiang, X.; Liu, L.; Huang, H.; Tang, G. THBS2 is closely related to the poor prognosis and immune cell infiltration of gastric cancer. Front. Genet. 2022, 13, 803460. [Google Scholar] [CrossRef]
- Chen, D.; Qin, Y.; Dai, M.; Li, L.; Liu, H.; Zhou, Y.; Qiu, C.; Chen, Y.; Jiang, Y. BGN and COL11A1 regulatory network analysis in colorectal cancer (CRC) reveals that BGN influences CRC cell biological functions and interacts with miR-6828-5p. Cancer Manag. Res. 2020, 12, 13051–13069. [Google Scholar] [CrossRef] [PubMed]
- Cooper, J.; Giancotti, F.G. Integrin signaling in cancer: Mechanotransduction, stemness, epithelial plasticity, and therapeutic resistance. Cancer Cell 2019, 35, 347–367. [Google Scholar] [CrossRef] [PubMed]
- Moreno-Layseca, P.; Icha, J.; Hamidi, H.; Ivaska, J. Integrin trafficking in cells and tissues. Nat. Cell Biol. 2019, 21, 122–132. [Google Scholar] [CrossRef] [PubMed]
- Chen, W.; Yang, Z. Identification of differentially expressed genes reveals BGN predicting overall survival and tumor immune infiltration of gastric cancer. Comput. Math. Methods Med. 2021, 2021, 5494840. [Google Scholar] [CrossRef]
- Zhang, S.; Yang, H.; Xiang, X.; Liu, L.; Huang, H.; Tang, G. BGN may be a potential prognostic biomarker and associated with immune cell enrichment of gastric cancer. Front. Genet. 2022, 13, 765569. [Google Scholar] [CrossRef]


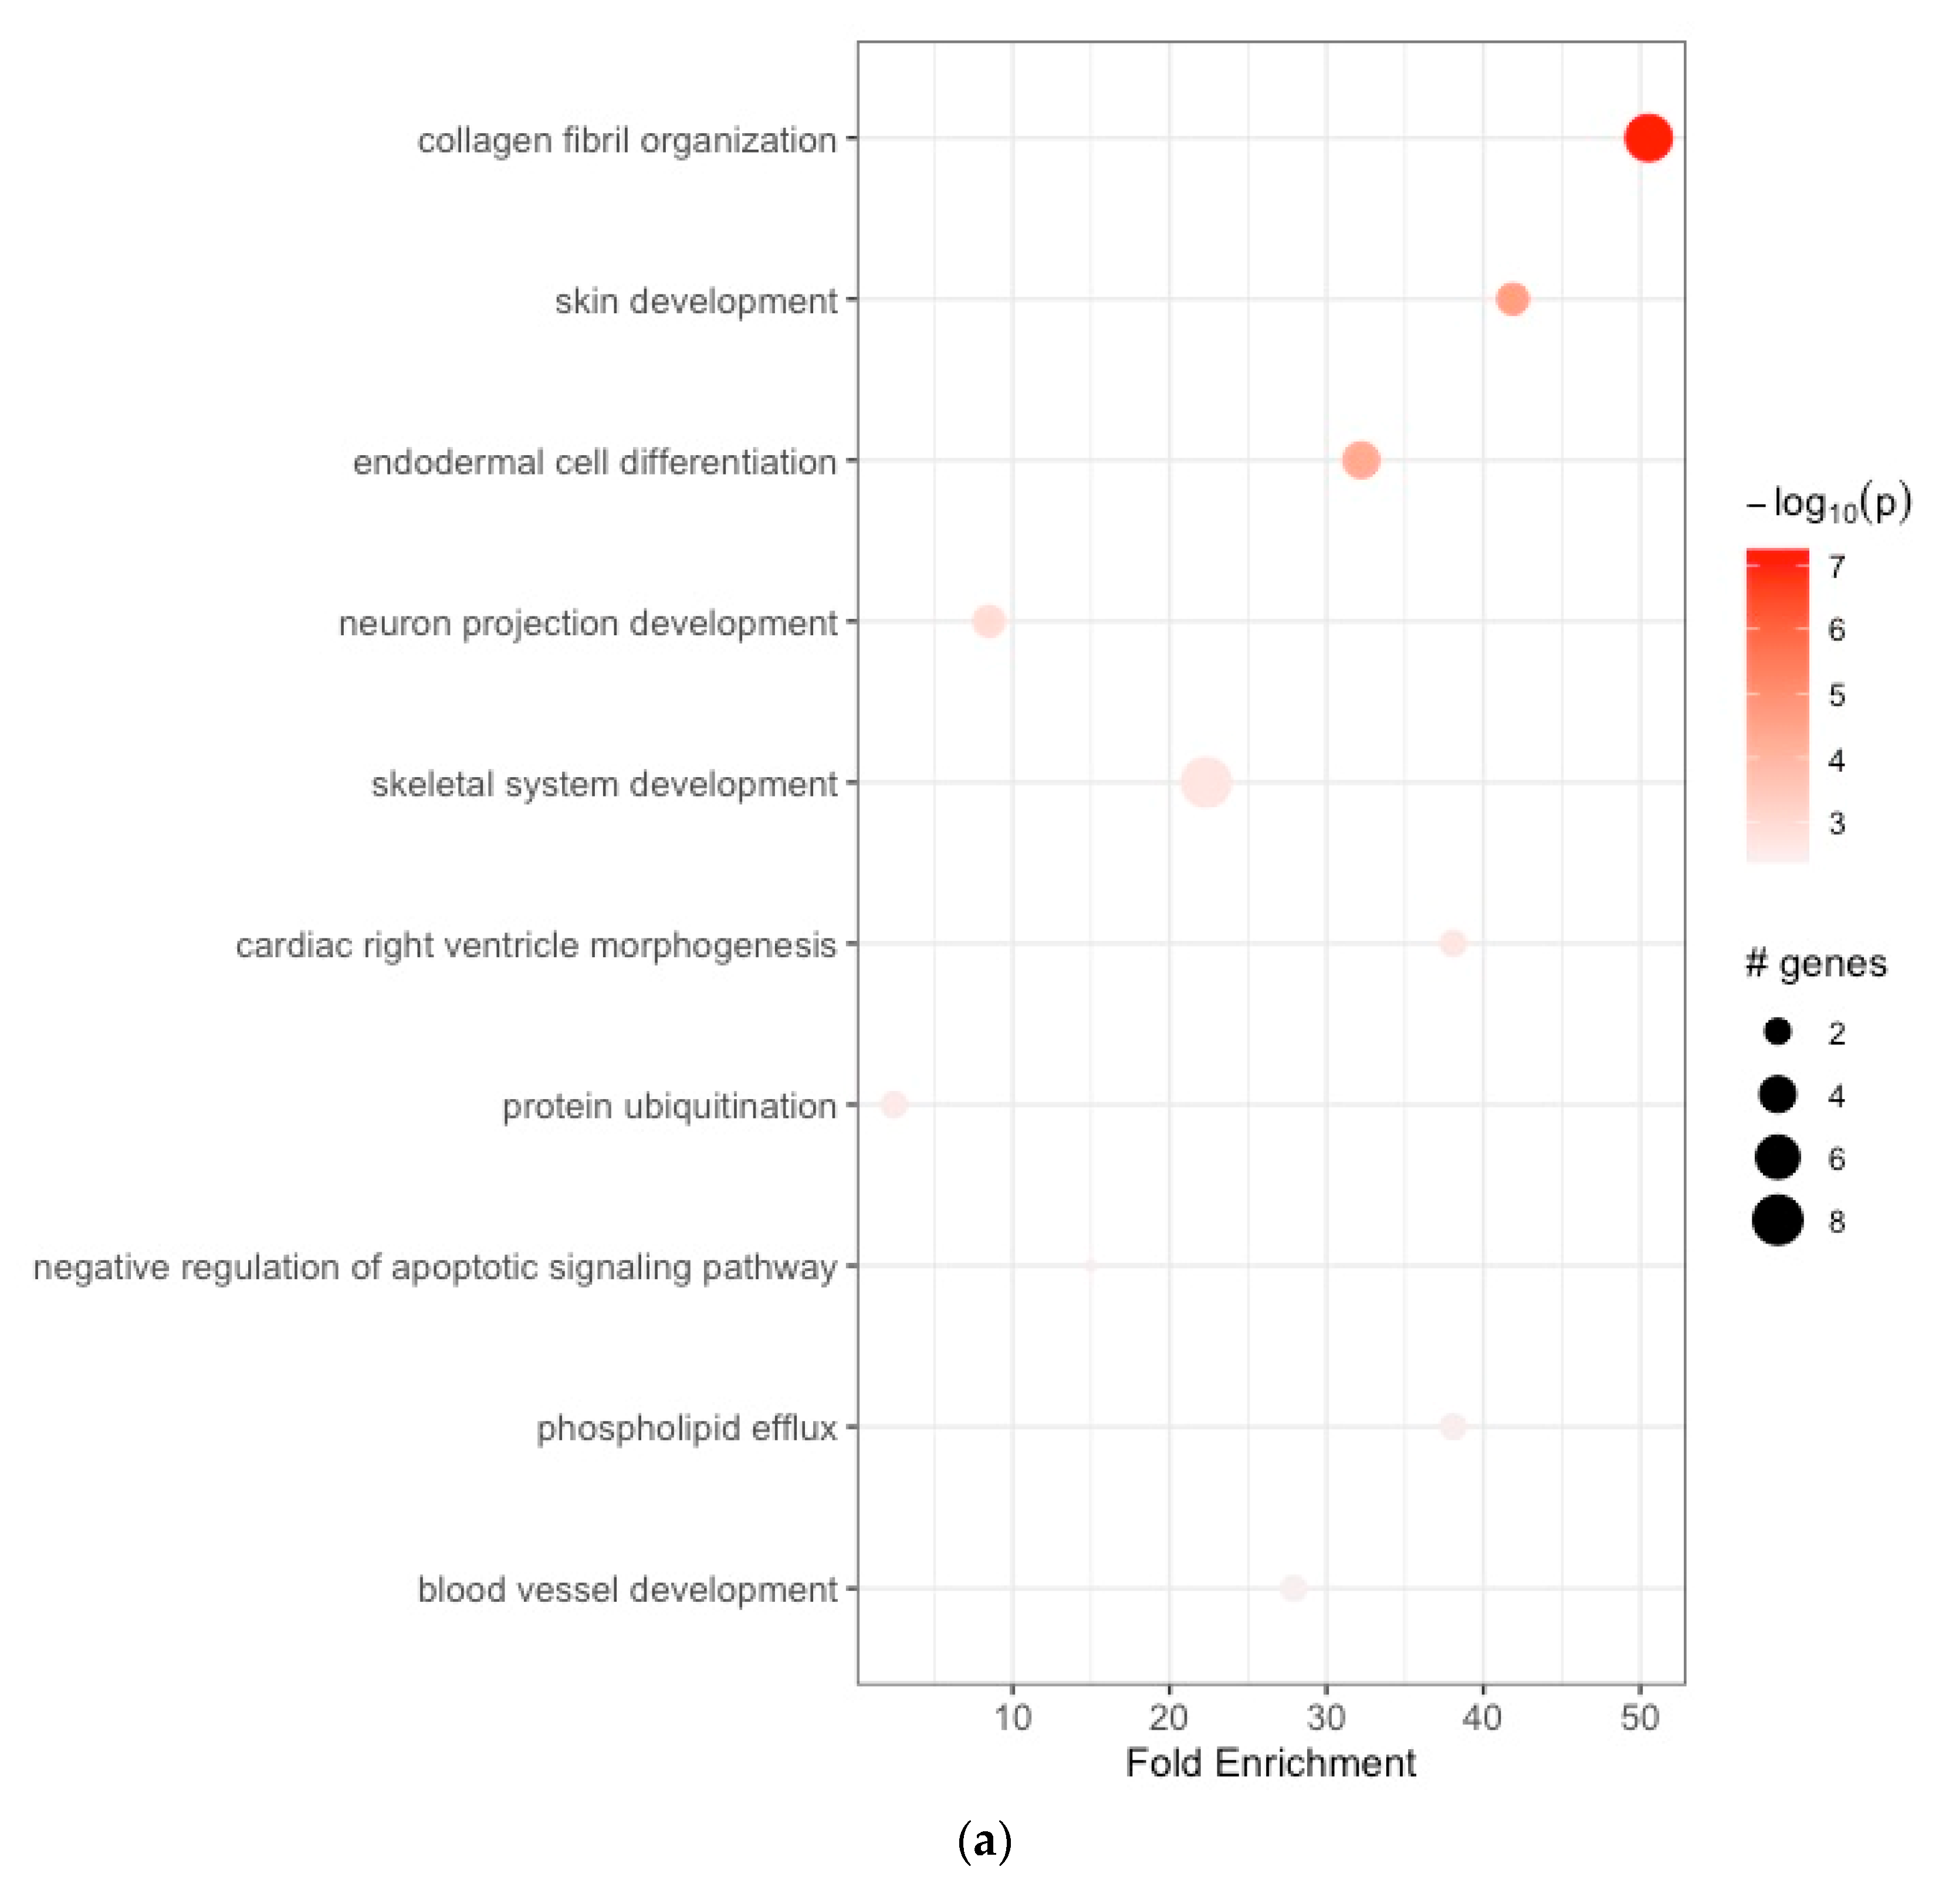
| (a) | ||||||||
|---|---|---|---|---|---|---|---|---|
| ID | Term_Description | Fold_Enrichment | Occurrence | Support | Lowest_p | Highest_p | Up_Regulated | |
| 1 | GO:0030199 | collagen fibril organization | 50.540767 | 10 | 0.065658240 | 5.736930e-08 | 5.736930e-08 | BMP1, COL1A1, COL1A2, COL3A1, COL5A1, COL5A2, ADAMTS2 |
| 2 | GO:0043588 | skin development | 41.876636 | 10 | 0.025253169 | 2.297293e-05 | 2.297293e-05 | COL3A1, COL5A1, COL5A2 |
| 3 | GO:0035987 | endodermal cell differentiation | 32.212797 | 10 | 0.030456853 | 4.686940e-05 | 4.686940e-05 | COL8A1, COL12A1, FN1, INHBA |
| 4 | GO:0031175 | neuron projection development | 8.488507 | 10 | 0.010101268 | 1.162934e-03 | 1.162934e-03 | APOE, MYOC, SH3GL2 |
| 5 | GO:0001501 | skeletal system development | 22.334206 | 10 | 0.005050634 | 2.114611e-03 | 2.114611e-03 | COL1A1, COL1A2, COL10A1, FBN1, HOXA13, TNFRSF11B, SOX4, TEAD4 |
| 6 | GO:0003215 | cardiac right ventricle morphogenesis | 38.069669 | 10 | 0.012719036 | 2.225033e-03 | 5.559604e-03 | GATA4, SOX4 |
| 7 | GO:0016567 | protein ubiquitination | 2.448926 | 10 | 0.010101268 | 2.942256e-03 | 2.942256e-03 | NFE2L2, KLHL25 |
| 8 | GO:2001234 | negative regulation of apoptotic signaling pathway | 14.955941 | 10 | 0.005050634 | 3.680761e-03 | 3.680761e-03 | GATA4 |
| 9 | GO:0033700 | phospholipid efflux | 38.069669 | 10 | 0.005050634 | 3.707395e-03 | 3.707395e-03 | APOC1, APOE |
| 10 | GO:0001568 | blood vessel development | 27.917757 | 10 | 0.025253169 | 4.246779e-03 | 4.246779e-03 | COL1A1, COL1A2 |
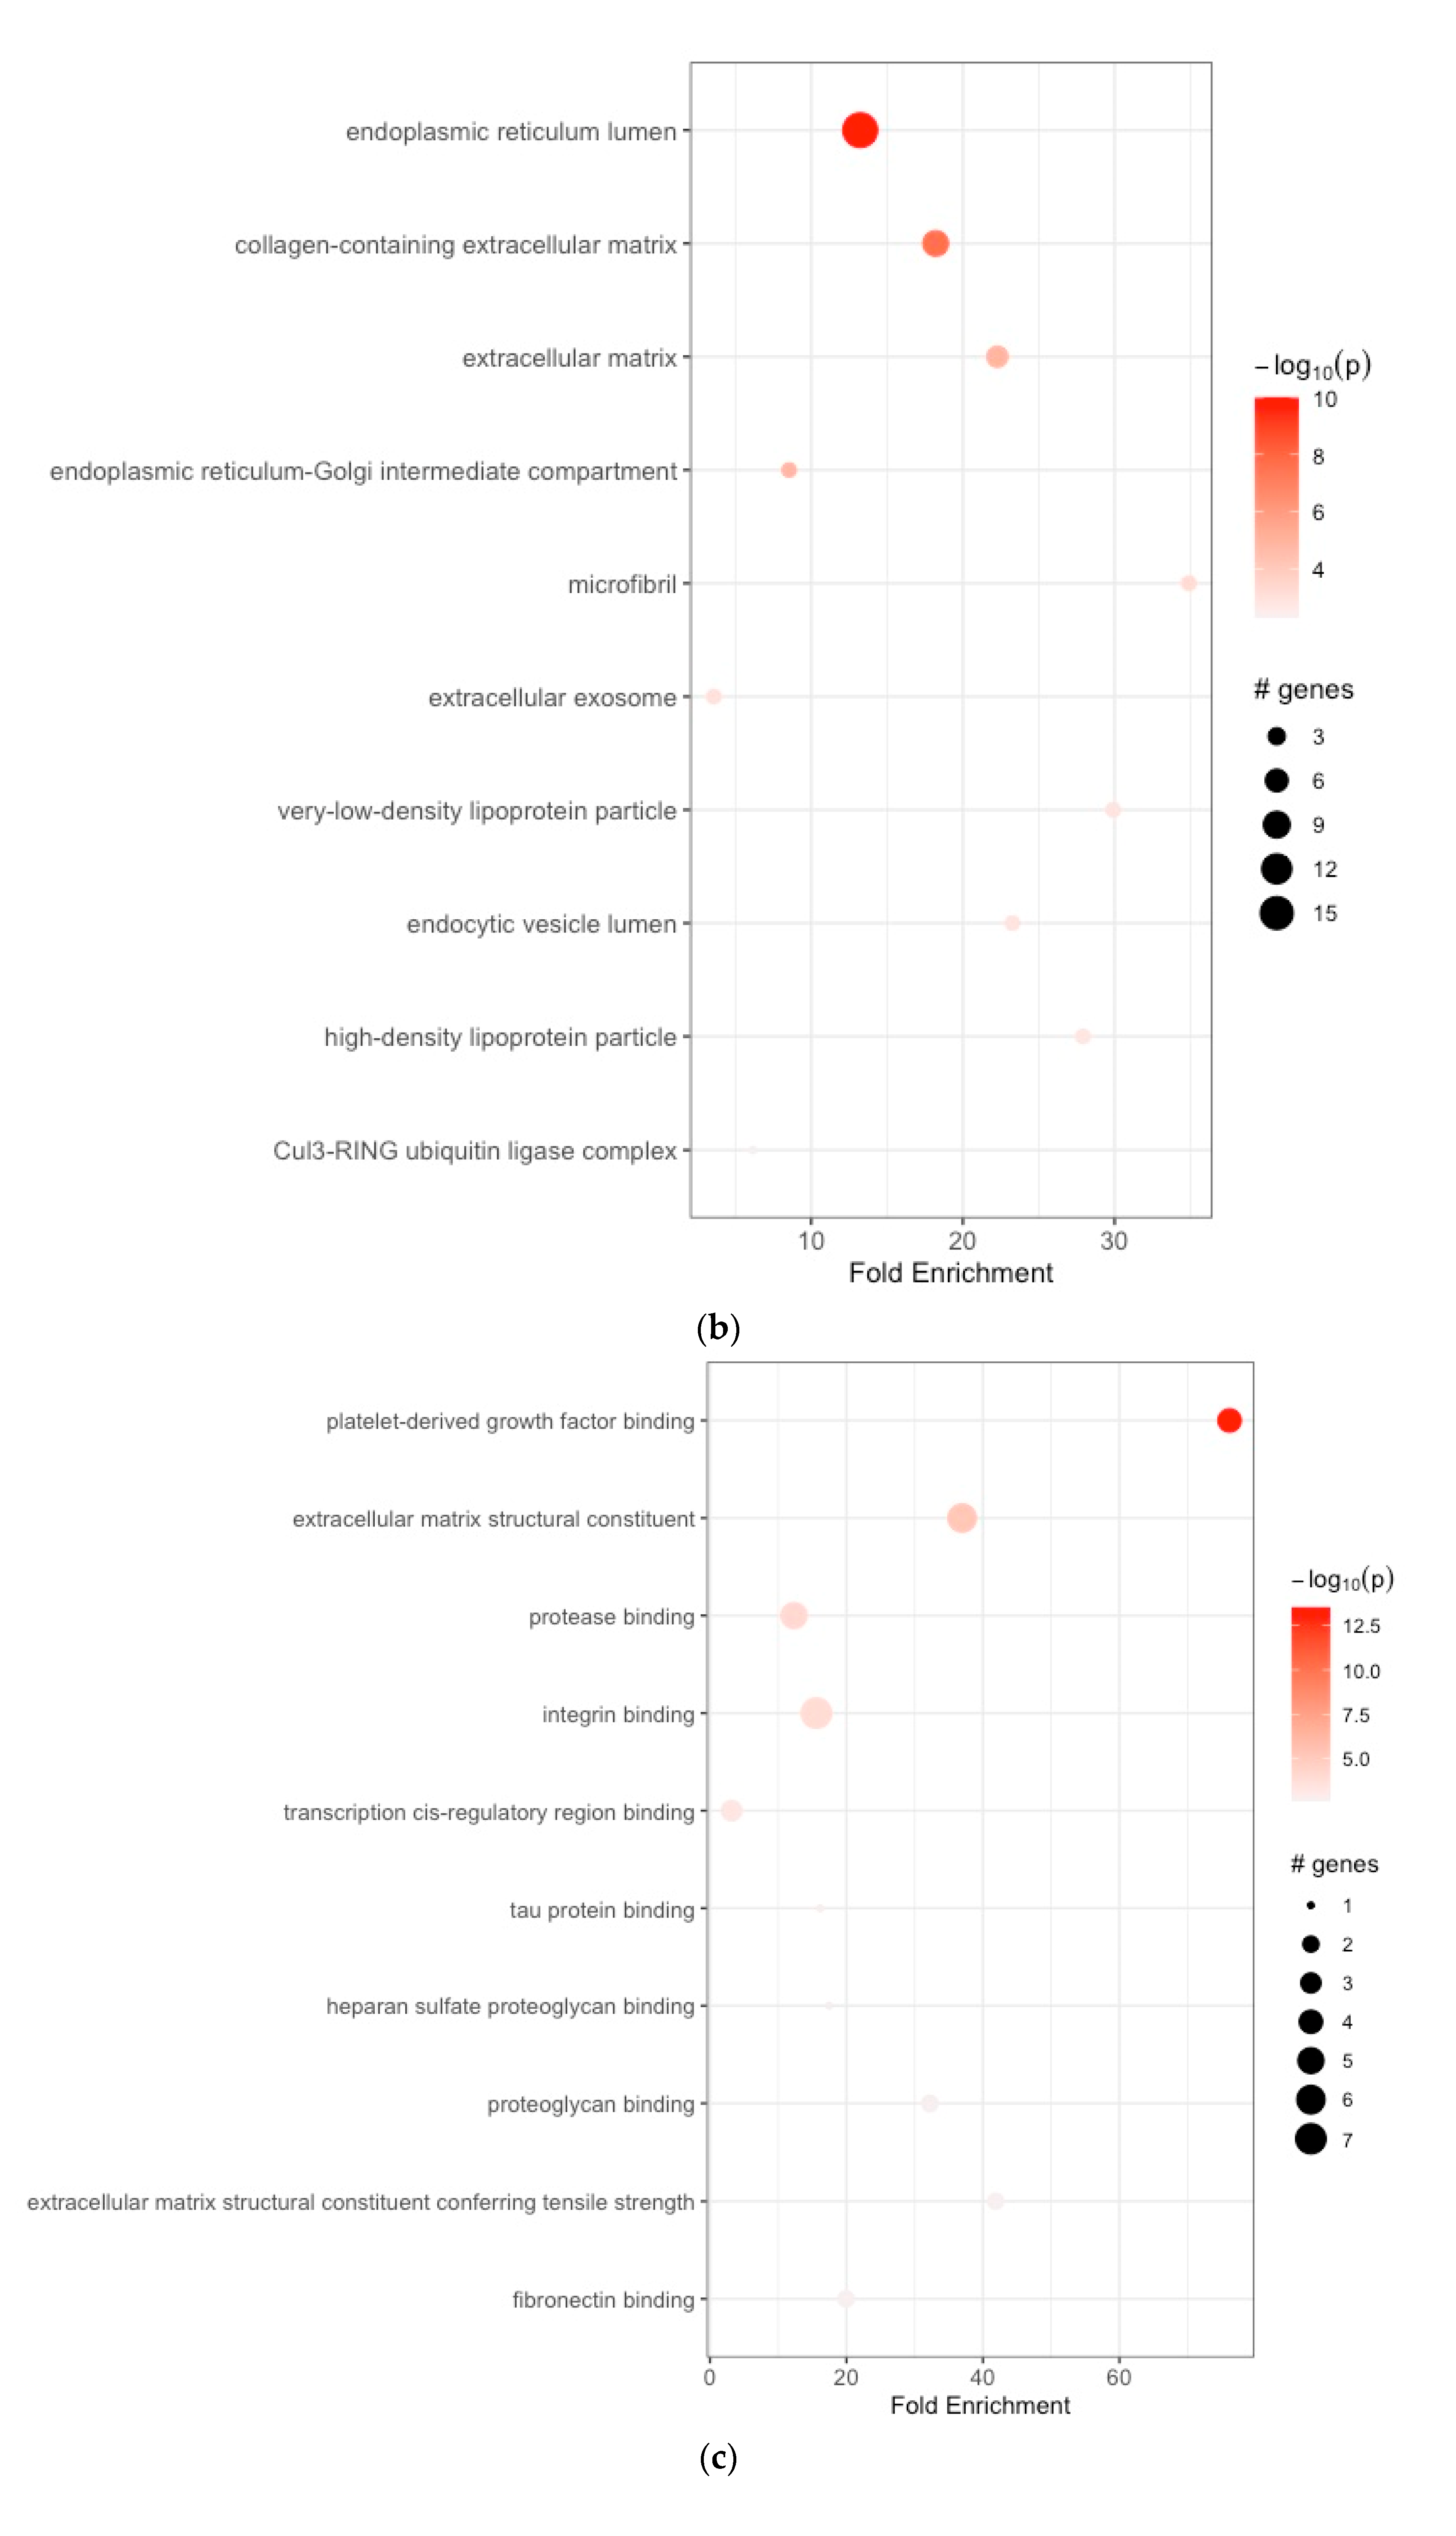
| (b) | ||||||||
| 1 | GO:0005788 | endoplasmic reticulum lumen | 13.232394 | 10 | 0.180195851 | 9.961557e-11 | 9.961557e-11 | APOE, SERPINH1, COL1A1, COL1A2, COL3A1, COL5A1, COL5A2, COL6A3, COL8A1, COL10A1, COL12A1, FBN1, FN1, IGFBP4, SPP1, TIMP1, P4HA3 |
| 2 | GO:0062023 | collagen-containing extracellular matrix | 18.207233 | 10 | 0.085860776 | 2.192636e-08 | 2.192636e-08 | BGN, COL1A1, COL3A1, COL5A1, COL6A3, FN1, MYOC, SFRP2 |
| 3 | GO:0031012 | extracellular matrix | 22.274806 | 10 | 0.095477387 | 1.306355e-05 | 1.306355e-05 | APOE, COL6A3, ELN, FBN1, FN1 |
| 4 | GO:0005793 | endoplasmic reticulum–Golgi intermediate compartment | 8.546252 | 10 | 0.050761421 | 1.484223e-05 | 7.398274e-05 | SERPINH1, FN1 |
| 5 | GO:0001527 | microfibril | 34.897196 | 10 | 0.015267274 | 5.961104e-04 | 9.932217e-04 | FBN1, MFAP2 |
| 6 | GO:0070062 | extracellular exosome | 3.579200 | 10 | 0.010101268 | 1.037442e-03 | 1.037442e-03 | APOE, FN1 |
| 7 | GO:0034361 | very-low-density lipoprotein particle | 29.911883 | 10 | 0.005050634 | 1.369197e-03 | 1.369197e-03 | APOC1, APOE |
| 8 | GO:0071682 | endocytic vesicle lumen | 23.264798 | 10 | 0.010050251 | 1.381399e-03 | 6.434259e-03 | APOE, SPARC |
| 9 | GO:0034364 | high-density lipoprotein particle | 27.917757 | 10 | 0.005050634 | 1.579702e-03 | 1.579702e-03 | APOC1, APOE |
| 10 | GO:0031463 | Cul3-RING ubiquitin ligase complex | 6.158329 | 10 | 0.010101268 | 5.060305e-03 | 5.060305e-03 | KLHL25 |
| (c) | ||||||||
| 1 | GO:0048407 | platelet-derived growth factor binding | 76.139337 | 10 | 0.055556973 | 2.976699e-14 | 2.976699e-14 | COL1A1, COL1A2, COL3A1, COL5A1 |
| 2 | GO:0005201 | extracellular matrix structural constituent | 36.949973 | 10 | 0.106063311 | 6.443542e-06 | 6.443542e-06 | COL3A1, ELN, FBN1, FN1, MUC5AC, NID2 |
| 3 | GO:0002020 | protease binding | 12.316658 | 10 | 0.085860776 | 9.474422e-05 | 1.288232e-04 | COL1A1, COL1A2, COL3A1, FAP, FN1 |
| 4 | GO:0005178 | integrin binding | 15.592364 | 10 | 0.025253169 | 1.422341e-04 | 1.440477e-04 | COL3A1, FAP, FBN1, FN1, SFRP2, SPP1, THY1 |
| 5 | GO:0000976 | transcription cis-regulatory region binding | 3.172472 | 10 | 0.010101268 | 6.020621e-04 | 6.733792e-03 | GATA4, NFE2L2, SOX4 |
| 6 | GO:0048156 | tau protein binding | 16.106398 | 10 | 0.010101268 | 1.568042e-03 | 1.568042e-03 | APOE |
| 7 | GO:0043395 | heparan sulfate proteoglycan binding | 17.448598 | 10 | 0.005050634 | 1.989792e-03 | 1.989792e-03 | APOE |
| 8 | GO:0043394 | proteoglycan binding | 32.212797 | 10 | 0.025253169 | 2.351293e-03 | 2.351293e-03 | COL5A1, FN1 |
| 9 | GO:0030020 | extracellular matrix structural constituent conferring tensile strength | 41.876636 | 10 | 0.005050634 | 2.531860e-03 | 2.531860e-03 | COL1A1, COL6A3 |
| 10 | GO:0001968 | fibronectin binding | 19.941255 | 10 | 0.005050634 | 2.532614e-03 | 2.532614e-03 | MYOC, SFRP2 |
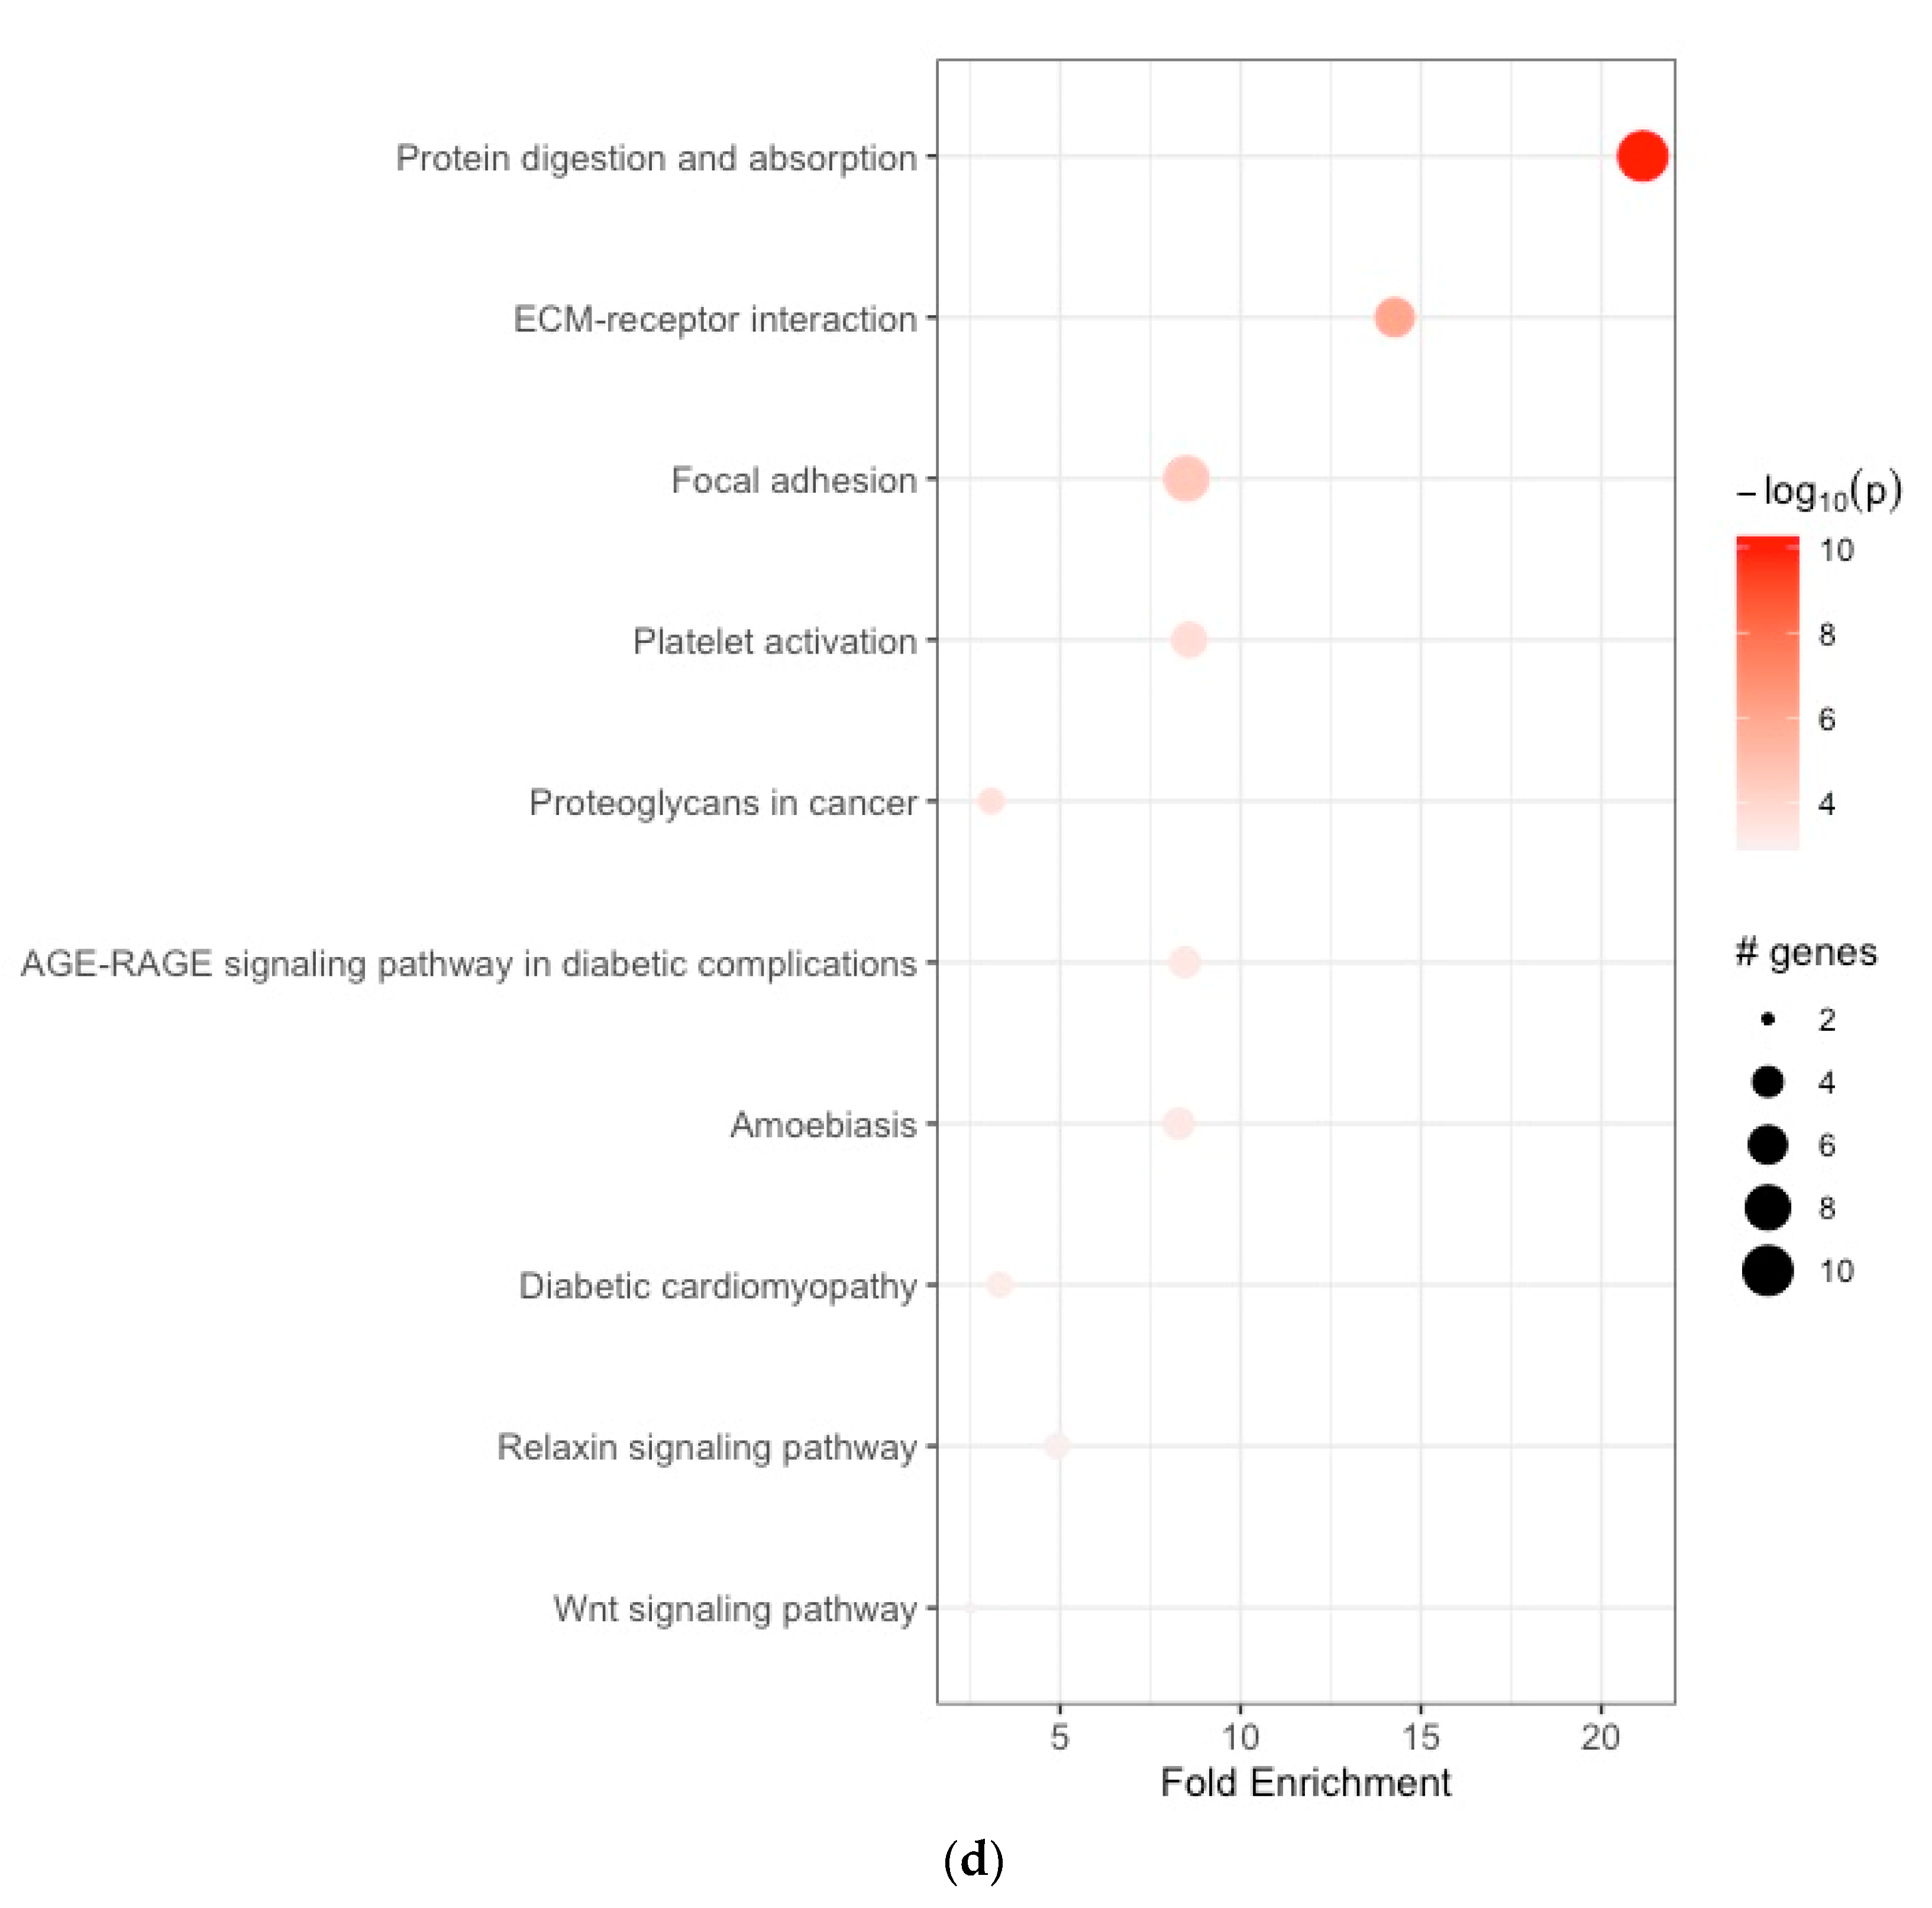
| (d) | ||||||||
| 1 | hsa04974 | protein digestion and absorption | 21.149816 | 10 | 0.100502513 | 5.555187e-11 | 5.555187e-11 | ELN, COL1A1, COL1A2, COL3A1, COL5A1, COL5A2, COL6A3, COL8A1, COL10A1, COL12A1 |
| 2 | hsa04512 | ECM–receptor interaction | 14.276126 | 10 | 0.061069098 | 1.036954e-06 | 1.036954e-06 | COL1A1, COL1A2, COL6A3, THBS2, FN1, SPP1 |
| 3 | hsa04510 | focal adhesion | 8.502870 | 10 | 0.035354437 | 2.685352e-05 | 2.685352e-05 | COL1A1, COL1A2, COL6A3, THBS2, FN1, SPP1, PGF, TLN2 |
| 4 | hsa04611 | platelet activation | 8.581278 | 10 | 0.010101268 | 1.964620e-04 | 1.964620e-04 | TLN2, COL1A1, COL1A2, COL3A1, PLA2G4C |
| 5 | hsa05205 | proteoglycans in cancer | 3.094333 | 10 | 0.015151902 | 2.490706e-04 | 2.490706e-04 | COL1A1, COL1A2, FN1 |
| 6 | hsa04933 | AGE-RAGE signaling pathway in diabetic complications | 8.459926 | 10 | 0.055556973 | 5.189137e-04 | 5.189137e-04 | FN1, COL1A1, COL1A2, COL3A1 |
| 7 | hsa05146 | amoebiasis | 8.292403 | 10 | 0.055556973 | 5.512279e-04 | 5.512279e-04 | COL1A1, COL1A2, FN1, COL3A1 |
| 8 | hsa05415 | diabetic cardiomyopathy | 3.323543 | 10 | 0.010101268 | 7.352484e-04 | 7.352484e-04 | COL1A1, COL1A2, COL3A1 |
| 9 | hsa04926 | relaxin signaling pathway | 4.907418 | 10 | 0.010101268 | 1.126101e-03 | 1.126101e-03 | COL1A1, COL1A2, COL3A1 |
| 10 | hsa04310 | Wnt signaling pathway | 2.507583 | 10 | 0.005050634 | 1.259368e-03 | 1.259368e-03 | SFRP2, SFRP4 |
Disclaimer/Publisher’s Note: The statements, opinions and data contained in all publications are solely those of the individual author(s) and contributor(s) and not of MDPI and/or the editor(s). MDPI and/or the editor(s) disclaim responsibility for any injury to people or property resulting from any ideas, methods, instructions or products referred to in the content. |
© 2024 by the authors. Licensee MDPI, Basel, Switzerland. This article is an open access article distributed under the terms and conditions of the Creative Commons Attribution (CC BY) license (https://creativecommons.org/licenses/by/4.0/).
Share and Cite
Konstantis, G.; Tsaousi, G.; Pourzitaki, C.; Kasper-Virchow, S.; Zaun, G.; Kitsikidou, E.; Passenberg, M.; Tseriotis, V.S.; Willuweit, K.; Schmidt, H.H.; et al. Identification of Key Genes Associated with Tumor Microenvironment Infiltration and Survival in Gastric Adenocarcinoma via Bioinformatics Analysis. Cancers 2024, 16, 1280. https://doi.org/10.3390/cancers16071280
Konstantis G, Tsaousi G, Pourzitaki C, Kasper-Virchow S, Zaun G, Kitsikidou E, Passenberg M, Tseriotis VS, Willuweit K, Schmidt HH, et al. Identification of Key Genes Associated with Tumor Microenvironment Infiltration and Survival in Gastric Adenocarcinoma via Bioinformatics Analysis. Cancers. 2024; 16(7):1280. https://doi.org/10.3390/cancers16071280
Chicago/Turabian StyleKonstantis, Georgios, Georgia Tsaousi, Chryssa Pourzitaki, Stefan Kasper-Virchow, Gregor Zaun, Elisavet Kitsikidou, Moritz Passenberg, Vasilis Spyridon Tseriotis, Katharina Willuweit, Hartmut H. Schmidt, and et al. 2024. "Identification of Key Genes Associated with Tumor Microenvironment Infiltration and Survival in Gastric Adenocarcinoma via Bioinformatics Analysis" Cancers 16, no. 7: 1280. https://doi.org/10.3390/cancers16071280
APA StyleKonstantis, G., Tsaousi, G., Pourzitaki, C., Kasper-Virchow, S., Zaun, G., Kitsikidou, E., Passenberg, M., Tseriotis, V. S., Willuweit, K., Schmidt, H. H., & Rashidi-Alavijeh, J. (2024). Identification of Key Genes Associated with Tumor Microenvironment Infiltration and Survival in Gastric Adenocarcinoma via Bioinformatics Analysis. Cancers, 16(7), 1280. https://doi.org/10.3390/cancers16071280