
Expression of Mitochondrial Long Non-Coding RNAs, MDL1 and MDL1AS, Are Good Prognostic and/or Diagnostic Biomarkers for Several Cancers, Including Colorectal Cancer

 , ,
, ,  and
and 
Abstract
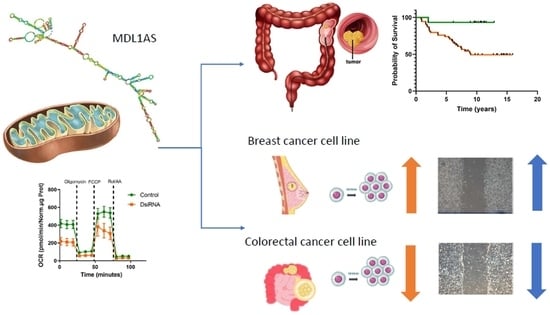
Simple Summary
Abstract
1. Introduction
2. Materials and Methods
2.1. Data Mining
2.2. Mitochondrial Reference Genome Edition and Bioinformatics
2.3. Patients
2.4. Cell Lines and Culture
2.5. Gene Downregulation
2.6. RNA Extraction and qRT-PCR
2.7. Mitochondrial Metabolism
2.8. Proliferation Assay
2.9. Migration Assay
2.10. Statistical Analysis
3. Results
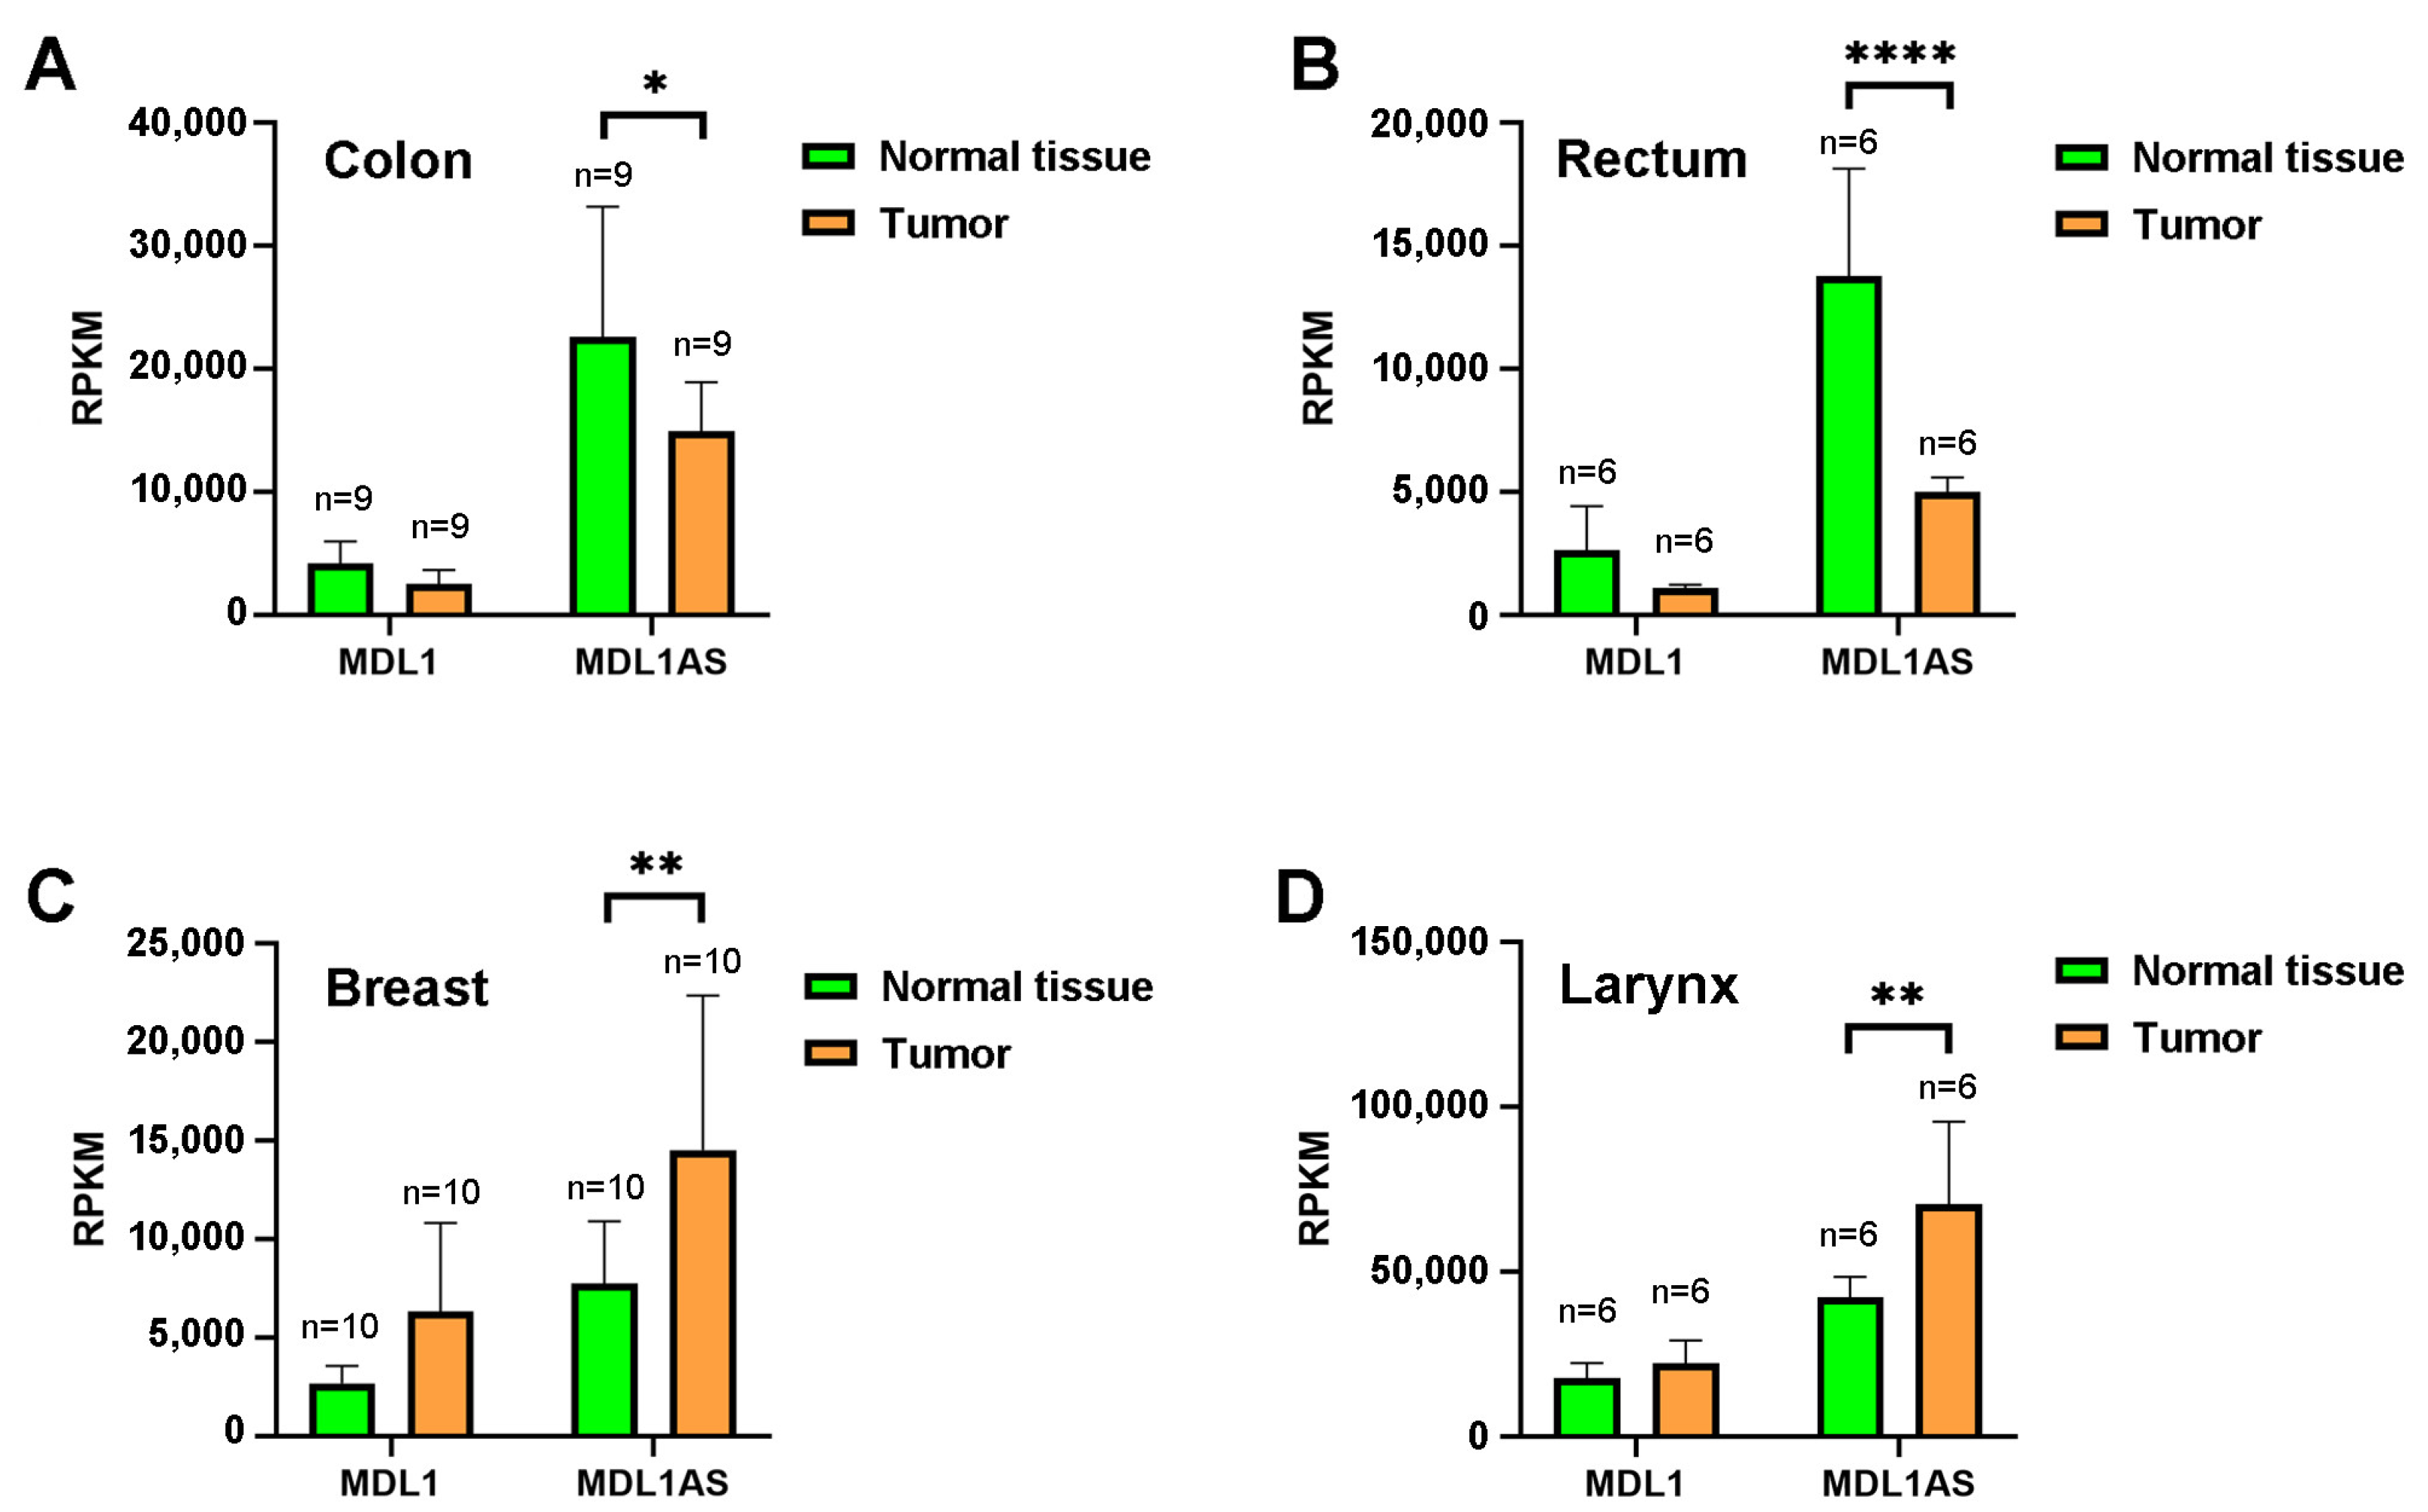
3.1. MDL1AS Expression Levels in Different Cancers
3.2. Patient Characteristics
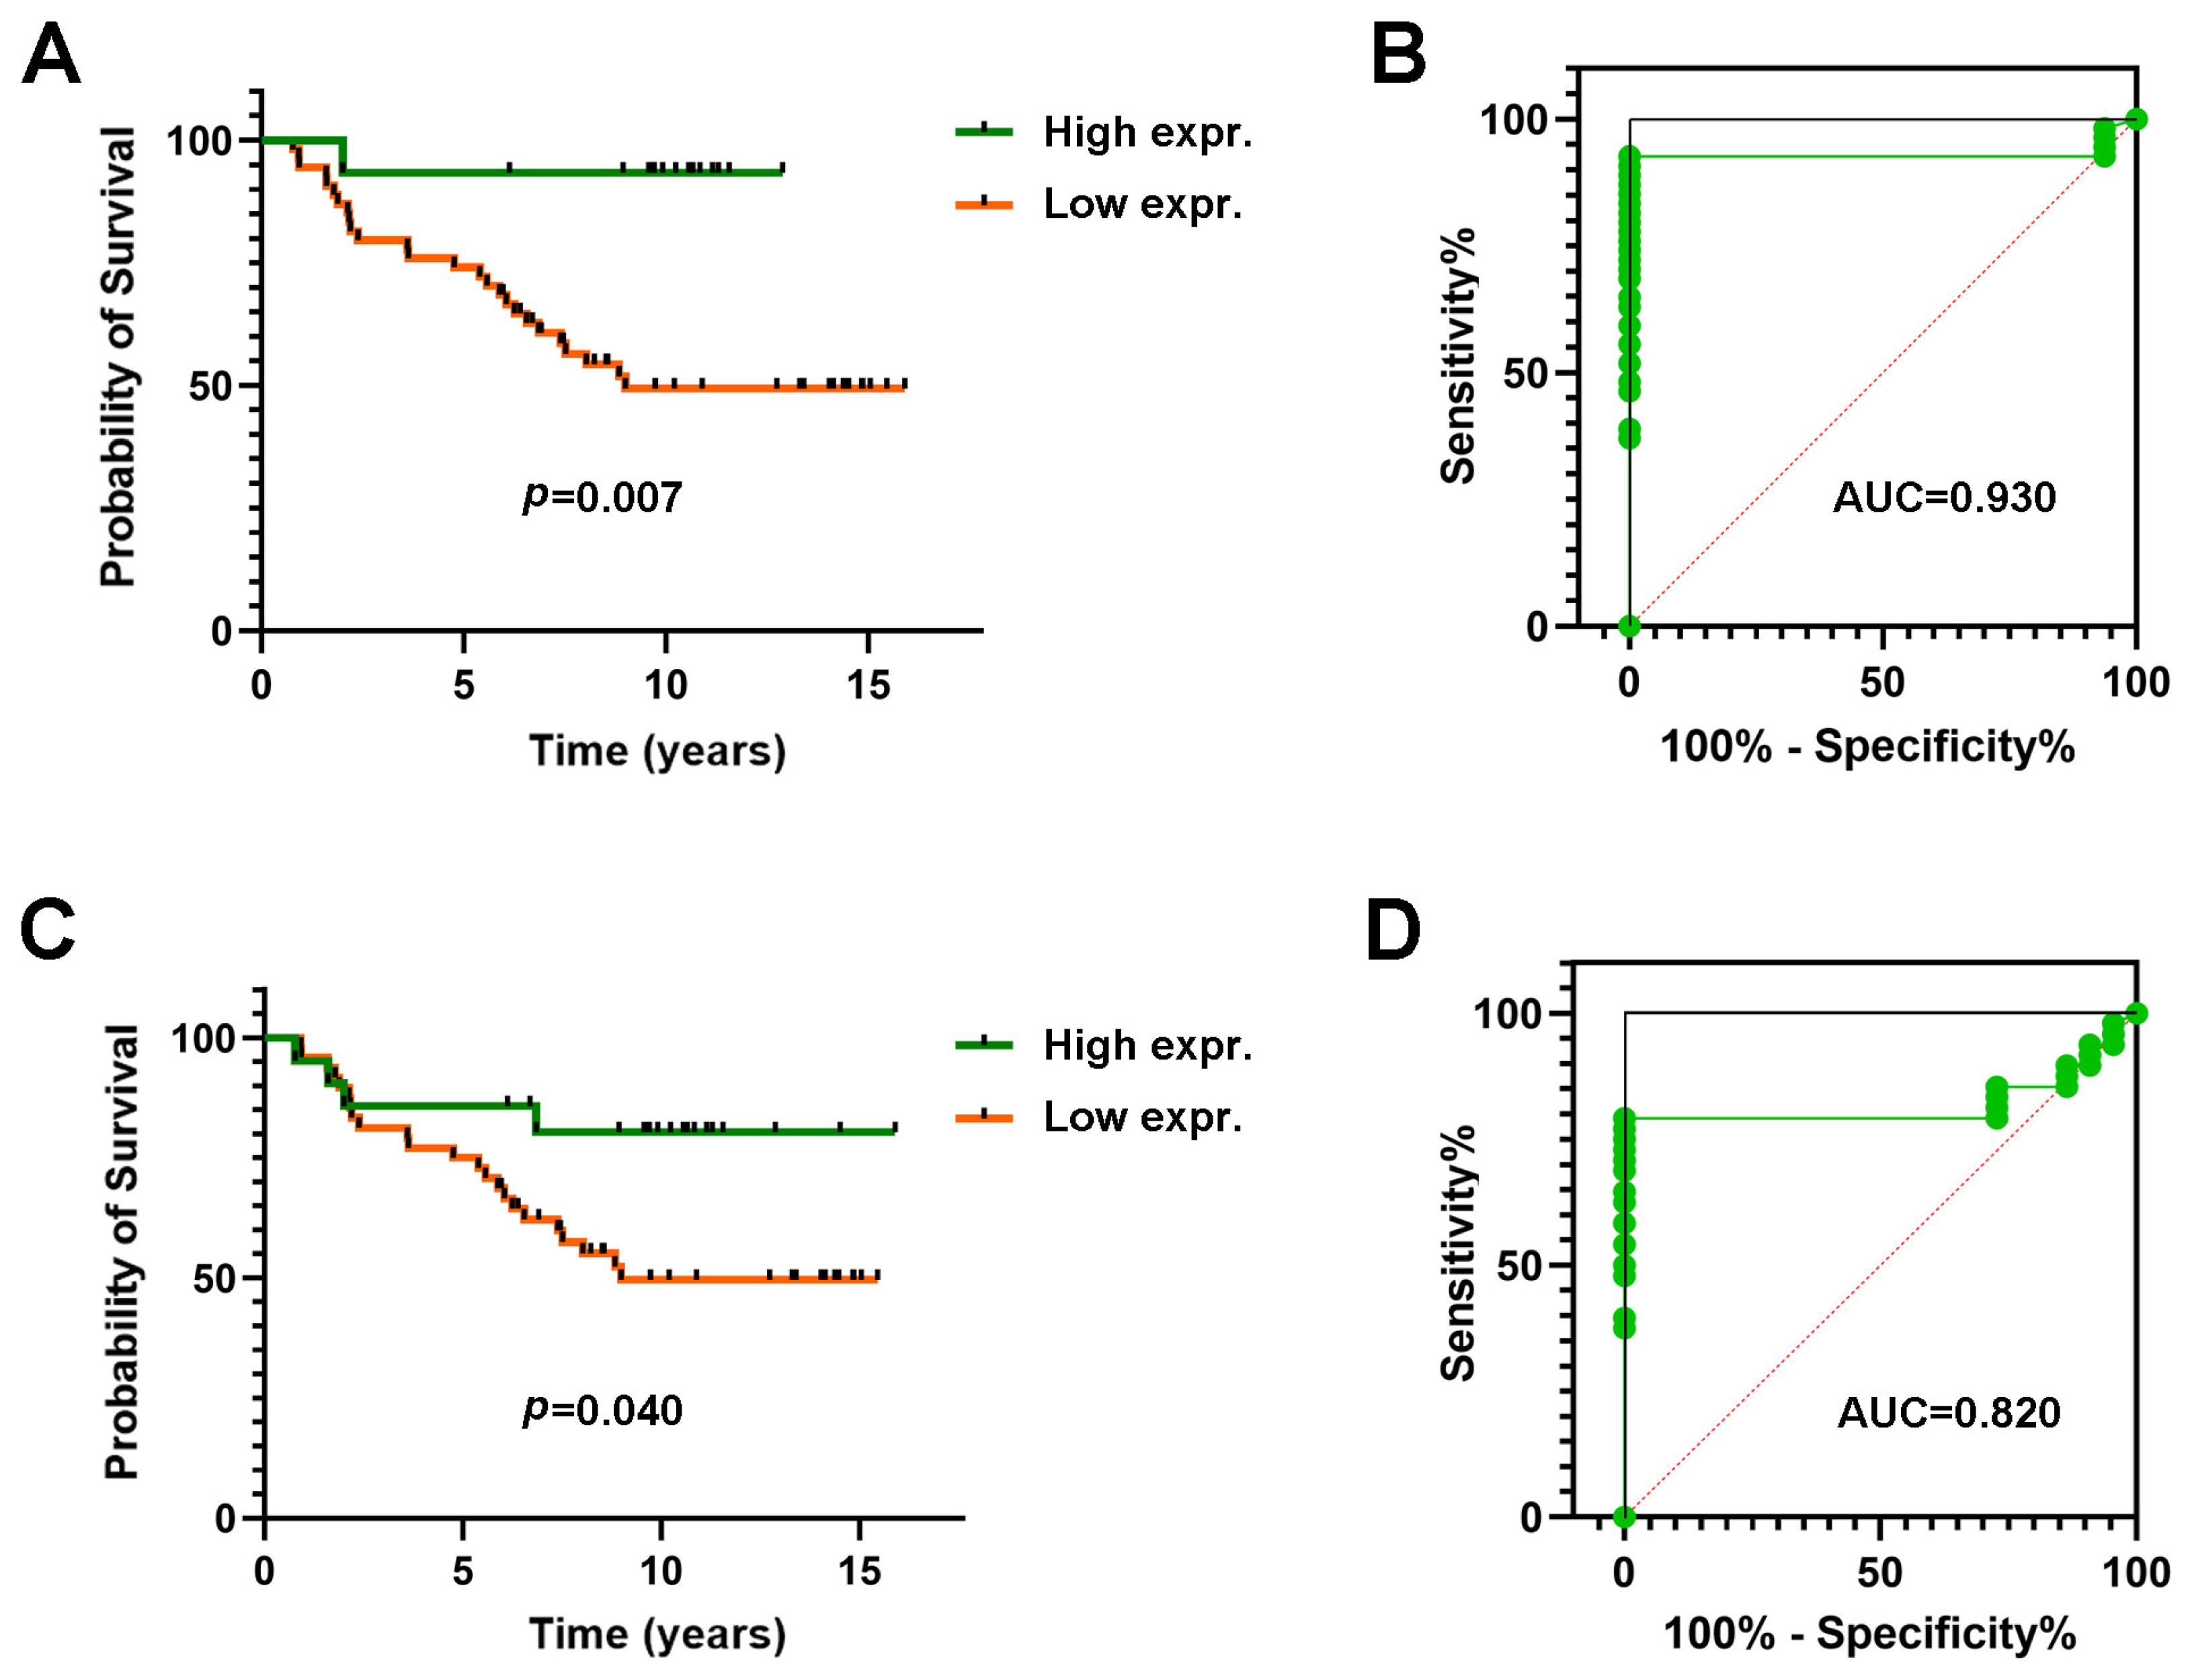
3.3. Expression of MDL1 and MDL1AS in LARC Patients Predict 5-Year Survival
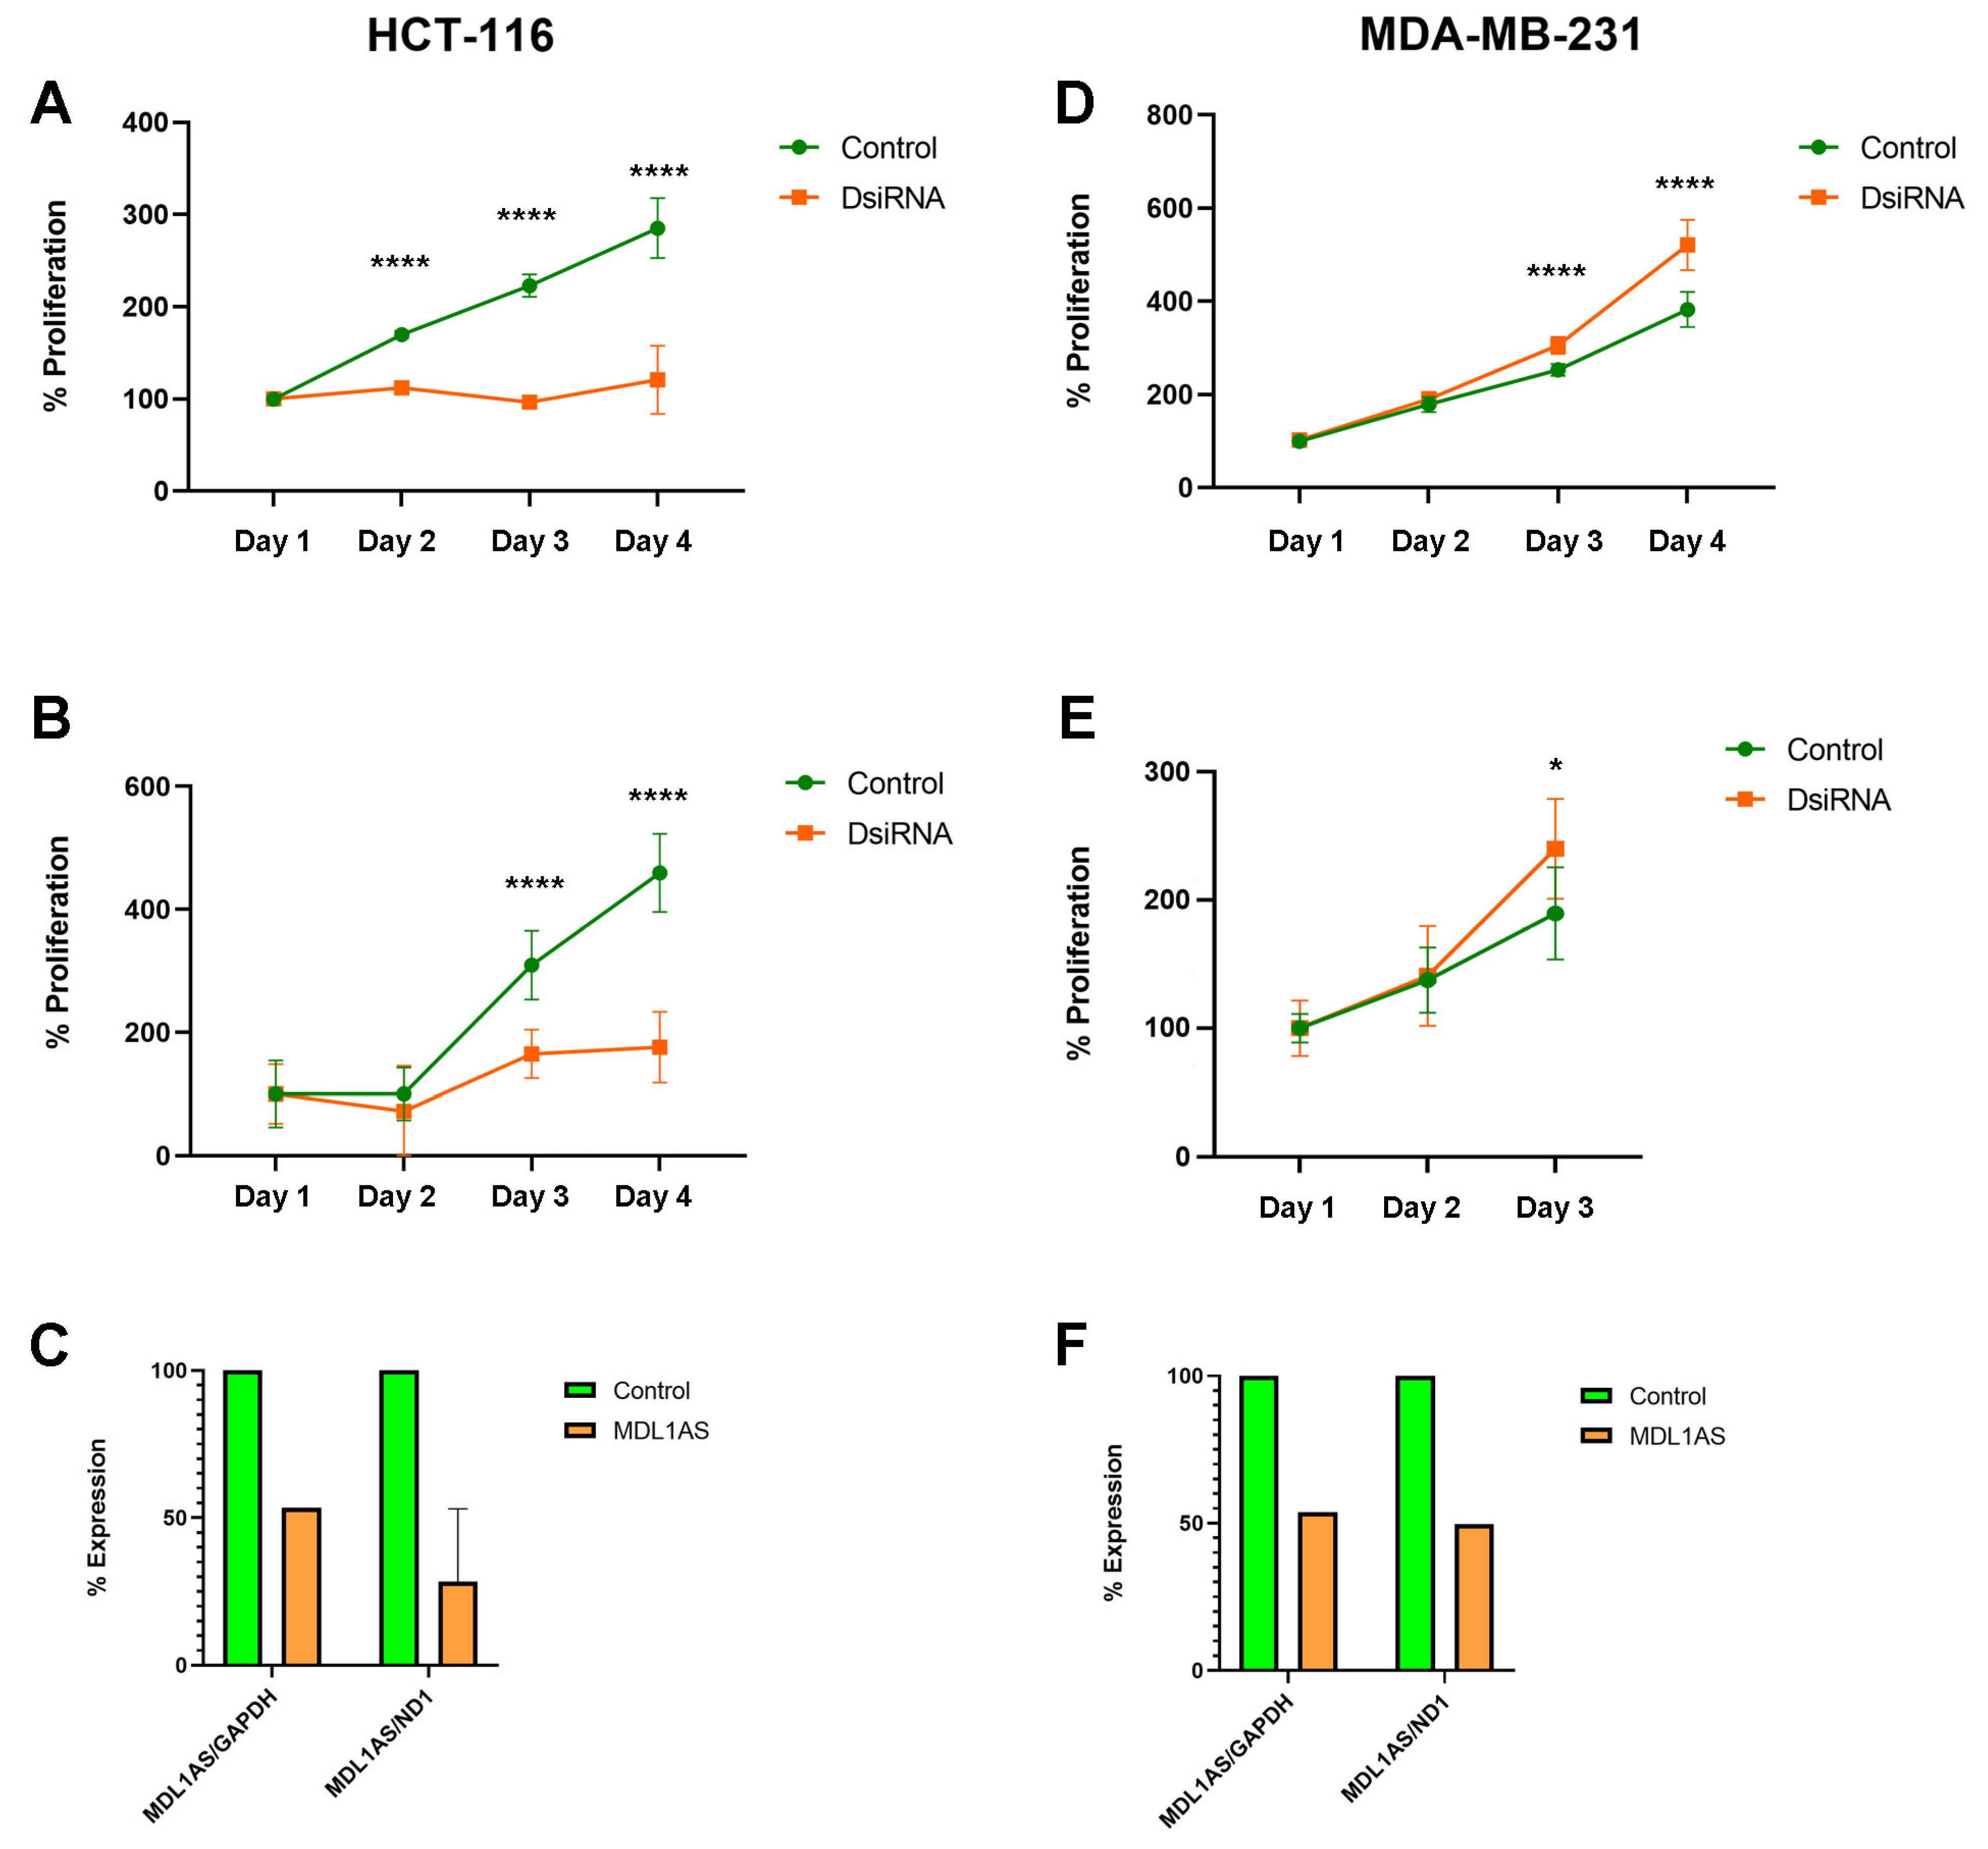
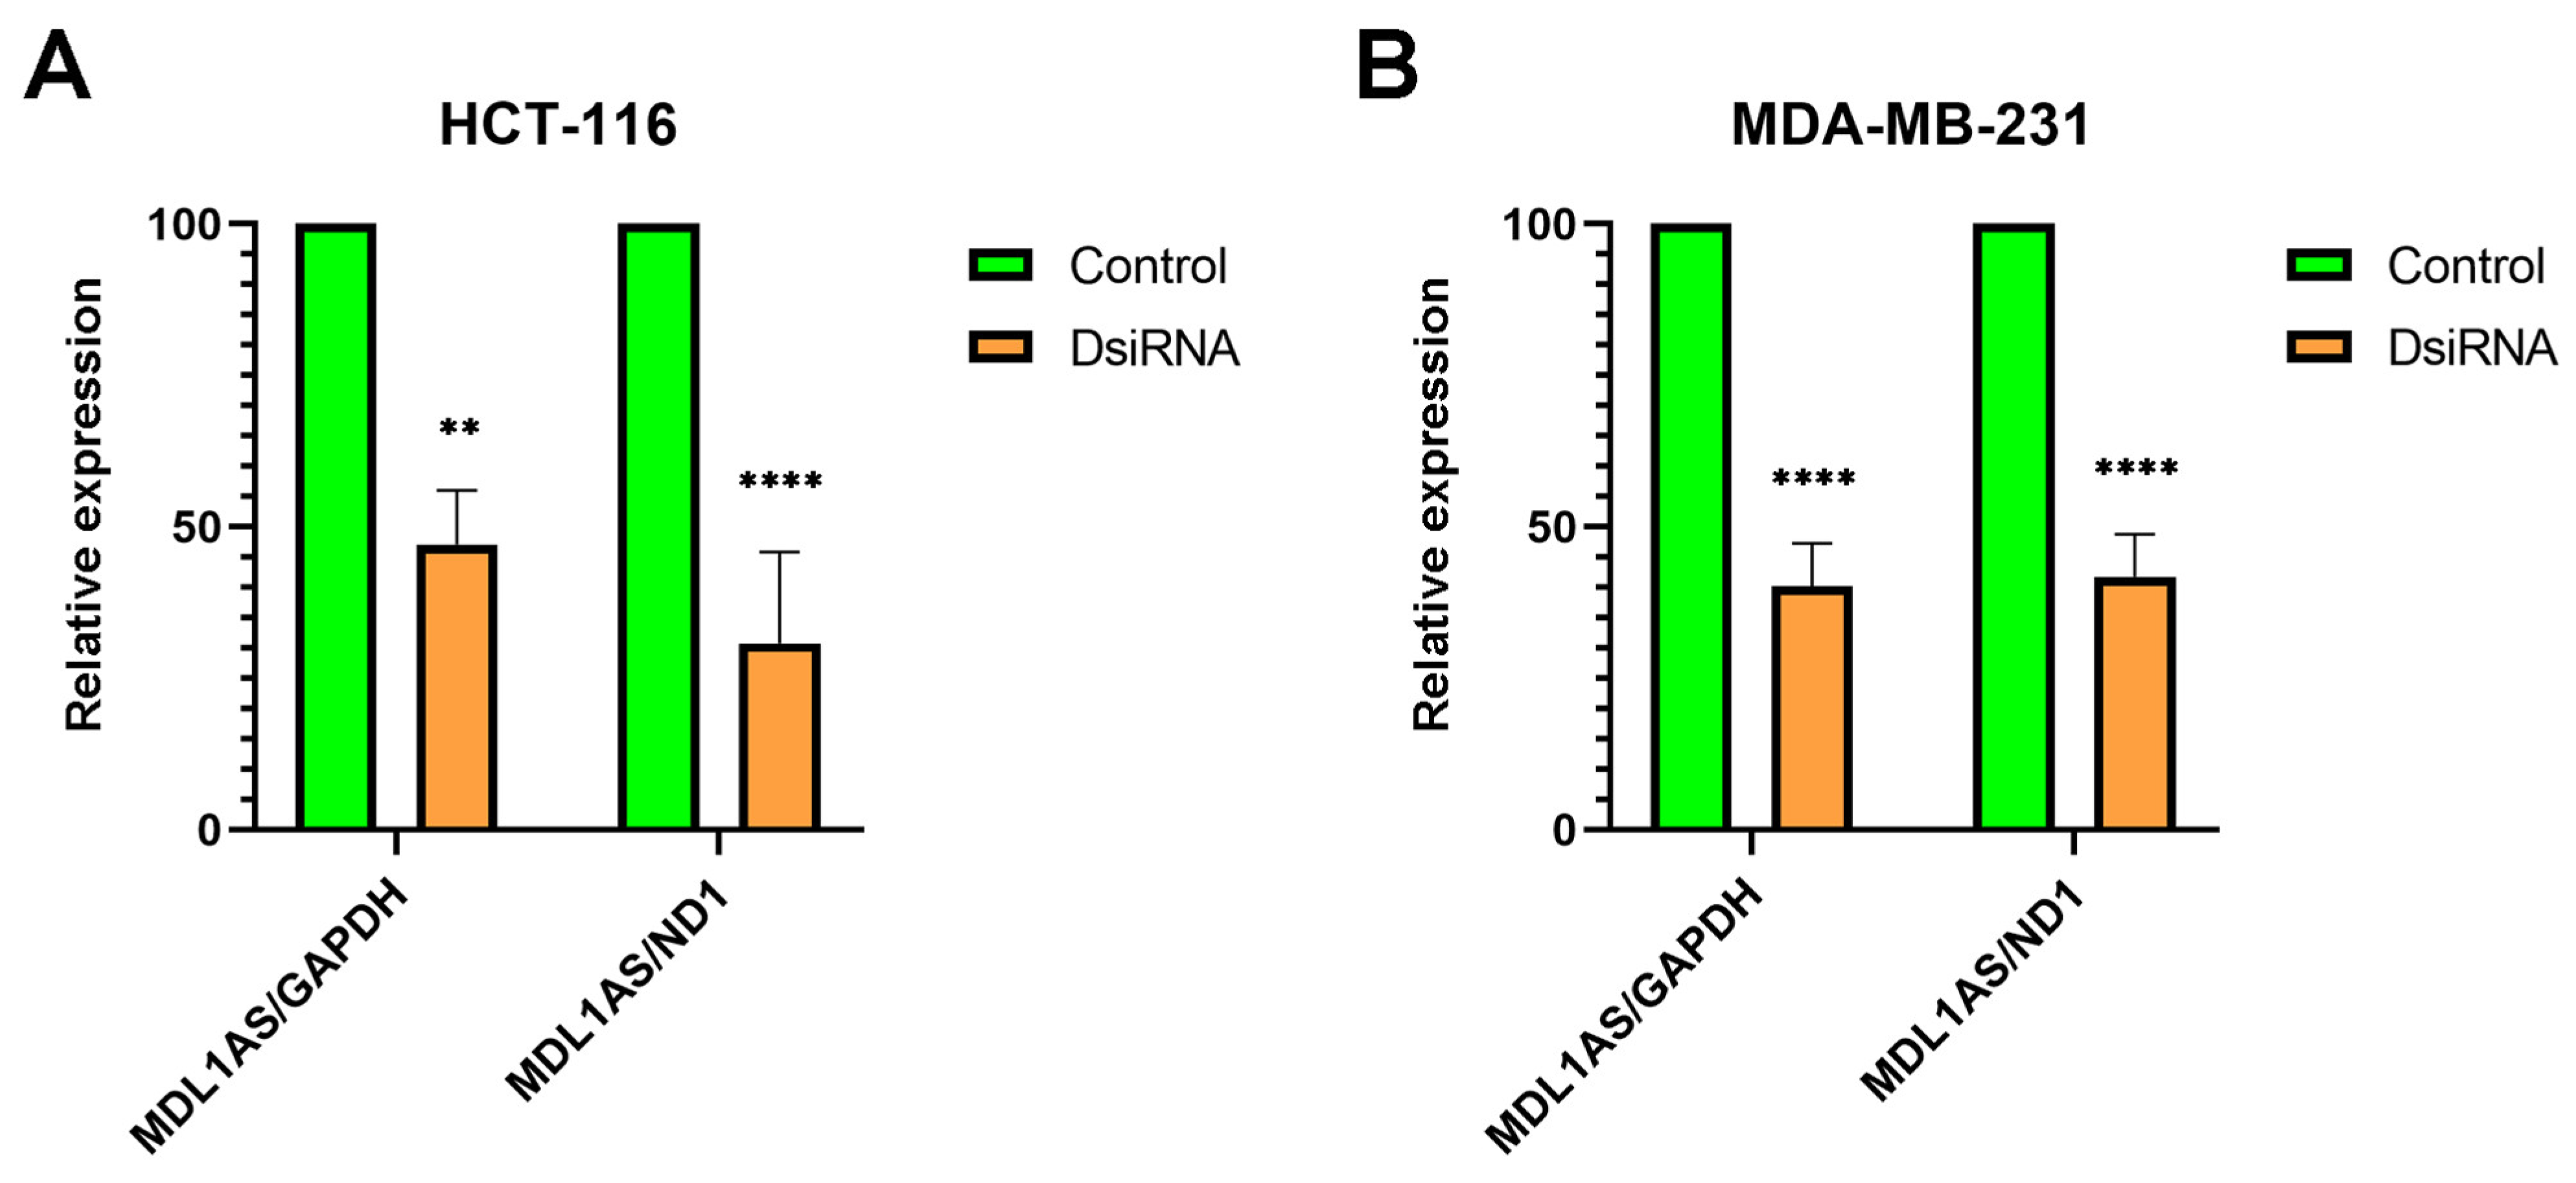
3.4. MDL1AS Expression Can Be Downregulated by Specific DsiRNA Sequences
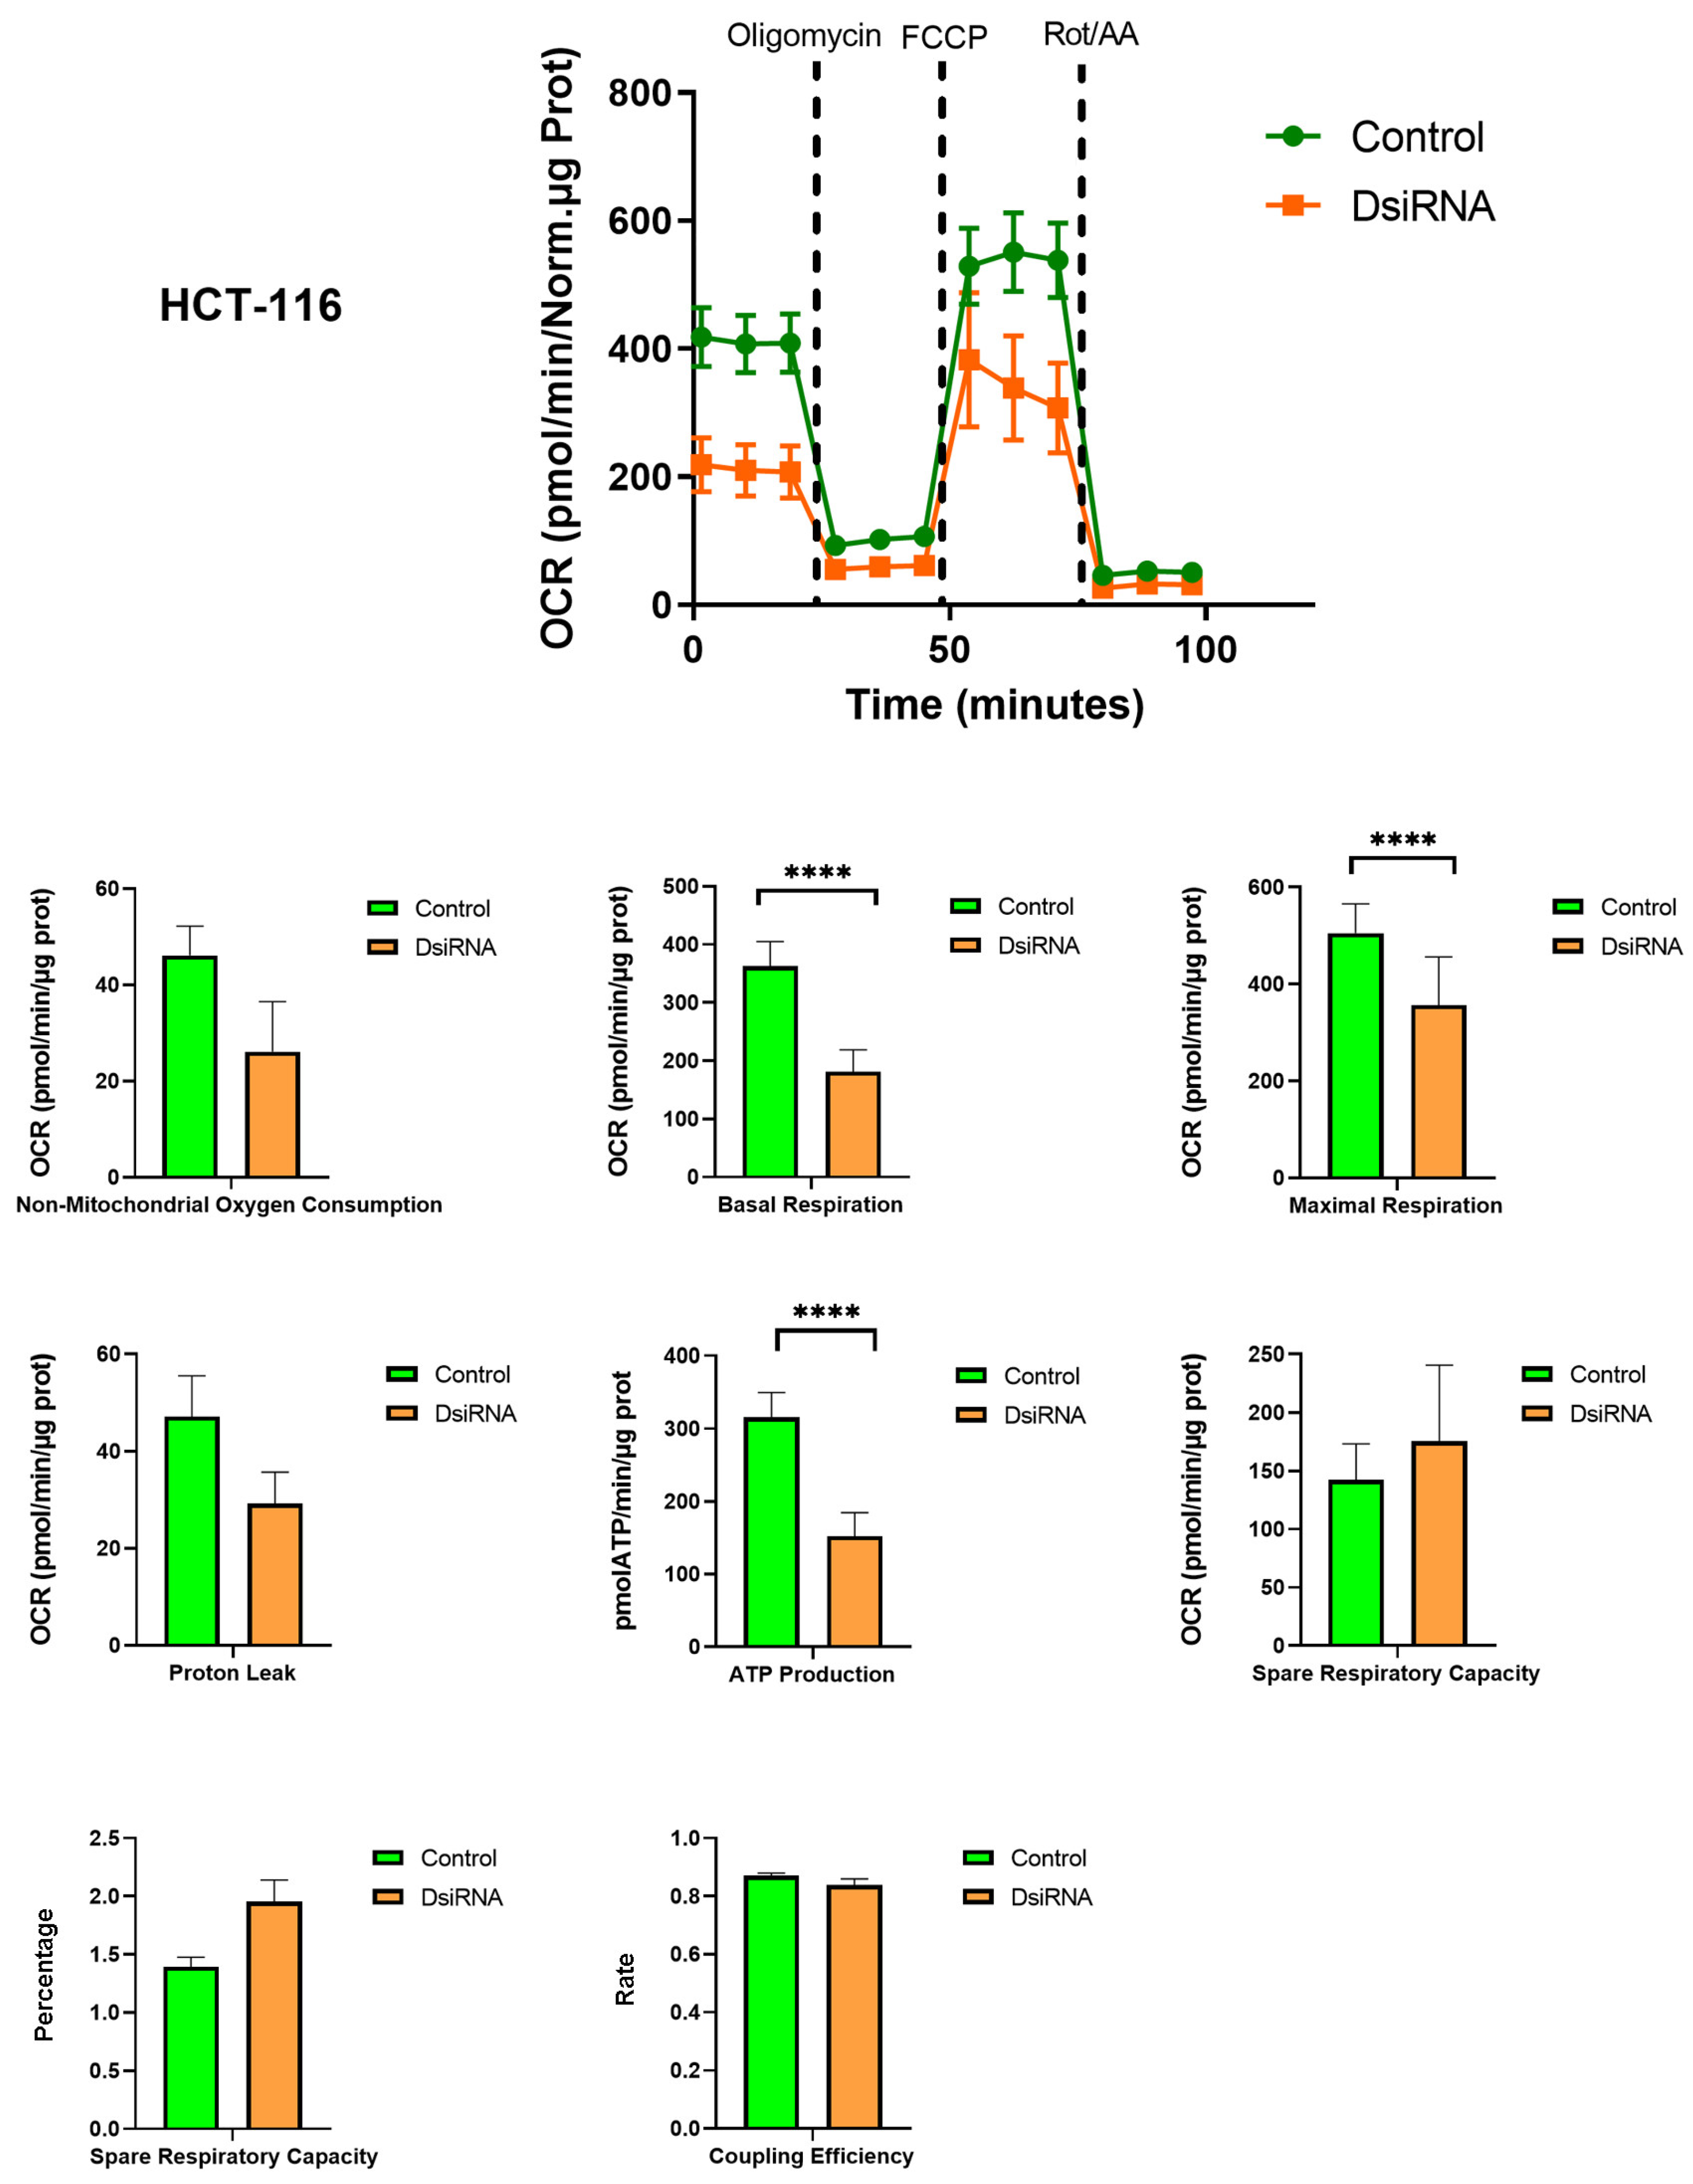
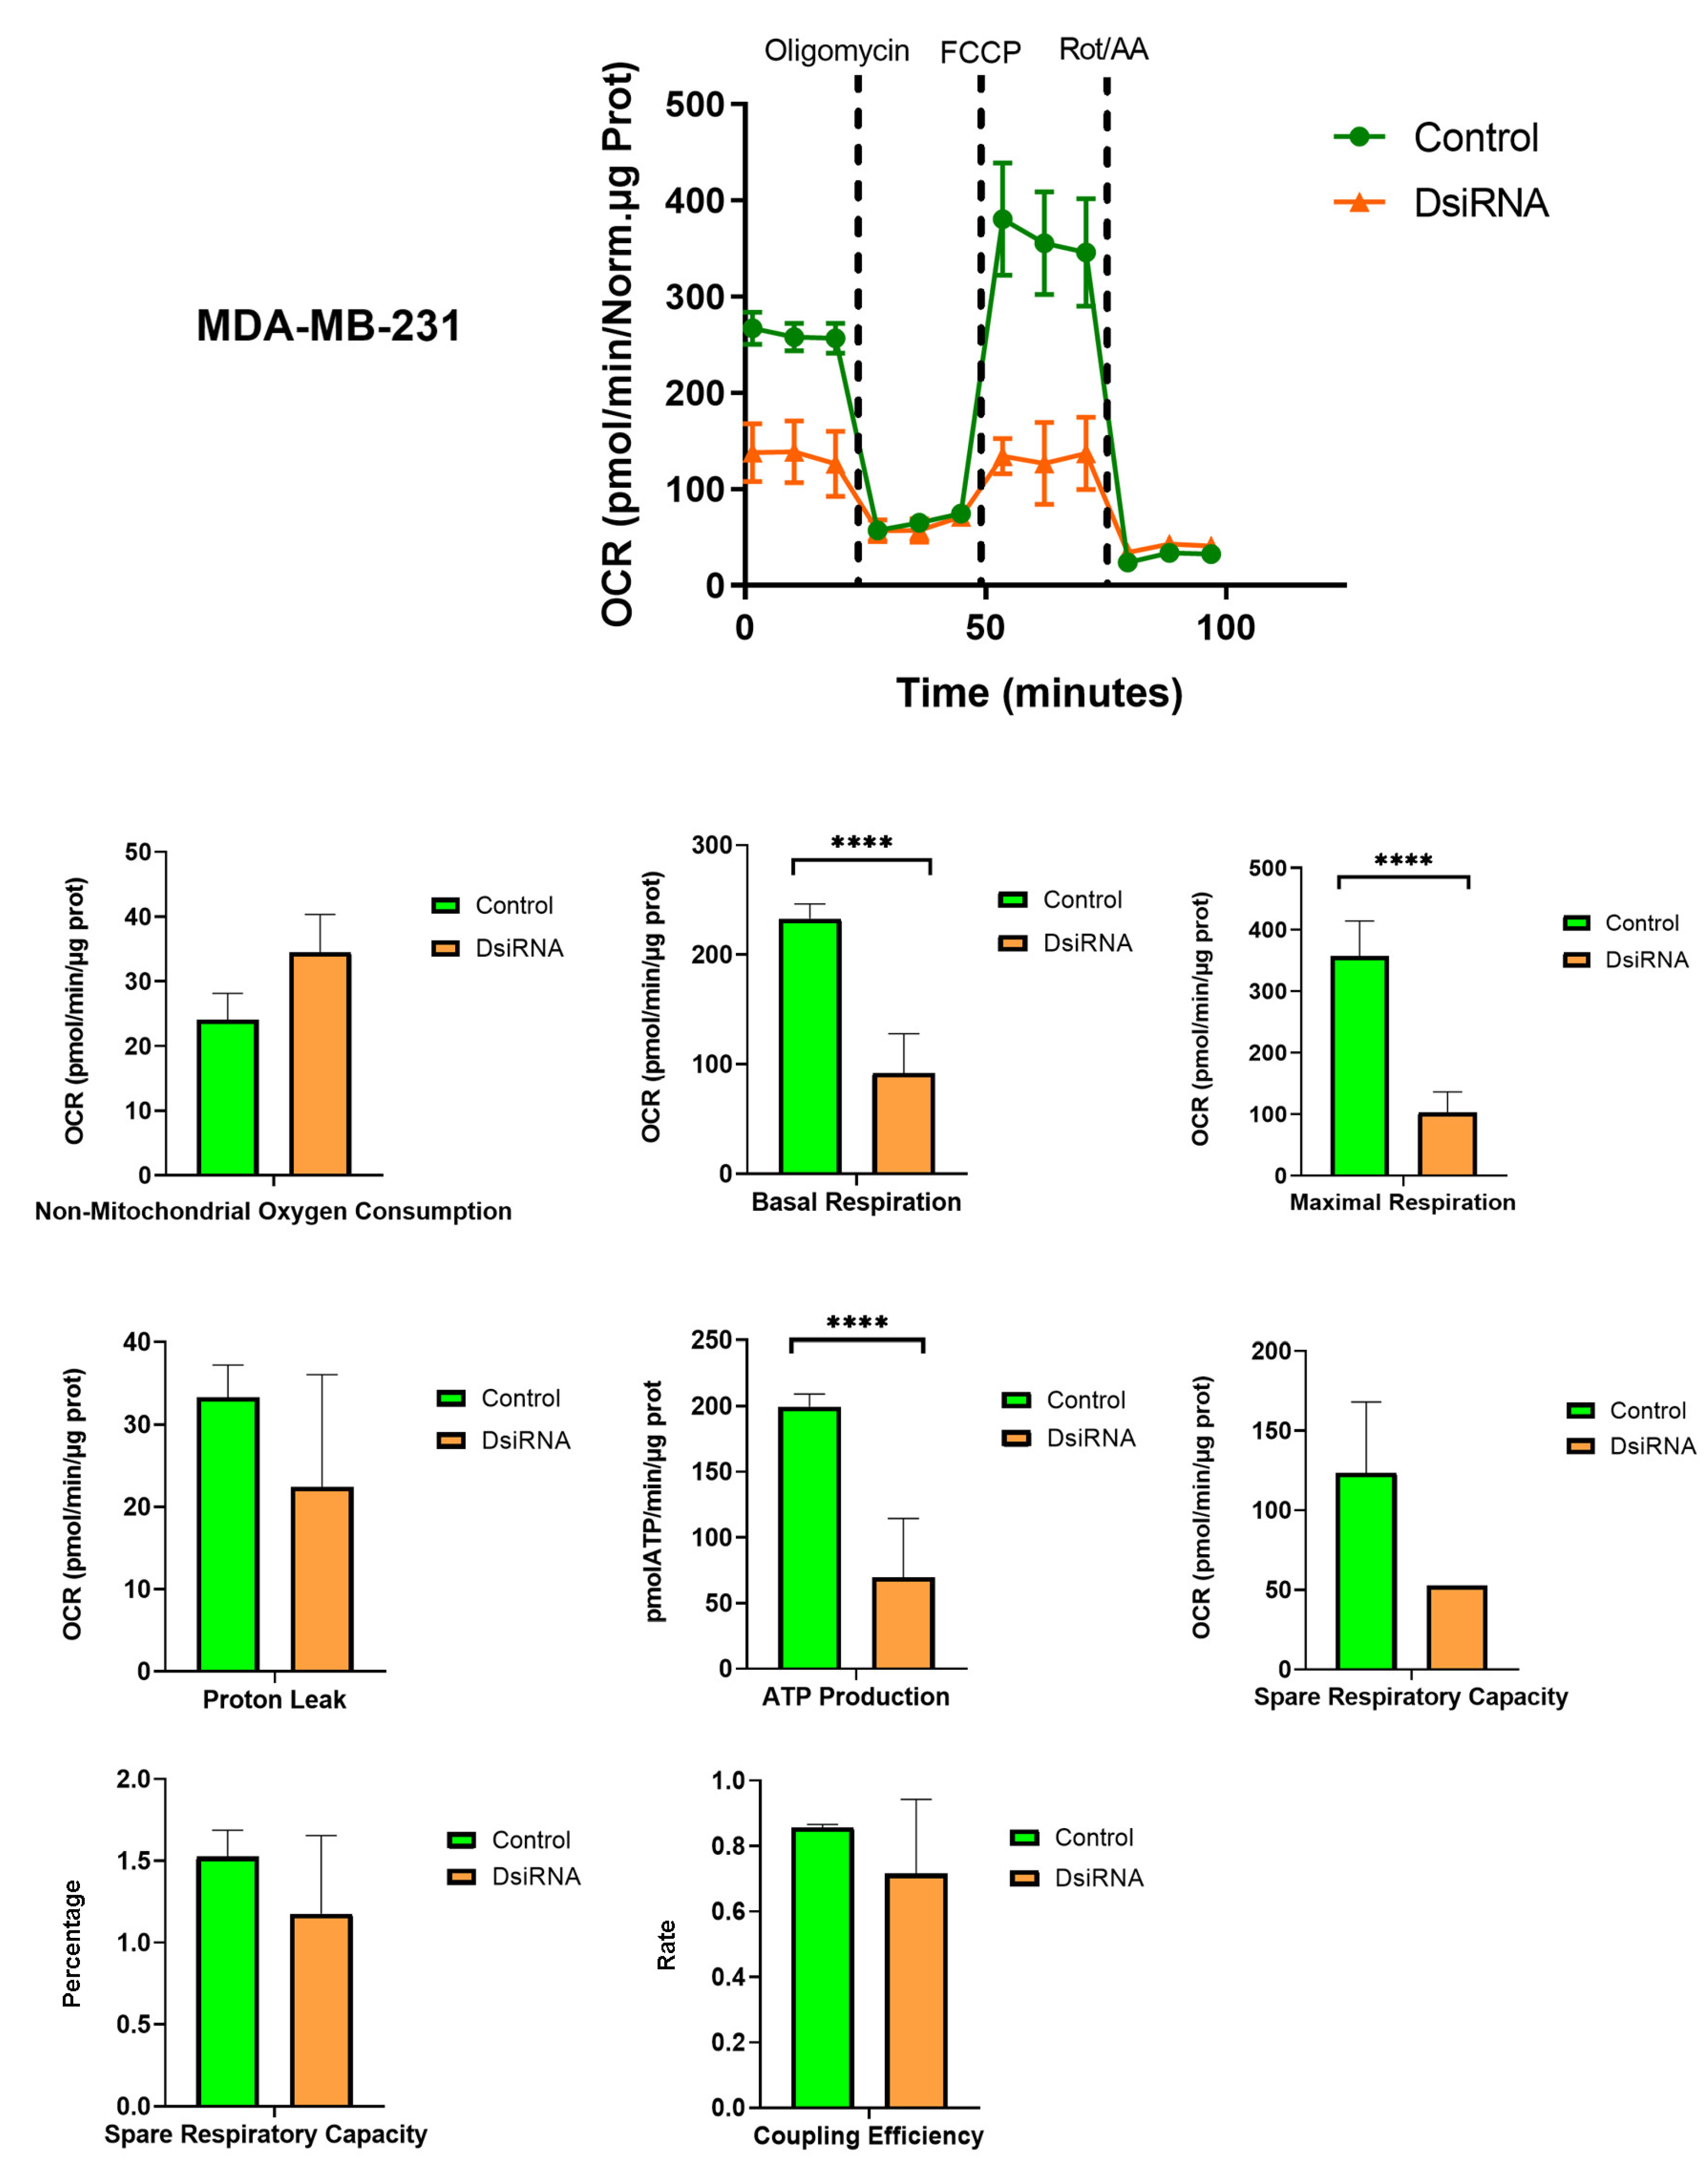
3.5. MDL1AS Downregulation Reduces Mitochondrial Respiration Parameters
3.6. MDL1AS Downregulation Reduces Tumor Cell Growth in Colon Cancer Cells but Increases It in Breast Cancer Cells
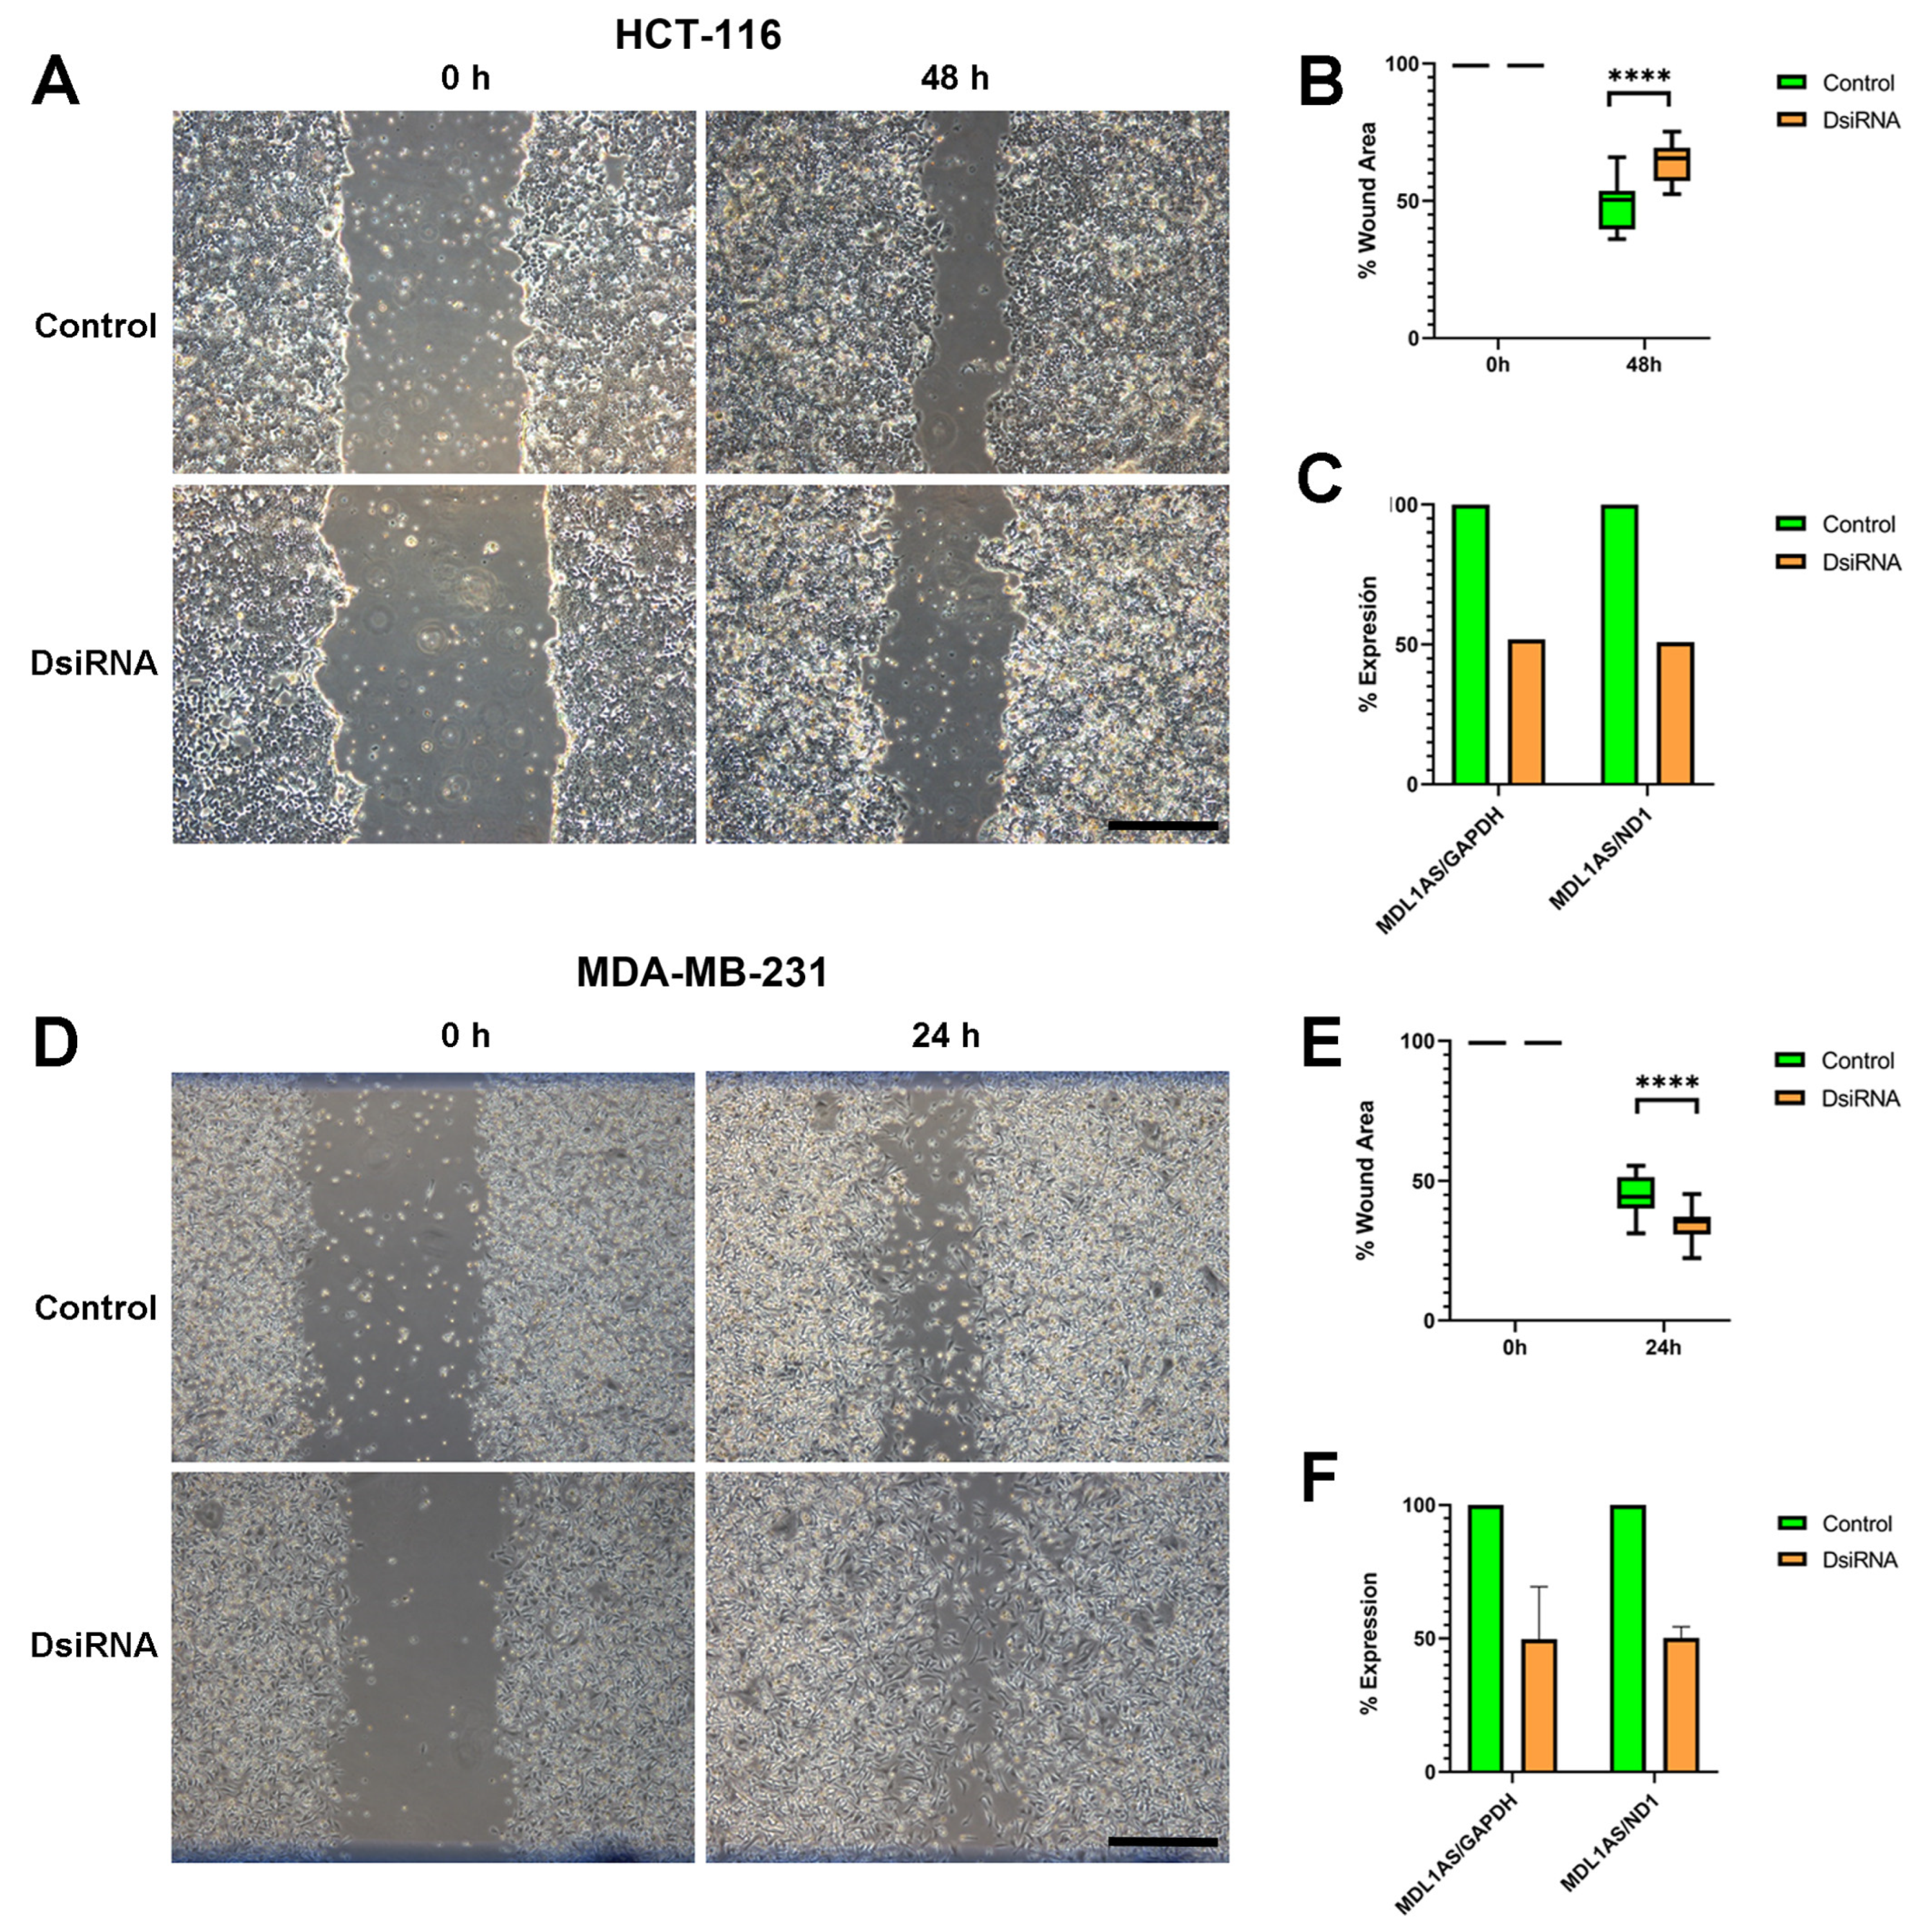
3.7. MDL1AS Downregulation Reduces Tumor Cell Migration in Colon Cancer Cells but Increases It in Breast Cancer Cells
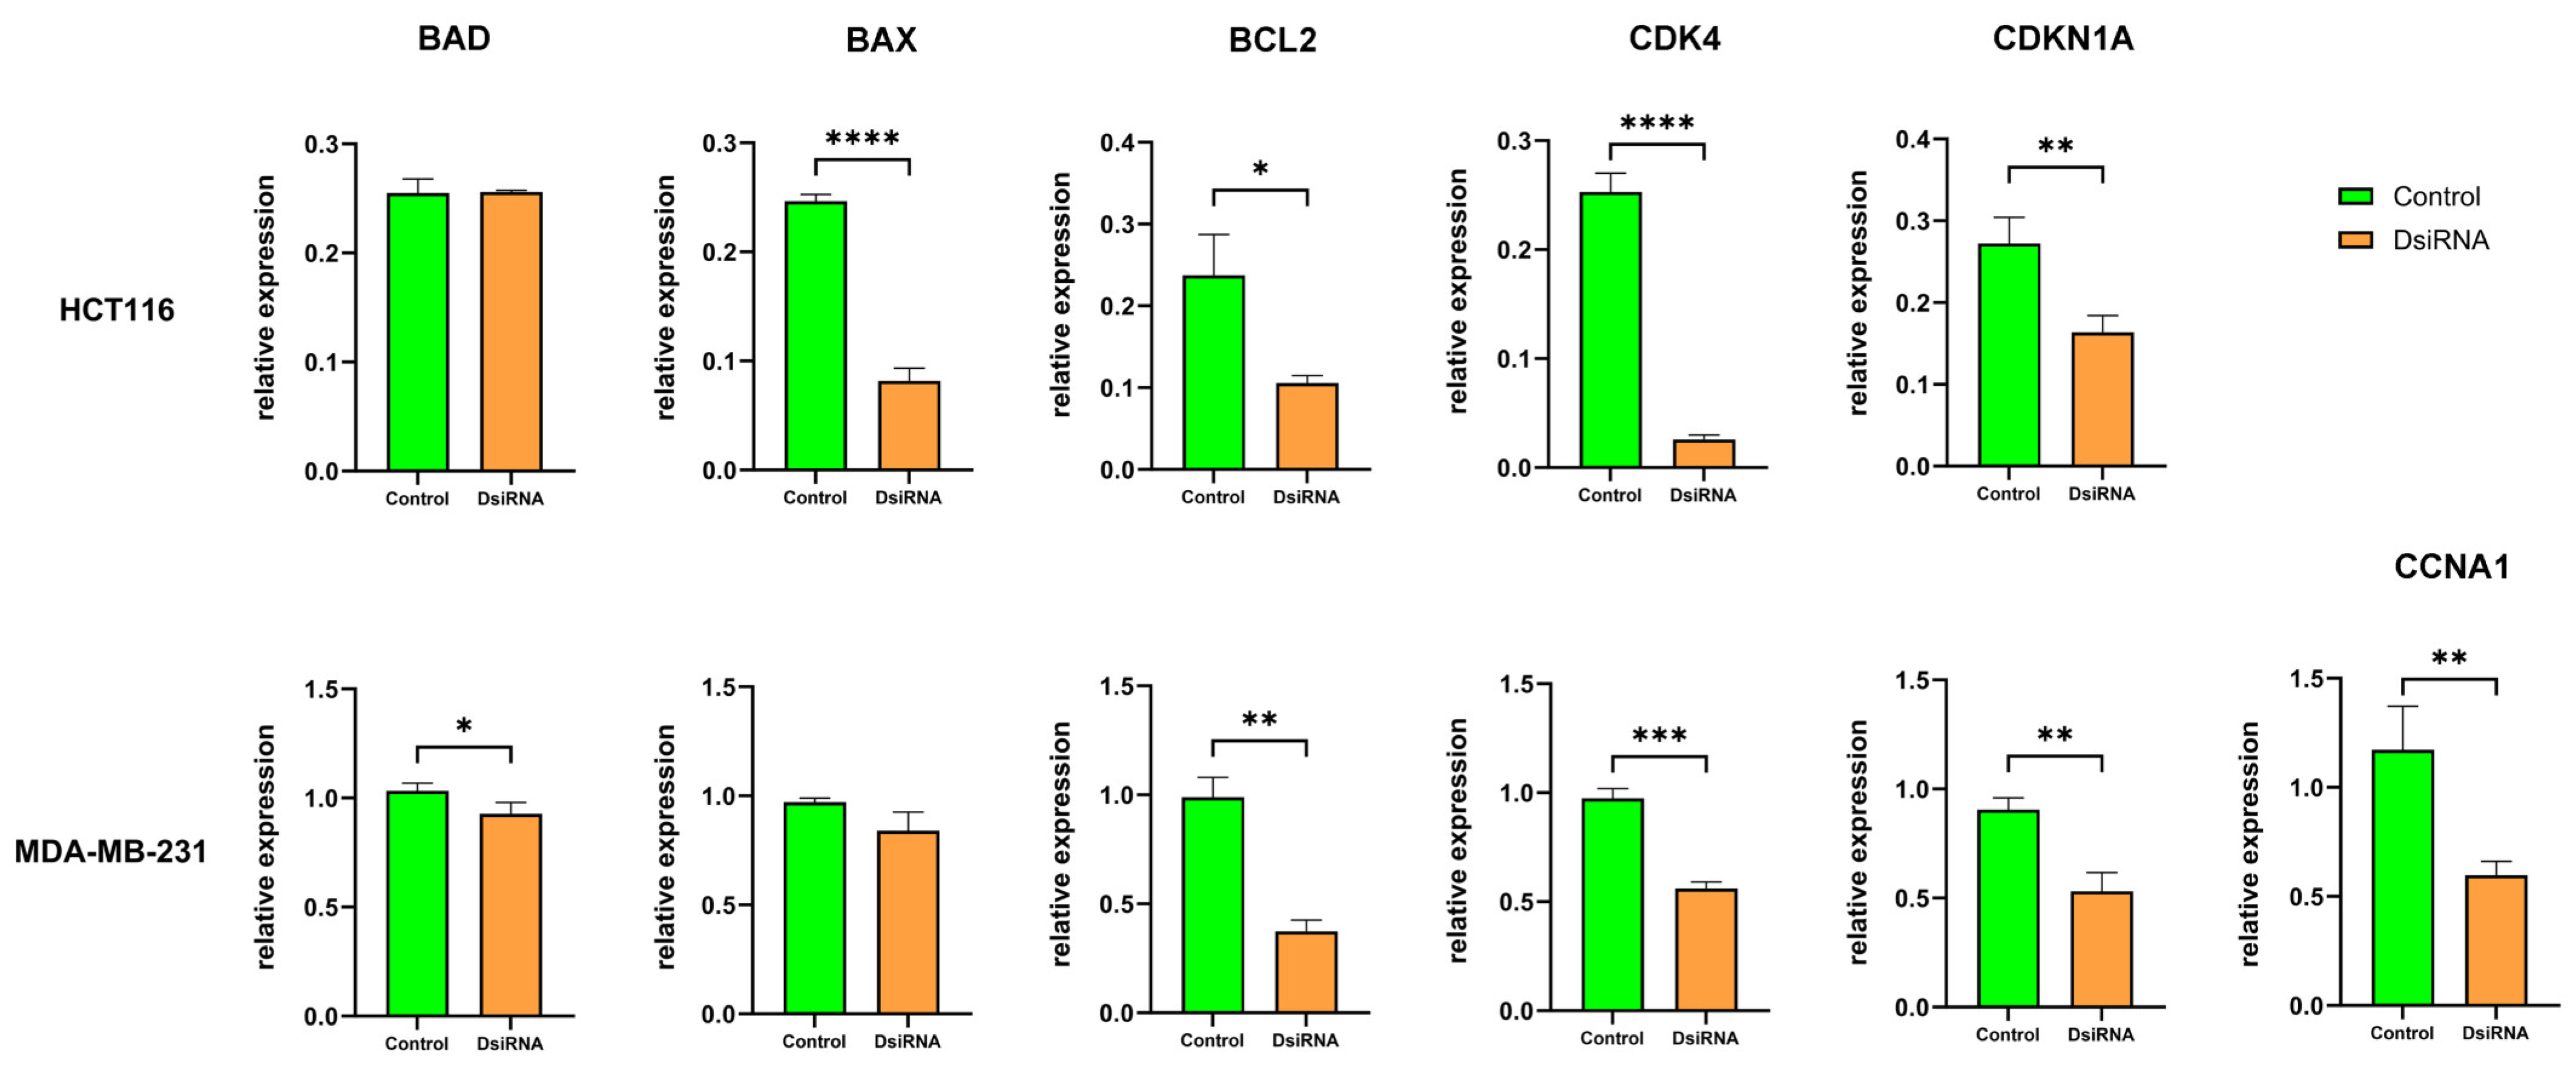
3.8. MDL1AS Downregulation Modulates Expression of Genes Related to Apoptosis and the Cell Cycle
4. Discussion
5. Conclusions
6. Patents
Author Contributions
Funding
Institutional Review Board Statement
Informed Consent Statement
Data Availability Statement
Acknowledgments
Conflicts of Interest
References
- Sung, H.; Ferlay, J.; Siegel, R.L.; Laversanne, M.; Soerjomataram, I.; Jemal, A.; Bray, F. Global Cancer Statistics 2020: GLOBOCAN Estimates of Incidence and Mortality Worldwide for 36 Cancers in 185 Countries. CA Cancer J. Clin. 2021, 71, 209–249. [Google Scholar] [CrossRef] [PubMed]
- Castells, A. Hereditary forms of colorectal cancer. Gastroenterol. Hepatol. 2016, 39 (Suppl. S1), 62–67. [Google Scholar] [CrossRef]
- Cervantes, A.; Adam, R.; Rosello, S.; Arnold, D.; Normanno, N.; Taieb, J.; Seligmann, J.; de Baere, T.; Osterlund, P.; Yoshino, T.; et al. Metastatic colorectal cancer: ESMO Clinical Practice Guideline for diagnosis, treatment and follow-up. Ann. Oncol. 2023, 34, 10–32. [Google Scholar] [CrossRef] [PubMed]
- Zvirblyte, J.; Mazutis, L. Microfluidics for Cancer Biomarker Discovery, Research, and Clinical Application. Adv. Exp. Med. Biol. 2022, 1379, 499–524. [Google Scholar] [CrossRef]
- Marmol, I.; Sanchez-de-Diego, C.; Pradilla, D.A.; Cerrada, E.; Rodriguez Yoldi, M.J. Colorectal Carcinoma: A General Overview and Future Perspectives in Colorectal Cancer. Int. J. Mol. Sci. 2017, 18, 197. [Google Scholar] [CrossRef] [PubMed]
- Fekete, J.T.; Gyorffy, B. New Transcriptomic Biomarkers of 5-Fluorouracil Resistance. Int. J. Mol. Sci. 2023, 24, 1508. [Google Scholar] [CrossRef]
- Malki, A.; ElRuz, R.A.; Gupta, I.; Allouch, A.; Vranic, S.; Al Moustafa, A.E. Molecular Mechanisms of Colon Cancer Progression and Metastasis: Recent Insights and Advancements. Int. J. Mol. Sci. 2020, 22, 130. [Google Scholar] [CrossRef]
- Saw, P.E.; Xu, X.; Chen, J.; Song, E.W. Non-coding RNAs: The new central dogma of cancer biology. Sci. China Life Sci. 2021, 64, 22–50. [Google Scholar] [CrossRef]
- Qu, A.; Wang, Q.; Chang, Q.; Liu, J.; Yang, Y.; Zhang, X.; Zhang, Y.; Zhang, X.; Wang, H.; Zhang, Y. Prognostic and predictive value of a lncRNA signature in patients with stage II colon cancer. Sci. Rep. 2023, 13, 1350. [Google Scholar] [CrossRef]
- Liu, Y.; Sun, Y.; Guo, Y.; Shi, X.; Chen, X.; Feng, W.; Wu, L.L.; Zhang, J.; Yu, S.; Wang, Y.; et al. An Overview: The Diversified Role of Mitochondria in Cancer Metabolism. Int. J. Biol. Sci. 2023, 19, 897–915. [Google Scholar] [CrossRef]
- Warburg, O.; Wind, F.; Negelein, E. The metabolism of tumors in the body. J. Gen. Physiol. 1927, 7, 519–530. [Google Scholar] [CrossRef]
- Casas-Benito, A.; Martinez-Herrero, S.; Martinez, A. Succinate-Directed Approaches for Warburg Effect-Targeted Cancer Management, an Alternative to Current Treatments? Cancers 2023, 15, 2862. [Google Scholar] [CrossRef]
- Oliveira, G.L.; Coelho, A.R.; Marques, R.; Oliveira, P.J. Cancer cell metabolism: Rewiring the mitochondrial hub. Biochim. Biophys. Acta Mol. Basis Dis. 2021, 1867, 166016. [Google Scholar] [CrossRef] [PubMed]
- Liu, X.; Shan, G. Mitochondria Encoded Non-coding RNAs in Cell Physiology. Front. Cell Dev. Biol. 2021, 9, 713729. [Google Scholar] [CrossRef] [PubMed]
- Tyagi, A.; Pramanik, R.; Vishnubhatla, S.; Bakhshi, R.; Bakhshi, S. Prognostic impact of mitochondrial DNA D-loop variations in pediatric acute myeloid leukemia. Oncotarget 2019, 10, 1334–1343. [Google Scholar] [CrossRef]
- Zhao, Y.; Sun, L.; Wang, R.R.; Hu, J.F.; Cui, J. The effects of mitochondria-associated long noncoding RNAs in cancer mitochondria: New players in an old arena. Crit. Rev. Oncol. Hematol. 2018, 131, 76–82. [Google Scholar] [CrossRef]
- Ren, B.; Guan, M.X.; Zhou, T.; Cai, X.; Shan, G. Emerging functions of mitochondria-encoded noncoding RNAs. Trends Genet. 2023, 39, 125–139. [Google Scholar] [CrossRef] [PubMed]
- Ro, S.; Ma, H.Y.; Park, C.; Ortogero, N.; Song, R.; Hennig, G.W.; Zheng, H.; Lin, Y.M.; Moro, L.; Hsieh, J.T.; et al. The mitochondrial genome encodes abundant small noncoding RNAs. Cell Res. 2013, 23, 759–774. [Google Scholar] [CrossRef]
- Mathuram, T.L.; Townsend, D.M.; Lynch, V.J.; Bederman, I.; Ye, Z.W.; Zhang, J.; Sigurdson, W.J.; Prendergast, E.; Jobava, R.; Ferruzza, J.P.; et al. A Synthetic Small RNA Homologous to the D-Loop Transcript of mtDNA Enhances Mitochondrial Bioenergetics. Front. Physiol. 2022, 13, 772313. [Google Scholar] [CrossRef]
- Kumarswamy, R.; Bauters, C.; Volkmann, I.; Maury, F.; Fetisch, J.; Holzmann, A.; Lemesle, G.; de Groote, P.; Pinet, F.; Thum, T. Circulating long noncoding RNA, LIPCAR, predicts survival in patients with heart failure. Circ. Res. 2014, 114, 1569–1575. [Google Scholar] [CrossRef]
- Zhao, Y.; Liu, S.; Zhou, L.; Li, X.; Meng, Y.; Li, Y.; li, L.; Jiao, B.; Bai, L.; Yu, Y.; et al. Aberrant shuttling of long noncoding RNAs during the mitochondria-nuclear crosstalk in hepatocellular carcinoma cells. Am. J. Cancer Res. 2019, 9, 999–1008. [Google Scholar]
- Rackham, O.; Shearwood, A.M.; Mercer, T.R.; Davies, S.M.; Mattick, J.S.; Filipovska, A. Long noncoding RNAs are generated from the mitochondrial genome and regulated by nuclear-encoded proteins. Rna 2011, 17, 2085–2093. [Google Scholar] [CrossRef]
- Borgna, V.; Villegas, J.; Burzio, V.A.; Belmar, S.; Araya, M.; Jeldes, E.; lobos-Gonzalez, L.; Silva, V.; Villota, C.; Oliveira-Cruz, L.; et al. Mitochondrial ASncmtRNA-1 and ASncmtRNA-2 as potent targets to inhibit tumor growth and metastasis in the RenCa murine renal adenocarcinoma model. Oncotarget 2017, 8, 43692–43708. [Google Scholar] [CrossRef]
- Gao, S.; Tian, X.; Chang, H.; Sun, Y.; Wu, Z.; Cheng, Z.; Dong, P.; Zhao, Q.; Ruan, J.; Bu, W. Two novel lncRNAs discovered in human mitochondrial DNA using PacBio full-length transcriptome data. Mitochondrion 2018, 38, 41–47. [Google Scholar] [CrossRef]
- Li, J.; Bai, R.; Yang, W.; Miao, H.; Li, Y.; Dai, H.; li, L.; Zhao, Y.; Song, X. The mitochondrial-derived lncRNA MDL1 mediates a mitochondria-to-nucleus retrograde regulation by inhibiting the nuclear translocation of p53. MedComm Oncol. 2022, 1, e15. [Google Scholar] [CrossRef]
- Li, J.; Bai, R.; Zhao, Y.; Li, L.; Song, X. The mitochondial-generated lncRNAs mediate a mitochondria-to-nucleus retrograde regulation after their nuclear translocation. Res. Square 2023. Preprint. [Google Scholar] [CrossRef]
- Martin-Carnicero, A.; Ramalle-Gomara, E.; Rubio-Mediavilla, S.; Alonso-Lago, M.; Zorrilla-Larraga, M.; Manrique-Abos, I.; de las Heras-Duena, M.E.; Larrayoz, I.M.; Martínez, A. Prognostic and Predictive Biomarkers in Patients with Locally Advanced Rectal Cancer (LARC) Treated with Preoperative Chemoradiotherapy. J. Clin. Med. 2022, 11, 6091. [Google Scholar] [CrossRef] [PubMed]
- Larrayoz, I.M.; de Luis, A.; Rua, O.; Velilla, S.; Cabello, J.; Martinez, A. Molecular effects of doxycycline treatment on pterygium as revealed by massive transcriptome sequencing. PLoS ONE 2012, 7, e39359. [Google Scholar] [CrossRef] [PubMed]
- Sioud, M. RNA Interference: Story and Mechanisms. Methods Mol. Biol. 2021, 2282, 1–15. [Google Scholar] [CrossRef] [PubMed]
- Garcia-Sanmartin, J.; Narro-Iniguez, J.; Rodriguez-Barbero, A.; Martinez, A. Endoglin and Activin Receptor-like Kinase 1 (Alk1) Modify Adrenomedullin Expression in an Organ-Specific Manner in Mice. Biology 2022, 11, 358. [Google Scholar] [CrossRef] [PubMed]
- Vilarino, M.; Garcia-Sanmartin, J.; Ochoa-Callejero, L.; Lopez-Rodriguez, A.; Blanco-Urgoiti, J.; Martinez, A. Macrocybin, a Natural Mushroom Triglyceride, Reduces Tumor Growth In Vitro and In Vivo through Caveolin-Mediated Interference with the Actin Cytoskeleton. Molecules 2020, 25, 6010. [Google Scholar] [CrossRef] [PubMed]
- Stepanenko, A.A.; Dmitrenko, V.V. Pitfalls of the MTT assay: Direct and off-target effects of inhibitors can result in over/underestimation of cell viability. Gene 2015, 574, 193–203. [Google Scholar] [CrossRef] [PubMed]
- Perkins, N.J.; Schisterman, E.F. The Youden Index and the optimal cut-point corrected for measurement error. Biom. J. 2005, 47, 428–441. [Google Scholar] [CrossRef] [PubMed]
- College of American Pathologists. Protocol for the Examination of Resection Specimens from Patients with Primary Carcinoma of the Colon and Rectum, Version 4.1.0.0. Available online: https://documents.cap.org/protocols/cp-gilower-colonrectum-resection-20-4100.pdf (accessed on 23 January 2024).
- Roelands, J.; van der Ploeg, M.; Ijsselsteijn, M.E.; Dang, H.; Boonstra, J.J.; Hardwick, J.C.H.; Hawinkels, L.J.A.C.; Morreau, H.; de Miranda, N.F.C.C. Transcriptomic and immunophenotypic profiling reveals molecular and immunological hallmarks of colorectal cancer tumourigenesis. Gut 2023, 72, 1326–1339. [Google Scholar] [CrossRef] [PubMed]
- Ding, D.; Han, S.; Zhang, H.; He, Y.; Li, Y. Predictive biomarkers of colorectal cancer. Comput. Biol. Chem. 2019, 83, 107106. [Google Scholar] [CrossRef] [PubMed]
- Ghafouri-Fard, S.; Hussen, B.M.; Gharebaghi, A.; Eghtedarian, R.; Taheri, M. LncRNA signature in colorectal cancer. Pathol. Res. Pract. 2021, 222, 153432. [Google Scholar] [CrossRef]
- Shi, J.; Yan, S.; Li, W.; Yang, X.; Cui, Z.; Li, J.; Li, G.; Li, Y.; Hu, Y.; Gao, S. PacBio full-length transcriptome analysis provides new insights into transcription of chloroplast genomes. RNA Biol. 2023, 20, 248–256. [Google Scholar] [CrossRef]
- Zwart, W.H.; Hotca, A.; Hospers, G.A.P.; Goodman, K.A.; Garcia-Aguilar, J. The Multimodal Management of Locally Advanced Rectal Cancer: Making Sense of the New Data. In American Society of Clinical Oncology Educational Book; ASCO Publications: Alexandria, VA, USA, 2022; Volume 42, pp. 1–14. [Google Scholar] [CrossRef]
- Nishizaki, D.; Hida, K.; Sumii, A.; Okamura, R.; Sakai, Y.; Konishi, T.; Akiyoshi, T.; Maruyama, S.; Okajima, M.; Miyakura, Y.; et al. Laparoscopic Versus Open Surgery for Locally Advanced Rectal Cancer: Five-Year Survival Outcomes in a Large, Multicenter, Propensity Score-Matched Cohort Study. Dis. Colon. Rectum 2022, 65, 1005–1014. [Google Scholar] [CrossRef]
- Kumar, A.; Gautam, V.; Sandhu, A.; Rawat, K.; Sharma, A.; Saha, L. Current and emerging therapeutic approaches for colorectal cancer: A comprehensive review. World J. Gastrointest. Surg. 2023, 15, 495–519. [Google Scholar] [CrossRef]
- Dariya, B.; Aliya, S.; Merchant, N.; Alam, A.; Nagaraju, G.P. Colorectal Cancer Biology, Diagnosis, and Therapeutic Approaches. Crit. Rev. Oncog. 2020, 25, 71–94. [Google Scholar] [CrossRef]
- Pino, M.S.; Chung, D.C. The chromosomal instability pathway in colon cancer. Gastroenterology 2010, 138, 2059–2072. [Google Scholar] [CrossRef]
- Davis, R.T.; Blake, K.; Ma, D.; Gabra, M.B.I.; Hernandez, G.A.; Phung, A.T.; Yang, Y.; Maurer, D.; Lefebvre, A.E.Y.T.; Alshetaiwi, H.; et al. Transcriptional diversity and bioenergetic shift in human breast cancer metastasis revealed by single-cell RNA sequencing. Nat. Cell Biol. 2020, 22, 310–320. [Google Scholar] [CrossRef]
- Statello, L.; Guo, C.J.; Chen, L.L.; Huarte, M. Gene regulation by long non-coding RNAs and its biological functions. Nat. Rev. Mol. Cell Biol. 2021, 22, 96–118. [Google Scholar] [CrossRef]
- Sun, W.; Lu, Y.; Zhang, H.; Zhang, J.; Fang, X.; Wang, J.; Li, M. Mitochondrial Non-Coding RNAs Are Potential Mediators of Mitochondrial Homeostasis. Biomolecules 2022, 12, 1863. [Google Scholar] [CrossRef] [PubMed]
- Xu, X.; Ji, H.; Jin, X.; Cheng, Z.; Yao, X.; Liu, Y.; Zhao, Q.; Zhang, T.; Ruan, J.; Bu, W.; et al. Using Pan RNA-Seq Analysis to Reveal the Ubiquitous Existence of 5′ and 3′ End Small RNAs. Front. Genet. 2019, 10, 105. [Google Scholar] [CrossRef]
- Bhattacharjee, R.; Prabhakar, N.; Kumar, L.; Bhattacharjee, A.; Kar, S.; Malik, S.; Kumar, D.; Ruokolainen, J.; Negi, A.; Jha, N.K.; et al. Crosstalk between long noncoding RNA and microRNA in Cancer. Cell Oncol. 2023, 46, 885–908. [Google Scholar] [CrossRef]
- Laham-Karam, N.; Laitinen, P.; Turunen, T.A.; Yla-Herttuala, S. Activating the Chromatin by Noncoding RNAs. Antioxid. Redox Signal 2018, 29, 813–831. [Google Scholar] [CrossRef]
- Wang, J.; Chen, J.; Sen, S. MicroRNA as Biomarkers and Diagnostics. J. Cell Physiol. 2016, 231, 25–30. [Google Scholar] [CrossRef]
- Hatok, J.; Racay, P. Bcl-2 family proteins: Master regulators of cell survival. Biomol. Concepts 2016, 7, 259–270. [Google Scholar] [CrossRef]
- Baker, S.J.; Poulikakos, P.I.; Irie, H.Y.; Parekh, S.; Reddy, E.P. CDK4: A master regulator of the cell cycle and its role in cancer. Genes Cancer 2022, 13, 21–45. [Google Scholar] [CrossRef] [PubMed]


| Name | Sequence 5′ → 3′ | Strand |
|---|---|---|
| MDL1AS.1 | GUACUACAGGUGGUCAAGUAUUUAT | + |
| AUAAAUACUUGACCACCUGUAGUACAU | − | |
| MDL1AS.2 | GUCGGAUACAGUUCACUUUAGCUAC | + |
| GUAGCUAAAGUGAACUGUAUCCGACAU | − | |
| MDL1AS.3 | GACAUUCAAUUGUUAUUAUUAUGTC | + |
| GACAUAAUAAUAACAAUUGAAUGUCUG | − |
| Gene | Forward 5′ → 3′ | Reverse 5′ → 3′ | |
|---|---|---|---|
| 1 | MDL1 | TCAACTGCAACTCCAAAGCC | GGGGACGAGAAGGGATTTGA |
| 2 | MDL1 | CAGCCACTTTCCACACAGAC | GGTTAGGCTGGTGTTAGGGT |
| 3 | MDL1AS | CATGGGGACGAGAAGGGATT | CACACATCAACTGCAACTCCA |
| 4 | MDL1AS | GGTTAGGCTGGTGTTAGGGT | CAGCCACTTTCCACACAGAC |
| 5 | MDL1AS | ACATTACTGCCAGCCACCAT | TGCTTGTAAGCATGGGGAGG |
| 6 | MDL1AS | GTCCCTTGACCACCATCCTC | GGGGAACGTGTGGGCTATTT |
| 7 | BCL2 | ATGTGTGTGGAGAGCGTCAA | GGAGGAAGTCCAATGTCCAG |
| 8 | BAX | GTGGCAGCTGACATGTTTTC | GGAGGAAGTCCAATGTCCAG |
| 9 | BAD | CGGAGGATGAGTGACGAGTT | CCAGGACTGGAAGACTCGC |
| 10 | CCNA1 | TGAAATAAGGCACAGACCCAAAGC | ACCAGCCAGTCCACCAGAATCGT |
| 11 | CDKN1A | TGTCCGTCAGAACCCATGC | AAAGTCGAAGTTCCATCGCTC |
| 12 | CDK4 | TCGTGAGGTGGCTTTACTGAGGCG | TCCTTGATCGTTTCGGCTGGCA |
| 13 | ND1 | CCTCCTACTCCTCATTGTACCC | CAGCGAAGGGTTGTAGTAGC |
| 14 | GAPDH | AAATCCCATCACCATCTTCC | GACTCCACGACGTACTCAGC |
| Factor | Survival ≥ 5 Years | Survival < 5 Years | p Value |
|---|---|---|---|
| Age (mean ± sd) | 60.47 ± 10.57 | 64.70 ± 9.29 | 0.094 |
| Sex (Male: Female, n) | 28:14 | 21:6 | 0.327 |
| Lymph node affectation y/n | 8/34 | 9/17 | 0.154 |
| Removed lymph nodes (mean ± sd) | 0.93 ± 1.27 | 0.81 ± 1.95 | 0.550 |
| Positive lymph nodes (mean ± sd) | 8.71 ± 5.02 | 7.96 ± 4.86 | 0.208 |
| Chemotherapy n (%) | 31 (73.8%) | 19 (70.4%) | 0.774 |
| Mutated KRAS n (%) | 9 (21.4%) | 7 (26.9%) | 0.610 |
| Microsatellite instability n (%) | 6 (14.6%) | 3 (11.5%) | 0.722 |
| Smoker n (%) | 22 (52.4%) | 16 (59.3%) | 0.581 |
| MDL1 RPKM (mean ± sd) | 2279.34 ± 1080.24 | 1976.40 ± 596.34 | 0.187 |
| MDL1AS RPKM (mean ± sd) | 1630.60 ± 875.62 | 1278.23 ± 387.18 | 0.053 |
| Factor | High Expression | Low Expression | p Value |
|---|---|---|---|
| Age (mean ± sd) | 64.93 ± 8.40 | 61.35 ± 10.62 | 0.233 |
| Sex (Male: Female, n) | 10:5 | 39:15 | 0.680 |
| Lymph node affectation y/n | 6/9 | 11/42 | 0.132 |
| Removed lymph nodes (mean ± sd) | 0.93 ± 1.27 | 0.81 ± 1.95 | 0.813 |
| Positive lymph nodes (mean ± sd) | 8.71 ± 4.69 | 8.35 ± 5.05 | 0.820 |
| Chemotherapy n (%) | 12 (80%) | 38 (70%) | 0.507 |
| Mutated KRAS n (%) | 2 (14%) | 14 (26%) | 0.368 |
| Microsatellite instability n (%) | 3 (21%) | 6 (11%) | 0.331 |
| Smoker n (%) | 6 (40%) | 32 (59%) | 0.189 |
| MDL1 RPKM (mean ± sd) | 3426.88 ± 863.44 | 1809.11 ± 573.59 | <0.00001 |
| MDL1AS RPKM (mean ± sd) | 2580.66 ± 736.16 | 1190.51 ± 366.02 | <0.00001 |
Disclaimer/Publisher’s Note: The statements, opinions and data contained in all publications are solely those of the individual author(s) and contributor(s) and not of MDPI and/or the editor(s). MDPI and/or the editor(s) disclaim responsibility for any injury to people or property resulting from any ideas, methods, instructions or products referred to in the content. |
© 2024 by the authors. Licensee MDPI, Basel, Switzerland. This article is an open access article distributed under the terms and conditions of the Creative Commons Attribution (CC BY) license (https://creativecommons.org/licenses/by/4.0/).
Share and Cite
Garrido, P.; Casas-Benito, A.; Larrayoz, I.M.; Narro-Íñiguez, J.; Rubio-Mediavilla, S.; Zozaya, E.; Martín-Carnicero, A.; Martínez, A. Expression of Mitochondrial Long Non-Coding RNAs, MDL1 and MDL1AS, Are Good Prognostic and/or Diagnostic Biomarkers for Several Cancers, Including Colorectal Cancer. Cancers 2024, 16, 960. https://doi.org/10.3390/cancers16050960
Garrido P, Casas-Benito A, Larrayoz IM, Narro-Íñiguez J, Rubio-Mediavilla S, Zozaya E, Martín-Carnicero A, Martínez A. Expression of Mitochondrial Long Non-Coding RNAs, MDL1 and MDL1AS, Are Good Prognostic and/or Diagnostic Biomarkers for Several Cancers, Including Colorectal Cancer. Cancers. 2024; 16(5):960. https://doi.org/10.3390/cancers16050960
Chicago/Turabian StyleGarrido, Pablo, Adrián Casas-Benito, Ignacio M. Larrayoz, Judit Narro-Íñiguez, Susana Rubio-Mediavilla, Enrique Zozaya, Alfonso Martín-Carnicero, and Alfredo Martínez. 2024. "Expression of Mitochondrial Long Non-Coding RNAs, MDL1 and MDL1AS, Are Good Prognostic and/or Diagnostic Biomarkers for Several Cancers, Including Colorectal Cancer" Cancers 16, no. 5: 960. https://doi.org/10.3390/cancers16050960
APA StyleGarrido, P., Casas-Benito, A., Larrayoz, I. M., Narro-Íñiguez, J., Rubio-Mediavilla, S., Zozaya, E., Martín-Carnicero, A., & Martínez, A. (2024). Expression of Mitochondrial Long Non-Coding RNAs, MDL1 and MDL1AS, Are Good Prognostic and/or Diagnostic Biomarkers for Several Cancers, Including Colorectal Cancer. Cancers, 16(5), 960. https://doi.org/10.3390/cancers16050960