Simple Summary
We introduced a drug screening platform for patient-derived cells (PDCs) from lung cancer patients. The drug sensitivity results of short-term-cultured PDCs were significantly associated with clinical outcomes in patients with targeted therapy. The PDC drug screening platform was useful to predict the clinical outcomes of patients treated with targeted therapy and facilitated precision medicine for patients without relevant driver oncogenes. We expect that the PDC drug screening platform, as a feasible tool, can be used to guide target therapy for lung cancer patients and may overcome the limitation of genomic assay-based targeted therapy.
Abstract
Intratumor heterogeneity leads to different responses to targeted therapies, even within patients whose tumors harbor identical driver oncogenes. This study examined clinical outcomes according to a patient-derived cell (PDC)-based drug sensitivity test in lung cancer patients treated with targeted therapies. From 487 lung cancers, 397 PDCs were established with a success rate of 82%. In 139 PDCs from advanced non-small-cell lung cancer (NSCLC) patients receiving targeted therapies, the standardized area under the curve (AUC) values for the drugs was significantly correlated with their tumor response (p = 0.002). Among 59 chemo-naive EGFR/ALK-positive NSCLC patients, the PDC non-responders showed a significantly inferior response rate (RR) and progression-free survival (PFS) for the targeted drugs than the PDC responders (RR, 25% vs. 78%, p = 0.011; median PFS, 3.4 months [95% confidence interval (CI), 2.8–4.1] vs. 11.8 months [95% CI, 6.5–17.0], p < 0.001). Of 25 EGFR-positive NSCLC patients re-challenged with EGFR inhibitors, the PDC responder showed a higher RR than the PDC non-responder (42% vs. 15%). Four patients with wild-type EGFR or uncommon EGFR-mutant NSCLC were treated with EGFR inhibitors based on their favorable PDC response to EGFR inhibitors, and two patients showed dramatic responses. Therefore, the PDC-based drug sensitivity test results were significantly associated with clinical outcomes in patients with EGFR- or ALK-positive NSCLC. It may be helpful for predicting individual heterogenous clinical outcomes beyond genomic alterations.
1. Introduction
Advances in molecular biology and genetic technology have led to substantial progress in personalized anti-cancer treatment [1]. Lung cancer is perhaps the best-known application of personalized treatment, based on the development and use—over the past few decades—of several drugs targeting unique oncogenic driver mutations [2]. For example, an EGFR-targeting drug is the first molecularly targeted therapy that has led to a paradigm shift in the management of patients with advanced non-small-cell lung cancer (NSCLC) [3]. This drug has been used as a standard first-line treatment for patients with lung cancer harboring EGFR exon 19 deletion or exon 21 L858R mutations from multiple randomized clinical trials [4,5,6,7,8]. Molecular testing for patients newly diagnosed with non-small-cell lung cancer (NSCLC), including alterations in the genes EGFR, ALK, KRAS, ROS1, BRAF, NTRK, MET, RET, and ERBB2, is routinely performed to detect genetic alterations and thus determine the appropriate targeted therapy. However, even when genotype-directed targeted therapies are appropriately chosen, several clinical challenges remain. Of these, tumor heterogeneity is a major issue; it can unexpectedly reduce the efficacy of targeted therapy and thus worsen survival outcomes [9,10]. Therefore, multiple efforts are underway to overcome these limitations and enhance the efficacy of targeted therapy in lung cancer. For example, biological in vitro system models, including patient-derived cell cultures (PDCs), patient-derived xenografts, and patient-derived organoids, constitute innovative attempts to better predict drug sensitivity in individual tumors [11,12]. The advantages of patient-derived xenografts and patient-derived organoid models include their abilities to sufficiently recapitulate each tumor’s heterogeneous molecular characteristics. However, neither model is easily implemented in clinical settings because of the limited drug screening scalability, low success rate, and high cost and time requirements [11]. In contrast, the PDC model is a biological system that is easily manipulated and allows for the rapid testing of drug sensitivity [11]. It has been broadly evaluated in various cancer studies, including studies that demonstrate its clinical relevance in terms of predicting a tumor’s drug sensitivity [13,14]. However, prolonged and repetitive culturing can result in a PDC that lacks the heterogenous features of the original tumor. This weakness of the PDC model led to the proposal of a short-term PDC model that can accurately represent the original tumor [15,16,17]. Thus, the present study evaluated the clinical feasibility and efficiency of a large-scale drug screening platform based on a short-term PDC model; the findings are expected to provide guidance for lung cancer treatment.
2. Materials and Methods
2.1. PDC Establishment
Tumor samples were collected from patients diagnosed with advanced lung cancer at the National Cancer Center Hospital (Goyang, Republic of Korea) from August 2016 to June 2022. PDCs were established from pleural effusion, pericardial effusion, ascites, and tumor tissue samples. Tumor fluid samples were transferred to conical tubes and centrifuged at 120× g for 10 min. Each cell pellet was resuspended in the Roswell Park Memorial Institute (RPMI 1640, Corning, Manassas, VA, USA) medium and carefully layered onto a lymphocyte separation medium (#091692249; MP Biomedicals, Solon, OH, USA). After the suspension was centrifuged at 400× g for 30 min at room temperature, the tumor cells were trapped in the interphase layer between the RPMI 1640 medium and the lymphocyte separation medium; these cells were harvested and washed with the RPMI 1640 medium. The tumor tissue samples were finely minced and washed with the RPMI 1640 medium. Cells released into the washing fluid or from the tissue were cultured in the AR-5 medium (5% fetal bovine serum (Corning, Manassas, VA, USA), 1 × GlutaMAX (Thermo Fisher Scientific, Waltham, MA, USA), 1× ITS (insulin–transferrin–selenium, Thermo Fisher Scientific), 1% penicillin/streptomycin, 50 nM of hydrocortisone, 1 mM of sodium pyruvate, and 1 ng/mL of epidermal growth factor in RPMI 1640 medium) at 37 °C under 5% CO2. The medium was carefully exchanged every 2–3 days until cells stabilized on the bottom of the flask.
2.2. Drug Sensitivity Screening Using PDCs
For each treatment, stabilized PDCs were seeded in 384-well plates (1000 cells/well in 20 μL aliquots) in quadruplicate. Simultaneous tests were conducted for 64 chemotherapeutic agents that are commonly used to treat lung cancer or have shown promising efficacy in preclinical studies (Table S1). After overnight incubation, the cells were treated with one drug at a 5-fold serial dilution for a total of six doses (50 μM to 16 nM). Cell viability was measured after 72 h of treatment using the CellTiter-Glo Luminescent cell viability assay kit (Promega, Madison, WI, USA) and an Infinite 200 Pro system (TECAN, Mannedorf, Switzerland). Each screening plate contained a dimethyl-sulfoxide-only vehicle control to calculate the relative cell viability and normalize the data. Dose–response curve fitting and area under the curve (AUC) values were assessed using GraphPad Prism 5.3 (GraphPad Software Inc., San Diego, CA, USA). The relative sensitivity of each drug was determined by calculating standardized AUCs based on means and standard deviations, using Excel (Microsoft Office 2013 Excel).
2.3. Cell Line and Reagents
Human lung cancer cell lines were used as a reference for drug sensitivity. PC9 cells, as lung cancer cells with an EGFR exon 19 deletion mutation, were purchased from RIKEN BioResource Center Cell Bank (Ibaraki, Japan). SNU-2292 cells, as lung cancer cells with an ALK fusion, were obtained from the Korea Cell Bank (Seoul, Republic of Korea). H1299 cells and A549 cells, as lung cancer cells harboring wild-type EGFR and ALK, respectively, were purchased from the American Type Culture Collection (Manassas, VA, USA) and the Korea Cell Bank (Seoul, Republic of Korea). All cell lines were maintained in RPMI 1640 medium with 10% fetal bovine serum. Cell-line authentication was performed annually at the Genomic Core Facility of the National Cancer Center. Compounds included in the screening-compound library were newly prepared each month and tested for the preservation of chemical activities using NSCLC cancer cell lines (A549, PC9, and H1299). All library compounds were purchased from Selleckchem (Houston, TX, USA).
2.4. Clinical Data Collection
Medical records and radiographic images were reviewed; a predesigned data collection format was used to collect data regarding the clinicopathological characteristics of the tumor, tumor response, and patient survival outcomes. The tumor response was generally assessed during chemotherapy at intervals of 6–12 weeks, via computed tomography and other imaging techniques, in accordance with guidelines established by the Response Evaluation Criteria in Solid Tumors (RECIST) Committee 1.1 [18].
2.5. Targeted Next-Generation Sequencing (NGS) of PDCs
Genomic DNA was extracted from cultured cells using the AllPrep DNA/RNA mini kit (Qiagen, Hilden, Germany) and processed on a QIAcube automatic instrument (Qiagen). Fragmented genomic DNA was hybridized with RNA probes from the SureSelect XT custom panel kit library and sequenced on an Illumina NovaSeq 6000 platform (Illumina, San Diego, CA, USA). Images were analyzed using the NovaSeq6000 control software, v1.3.1, and output base calling data were de-multiplexed with bcl2fastq v2.20.0.422 by generating fastQC files.
2.6. Statistical Analysis
The Pearson χ2 test and Fisher’s exact test were used to determine relationships between categorical variables, as appropriate. Relationships between categorical variables and continuous variables were assessed using the Mann–Whitney U test or a one-way analysis of variance (ANOVA). Progression-free survival (PFS) was calculated from treatment initiation to the first documentation of disease progression, death, or the last follow-up visit. Overall survival (OS) was calculated from treatment initiation to death or the last follow-up visit. Survival differences were estimated using the Kaplan–Meier method; survival differences were compared between groups using the log-rank test. Cox proportional hazards models were used to calculate hazard ratios for survival. Two-sided p-values < 0.05 were assumed to indicate statistical significance.
3. Results
3.1. Establishment of PDC Drug Screening Platform
PDCs were established using malignant effusion and/or tissue samples from patients with advanced lung cancer, with a success rate of 81.5% (397/487, Figure 1A, Table S2). The cultures were used to assess sensitivity to 64 anti-cancer drugs (Table S1) within less than one cell culture passage. The median time from sample collection to drug response report was 15.5 days (range, 4–64 days). Most patients had adenocarcinoma (n = 320 [81%]) previously treated with chemotherapy or targeting agents (n = 279 [70%]). The PDCs were derived from patients who received targeted therapy (n = 182, 45.8%) or non-targeted chemotherapy (n = 215, 54.2%) (Figure 1B). There were 43 (23.6%) treatment-naïve patients in the targeted therapy group and 75 (34.9%) treatment-naïve patients in the non-targeted chemotherapy group.
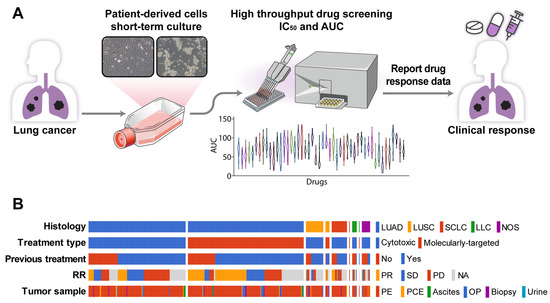
Figure 1.
PDC drug screening platform. (A) Overview of the PDC drug screening platform. (B) Summary plot of a comprehensive analysis of PDC drug responses and clinical outcomes based on 397 PDCs. Abbreviations: LUAD, lung adenocarcinoma; LUSC, lung squamous cell carcinoma; SCLC, small-cell lung carcinoma; LCC, large-cell carcinoma; NOS, other histologic-type tumor; RR, response rate; PR, partial response; SD, stable disease; PD, progression disease; NA, not analyzed; PE, pleural effusion; PCE, pericardial effusion; OP, operation tissue.
3.2. Association between PDC Drug Sensitivity and Clinical Tumor Response
A comparison of the PDC drug sensitivity with the clinical tumor response (Figure 2A) was performed using 279 PDCs for which both in vitro drug response data and subsequent chemotherapy outcome and follow-up data were available (Figure 2A). These cases were divided into two groups: targeted treatment and non-targeted treatment. The targeted treatment group included 139 PDCs from treatment-naïve patients whose tumors contained EGFR (n = 103), HER2 (n = 3), or BRAF V600E (n = 1) mutations; ALK fusion (n = 17); or MET amplification (n = 16). Sensitivity to the targeting agent was determined by calculating the standardized AUC value of the drug. In this group, the standardized AUC values of the PDCs were significantly associated with the clinical tumor response (one-way ANOVA, p = 0.002). AUC values were significantly higher in the progressive disease (PD) subgroup than in the stable disease (SD) or partial response (PR) subgroups (median standardized AUC values: 0.23 [95% confidence interval (CI), −0.16 to 0.55] in PD, −0.26 [95% CI, −0.44 to 0.14] in SD, and −0.31 [−0.87 to −0.29] in PR). The AUC values of PDCs in the cytotoxic chemotherapy group were not associated with the clinical tumor response (one-way ANOVA, p = 0.973).
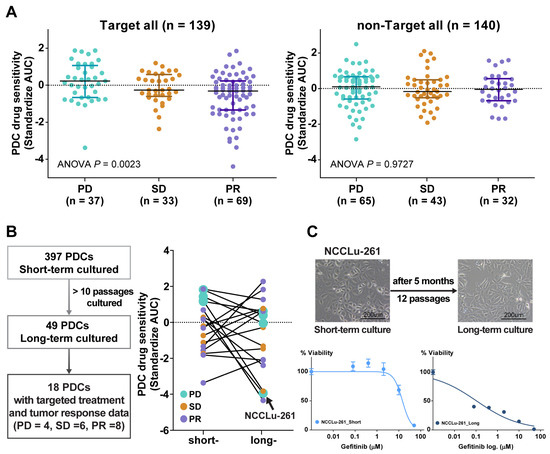
Figure 2.
(A) Scatter plot of the standardized AUC values of drugs according to tumor response from the PDCs of 139 patients who received targeted therapy and 140 patients who received non-targeted therapy. (B) Scatter plot of the standardized AUC values of short-term and long-term PDCs. (C) Bright-field microscopy images of PDC NCCLu-261 after 7 days (short-term) and 5 months (long-term). Scale bar, 200 μm. Viability curve of gefitinib-treated cells from PDC NCCLu-261 in short-term and long-term culture.
Attempts to obtain long-term PDCs (>10 passages) to establish permanent cell lines and thus evaluate changes in drug sensitivity over time were successful for only 49 cultures (12.3%). A response comparable with the patient’s tumor response to targeted therapy was obtained in 18 of these PDCs. In the other PDCs, the drug sensitivity changed in a variable manner after long-term passage. In four long-term PDCs established from patients who developed acquired resistance to the drugs (PD subgroup), the AUC values of the targeted drugs were lower than in the initial short-term PDCs (Figure 2B). For example, in a 77-year-old female patient (case NCCLu-261) with stage IV lung adenocarcinoma displaying EGFR 19 deletion and acquired resistance to erlotinib after an initial response, the short-term PDC was insensitive to gefitinib but the long-term PDC was sensitive (standardized AUCs = 1.21 and −3.82, respectively; Figure 2C). This finding suggests that the true clinical outcome will be better reflected by the short-term PDC rather than the long-term PDC.
3.3. PDC Drug Sensitivity Predicts Clinical Outcome in Treatment-Naive EGFR- or ALK-Positive NSCLC
The predictive role of PDC drug sensitivity in the targeting agent group was further explored in treatment-naive patients whose tumors harbored EGFR mutations (n = 49) or ALK fusion (n = 10) (Figure S1). The median patient age was 64 years (range, 37–84 years), and 61.0% of the patients were women (Table S3). Adenocarcinoma was the predominant histologic type (94.9%), and most PDCs were derived from effusions (93.2%). PR, SD, and PD were achieved in 39 (66%), 10 (17%), and 10 (17%) patients, respectively. The median PFS was 8.6 months (95% CI, 7.0–10.0 months), and the median OS was 21.5 months (95% CI, 17.0–25.9 months). A comparison of the PDC drug sensitivity and clinical tumor response showed that the PDC AUC values for EGFR- or ALK-TKIs were significantly associated with the clinical tumor response (median standardized AUC values: −0.78 in PR, −0.29 in SD, and 0.30 in PD; p < 0.001; Figure 3A). The waterfall plot similarly showed a strong trend between PDC AUC values and the clinical tumor response to EGFR- or ALK-TKIs (Figure 3B).
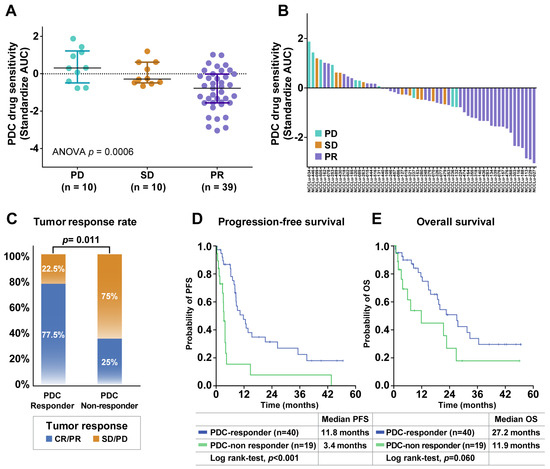
Figure 3.
Associations of PDC drug response with clinical outcomes after targeted therapy. (A) Scatter plot of standardized AUC values from PDCs testing EGFR- or ALK-targeted drugs according to the tumor response in 59 chemo-naive EGFR- or ALK-positive NSCLC patients. Horizontal lines represent the 0.25, 0.50 (black), and 0.75 quantiles. The p value was calculated by ANOVA. (B) Waterfall plot of standardized AUC values from the PDCs as shown for each drug. (C) Tumor response rates between PDC responders and PDC non-responders. The p value was calculated by Pearson χ2 test. (D,E) Kaplan–Meier curves for progression-free survival (PFS) and overall survival (OS) of PDC responders and PDC non-responders. Abbreviations: PD, progressive disease; SD, stable disease; PR, partial response.
The patients were divided into two subgroups according to the baseline responses of their PDCs to the corresponding TKIs. PDC responder patients were defined based on a standardized AUC value of ≤50% in their PDC; PDC non-responders were defined based on a standardized AUC value of > 50% in their PDC (Table S4). The PDC non-responder group (n = 19) had a significantly lower tumor response rate compared with the PDC responder group (n = 40) (25.0% vs. 77.5%, p = 0.011; Figure 3C). The median PFS was significantly shorter among PDC non-responders than among PDC responders (3.4 months [95% CI, 2.8–4.1 months] vs. 11.8 months [95% CI, 6.5–17.0 months]; p < 0.001) (Figure 3D). A trend toward a shorter OS was also identified in the PDC non-responder group compared with the PDC responder group (11.9 months [95% CI, 2.4–26.0 months] vs. 27.2 months [95% CI, 17.7–36.6 months]; p = 0.060) (Figure 3E). These trends were observed in both the subgroup positive for EGFR mutations and in the subgroup positive for ALK fusion (Figure S2). The predictive role of the PDC response to the targeting agent was evaluated with respect to well-established predictive factors, including age, sex, Eastern Cooperative Oncology Group (ECOG) performance status, smoking history, histology, operation history, brain metastasis status, and TP53 mutation status (Table 1 and Table S5). In the multivariate analysis of PFS, the baseline PDC response was independently associated with a better PFS in untreated patients with EGFR/ALK-positive lung cancer (hazard ratio: 0.20, 95% CI: 0.07–0.0.60, p = 0.004). Genetic alterations in PDCs were also analyzed to identify potential resistance mechanisms, but there were no significant differences in genetic profiles between PDC responders and non-responders (Figure S3).

Table 1.
Multivariate analysis of progression-free survival for EGFR- or ALK-tyrosine.
3.4. Causes of a Poor Response to EGFR- or ALK-TKIs
Mechanisms underlying poor clinical responses to EGFR- or ALK-TKIs were examined by analyzing the clinical, pathological, and genomic characteristics of the 10 PDC non-responders (Table S6). Three patients had SD (30%) and seven patients had PD (70%) as the best response to first-line TKIs; the median PFS was 1.7 (95% CI, 0.1–3.7) months and the median OS was 6.0 (95% CI, 1.4–10.6) months. A comprehensive analysis revealed several potential causes of resistance to EGFR- or ALK-TKIs, described in the following sections.
3.4.1. Concurrent Resistant Gene Alterations
A 63-year-old male patient with stage IV lung adenocarcinoma displaying EGFR 19 deletion (case NCCLu-263) received erlotinib as the first-line treatment (Figure 4A–D). Targeted NGS with plasma circulating tumor DNA (ctDNA) detected PIK3CA M1004I and the EGFR 19 deletion. The baseline PDC was established on day 9 after sampling (Figure 4A). Targeted NGS of the baseline PDC also identified PIK3CA M1004I and the EGFR 19 deletion. Baseline PDC drug sensitivity screening showed insensitivity to gefitinib (standardized AUC value, 0.23; Figure 4B). The patient’s best response to first-line erlotinib was SD, but his disease progressed after 3.1 months (Figure 4D). Treatment consisting of an EGFR-TKI together with a PIK3CA inhibitor was investigated using the PDC sample, which showed synergism of the two drugs in terms of inhibiting the growth of cells harboring the identified EGFR and PIK3CA mutations (Figure 4C).
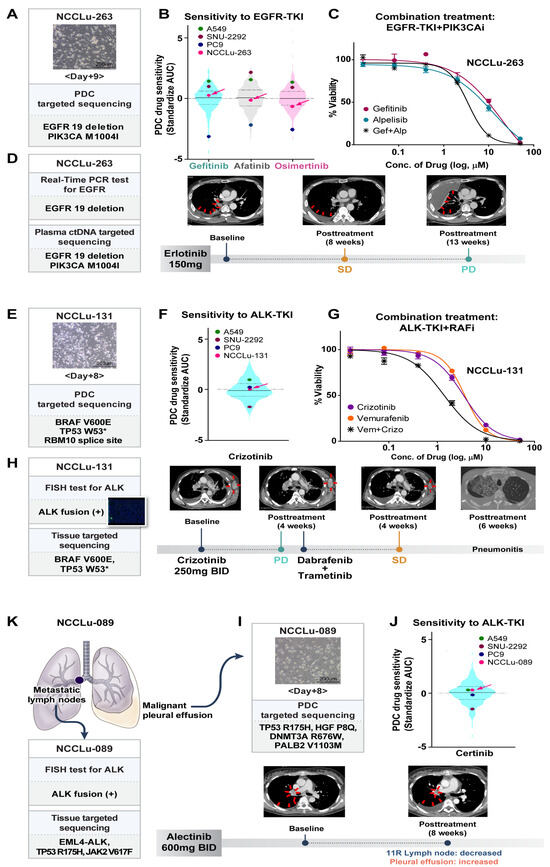
Figure 4.
PDC predictions of unexpected non-responders to targeted therapy. (A–D) Case NCCLu-263. (A) Bright-field microscopy images of the PDC after 9 days of culture. Scale bar, 200 μm. (B) Violin plots of the standardized AUC values of EGFR-TKIs based on 396 PDCs. Each dot indicates the AUC value of PDC NCCLu-263 or the control cell lines (positive control, PC9 with EGFR 19 deletion; negative control, A549 and SNU-2292 with wild-type EGFR). Horizontal lines represent the 0.25, 0.50, and 0.75 quantiles. (C) Viability curves of cells from PDC NCCLu-263 treated with gefitinib, alpelisib, or both. (D) Chest computed tomography images of the patient before and after treatment. Red arrows indicate the tumor. (E–H) Case NCCLu-131. (E) Bright-field microscopy images of the PDC after 8 days of culture. Scale bar, 200 μm. (F) Violin plots of the standardized AUC values of crizotinib based on 386 PDCs. Each dot indicates the AUC values of PDC NCCLu-131 or the control cell lines (positive control, SNU-2292 with ALK fusion; negative control, A549 and PC9 with wild-type ALK). Horizontal lines represent the 0.25, 0.50, and 0.75 quantiles. (G) Viability curves of cells from NCCLu-131 PDC treated with crizotinib, vemurafenib, or both. (H) Chest computed tomography images of the patient before and after treatment. Red arrows indicate the tumor. (I–K) Case NCCLu-089. (I) Bright-field microscopy images of the PDC after 8 days of culture. Scale bar, 200 μm. (J) Violin plots of the standardized AUC values of ceritinib based on 381 PDCs. Each dot indicates the AUC values of PDC NCCLu-089 or control cell lines (positive control, SNU-2292 with ALK fusion; negative control, A549 and PC9 with wild-type ALK). Horizontal lines represent the 0.25, 0.50, and 0.75 quantiles. (K) Chest computed tomography of the patient before and after treatment. Red arrows indicate the tumor. Abbreviations: EGFR-TKI, EGFR tyrosine kinase inhibitor; PIK3CAi, PIK3CA inhibitor; RAFi, RAF inhibitor; SD, stable disease; PD, progressive disease.
3.4.2. Intra-Tumoral Heterogeneity
A 60-year-old male patient (PDC case-131) with stage IV lung adenocarcinoma displaying ALK fusion received crizotinib (Figure 4E–H). Multiple genetic tests of a biopsy sample of the left axillary metastatic lymph nodes were performed at the time of diagnosis. A companion fluorescence in situ hybridization assay of the biopsy samples revealed ALK fusion (Figure 4H). However, after 4 weeks, targeted NGS of the same tumor tissue showed a BRAF V600E mutation but no evidence of an ALK fusion. The results of the patient’s baseline PDC NGS and the PDC drug sensitivity test are shown in Figure 4E. The baseline PDC NGS results were consistent with the tumor NGS data; they also showed a BRAF V600E mutation without an ALK fusion. The PDC drug screening test revealed insensitivity to crizotinib (standardized AUC value, 0.07; Figure 4F). The patient began crizotinib treatment for ALK-positive lung cancer, but metastasis increased in the left axillary and right mediastinal metastatic lymph nodes; the patient’s disease progressed after 4 weeks of treatment (Figure 4H). Because the tumor findings, PDC NGS analysis, and PDC drug sensitivity test suggested both ALK-positive cells and BRAF-mutated malignant cells, the combined effect of an ALK-TKI and a BRAF inhibitor was tested on the PDC. The results showed synergistic action of the two drugs (Figure 4G). After treatment with dabrafenib plus trametinib, SD was identified in the left axillary and mediastinal metastatic lymph nodes. However, the patient discontinued treatment after 6 weeks because of severe pneumonitis.
3.4.3. Inter-Lesional Tumor Heterogeneity
A 37-year-old female patient (case NCCLu-089) was diagnosed with stage IV lung adenocarcinoma displaying ALK fusion (Figure 4I–K). The ALK fusion was detected in her mediastinal lymph nodes by immunohistochemistry and targeted NGS. However, in the baseline PDC (derived from the malignant pleural effusion), the ALK fusion was not detected; the drug screening test showed insensitivity to ceritinib (standardized AUC value, 0.29; Figure 4I,J). After 8 weeks of alectinib treatment, ALK-fusion-positive cells in the patient’s mediastinal lymph nodes decreased but ALK fusion-negative malignant cells increased in the pleural effusion (Figure 4K). Subsequent treatment consisted of pemetrexed and cisplatin, but the patient’s disease did not respond to either drug.
3.4.4. Histology
A 58-year-old female patient (case NCCLu-237) was diagnosed with stage IV large-cell neuroendocrine carcinoma displaying ALK fusion. An initial genetic analysis of the liver metastasis showed ALK fusion, confirmed by immunohistochemistry and targeted NGS. However, the baseline PDC drug screening test showed insensitivity to alectinib (standardized AUC value, 0.08). Based on the companion immunohistochemistry results, the patient began alectinib treatment but her disease immediately progressed. After alectinib failure, the ALK fusion statuses of the primary tumor and pleural effusion were re-evaluated, but the genetic alteration remained detectable in both specimens.
3.5. PDC-Based Prediction of an Unexpected Response to EGFR-Targeted Drugs
Among the 397 PDCs subjected to drug screening tests, 47 had a high sensitivity to EGFR-TKIs (rank standardized AUC value, ≤25%; Figure 5A and Table S7). Common drug-sensitive EGFR mutations, including exon 19 deletion and exon 21 L858R, were detected in 30 PDCs; wild-type EGFR was detected in 17 PDCs and an uncommon EGFR mutation (exon 20 insertion) was detected in one PDC. Among the 30 EGFR-TKI-sensitive PDCs with sensitive EGFR mutations, eight were established before EGFR-TKI exposure and 22 were established after EGFR-TKI treatment. All eight EGFR-TKI-naïve patients had a PR to the EGFR-TKIs (eight of eight, 100%). Among the 22 patients who previously received EGFR-TKIs, 11 were re-treated with EGFR-TKIs. Two patients received post-third-generation EGFR-TKIs, whereas nine patients received post-first-generation EGFR-TKIs. None of the tumor cells from these patients showed evidence of a T790M mutation. Five (45%) patients had PRs after the resumption of EGFR-TKI treatment; among 13 patients re-treated with EGFR-TKIs despite PDC insensitivity to the same drugs, the PR was 15% (2 of 13) (Figure 5B). After EGFR-TKI rechallenge, the disease control rates in the EGFR-TKI-sensitive and EGFR-TKI-insensitive PDC groups were 63% and 38%, respectively. A 58-year-old female patient (case NCCLu-045) with stage IV lung adenocarcinoma harboring EGFR L858R received two EGFR-TKIs (erlotinib and olmutinib) and multiple rounds of chemotherapy. However, her PDC was highly sensitive to EGFR-TKIs (Figure 5C–E). PDC drug screening of the malignant effusion collected after docetaxel treatment showed high sensitivity to gefitinib, afatinib, and osimertinib. These results were comparable with the results of in vitro tests using PC9 cells, a lung cancer cell line with an EGFR 19 deletion sensitive to EGFR-TKIs (standardized AUCs for gefitinib, afatinib, and osimertinib: −4.39, −3.15, and −3.21, respectively). Based on the PDC result, the patient was re-treated with erlotinib, which led to a PR, 50% tumor shrinkage, and 11 months of PFS.


Figure 5.
PDC prediction of unexpected responders to EGFR-targeted therapy. (A) Consort diagram of 47 PDCs showing high sensitivity to all three EGFR-TKIs. (B) Pie plots of the percentages of responders among patients rechallenged with EGFR-TKIs after resistance to previous EGFR-TKI treatment for EGFR-mutant NSCLC. (C–E) Case NCCLu-045. (C) Clinical course. (D) Violin plots of the standardized AUC values of gefitinib, afatinib, and osimertinib based on 396, 391, and 229 PDCs, respectively. Each dot indicates the AUC values of PDC NCCLu-045 or control cell lines (positive control, PC9 with EGFR 19 deletion; negative control, A549 and SNU-2292 with wild-type EGFR). Horizontal lines represent the 0.25, 0.50, and 0.75 quantiles. (E) Positron emission tomography images of the patient before and after treatment. Red circles indicate the tumor. (F–H) Case NCCLu-027. (F) Clinical course. (G) Violin plots of the standardized AUC values of gefitinib, afatinib, and osimertinib based on 396, 391, and 229 PDCs, respectively. Each dot indicates the AUC values of PDC NCCLu-027 or the control cell lines (positive control, PC9 with EGFR 19 deletion; negative control, A549 and SNU-2292 with wild-type EGFR). Horizontal lines represent the 0.25, 0.50, and 0.75 quantiles. (H) Positron emission tomography images of the patient before and after treatment. Red circles indicate the tumor. (I–L) Case NCCLu-157. (I) Clinical course. (J) Violin plots of the standardized AUC values of gefitinib, afatinib, and osimertinib based on 396, 391, and 229 PDCs, respectively. Each dot indicates the AUC values of PDC NCCLu-157 or control cell lines (positive control, PC9 with EGFR 19 deletion; negative control, A549 and SNU-2292 with wild-type EGFR). Horizontal lines represent the 0.25, 0.50, and 0.75 quantiles. (K) Chest computed tomography and positron emission tomography images of the patient before and after treatment. Red circles indicate the tumor. (L) Waterfall plot of the standardized AUC value of each classic EGFR-TKI as determined in seven PDCs in which the EGFR exon 20 insertion was identified. Lower panel: actual tumor response to classic EGFR-TKIs in each patient. Abbreviations: EGFR-TKI, EGFR tyrosine kinase inhibitor; 1st G EGFR-TKI, first-generation EGFR-TKI; 3rd G EGFR-TKI, third-generation EGFR-TKI; PR, partial response; SD, stable disease; PD, progressive disease. Associations of PDC drug response with clinical outcomes after targeted therapy.
Among the 17 EGFR-TKI-sensitive PDCs with wild-type EGFR or uncommon EGFR mutations, four of the respective patients received EGFR-TKIs, resulting in PR in two of them (Figure 5A). One patient (case NCCLu-027) was a never-smoking 84-year-old woman with stage IV lung adenocarcinoma lacking driver oncogenes such as EGFR (Figure 5F–H). Genetic tests for EGFR mutations, including a commercial kit (Cobas® mutation assay) and targeted NGS, were performed six times; the results were consistently negative with respect to an EGFR mutation (Figure S4A). However, the patient’s PDC was highly sensitive to all three EGFR-TKIs, similar to the results of in vitro tests using PC9 cells (standardized AUCs for gefitinib, afatinib, and osimertinib: −3.05, −2.18, and −2.22, respectively; Figure 5G). Therefore, the patient was treated with erlotinib, which resulted in a PR for 22 months (Figure 5H). Ultra-deep sequencing was thus performed to detect a drug-sensitive EGFR mutation in the patient’s tumor cells (Figure S4B). A droplet digital polymerase chain reaction analysis of pretreatment plasma ctDNA revealed an EGFR L858R mutation with a 1.4% fractional abundance.
The other patient (case NCCLu-157) was a 61-year-old man diagnosed with stage IV lung adenocarcinoma harboring EGFR exon 20 A763_Y764insFQEA (Figure 5I–K). At the time of diagnosis, EGFR exon 20 insertion-specific targeted therapy was not available. Accordingly, the patient received gemcitabine and carboplatin as the first-line treatment, which induced a PR (Figure 5I); however, his disease progressed after 6 months. A PDC was established using the malignant pleural effusion; a subsequent drug sensitivity test showed high sensitivity to gefitinib, afatinib, and osimertinib (standardized AUC: −1.57, −2.28, and −1.42, respectively; Figure 5J). Based on the PDC response, the patient received erlotinib, resulting in a PR for 8 months (Figure 5K). After disease progression and a switch to erlotinib, tissue NGS was performed, which revealed EGFR T790M present in cis with exon 20 A763_Y764insFQEA. Therefore, the patient began osimertinib treatment, which induced a good response in the resistant tumor (Figure S5). Further drug sensitivity testing to common EGFR-TKIs using PDCs with variable EGFR exon 20 insertions (Figure 5L) showed a variable response according to the EGFR exon 20 insertion type. Only the A763_Y764insFQEA mutation was sensitive to common EGFR-TKIs. Among six patients with PDCs harboring EGFR 20 insertions insensitive to common EGFR-TKIs, four were treated with erlotinib (n = 3) or afatinib (n = 1) but none had a response.
4. Discussion
Although PDC models have been extensively studied as a tool for cancer drug screening, long-term PDCs lose the phenotypic characteristics of the primary tumor, hindering the prediction of clinical outcomes. In this study, 397 lung cancer PDCs were established through short-term culturing, and their sensitivities to different classes of anti-cancer drugs were tested. Additionally, the pharmacogenomic data of the PDCs were matched with the respective patient’s clinical data, allowing for an evaluation of the clinical utility of the PDC model in the management of lung cancer. Our study demonstrated that the drug sensitivity of PDCs to targeting agents was closely associated with the patient’s tumor response; the drug sensitivity of the pretreatment PDC was strongly predictive of the clinical response to EGFR- or ALK-TKIs in patients with EGFR- or ALK-positive lung cancer. Patients with pretreatment PDC insensitivity to the matched TKIs had a shorter PFS compared with patients whose pretreatment PDC displayed high sensitivity to those drugs. Analyses of genomic and functional data from PDCs may reveal contributing factors that distinguish non-responders from responders to EGFR- or ALK-TKIs in the absence of conclusive genomic data.
Although validated genetic tests are used to identify patients whose tumors are likely to respond to EGFR- or ALK-targeted drugs, ~20% of EGFR- and ALK-positive NSCLC patients will be non-responders [19,20,21]. In the present study, 31.5% of patients with untreated EGFR- or ALK-positive lung cancer were non-responsive to matched EGFR- or ALK-targeted therapy; accordingly, they had poor PFS (2.8 months, 95% CI, 1.5–4.1 months), indicative of persistent deficiencies in current genomic-data-guided targeted therapy. Our study demonstrated various issues underlying the clinically unexpected absence of a response to targeting agents and the potential utility of the PDC drug screening platform in predicting clinical outcomes. In case NCCLu-263, the Cobas® EGFR mutation test identified an EGFR 19 deletion mutation in the tumor, but the patient did not display dramatic improvement after receipt of erlotinib. Indeed, the patient’s baseline PDC drug screening result indicated insensitivity to EGFR-TKIs. Targeted NGS analyses of the tumor and PDC both identified a PIK3CA M1004I mutation and an EGFR 19 deletion, which together may have caused the resistance to erlotinib. Finally, the same PDC showed synergistic effects of an EGFR-TKI in combination with a PIK3CA inhibitor. Among lung cancers with EGFR-sensitive mutations, 3.5% harbor the PIK3CA mutation [22]; however, its influence on EGFR-TKI efficacy in EGFR-mutated lung cancer is controversial [9]. Some studies showed that patients with tumors harboring a concomitant PIK3CA mutation have a lower RR to EGFR-TKIs, as well as shorter PFS and OS durations [23]; other studies revealed longer PFS and OS [24]. Jin et al. reported a domain-specific effect of the PIK3CA mutation on PFS in patients treated with EGFR-TKIs; this finding indicated that p85-binding domain mutations (including R108H) are associated with a longer PFS, whereas kinase (Y1021H), helical (E542K), and C2 (N345K) domain mutations are associated with a shorter PFS [25]. In the present study, the tumor in case NCCLu-263 had a PIK3CA kinase domain (Y1021H) mutation and therefore did not respond to erlotinib.
In lung cancer, the major histologic type associated with an EGFR or ALK mutation is adenocarcinoma [26]. In rare cases, these driver oncogenic mutations are identified in squamous cell carcinoma or high-grade neuroendocrine cell carcinoma [27,28]. In a recent report by Lam et al., EGFR mutation and ALK fusion were detected in 2.7% and 0.5% of squamous cell lung carcinomas, respectively [29]. In the present study, the tumors in cases NCCLu-237 and NCCLu-253 consisted of an ALK-positive large-cell neuroendocrine carcinoma and an EGFR-mutant squamous cell lung carcinoma, respectively. In these lung cancers with atypical histology, the benefit of targeted therapy is limited; this limited benefit was anticipated by the insensitivity of the PDC to the corresponding targeted drugs. Taken together, these results suggest that pretreatment PDC drug screening can provide more precise and individualized information. Patients with EGFR- or ALK-positive lung cancer whose pretreatment PDC indicates insensitivity to the matched targeted drugs will need more careful monitoring for earlier disease progression; this will enable planning for a possible alternative treatment, such as combination therapy or a modified regimen.
Another clinical application of the PDC drug screening platform is the selection of the appropriate anti-cancer drugs in lung cancer patients. In case NCCLu-131, intra-tumoral heterogeneity was caused by two actionable driver mutations—ALK fusion and a BRAF V600E mutation—but it was unclear whether they should be targeted sequentially or simultaneously. The patient’s baseline PDC did not respond to either ALK inhibitors or BRAF inhibitors; instead, it suggested that the combination of an ALK-TKI and a BRAF inhibitor would be the most effective. In case NCCLu-027, the patient’s tumor was diagnosed as wild-type EGFR but showed a strong response to an EGFR inhibitor. Neither conventional genetic tests (plasma and tissue Cobas®) nor targeted NGS detected an EGFR mutation. However, the responsiveness of the patient’s PDC to EGFR inhibitors correctly predicted a benefit from EGFR-targeted therapy. Similarly, in case NCCLu-045, the patient’s tumor successfully responded to re-treatment with an EGFR-TKI. In EGFR-mutant lung cancers, re-treatment with an EGFR-TKI is regarded as a treatment option, although the RR (5–25%) is much lower than the RR in treatment-naïve tumors (70–80%) [30,31,32]. Predictive markers of relapsed tumors that will exhibit a durable response to EGFR-TKI re-treatment are lacking. The present study demonstrated that the RR was significantly higher in patients with an EGFR-TKI-sensitive PDC than in patients with an EGFR-TKI-insensitive PDC during re-treatment with EGFR-TKIs. Therefore, the PDC drug screening test may serve as a predictive tool to identify patients with previously treated EGFR-mutant NSCLC who will benefit from EGFR-TKI re-treatment.
The EGFR A763_Y764insFQEA mutation involves the insertion of 5% of EGFR exon 20 [33]. There is emerging evidence that the presence of this mutation indicates tumor sensitivity to classic EGFR-targeting inhibitors, in contrast to other EGFR exon 20 insertion subtypes [21,33]. Yasuda et al. determined that the difference reflects similar structural and kinetic features in this mutation and EGFR-TKI-sensitive mutations (e.g., exon 19 deletion and L858R mutations) [34]. In the present study, the results of case NCCLu-157, in which the patient’s tumor cells harbored the EGFR A763_Y764ins mutation, were consistent with previous reports. The pretreatment PDC harboring EGFR A763_Y764ins was highly sensitive to gefitinib, afatinib, and osimertinib; PDCs with other EGFR exon 20 insertion types did not display these sensitivities. The patient’s tumor responded well to erlotinib but developed resistance after the acquisition of the T790M mutation, the most common type of resistance to first- or second-generation EGFR-TKIs. These results suggest that the pharmacogenomic features of the PDC closely recapitulate the biological behaviors of tumors with rare oncogenic mutations. Therefore, the PDC drug screening test may provide highly informative data that can facilitate the treatment of rare tumors with minimal relevant published data.
5. Conclusions
The PDC drug screening platform is a rapid and feasible tool for the treatment of advanced lung cancer. Our study showed that it can be successfully used to guide targeted therapy for lung cancer patients with a poor prognosis; it may overcome the limitations of genomic assay-based targeted therapy. An approach integrating clinical–genomic data with functional–genomic data from PDCs will likely result in more effective and tailored anti-cancer treatments for lung cancer patients.
Supplementary Materials
The following supporting information can be downloaded at https://www.mdpi.com/article/10.3390/cancers16040778/s1: Figure S1: Consort diagram based on the cases of 59 chemo-naive EGFR- or ALK-positive NSCLC PDCs; Figure S2: Associations of PDC drug response with clinical outcomes; Figure S3: Heatmap comparing genetic variant profiles between PDC responders and PDC non-responders; Figure S4: Results of EGFR mutation test in tumor NCCLu-027; Figure S5: Targeted sequencing of tumor NCCLu-157; Table S1: Screening drug list; Table S2: The origin of patient-derived cells; Table S3: Clinical characteristics of treatment-naive PDCs with EGFR mutation or ALK fusion; Table S4: The classification of PDC drug sensitivity; Table S5: Multivariate analysis of overall survival for EGFR- or ALK-tyrosine kinase inhibitors; Table S6: Clinical, pathologic, and genetic characteristics of patients who unexpectedly had response to EGFR-TKIs; Table S7: Clinical, pathologic, and genetic characteristics of patients who unexpectedly had response to EGFR-TKIs.
Author Contributions
S.K.: Data curation, formal analysis, funding acquisition, investigation, methodology, supervision, writing—original draft, and writing—review. Y.L.: Data curation, formal analysis, investigation, resources, writing—original draft, and writing—review. B.R.S.: Formal analysis and validation. H.S.: Formal analysis and validation. E.H.K.: Formal analysis and validation. M.H.: Formal analysis and validation. N.Y.: Software and visualization. S.H.: Software and visualization. C.P.: Data curation, funding acquisition, and software and visualization. B.-C.A.: Resources. E.J.L.: Investigation. K.H.H.: Investigation. S.-Y.P.: Investigation and validation. J.-H.C.: Resources. G.K.L.: Investigation and validation. J.-Y.H.: Conceptualization, data curation, funding acquisition, project administration, resources, supervision, writing—original draft, and writing—review and editing. All authors have read and agreed to the published version of the manuscript.
Funding
This study was supported by a National Cancer Center grant (NCC-2210550 to J.-Y.H., C.P., and S.K.); the National Research Foundation of Korea (NRF-2023R1A2C2003565 to J.-Y.H.); and the Ministry of Health & Welfare of Korea (HI21C0416 to J.-Y.H., C.P. and S.K.).
Institutional Review Board Statement
This study was approved by the National Cancer Center Institutional Review Board (approval number NCC2016-0208, 22 August 2016). All participants provided written informed consent to take part in this study.
Informed Consent Statement
All participants provided written informed consent to take part in this study.
Data Availability Statement
Next-generation sequencing files of refractory lung cancer PDC samples have been deposited in the National Center for Biotechnology Information Gene Expression Omnibus (GSE165611 and GSE229535) for RNA-seq and Sequence Read Archive (PRJNA694788) for target-seq.
Acknowledgments
We would like to acknowledge the patients with advanced or refractory lung cancer and the clinical help obtained for this project. This study was also supported by the Genomic Core Team of the National Cancer Center Korea. We thank to Jung-Ah Hwang for technical support and to Suhyun Chae for the preparation of the excellent illustrations.
Conflicts of Interest
Y.L. reports personal fees from Roche, Merck, Yuhan, and Bayer. J.-Y.H. reports personal fees from Astra Zeneca, Merck, Jassen, Norvatis, Amgen, Abion, and J INTS Bio; grants from Pfizer, ONO, Roche, and Takeda; and honoraria for lectures from Astra Zeneca, Merck, Jassen, Norvatis, Pfizer, and Yuhan. No disclosures were reported by the other authors.
References
- Hoeben, A.; Joosten, E.A.J.; van den Beuken-van Everdingen, M.H.J. Personalized Medicine: Recent Progress in Cancer Therapy. Cancers 2021, 13, 242. [Google Scholar] [CrossRef]
- Morgensztern, D.; Campo, M.J.; Dahlberg, S.E.; Doebele, R.C.; Garon, E.; Gerber, D.E.; Goldberg, S.B.; Hammerman, P.S.; Heist, R.S.; Hensing, T.; et al. Molecularly targeted therapies in non-small-cell lung cancer annual update 2014. J. Thorac. Oncol. 2015, 10, S1–S63. [Google Scholar] [CrossRef]
- Chan, B.A.; Hughes, B.G. Targeted therapy for non-small cell lung cancer: Current standards and the promise of the future. Transl. Lung Cancer Res. 2015, 4, 36–54. [Google Scholar]
- Fukuoka, M.; Wu, Y.; Thongprasert, S.; Sunpaweravong, P.; Leong, S.; Sriuranpong, V.; Chao, T.; Nakagawa, K.; Chu, D.; Saijo, N.; et al. Biomarker analyses and final overall survival results from a phase III, randomized, open-label, first-line study of gefitinib versus carboplatin/paclitaxel in clinically selected patients with advanced non-small-cell lung cancer in Asia (IPASS). J. Clin. Oncol. 2011, 29, 2866–2874. [Google Scholar] [CrossRef]
- Lynch, T.J.; Bell, D.W.; Sordella, R.; Gurubhagavatula, S.; Okimoto, R.A.; Brannigan, B.W.; Harris, P.L.; Haserlat, S.M.; Supko, J.G.; Haluska, F.G.; et al. Activating mutations in the epidermal growth factor receptor underlying responsiveness of non-small-cell lung cancer to gefitinib. N. Engl. J. Med. 2004, 350, 2129–2139. [Google Scholar] [CrossRef] [PubMed]
- Mitsudomi, T.; Morita, S.; Yatabe, Y.; Negoro, S.; Okamoto, I.; Tsurutani, J.; Seto, T.; Satouchi, M.; Tada, H.; Hirashima, T.; et al. Gefitinib versus cisplatin plus docetaxel in patients with non-small-cell lung cancer harbouring mutations of the epidermal growth factor receptor (WJTOG3405): An open label, randomised phase 3 trial. Lancet Oncol. 2010, 11, 121–128. [Google Scholar] [CrossRef]
- Mok, T.S.; Wu, Y.; Thongprasert, S.; Yang, C.; Chu, D.; Saijo, N.; Sunpaweravong, P.; Han, B.; Margono, B.; Ichinose, Y.; et al. Gefitinib or carboplatin-paclitaxel in pulmonary adenocarcinoma. N. Engl. J. Med. 2009, 361, 947–957. [Google Scholar] [CrossRef] [PubMed]
- Rosell, R.; Carcereny, E.; Gervais, R.; Vergnenegre, A.; Massuti, B.; Felip, E.; Palmero, R.; Garcia Gomez, R.; Pallares, C.; Sanchez, J.M.; et al. Erlotinib versus standard chemotherapy as first-line treatment for European patients with advanced EGFR mutation-positive non-small-cell lung cancer (EURTAC): A multicentre, open-label, randomised phase 3 trial. Lancet Oncol. 2012, 13, 239–246. [Google Scholar] [CrossRef]
- Guo, Y.; Song, J.; Wang, Y.; Huang, L.; Sun, L.; Zhao, J.; Zhang, S.; Jing, W.; Ma, J.; Han, C. Concurrent Genetic Alterations and Other Biomarkers Predict Treatment Efficacy of EGFR-TKIs in EGFR-Mutant Non-Small Cell Lung Cancer: A Review. Front. Oncol. 2020, 10, 610923. [Google Scholar] [CrossRef]
- Janku, F. Tumor heterogeneity in the clinic: Is it a real problem? Ther. Adv. Med. Oncol. 2014, 6, 43–51. [Google Scholar] [CrossRef] [PubMed]
- Hou, X.; Du, C.; Lu, L.; Yuan, S.; Zhan, M.; You, P.; Du, H. Opportunities and challenges of patient-derived models in cancer research: Patient-derived xenografts, patient-derived organoid and patient-derived cells. World J. Surg. Oncol. 2022, 20, 37. [Google Scholar] [CrossRef]
- Huo, K.G.; D’Arcangelo, E.; Tsao, M.S. Patient-derived cell line, xenograft and organoid models in lung cancer therapy. Transl. Lung Cancer Res. 2020, 9, 2214–2232. [Google Scholar] [CrossRef]
- Kim, S.; Lee, J.Y.; Kim, S.Y.; Joo, J.Y.; Yun, D.H.; Jung, M.R.; Yun, J.D.; Heo, J.; Ahn, S.G.; Park, C.W.; et al. Patient-Derived Cells to Guide Targeted Therapy for Advanced Lung Adenocarcinoma. Sci. Rep. 2019, 9, 19909. [Google Scholar] [CrossRef]
- Lee, J.Y.; Kim, S.Y.; Park, C.; Kim, N.K.; Jang, J.; Park, K.; Yi, J.H.; Hong, M.; Ahn, T.; Rath, O.; et al. Patient-derived cell models as preclinical tools for genome-directed targeted therapy. Oncotarget 2015, 6, 25619–25630. [Google Scholar] [CrossRef][Green Version]
- Lee, J.K.; Liu, Z.; Sa, J.K.; Shin, S.; Wang, J.; Bordyuh, M.; Cho, H.J.; Elliott, O.; Chu, T.; Choi, S.W.; et al. Pharmacogenomic landscape of patient-derived tumor cells informs precision oncology therapy. Nat. Genet. 2018, 50, 1399–1411. [Google Scholar] [CrossRef]
- Sa, J.K.; Hwang, J.R.; Cho, Y.J.; Ryu, J.Y.; Choi, J.J.; Jeong, S.Y.; Kim, J.; Kim, M.S.; Paik, E.S.; Lee, Y.Y.; et al. Pharmacogenomic analysis of patient-derived tumor cells in gynecologic cancers. Genome Biol. 2019, 20, 253. [Google Scholar] [CrossRef] [PubMed]
- Sa, J.K.; Hong, J.Y.; Lee, I.K.; Kim, J.S.; Sim, M.H.; Kim, H.J.; An, J.Y.; Sohn, T.S.; Lee, J.H.; Bae, J.M.; et al. Comprehensive pharmacogenomic characterization of gastric cancer. Genome Med. 2020, 12, 17. [Google Scholar] [CrossRef] [PubMed]
- Eisenhauer, E.A.; Therasse, P.; Bogaerts, J.; Schwartz, L.H.; Sargent, D.; Ford, R.; Dancey, J.; Arbuck, S.; Gwyther, S.; Mooney, M.; et al. New response evaluation criteria in solid tumours: Revised RECIST guideline (version 1.1). Eur. J. Cancer 2009, 45, 228–247. [Google Scholar] [CrossRef] [PubMed]
- Soria, J.; Ohe, Y.; Vansteenkiste, J.; Reungwetwattana, T.; Chewaskulyong, B.; Lee, K.H.; Dechaphunkul, A.; Imamura, F.; Nogami, N.; Kurata, T.; et al. Osimertinib in Untreated EGFR-Mutated Advanced Non-Small-Cell Lung Cancer. N. Engl. J. Med. 2018, 378, 113–125. [Google Scholar] [CrossRef] [PubMed]
- Shaw, A.T.; Bauer, T.M.; de Marinis, F.; Felip, E.; Goto, Y.; Liu, G.; Mazieres, J.; Kim, D.; Mok, T.; Polli, A.; et al. First-Line Lorlatinib or Crizotinib in Advanced ALK-Positive Lung Cancer. N. Engl. J. Med. 2020, 383, 2018–2029. [Google Scholar] [CrossRef] [PubMed]
- Yang, G.; Yang, Y.; Hu, J.; Xu, H.; Zhang, S.; Wang, Y. EGFR exon 20 insertion variants A763_Y764insFQEA and D770delinsGY confer favorable sensitivity to currently approved EGFR-specific tyrosine kinase inhibitors. Front. Pharmacol. 2022, 13, 984503. [Google Scholar] [CrossRef] [PubMed]
- Li, S.; Li, L.; Zhu, Y.; Huang, C.; Qin, Y.; Liu, H.; Ren Heidenreich, L.; Shi, B.; Ren, H.; Chu, X.; et al. Coexistence of EGFR with KRAS, or BRAF, or PIK3CA somatic mutations in lung cancer: A comprehensive mutation profiling from 5125 Chinese cohorts. Br. J. Cancer 2014, 110, 2812–2820. [Google Scholar] [CrossRef] [PubMed]
- Eng, J.; Woo, K.M.; Sima, C.S.; Plodkowski, A.; Hellmann, M.D.; Chaft, J.E.; Kris, M.G.; Arcila, M.E.; Ladanyi, M.; Drilon, A. Impact of Concurrent PIK3CA Mutations on Response to EGFR Tyrosine Kinase Inhibition in EGFR-Mutant Lung Cancers and on Prognosis in Oncogene-Driven Lung Adenocarcinomas. J. Thorac. Oncol. 2015, 10, 1713–1719. [Google Scholar] [CrossRef] [PubMed]
- Wu, S.G.; Chang, Y.L.; Yu, C.J.; Yang, P.C.; Shih, J.Y. The Role of PIK3CA Mutations among Lung Adenocarcinoma Patients with Primary and Acquired Resistance to EGFR Tyrosine Kinase Inhibition. Sci. Rep. 2016, 6, 35249. [Google Scholar] [CrossRef]
- Jin, Y.; Bao, H.; Le, X.; Fan, X.; Tang, M.; Shi, X.; Zhao, J.; Yan, J.; Xu, Y.; Quek, K.; et al. Distinct co-acquired alterations and genomic evolution during TKI treatment in non-small-cell lung cancer patients with or without acquired T790M mutation. Oncogene 2020, 39, 1846–1859. [Google Scholar] [CrossRef] [PubMed]
- Lee, Y.J.; Kim, J.; Kim, S.K.; Ha, S.; Mok, T.S.; Mitsudomi, T.; Cho, B.C. Lung cancer in never smokers: Change of a mindset in the molecular era. Lung Cancer 2011, 72, 9–15. [Google Scholar] [CrossRef]
- Le, X.; Desai, N.V.; Majid, A.; Karp, R.S.; Huberman, M.S.; Rangachari, D.; Kent, M.S.; Gangadharan, S.P.; Folch, E.; VanderLaan, P.A.; et al. De novo pulmonary small cell carcinomas and large cell neuroendocrine carcinomas harboring EGFR mutations: Lack of response to EGFR inhibitors. Lung Cancer 2015, 88, 70–73. [Google Scholar] [CrossRef]
- Lewis, W.E.; Hong, L.; Mott, F.E.; Simon, G.; Wu, C.; Rinsurongkawong, W.; Lee, J.J.; Lam, V.K.; Heymach, J.V.; Zhang, J.; et al. Efficacy of Targeted Inhibitors in Metastatic Lung Squamous Cell Carcinoma with EGFR or ALK Alterations. JTO Clin. Res. Rep. 2021, 2, 100237. [Google Scholar] [CrossRef]
- Lam, V.K.; Tran, H.T.; Banks, K.C.; Lanman, R.B.; Rinsurongkawong, W.; Peled, N.; Lewis, J.; Lee, J.J.; Roth, J.; Roarty, E.B.; et al. Targeted Tissue and Cell-Free Tumor DNA Sequencing of Advanced Lung Squamous-Cell Carcinoma Reveals Clinically Significant Prevalence of Actionable Alterations. Clin. Lung Cancer 2019, 20, 30–36.e3. [Google Scholar] [CrossRef]
- Pao, W.; Miller, V.A.; Politi, K.A.; Riely, G.J.; Somwar, R.; Zakowski, M.F.; Kris, M.G.; Varmus, H. Acquired resistance of lung adenocarcinomas to gefitinib or erlotinib is associated with a second mutation in the EGFR kinase domain. PLoS Med. 2005, 2, e73. [Google Scholar] [CrossRef] [PubMed]
- Oh, I.; Ban, H.; Kim, K.; Kim, Y. Retreatment of gefitinib in patients with non-small-cell lung cancer who previously controlled to gefitinib: A single-arm, open-label, phase II study. Lung Cancer 2012, 77, 121–127. [Google Scholar] [CrossRef] [PubMed]
- Hata, A.; Katakami, N.; Yoshioka, H.; Fujita, S.; Kunimasa, K.; Nanjo, S.; Otsuka, K.; Kaji, R.; Tomii, K.; Iwasaku, M.; et al. Erlotinib after gefitinib failure in relapsed non-small cell lung cancer: Clinical benefit with optimal patient selection. Lung Cancer 2011, 74, 268–273. [Google Scholar] [CrossRef] [PubMed]
- Vasconcelos, P.E.N.S.; Gergis, C.; Viray, H.; Varkaris, A.; Fujii, M.; Rangachari, D.; VanderLaan, P.A.; Kobayashi, I.S.; Kobayashi, S.; Costa, D.B. EGFR-A763_Y764insFQEA Is a Unique Exon 20 Insertion Mutation That Displays Sensitivity to Approved and In-Development Lung Cancer EGFR Tyrosine Kinase Inhibitors. JTO Clin. Res. Rep. 2020, 1, 100051. [Google Scholar] [CrossRef] [PubMed]
- Yasuda, H.; Park, E.; Yun, C.; Sng, N.J.; Lucena Araujo, A.R.; Yeo, W.; Huberman, M.S.; Cohen, D.W.; Nakayama, S.; Ishioka, K.; et al. Structural, biochemical, and clinical characterization of epidermal growth factor receptor (EGFR) exon 20 insertion mutations in lung cancer. Sci. Transl. Med. 2013, 5, 216ra177. [Google Scholar] [CrossRef]


Disclaimer/Publisher’s Note: The statements, opinions and data contained in all publications are solely those of the individual author(s) and contributor(s) and not of MDPI and/or the editor(s). MDPI and/or the editor(s) disclaim responsibility for any injury to people or property resulting from any ideas, methods, instructions or products referred to in the content. |
© 2024 by the authors. Licensee MDPI, Basel, Switzerland. This article is an open access article distributed under the terms and conditions of the Creative Commons Attribution (CC BY) license (https://creativecommons.org/licenses/by/4.0/).