
Non-Curative Treatment Choices in Colorectal Cancer: Predictors and Between-Hospital Variations in Denmark: A Population-Based Register Study
 ,
,  ,
,  , and
, and
Abstract
Simple Summary
Abstract
1. Introduction
2. Materials & Methods
2.1. Study Design and Population
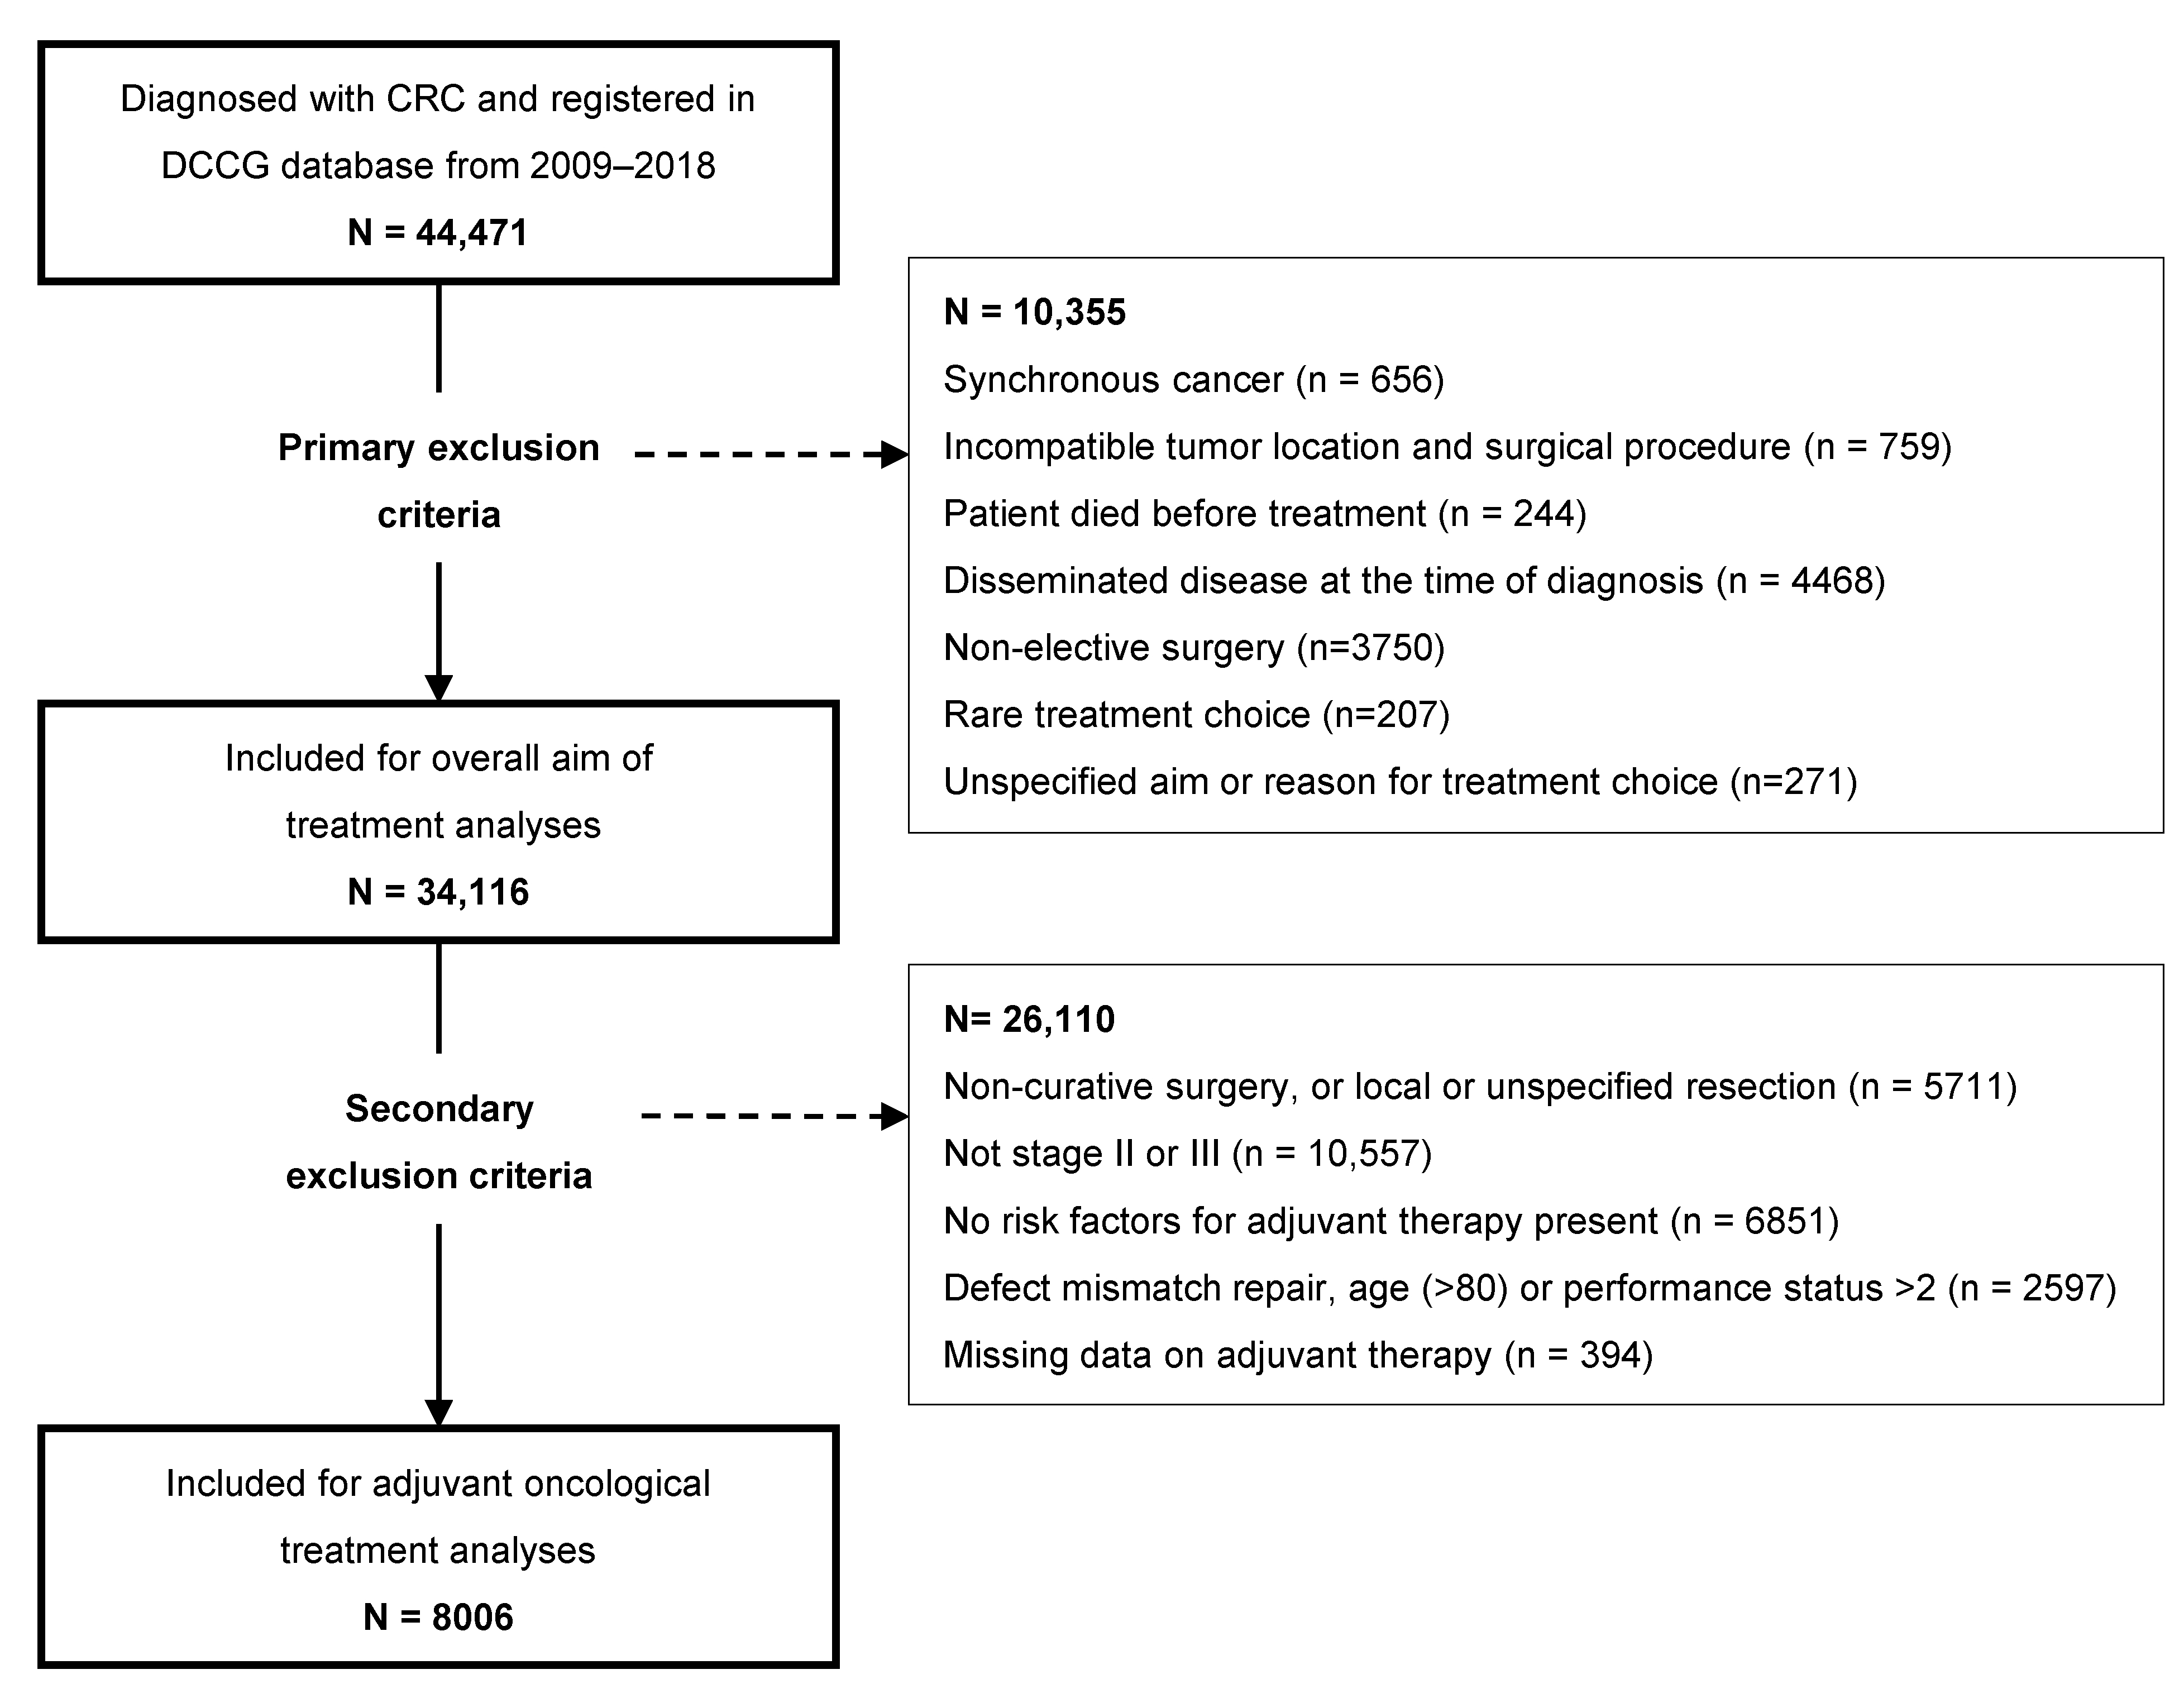
2.2. Specific Primary Exclusion Criteria for This Study
- Incompatibility between the tumor location and resection procedure registered in the DCCG (e.g., primary tumor in the right colon and rectal resection), or synchronous cancer;
- Patients in whom curative surgery was not an option (e.g., patients who died before surgery or patients not offered surgery because of disseminated disease);
- Non-elective surgery;
- Rare and poorly characterized aims of treatment or an unspecified aim of treatment;
- The presence of distant metastasis (UICC stage IV) was not an exclusion criterion, provided that the surgeon had not registered disseminated disease as the reason for no surgery.
2.3. The Stratification of the Cohort by Overall Treatment Goal
2.4. Specific Secondary Exclusion Criteria for Adjuvant Oncological Treatment
2.5. Predictors and Covariates
2.5.1. Demographics, Lifestyle and Performance Score
2.5.2. Comorbidity
2.5.3. Socioeconomic Factors
2.5.4. Disease-Related Factors
2.5.5. Covariates Included Only in Regression Models for Adjuvant Chemotherapy
2.6. Statistical Methods
2.7. Ethics and Permisson
3. Results
3.1. The Characteristics of Overall Treatment Aims
3.2. The Characteristics of Patients with a Curative Treatment Aim
3.3. The Characteristics of Patients with a Non-Curative Treatment Aim
3.3.1. The Predictors of Non-Curative Treatment in a Multinomial Model
3.3.2. Adjuvant Chemotherapy
3.3.3. The Predictors of Adjuvant Chemotherapy in a Logistic Regression Model
4. Discussion
4.1. A Review of Aim and Results
4.2. A Discussion of Related Studies
4.3. Strength and Limitations
4.4. Perspectives
5. Conclusions
Supplementary Materials
Author Contributions
Funding
Institutional Review Board Statement
Informed Consent Statement
Data Availability Statement
Acknowledgments
Conflicts of Interest
References
- DCCG. Landsdækkende Database for Kræft i Tyk- Og Endetarm (DCCG.dk). National Årsrapport. [Danish Colorectal Cancer Group (DCCG) Annual Report]. 2022. Available online: https://dccg.dk/arsrapporter/ (accessed on 12 December 2023).
- DCCG. Oversigt over DCCG’s Aktuelle Retningslinjer. [Overview of Current National Guidelines of Danish Colorectal Cancer Group (DCCG)]. Available online: https://dccg.dk/retningslinjer/ (accessed on 28 September 2023).
- Argilés, G.; Tabernero, J.; Labianca, R.; Hochhauser, D.; Salazar, R.; Iveson, T.; Laurent-Puig, P.; Quirke, P.; Yoshino, T.; Taieb, J.; et al. Localised colon cancer: ESMO Clinical Practice Guidelines for diagnosis, treatment and follow-up. Ann. Oncol. 2020, 31, 1291–1305. [Google Scholar] [CrossRef]
- Glynne-Jones, R.; Wyrwicz, L.; Tiret, E.; Brown, G.; Rödel, C.; Cervantes, A.; Arnold, D.; ESMO Guidelines Committee. Rectal cancer: ESMO Clinical Practice Guidelines for diagnosis, treatment and follow-up. Ann. Oncol. 2017, 28 (Suppl. 4), iv22–iv40. [Google Scholar] [CrossRef]
- DCCG. Oversigt over DCCG’s Tidligere Retningslinjer. [Overview of Former National Guidelines of Danish Colorectal Cancer Group (DCCG)]. Available online: https://dccg.dk/tidligere-retningslinjer/ (accessed on 29 September 2023).
- Maeda, H.; Takahashi, M.; Seo, S.; Hanazaki, K. Frailty and Colorectal Surgery: Review and Concept of Cancer Frailty. J. Clin. Med. 2023, 12, 5041. [Google Scholar] [CrossRef]
- Sundhedsstyrelsen. Social Ulighed i Sundhed Og Sygdom. Udviklingen i Danmark i Perioden 2010–2017 [Social Inequality in Health and Disease. Development in Denmark from 2010–2017]. Available online: https://www.sst.dk/da/udgivelser/2020/social-ulighed-i-sundhed-og-sygdom (accessed on 28 September 2023).
- Protani, M.M.; Alotiby, M.K.N.; Seth, R.; Lawrence, D.; Jordan, S.J.; Logan, H.; Kendall, B.J.; Siskind, D.; Sara, G.; Kisely, S. Colorectal cancer treatment in people with severe mental illness: A systematic review and meta-analysis. Epidemiol. Psychiatr. Sci. 2022, 31, e82. [Google Scholar] [CrossRef]
- Rattenborg, S.; Möller, S.; Frostberg, E.; Rahr, H.B. Uneven Between-Hospital Distribution of Patient-Related Risk Factors for Adverse Outcomes of Colorectal Cancer Treatment: A Population-Based Register Study. Clin. Epidemiol. 2023, 15, 867–880. [Google Scholar] [CrossRef]
- Benitez Majano, S.; Di Girolamo, C.; Rachet, B.; Maringe, C.; Guren, M.G.; Glimelius, B.; Iversen, L.H.; Schnell, E.A.; Lundqvist, K.; Christensen, J.; et al. Surgical treatment and survival from colorectal cancer in Denmark, England, Norway, and Sweden: A population-based study. Lancet Oncol. 2019, 20, 74–87. [Google Scholar] [CrossRef]
- DCCG. Landsdækkende Database for Kræft i Tyk- Og Endetarm. Årsrapport. [Danish Colorectal Cancer Group Database (DCCG) Annual Report]. 2021. Available online: https://dccg.dk/arsrapporter/ (accessed on 12 December 2023).
- Ingeholm, P.; Gögenur, I.; Iversen, L.H. Danish Colorectal Cancer Group Database. Clin. Epidemiol. 2016, 8, 465–468. [Google Scholar] [CrossRef]
- Schmidt, M.; Schmidt, S.A.J.; Adelborg, K.; Sundbøll, J.; Laugesen, K.; Ehrenstein, V.; Sørensen, H.T. The Danish health care system and epidemiological research: From health care contacts to database records. Clin. Epidemiol. 2019, 11, 563–591. [Google Scholar] [CrossRef]
- World Health Organization (WHO). Obesity and Overweight. Available online: https://www.who.int/en/news-room/fact-sheets/detail/obesity-and-overweight (accessed on 31 October 2023).
- Charlson, M.E.; Pompei, P.; Ales, K.L.; MacKenzie, C.R. A new method of classifying prognostic comorbidity in longitudinal studies: Development and validation. J. Chronic Dis. 1987, 40, 373–383. [Google Scholar] [CrossRef]
- Quan, H.; Li, B.; Couris, C.M.; Fushimi, K.; Graham, P.; Hider, P.; Januel, J.M.; Sundararajan, V. Updating and validating the Charlson comorbidity index and score for risk adjustment in hospital discharge abstracts using data from 6 countries. Am. J. Epidemiol. 2011, 173, 676–682. [Google Scholar] [CrossRef]
- UNESCO. International Standard Classification of Education, ISCED 2011. 2012, 86. Available online: https://uis.unesco.org/en/topic/international-standard-classification-education-isced (accessed on 7 December 2023).
- Thygesen, L.C.; Daasnes, C.; Thaulow, I.; Brønnum-Hansen, H. Introduction to Danish (nationwide) registers on health and social issues: Structure, access, legislation, and archiving. Scand. J. Public Health 2011, 39 (Suppl. 7), 12–16. [Google Scholar] [CrossRef] [PubMed]
- Turner, M.C.; Farrow, N.E.; Rhodin, K.E.; Sun, Z.; Adam, M.A.; Mantyh, C.R.; Migaly, J. Delay in Adjuvant Chemotherapy and Survival Advantage in Stage III Colon Cancer. J. Am. Coll. Surg. 2018, 226, 670–678. [Google Scholar] [CrossRef] [PubMed]
- Giesen, L.J.X.; van Erning, F.N.; Vissers, P.A.J.; Maas, H.; Rutten, H.J.T.; Lemmens, V.; Dekker, J.W.T. Inter-hospital variation in resection rates of colon cancer in the Netherlands: A nationwide study. Eur. J. Surg. Oncol. 2019, 45, 1882–1886. [Google Scholar] [CrossRef]
- Axt, S.; Wilhelm, P.; Spahlinger, R.; Rolinger, J.; Johannink, J.; Axt, L.; Kirschniak, A.; Falch, C. Impact of preoperative body mass index and weight loss on morbidity and mortality following colorectal cancer-a retrospective cohort study. Int. J. Color. Dis. 2022, 37, 1983–1995. [Google Scholar] [CrossRef] [PubMed]
- Frederiksen, B.L.; Osler, M.; Harling, H.; Ladelund, S.; Jørgensen, T. Do patient characteristics, disease, or treatment explain social inequality in survival from colorectal cancer? Soc. Sci. Med. 2009, 69, 1107–1115. [Google Scholar] [CrossRef]
- Van den Berg, I.; Buettner, S.; van den Braak, R.; Ultee, K.H.J.; Lingsma, H.F.; van Vugt, J.L.A.; Ijzermans, J.N.M. Low Socioeconomic Status Is Associated with Worse Outcomes After Curative Surgery for Colorectal Cancer: Results from a Large, Multicenter Study. J. Gastrointest. Surg. 2020, 24, 2628–2636. [Google Scholar] [CrossRef]
- Darin-Mattsson, A.; Fors, S.; Kåreholt, I. Different indicators of socioeconomic status and their relative importance as determinants of health in old age. Int. J. Equity Health 2017, 16, 173. [Google Scholar] [CrossRef]
- Geyer, S.; Hemstrom, O.; Peter, R.; Vagero, D. Education, income, and occupational class cannot be used interchangeably in social epidemiology. Empirical evidence against a common practice. J. Epidemiol. Community Health 2006, 60, 804–810. [Google Scholar] [CrossRef]
- Ljunggren, M.; Weibull, C.E.; Rosander, E.; Palmer, G.; Glimelius, B.; Martling, A.; Nordenvall, C. Hospital factors and metastatic surgery in colorectal cancer patients, a population-based cohort study. BMC Cancer 2022, 22, 907. [Google Scholar] [CrossRef]
- Downing, A.; Morris, E.J.; Corrigan, N.; Sebag-Montefiore, D.; Finan, P.J.; Thomas, J.D.; Chapman, M.; Hamilton, R.; Campbell, H.; Cameron, D.; et al. High hospital research participation and improved colorectal cancer survival outcomes: A population-based study. Gut 2017, 66, 89–96. [Google Scholar] [CrossRef]
- Babaei, M.; Balavarca, Y.; Jansen, L.; Lemmens, V.; van Erning, F.N.; van Eycken, L.; Vaes, E.; Sjövall, A.; Glimelius, B.; Ulrich, C.M.; et al. Administration of adjuvant chemotherapy for stage II-III colon cancer patients: An European population-based study. Int. J. Cancer 2018, 142, 1480–1489. [Google Scholar] [CrossRef]
- Keikes, L.; van Oijen, M.G.H.; Lemmens, V.E.P.P.; Koopman, M.; Punt, C.J.A. Evaluation of Guideline Adherence in Colorectal Cancer Treatment in The Netherlands: A Survey Among Medical Oncologists by the Dutch Colorectal Cancer Group. Clin. Color. Cancer 2018, 17, 58–64. [Google Scholar] [CrossRef]
- Maes-Carballo, M.; Gómez-Fandiño, Y.; García-García, M.; Martín-Díaz, M.; De-Dios-de-Santiago, D.; Khan, K.S.; Bueno-Cavanillas, A. Colorectal cancer treatment guidelines and shared decision making quality and reporting assessment: Systematic review. Patient Educ. Couns. 2023, 115, 107856. [Google Scholar] [CrossRef]
- NBOCA. National Bowel Cancer Audit. Annual Report 2022. 2022. Available online: https://www.nboca.org.uk/reports/?filter_date=2022 (accessed on 7 December 2023).
- Konradsen, A.A.; Lund, C.M.; Vistisen, K.K.; Albieri, V.; Dalton, S.O.; Nielsen, D.L. The influence of socioeconomic position on adjuvant treatment of stage III colon cancer: A systematic review and meta-analysis. Acta Oncol. 2020, 59, 1291–1299. [Google Scholar] [CrossRef]
- Klein, M.F.; Gögenur, I.; Ingeholm, P.; Njor, S.H.; Iversen, L.H.; Emmertsen, K.J. Validation of the Danish Colorectal Cancer Group (DCCG.dk) database-on behalf of the Danish Colorectal Cancer Group. Color. Dis. 2020, 22, 2057–2067. [Google Scholar] [CrossRef]


| OT-CUR (N = 30,548) | OT-NCUR (N = 1678) | NOT-NO (N = 1007) | NOT-CO (N = 883) | Total (N = 34,116) | ||||||
|---|---|---|---|---|---|---|---|---|---|---|
| N | % | N | % | N | % | N | % | N | % | |
| Sex | ||||||||||
| Male | 16,777 | 55 | 897 | 53 | 498 | 49 | 497 | 56 | 18,669 | 55 |
| Female | 13,771 | 45 | 781 | 47 | 509 | 51 | 386 | 44 | 15,447 | 45 |
| Age group | ||||||||||
| <50 | 1261 | 4 | 70 | 4 | 15 | 1 | 0 | 0 | 1346 | 4 |
| 50–64 | 7612 | 25 | 304 | 18 | 70 | 7 | 32 | 4 | 8018 | 24 |
| 65–74 | 11,683 | 38 | 496 | 30 | 146 | 14 | 151 | 17 | 12,476 | 37 |
| 75–84 | 8074 | 26 | 520 | 31 | 313 | 31 | 345 | 39 | 9252 | 27 |
| 85+ | 1918 | 6 | 288 | 17 | 463 | 46 | 355 | 40 | 3024 | 9 |
| ASA score | ||||||||||
| I | 7162 | 23 | 180 | 11 | <45 | 4 | <5 | 0 | 7387 | 22 |
| II | 16,793 | 55 | 781 | 47 | <235 | 23 | <75 | 8 | 17,882 | 52 |
| III | 5835 | 19 | 557 | 33 | 289 | 29 | 387 | 44 | 7068 | 21 |
| IV + V | 264 | 1 | 101 | 6 | 43 | 4 | 133 | 15 | 541 | 2 |
| Unknown | 494 | 2 | 59 | 4 | 399 | 40 | 286 | 32 | 1238 | 4 |
| WHO performance status | ||||||||||
| 0 | 11,421 | 37 | 230 | 14 | 75 | 7 | 10 | 1 | 11,736 | 34 |
| 1 | 3782 | 12 | 246 | 15 | 122 | 12 | 74 | 8 | 4224 | 12 |
| 2 | 1054 | 3 | 160 | 10 | 134 | 13 | 159 | 18 | 1507 | 4 |
| 3 + 4 | 248 | 1 | 78 | 5 | 105 | 10 | 246 | 28 | 677 | 2 |
| Unknown | 14,043 | 46 | 964 | 57 | 571 | 57 | 394 | 45 | 15,972 | 47 |
| Location of cancer | ||||||||||
| Colon | 20,058 | 66 | 1097 | 65 | 560 | 56 | 514 | 58 | 22,229 | 65 |
| Rectum | 10,490 | 34 | 581 | 35 | 447 | 44 | 369 | 42 | 11,887 | 35 |
| cM category | ||||||||||
| cM0 | 27,514 | 90 | 488 | 29 | 650 | 65 | 629 | 71 | 29,281 | 86 |
| cM1 | 2686 | 9 | 1142 | 68 | 223 | 22 | 168 | 19 | 4219 | 12 |
| Unknown | 348 | 1 | 48 | 3 | 134 | 13 | 86 | 10 | 616 | 2 |
| MDT conference | ||||||||||
| Yes | 19,678 | 64 | 1068 | 64 | 435 | 43 | 485 | 55 | 21,666 | 64 |
| No | 8496 | 28 | 383 | 23 | 182 | 18 | 160 | 18 | 9221 | 27 |
| Unknown | 2374 | 8 | 227 | 14 | 390 | 39 | 238 | 27 | 3229 | 9 |
| Charlson score | ||||||||||
| 0 | 23,180 | 76 | 1087 | 65 | 609 | 60 | 342 | 39 | 25,218 | 74 |
| 1 | 2569 | 8 | 154 | 9 | 104 | 10 | 124 | 14 | 2951 | 9 |
| 2 | 3247 | 11 | 202 | 12 | 177 | 18 | 211 | 24 | 3837 | 11 |
| 3+ | 1552 | 5 | 235 | 14 | 117 | 12 | 206 | 23 | 2110 | 6 |
| Smoking status | ||||||||||
| Never a smoker | 10,969 | 36 | 520 | 31 | 179 | 18 | 142 | 16 | 11,810 | 35 |
| Ex-smoker | 11,377 | 37 | 555 | 33 | 178 | 18 | 223 | 25 | 12,333 | 36 |
| Active smoker | 5132 | 17 | 296 | 18 | 89 | 9 | 97 | 11 | 5614 | 16 |
| Unknown | 3070 | 10 | 307 | 18 | 561 | 56 | 421 | 48 | 4359 | 13 |
| Alcohol consumed per week (units 1) | ||||||||||
| 0–14 | 24,024 | 79 | 1249 | 74 | 415 | 41 | 412 | 47 | 26,100 | 77 |
| >14 | 3745 | 12 | 147 | 9 | 46 | 5 | 53 | 6 | 3991 | 12 |
| Unknown | 2779 | 9 | 282 | 17 | 546 | 54 | 418 | 47 | 4025 | 12 |
| WHO body mass index class | ||||||||||
| Underweight | 741 | 2 | 111 | 7 | 38 | 4 | 57 | 6 | 947 | 3 |
| Normal | 12,014 | 39 | 738 | 44 | 279 | 28 | 258 | 29 | 13,289 | 39 |
| Overweight | 10,878 | 36 | 428 | 26 | 164 | 16 | 143 | 16 | 11,613 | 34 |
| Obese | 5231 | 17 | 206 | 12 | 61 | 6 | 54 | 6 | 5552 | 16 |
| Unknown | 1684 | 6 | 195 | 12 | 465 | 46 | 371 | 42 | 2715 | 8 |
| Highest educational level 2 | ||||||||||
| Short | 10,684 | 35 | 728 | 43 | 461 | 46 | 429 | 49 | 12,302 | 36 |
| Medium | 13,635 | 45 | 620 | 37 | 302 | 30 | 299 | 34 | 14,856 | 44 |
| Long | 5363 | 18 | 227 | 14 | 96 | 10 | 86 | 10 | 5772 | 17 |
| Unknown or unclassified | 866 | 3 | 103 | 6 | 148 | 15 | 69 | 8 | 1186 | 3 |
| Annual household income | ||||||||||
| 1st quartile | 6909 | 23 | 557 | 33 | 404 | 40 | 311 | 35 | 8181 | 24 |
| 2nd quartile | 7257 | 24 | 451 | 27 | 332 | 33 | 332 | 38 | 8372 | 25 |
| 3rd quartile | 7857 | 26 | 385 | 23 | 172 | 17 | 154 | 17 | 8568 | 25 |
| 4th quartile | 8419 | 28 | 276 | 16 | 94 | 9 | 86 | 10 | 8875 | 26 |
| Unknown | 106 | 0 | 9 | 0 | 5 | 0 | 0 | 0 | 120 | 0 |
| Cohabitation status | ||||||||||
| Cohabiting | 19,096 | 63 | 873 | 52 | 311 | 31 | 303 | 34 | 20,583 | 60 |
| Alone | <11,415 | 37 | <805 | 48 | <700 | 69 | 580 | 66 | 13,492 | 40 |
| Unknown | <40 | 0 | <5 | 0 | <5 | 0 | 0 | 0 | 41 | 0 |
| OT-NCUR | NOT-NO | NOT-CO | |||||||
|---|---|---|---|---|---|---|---|---|---|
| RR | 95% CI | p | RR | 95% CI | p | RR | 95% CI | p | |
| Sex (ref. female) | |||||||||
| Male | 1.1 | [0.99–1.27] | 0.072 | 1.2 | [1.03–1.45] | 0.022 | 1.4 | [1.20–1.75] | 0.000 |
| Age group (ref. 50–64) | |||||||||
| <50 | 1.1 | [0.81–1.51] | 0.520 | 1.2 | [0.66–2.35] | 0.495 | - | - | - |
| 65–74 | 1.0 | [0.84–1.19] | 0.985 | 1.2 | [0.89–1.70] | 0.210 | 2.4 | [1.55–3.73] | 0.000 |
| 75–84 | 1.3 | [1.09–1.58] | 0.004 | 2.5 | [1.85–3.49] | 0.000 | 4.6 | [2.99–7.15] | 0.000 |
| 85+ | 3.4 | [2.73–4.34] | 0.000 | 10.8 | [7.74–15.13] | 0.000 | 16.6 | [10.51–26.09] | 0.000 |
| ASA score (ref. I) | |||||||||
| II | 1.5 | [1.23–1.82] | 0.000 | 1.0 | [0.70–1.45] | 0.983 | 2.7 | [0.85–8.86] | 0.090 |
| III | 2.1 | [1.69–2.67] | 0.000 | 1.3 | [0.90–1.98] | 0.156 | 10.0 | [3.11–32.00] | 0.000 |
| IV + V | 7.4 | [5.13–10.63] | 0.000 | 2.9 | [1.72–4.98] | 0.000 | 41.9 | [12.70–138.17] | 0.000 |
| Unknown | 2.5 | [1.71–3.62] | 0.000 | 15.3 | [10.02–23.37] | 0.000 | 100.1 | [30.82–324.87] | 0.000 |
| WHO performance status (ref. 0) | |||||||||
| 1 | 2.2 | [1.74–2.67] | 0.000 | 2.9 | [2.10–3.99] | 0.000 | 7.6 | [3.85–15.20] | 0.000 |
| 2 | 4.4 | [3.39–5.75] | 0.000 | 8.3 | [5.88–11.68] | 0.000 | 33.8 | [17.12–66.55] | 0.000 |
| 3 + 4 | 7.1 | [4.97–10.19] | 0.000 | 21.4 | [14.34–31.83] | 0.000 | 146.2 | [73.10–292.60] | 0.000 |
| Unknown | 1.5 | [1.13–1.88] | 0.003 | 1.7 | [1.16–2.43] | 0.006 | 6.4 | [3.17–12.95] | 0.000 |
| Location of cancer (ref. colon) | |||||||||
| Rectum | 1.2 | [1.06–1.39] | 0.004 | 3.4 | [2.86–4.05] | 0.000 | 3.2 | [2.67–3.92] | 0.000 |
| cM category (ref. cM0) | |||||||||
| cM1 | 28.9 | [25.47–32.81] | 0.000 | 4.6 | [3.76–5.61] | 0.000 | 4.1 | [3.23–5.11] | 0.000 |
| Unknown | 5.1 | [3.65–7.20] | 0.000 | 4.3 | [3.05–6.01] | 0.000 | 3.2 | [2.22–4.69] | 0.000 |
| MDT conference (ref. yes) | |||||||||
| No | 0.9 | [0.77–1.06] | 0.231 | 1.1 | [0.85–1.36] | 0.558 | 0.7 | [0.57–0.96] | 0.021 |
| Unknown | 0.9 | [0.71–1.15] | 0.424 | 4.0 | [2.88–5.51] | 0.000 | 2.2 | [1.52–3.16] | 0.000 |
| Comorbidity | |||||||||
| Cardiovascular disease | 0.9 | [0.78–1.02] | 0.091 | 1.1 | [0.88–1.32] | 0.454 | 1.4 | [1.06–1.75] | 0.015 |
| Chronic pulmonary disease | 1.0 | [0.85–1.11] | 0.674 | 0.9 | [0.78–1.11] | 0.412 | 1.2 | [0.99–1.43] | 0.061 |
| Diabetes | 0.9 | [0.79–1.12] | 0.508 | 1.0 | [0.80–1.24] | 0.965 | 1.1 | [0.90–1.39] | 0.299 |
| Dementia | 2.2 | [1.55–3.10] | 0.000 | 1.2 | [0.78–1.71] | 0.471 | 1.8 | [1.27–2.58] | 0.001 |
| Liver disease | 1.3 | [0.75–2.31] | 0.342 | 1.1 | [0.51–2.35] | 0.812 | 4.3 | [2.52–7.19] | 0.000 |
| Kidney disease | 1.1 | [0.75–1.50] | 0.744 | 1.2 | [0.83–1.72] | 0.342 | 1.4 | [1.02–1.94] | 0.040 |
| Nerve disease | 1.2 | [0.72–1.90] | 0.522 | 0.7 | [0.39–1.34] | 0.303 | 0.9 | [0.54–1.57] | 0.776 |
| Other cancer | 1.4 | [1.18–1.61] | 0.000 | 1.1 | [0.86–1.37] | 0.473 | 1.4 | [1.10–1.75] | 0.006 |
| Connective tissue disease | 1.0 | [0.78–1.18] | 0.689 | 0.9 | [0.70–1.18] | 0.455 | 1.1 | [0.86–1.42] | 0.453 |
| Affective disorder | 0.9 | [0.78–1.04] | 0.163 | 1.1 | [0.92–1.33] | 0.274 | 1.3 | [1.07–1.56] | 0.008 |
| Schizophrenia spectrum disorder | 0.8 | [0.36–1.65] | 0.503 | 2.3 | [1.06–4.90] | 0.035 | 2.3 | [1.01–5.31] | 0.048 |
| Personality and behavior disorder | 0.6 | [0.20–1.95] | 0.413 | 1.9 | [0.55–6.34] | 0.317 | 1.2 | [0.27–5.63] | 0.787 |
| Psychoactive drug abuse disorder | 0.9 | [0.70–1.26] | 0.681 | 0.9 | [0.64–1.40] | 0.782 | 1.2 | [0.80–1.66] | 0.445 |
| Smoking status (ref. non-smoker) | |||||||||
| Ex-smoker | 1.0 | [0.86–1.14] | 0.865 | 0.9 | [0.68–1.08] | 0.195 | 1.0 | [0.80–1.33] | 0.823 |
| Active smoker | 1.0 | [0.86–1.22] | 0.788 | 1.2 | [0.87–1.55] | 0.323 | 1.1 | [0.83–1.59] | 0.413 |
| Unknown | 1.2 | [0.95–1.61] | 0.115 | 2.0 | [1.38–2.78] | 0.000 | 1.4 | [0.97–2.12] | 0.074 |
| Alcohol consumed per week (units 1) (ref. 0–14) | |||||||||
| >14 | 0.8 | [0.65–0.99] | 0.037 | 1.1 | [0.77–1.51] | 0.665 | 1.1 | [0.75–1.52] | 0.734 |
| Unknown | 1.1 | [0.85–1.43] | 0.475 | 1.8 | [1.31–2.56] | 0.000 | 1.8 | [1.26–2.60] | 0.001 |
| WHO Body mass index class (ref. normal weight) | |||||||||
| Underweight | 1.9 | [1.47–2.48] | 0.000 | 1.6 | [1.11–2.44] | 0.013 | 2.3 | [1.58–3.39] | 0.000 |
| Overweight | 0.7 | [0.65–0.86] | 0.000 | 0.9 | [0.69–1.05] | 0.139 | 0.8 | [0.61–1.00] | 0.046 |
| Obese | 0.8 | [0.67–0.97] | 0.022 | 0.7 | [0.53–0.98] | 0.037 | 0.6 | [0.39–0.78] | 0.001 |
| Unknown | 0.9 | [0.73–1.21] | 0.620 | 1.7 | [1.25–2.21] | 0.001 | 2.5 | [1.88–3.42] | 0.000 |
| Highest educational level 2 (ref. long) | |||||||||
| Short | 1.1 | [0.90–1.32] | 0.383 | 0.9 | [0.68–1.20] | 0.467 | 0.9 | [0.69–1.31] | 0.747 |
| Medium | 1.0 | [0.81–1.17] | 0.753 | 0.8 | [0.60–1.06] | 0.120 | 0.9 | [0.63–1.18] | 0.356 |
| Unknown or unclassified | 1.3 | [0.97–1.81] | 0.073 | 1.4 | [0.93–1.98] | 0.109 | 0.9 | [0.58–1.42] | 0.681 |
| Annual household income (ref. 4th quartile) | |||||||||
| 1st quartile | 1.2 | [0.97–1.45] | 0.102 | 1.5 | [1.10–2.03] | 0.011 | 1.4 | [0.96–1.92] | 0.086 |
| 2nd quartile | 1.2 | [0.97–1.44] | 0.089 | 1.6 | [1.20–2.16] | 0.002 | 1.4 | [1.03–2.00] | 0.031 |
| 3rd quartile | 1.1 | [0.95–1.37] | 0.166 | 1.2 | [0.92–1.68] | 0.148 | 1.0 | [0.71–1.41] | 0.994 |
| Unknown | 1.8 | [0.67–4.58] | 0.250 | 3.0 | [0.72–12.78] | 0.130 | - | - | - |
| Cohabitation status (ref. cohabiting) | |||||||||
| Alone | 1.2 | [1.03–1.32] | 0.017 | 1.7 | [1.39–1.97] | 0.000 | 1.4 | [1.14–1.66] | 0.001 |
| Unknown | 0.8 | [0.13–4.90] | 0.803 | 0.3 | [0.01–4.52] | 0.349 | - | - | - |
| Hospital (ref. Q) | |||||||||
| A | 1.2 | [0.85–1.80] | 0.272 | 1.8 | [1.04–3.26] | 0.037 | 1.2 | [0.63–2.15] | 0.635 |
| B | 1.1 | [0.76–1.62] | 0.581 | 0.6 | [0.33–0.99] | 0.044 | 0.2 | [0.12–0.49] | 0.000 |
| C | 0.6 | [0.42–0.90] | 0.012 | 0.6 | [0.31–1.03] | 0.064 | 0.4 | [0.20–0.73] | 0.004 |
| D | 0.7 | [0.50–1.05] | 0.092 | 1.8 | [1.16–2.77] | 0.009 | 1.0 | [0.57–1.58] | 0.857 |
| E | 0.3 | [0.23–0.48] | 0.000 | 0.9 | [0.57–1.48] | 0.716 | 0.4 | [0.22–0.73] | 0.003 |
| F | 1.2 | [0.90–1.62] | 0.216 | 2.6 | [1.74–3.92] | 0.000 | 1.8 | [1.13–2.74] | 0.012 |
| G | 0.9 | [0.70–1.28] | 0.709 | 0.7 | [0.43–1.14] | 0.151 | 0.5 | [0.29–0.81] | 0.006 |
| H | 1.0 | [0.73–1.30] | 0.870 | 2.8 | [1.93–4.17] | 0.000 | 1.5 | [0.95–2.27] | 0.085 |
| I | 0.3 | [0.24–0.49] | 0.000 | 1.1 | [0.73–1.77] | 0.583 | 1.7 | [1.07–2.56] | 0.023 |
| J | 0.8 | [0.57–1.01] | 0.060 | 1.8 | [1.17–2.65] | 0.007 | 1.5 | [0.94–2.37] | 0.087 |
| K | 1.1 | [0.83–1.37] | 0.613 | 0.8 | [0.52–1.22] | 0.300 | 1.2 | [0.79–1.81] | 0.399 |
| L | 0.6 | [0.44–0.78] | 0.000 | 1.3 | [0.85–1.87] | 0.254 | 0.7 | [0.44–1.09] | 0.115 |
| M | 0.7 | [0.50–0.89] | 0.005 | 1.0 | [0.68–1.52] | 0.923 | 1.4 | [0.92–2.02] | 0.128 |
| N | 0.8 | [0.58–1.02] | 0.068 | 2.0 | [1.40–2.87] | 0.000 | 1.5 | [1.04–2.28] | 0.030 |
| O | 0.8 | [0.58–0.99] | 0.040 | 0.8 | [0.57–1.25] | 0.401 | 0.6 | [0.38–0.89] | 0.013 |
| P | 1.3 | [0.96–1.64] | 0.100 | 2.6 | [1.75–3.74] | 0.000 | 2.1 | [1.41–3.20] | 0.000 |
| Year of diagnosis | 0.9 | [0.88–0.96] | 0.000 | 1.2 | [1.14–1.27] | 0.000 | 1.2 | [1.12–1.25] | 0.000 |
| Intercept | 0.0 | [0.01–0.01] | 0.000 | 0.0 | [0.00–0.00] | 0.000 | 0.0 | [0.00–0.00] | 0.000 |
| Colon | Rectum | |||||||||||
|---|---|---|---|---|---|---|---|---|---|---|---|---|
| Treatment with Adjuvant Therapy | Treatment with Adjuvant Therapy | |||||||||||
| No treatment | Treatment | Total | No treatment | Treatment | Total | |||||||
| N | % | N | % | N | % | N | % | N | % | N | % | |
| Sex | ||||||||||||
| Male | 818 | 55 | 2151 | 53 | 2969 | 53 | 456 | 62 | 1055 | 61 | 1511 | 62 |
| Female | 682 | 45 | 1909 | 47 | 2591 | 47 | 274 | 38 | 661 | 39 | 935 | 38 |
| Age group | ||||||||||||
| <50 | 15 | 1 | 251 | 6 | 266 | 5 | 24 | 3 | 143 | 8 | 167 | 7 |
| 50–64 | 289 | 19 | 1348 | 33 | 1637 | 29 | 184 | 25 | 702 | 41 | 886 | 36 |
| 65–74 | 679 | 45 | 1881 | 46 | 2560 | 46 | 336 | 46 | 691 | 40 | 1027 | 42 |
| 75–79 | 517 | 34 | 580 | 14 | 1097 | 20 | 186 | 25 | 180 | 10 | 366 | 15 |
| ASA score | ||||||||||||
| I | 205 | 14 | 1243 | 31 | 1448 | 26 | 133 | 18 | 636 | 37 | 769 | 31 |
| II | 758 | 51 | 2323 | 57 | 3081 | 55 | 423 | 58 | 912 | 53 | 1335 | 55 |
| III | 475 | 32 | 443 | 11 | 918 | 17 | 167 | 23 | 147 | 9 | 314 | 13 |
| IV + V | 36 | 2 | 7 | 0 | 43 | 1 | <10 | 1 | <5 | 0 | 8 | 0 |
| Unknown | 26 | 2 | 44 | 1 | 70 | 1 | <5 | 0 | <20 | 1 | 20 | 1 |
| WHO performance status | ||||||||||||
| 0 | 374 | 25 | 1601 | 39 | 1975 | 36 | 175 | 24 | 751 | 44 | 926 | 38 |
| 1 | 216 | 14 | 380 | 9 | 596 | 11 | 72 | 10 | 99 | 6 | 171 | 7 |
| 2 | 80 | 5 | 63 | 2 | 143 | 3 | <25 | 3 | <15 | 1 | 34 | 1 |
| 3 + 4 | 26 | 2 | 8 | 0 | 34 | 1 | <5 | 0 | <5 | 0 | 5 | 0 |
| Unknown | 804 | 54 | 2008 | 49 | 2812 | 51 | 457 | 63 | 853 | 50 | 1310 | 54 |
| UICC stage | ||||||||||||
| II | 695 | 46 | 557 | 14 | 1252 | 23 | 329 | 45 | 174 | 10 | 503 | 21 |
| III | 805 | 54 | 3503 | 86 | 4308 | 77 | 401 | 55 | 1542 | 90 | 1943 | 79 |
| Neoadjuvant therapy | ||||||||||||
| No | 502 | 69 | 1468 | 86 | 1970 | 81 | ||||||
| Yes | 228 | 31 | 248 | 14 | 476 | 19 | ||||||
| Mismatch repair status | ||||||||||||
| pMMR | 971 | 65 | 2918 | 72 | 3889 | 70 | 517 | 71 | 1381 | 80 | 1898 | 78 |
| dMMR | 251 | 17 | 422 | 10 | 673 | 12 | 15 | 2 | 22 | 1 | 37 | 2 |
| Missing MMR | 278 | 19 | 720 | 18 | 998 | 18 | 198 | 27 | 313 | 18 | 511 | 21 |
| Postoperative medical complication < 30 days | ||||||||||||
| No | 1136 | 76 | 3559 | 88 | 4695 | 84 | 531 | 73 | 1565 | 91 | 2096 | 86 |
| Yes | 237 | 16 | 167 | 4 | 404 | 7 | 128 | 18 | 83 | 5 | 211 | 9 |
| Unknown | 127 | 8 | 334 | 8 | 461 | 8 | 71 | 10 | 68 | 4 | 139 | 6 |
| Postoperative surgical complication < 30 days | ||||||||||||
| No | 1018 | 68 | 3271 | 81 | 4289 | 77 | 375 | 51 | 1253 | 73 | 1628 | 67 |
| Yes | 360 | 24 | 468 | 12 | 828 | 15 | 290 | 40 | 396 | 23 | 686 | 28 |
| Unknown | 122 | 8 | 321 | 8 | 443 | 8 | 65 | 9 | 67 | 4 | 132 | 5 |
| Charlson score | ||||||||||||
| 0 | 1008 | 67 | 3341 | 82 | 4349 | 78 | 543 | 74 | 1476 | 86 | 2019 | 83 |
| 1 | 160 | 11 | 287 | 7 | 447 | 8 | 64 | 9 | 87 | 5 | 151 | 6 |
| 2 | 223 | 15 | 317 | 8 | 540 | 10 | 89 | 12 | 121 | 7 | 210 | 9 |
| 3+ | 109 | 7 | 115 | 3 | 224 | 4 | 34 | 5 | 32 | 2 | 66 | 3 |
| Smoking status | ||||||||||||
| Never a smoker | 457 | 30 | 1587 | 39 | 2044 | 37 | 205 | 28 | 690 | 40 | 895 | 37 |
| Ex-smoker | 572 | 38 | 1493 | 37 | 2065 | 37 | 286 | 39 | 612 | 36 | 898 | 37 |
| Active smoker | 313 | 21 | 661 | 16 | 974 | 18 | 170 | 23 | 297 | 17 | 467 | 19 |
| Unknown | 158 | 11 | 319 | 8 | 477 | 9 | 69 | 9 | 117 | 7 | 186 | 8 |
| Alcohol consumed per week (units 1) | ||||||||||||
| 0–14 | 1181 | 79 | 3269 | 81 | 4450 | 80 | 559 | 77 | 1394 | 81 | 1953 | 80 |
| >14 | 185 | 12 | 511 | 13 | 696 | 13 | 100 | 14 | 221 | 13 | 321 | 13 |
| Unknown | 134 | 9 | 280 | 7 | 414 | 7 | 71 | 10 | 101 | 6 | 172 | 7 |
| WHO Body mass index class | ||||||||||||
| Underweight | 47 | 3 | 73 | 2 | 120 | 2 | 35 | 5 | 17 | 1 | 52 | 2 |
| Normal | 582 | 39 | 1513 | 37 | 2095 | 38 | 284 | 39 | 659 | 38 | 943 | 39 |
| Overweight | 502 | 33 | 1471 | 36 | 1973 | 35 | 254 | 35 | 671 | 39 | 925 | 38 |
| Obese | 269 | 18 | 821 | 20 | 1090 | 20 | 124 | 17 | 316 | 18 | 440 | 18 |
| Unknown | 100 | 7 | 182 | 4 | 282 | 5 | 33 | 5 | 53 | 3 | 86 | 4 |
| Highest educational level 2 | ||||||||||||
| Short | 600 | 40 | 1216 | 30 | 1816 | 33 | 306 | 42 | 476 | 28 | 782 | 32 |
| Medium | 655 | 44 | 1923 | 47 | 2578 | 46 | 301 | 41 | 835 | 49 | 1136 | 46 |
| Long | 203 | 14 | 836 | 21 | 1039 | 19 | 104 | 14 | 373 | 22 | 477 | 20 |
| Unknown or unclassified | 42 | 3 | 85 | 2 | 127 | 2 | 19 | 3 | 32 | 2 | 51 | 2 |
| Annual household income | ||||||||||||
| 1st quartile | 425 | 28 | 704 | 17 | 1129 | 20 | 211 | 29 | 266 | 16 | 477 | 20 |
| 2nd quartile | 411 | 27 | 848 | 21 | 1259 | 23 | 160 | 22 | 320 | 19 | 480 | 20 |
| 3rd quartile | 375 | 25 | 1127 | 28 | 1502 | 27 | 194 | 27 | 475 | 28 | 669 | 27 |
| 4th quartile | 283 | 19 | 1374 | 34 | 1657 | 30 | 160 | 22 | 650 | 38 | 810 | 33 |
| Unknown | 6 | 0 | 7 | 0 | 13 | 0 | 5 | 1 | 5 | 0 | 10 | 0 |
| Cohabitation status | ||||||||||||
| Cohabiting | 873 | 58 | 2879 | 71 | 3752 | 67 | 444 | 61 | 1256 | 73 | 1700 | 70 |
| Alone | <630 | 42 | <1185 | 29 | <1810 | 32 | <285 | 39 | <460 | 27 | <745 | 30 |
| Unknown | <5 | 0 | <5 | 0 | <5 | 0 | <5 | 0 | <5 | 0 | <5 | 0 |
| Colon | Rectum | |||||
|---|---|---|---|---|---|---|
| OR | 95% CI | p | OR | 95%CI | p | |
| Sex (ref. female) | ||||||
| Male | 0.90 | [0.77–1.04] | 0.161 | 1.18 | [0.93–1.48] | 0.170 |
| Age group (ref. 50–64) | ||||||
| <50 | 3.68 | [2.09–6.51] | 0.000 | 1.44 | [0.84–2.47] | 0.180 |
| 65–74 | 0.79 | [0.65–0.94] | 0.010 | 0.62 | [0.47–0.80] | 0.000 |
| 75–79 | 0.34 | [0.27–0.42] | 0.000 | 0.28 | [0.20–0.38] | 0.000 |
| N-a | 0.93 | [0.54–1.60] | 0.790 | 0.23 | [0.09–0.54] | 0.001 |
| ASA score (ref. I) | ||||||
| II | 0.78 | [0.63–0.95] | 0.016 | 0.77 | [0.58–1.02] | 0.066 |
| III | 0.35 | [0.27–0.46] | 0.000 | 0.48 | [0.32–0.72] | 0.000 |
| IV + V | 0.09 | [0.04–0.22] | 0.000 | 0.58 | [0.09–3.70] | 0.565 |
| Unknown | 0.45 | [0.24–0.84] | 0.011 | 3.79 | [0.75–19.32] | 0.108 |
| WHO performance status (ref. 0) | ||||||
| 1 | 0.81 | [0.64–1.04] | 0.096 | 0.63 | [0.41–0.95] | 0.029 |
| 2 | 0.63 | [0.41–0.97] | 0.037 | 0.43 | [0.18–1.04] | 0.062 |
| 3 + 4 | 0.29 | [0.11–0.72] | 0.008 | 0.22 | [0.02–2.51] | 0.224 |
| N-a 1 | ||||||
| Unknown | 1.32 | [0.99–1.76] | 0.055 | 1.28 | [0.82–2.02] | 0.280 |
| Comorbidity | ||||||
| Cardiovascular disease | 0.93 | [0.79–1.10] | 0.407 | 0.90 | [0.71–1.15] | 0.402 |
| Chronic pulmonary disease | 0.96 | [0.81–1.13] | 0.607 | 0.99 | [0.76–1.30] | 0.947 |
| Diabetes | 0.80 | [0.65–0.97] | 0.027 | 0.82 | [0.60–1.13] | 0.234 |
| Dementia | 0.28 | [0.12–0.66] | 0.004 | 0.37 | [0.12–1.15] | 0.085 |
| Liver disease | 0.48 | [0.25–0.91] | 0.024 | 0.59 | [0.14–2.49] | 0.476 |
| Kidney disease | 0.41 | [0.25–0.66] | 0.000 | 0.29 | [0.12–0.74] | 0.009 |
| Nerve disease | 0.62 | [0.32–1.22] | 0.166 | 0.25 | [0.08–0.81] | 0.020 |
| Other cancer | 0.74 | [0.59–0.93] | 0.010 | 0.77 | [0.53–1.12] | 0.175 |
| Connective tissue disease | 0.77 | [0.59–1.01] | 0.055 | 0.88 | [0.57–1.34] | 0.539 |
| Affective disorder | 0.87 | [0.73–1.04] | 0.124 | 1.04 | [0.78–1.39] | 0.805 |
| Schizophrenia spectrum disorder | 0.36 | [0.13–1.01] | 0.052 | 0.36 | [0.07–1.88] | 0.227 |
| Disorder of adult personality and behaviour | 1.02 | [0.29–3.59] | 0.981 | 0.25 | [0.06–1.04] | 0.056 |
| Psychoactive drug abuse disorder | 0.98 | [0.71–1.36] | 0.906 | 1.00 | [0.59–1.70] | 0.993 |
| Microsatellite status of tumor (ref. pMMR) | ||||||
| dMMR | 0.41 | [0.33–0.51] | 0.000 | 0.62 | [0.22–1.73] | 0.357 |
| N-a | 0.29 | [0.25–0.35] | 0.000 | 1.22 | [0.78–1.93] | 0.384 |
| Missing MMR | 0.77 | [0.58–1.00] | 0.051 | 1.01 | [0.63–1.61] | 0.968 |
| Postoperative medical complication < 30 days (ref. no) | ||||||
| Yes | 0.41 | [0.32–0.52] | 0.000 | 0.28 | [0.20–0.40] | 0.000 |
| Unknown | 1.14 | [0.67–1.93] | 0.624 | 0.59 | [0.25–1.42] | 0.237 |
| Postoperative surgical complication < 30 days (ref. no) | ||||||
| Yes | 0.46 | [0.38–0.56] | 0.000 | 0.41 | [0.33–0.52] | 0.000 |
| Unknown | 0.89 | [0.53–1.51] | 0.669 | 1.21 | [0.49–2.96] | 0.680 |
| Smoking status (ref. non-smoker) | ||||||
| Ex-smoker | 0.96 | [0.82–1.14] | 0.675 | 0.76 | [0.59–0.97] | 0.031 |
| Active smoker | 0.84 | [0.68–1.04] | 0.112 | 0.74 | [0.54–1.00] | 0.048 |
| Unknown | 1.01 | [0.69–1.47] | 0.964 | 1.19 | [0.69–2.05] | 0.536 |
| Alcohol consumed per week (units 2) (ref. 0–14) | ||||||
| >14 | 1.05 | [0.84–1.31] | 0.682 | 0.93 | [0.68–1.27] | 0.638 |
| Unknown | 1.11 | [0.74–1.65] | 0.616 | 0.52 | [0.31–0.90] | 0.019 |
| WHO body mass index class (ref. normal weight) | ||||||
| Underweight | 0.78 | [0.49–1.23] | 0.289 | 0.30 | [0.15–0.62] | 0.001 |
| Overweight | 1.12 | [0.95–1.32] | 0.191 | 1.29 | [1.01–1.65] | 0.038 |
| Obese | 1.46 | [1.19–1.80] | 0.000 | 1.35 | [0.99–1.84] | 0.056 |
| Unknown | 0.90 | [0.61–1.32] | 0.591 | 1.34 | [0.68–2.64] | 0.403 |
| Highest educational level 3 (ref. long) | ||||||
| Short | 0.77 | [0.62–0.97] | 0.026 | 0.79 | [0.57–1.10] | 0.167 |
| Medium | 0.84 | [0.68–1.04] | 0.106 | 0.97 | [0.72–1.32] | 0.867 |
| Unknown or unclassified | 0.67 | [0.42–1.06] | 0.088 | 0.98 | [0.45–2.14] | 0.951 |
| Annual household income (ref. 4th quartile) | ||||||
| 1st quartile | 0.78 | [0.62–0.99] | 0.042 | 0.86 | [0.61–1.22] | 0.406 |
| 2nd quartile | 0.87 | [0.69–1.08] | 0.199 | 1.02 | [0.73–1.42] | 0.927 |
| 3rd quartile | 0.88 | [0.72–1.08] | 0.207 | 0.95 | [0.71–1.27] | 0.721 |
| Unknown | 0.20 | [0.04–0.92] | 0.039 | 0.11 | [0.02–0.72] | 0.021 |
| Cohabitation status (ref. cohabiting) | ||||||
| Alone | 0.70 | [0.60–0.82] | 0.000 | 0.70 | [0.56–0.89] | 0.003 |
| Unknown | 0.29 | [0.01–12.22] | 0.517 | 1.83 | [0.10–32.09] | 0.680 |
| Year of surgery | 1.13 | [1.07–1.20] | 0.000 | 1.17 | [1.02–1.33] | 0.021 |
| Hospital (ref. Q) | ||||||
| A | 3.57 | [2.29–5.57] | 0.000 | - | - | - |
| B | 1.24 | [0.83–1.83] | 0.295 | - | - | - |
| C | 2.56 | [1.69–3.89] | 0.000 | 0.77 | [0.18–3.29] | 0.722 |
| D | 0.64 | [0.43–0.96] | 0.030 | 0.55 | [0.29–1.06] | 0.073 |
| E | 1.59 | [1.06–2.40] | 0.026 | 1.38 | [0.73–2.61] | 0.317 |
| F | 2.50 | [1.74–3.58] | 0.000 | 5.53 | [1.98–15.41] | 0.001 |
| G | 3.36 | [2.25–5.01] | 0.000 | 2.45 | [1.45–4.14] | 0.001 |
| H | 1.82 | [1.26–2.62] | 0.001 | 1.82 | [1.04–3.20] | 0.036 |
| I | 2.97 | [2.01–4.38] | 0.000 | 2.77 | [1.61–4.77] | 0.000 |
| J | 2.21 | [1.55–3.16] | 0.000 | 1.91 | [1.16–3.15] | 0.011 |
| K | 1.96 | [1.28–3.02] | 0.002 | 2.20 | [1.42–3.40] | 0.000 |
| L | 2.76 | [1.93–3.97] | 0.000 | 2.21 | [1.37–3.58] | 0.001 |
| M | 2.35 | [1.65–3.35] | 0.000 | 2.49 | [1.43–4.33] | 0.001 |
| N | 4.42 | [3.08–6.37] | 0.000 | 4.02 | [2.42–6.68] | 0.000 |
| O | 1.37 | [0.97–1.93] | 0.072 | 1.12 | [0.73–1.72] | 0.607 |
| P | 2.19 | [1.58–3.02] | 0.000 | 2.50 | [1.51–4.14] | 0.000 |
| Neoadjuvant therapy (ref. no) | ||||||
| Yes | - | - | - | 0.32 | [0.24–0.43] | 0.000 |
| N-a | - | - | - | 0.62 | [0.38–1.00] | 0.051 |
| Intercept | 4.60 | [2.59–8.16] | 0.000 | 3.02 | [1.28–7.11] | 0.011 |
Disclaimer/Publisher’s Note: The statements, opinions and data contained in all publications are solely those of the individual author(s) and contributor(s) and not of MDPI and/or the editor(s). MDPI and/or the editor(s) disclaim responsibility for any injury to people or property resulting from any ideas, methods, instructions or products referred to in the content. |
© 2024 by the authors. Licensee MDPI, Basel, Switzerland. This article is an open access article distributed under the terms and conditions of the Creative Commons Attribution (CC BY) license (https://creativecommons.org/licenses/by/4.0/).
Share and Cite
Rattenborg, S.; Frøstrup Hansen, T.; Möller, S.; Frostberg, E.; Rahr, H.B. Non-Curative Treatment Choices in Colorectal Cancer: Predictors and Between-Hospital Variations in Denmark: A Population-Based Register Study. Cancers 2024, 16, 366. https://doi.org/10.3390/cancers16020366
Rattenborg S, Frøstrup Hansen T, Möller S, Frostberg E, Rahr HB. Non-Curative Treatment Choices in Colorectal Cancer: Predictors and Between-Hospital Variations in Denmark: A Population-Based Register Study. Cancers. 2024; 16(2):366. https://doi.org/10.3390/cancers16020366
Chicago/Turabian StyleRattenborg, Søren, Torben Frøstrup Hansen, Sören Möller, Erik Frostberg, and Hans Bjarke Rahr. 2024. "Non-Curative Treatment Choices in Colorectal Cancer: Predictors and Between-Hospital Variations in Denmark: A Population-Based Register Study" Cancers 16, no. 2: 366. https://doi.org/10.3390/cancers16020366
APA StyleRattenborg, S., Frøstrup Hansen, T., Möller, S., Frostberg, E., & Rahr, H. B. (2024). Non-Curative Treatment Choices in Colorectal Cancer: Predictors and Between-Hospital Variations in Denmark: A Population-Based Register Study. Cancers, 16(2), 366. https://doi.org/10.3390/cancers16020366