
Deep Learning Prediction Model for Patient Survival Outcomes in Palliative Care Using Actigraphy Data and Clinical Information

 ,
,  , ,
, ,  , and
, and 
Abstract
Simple Summary
Abstract
1. Introduction
2. Materials and Methods
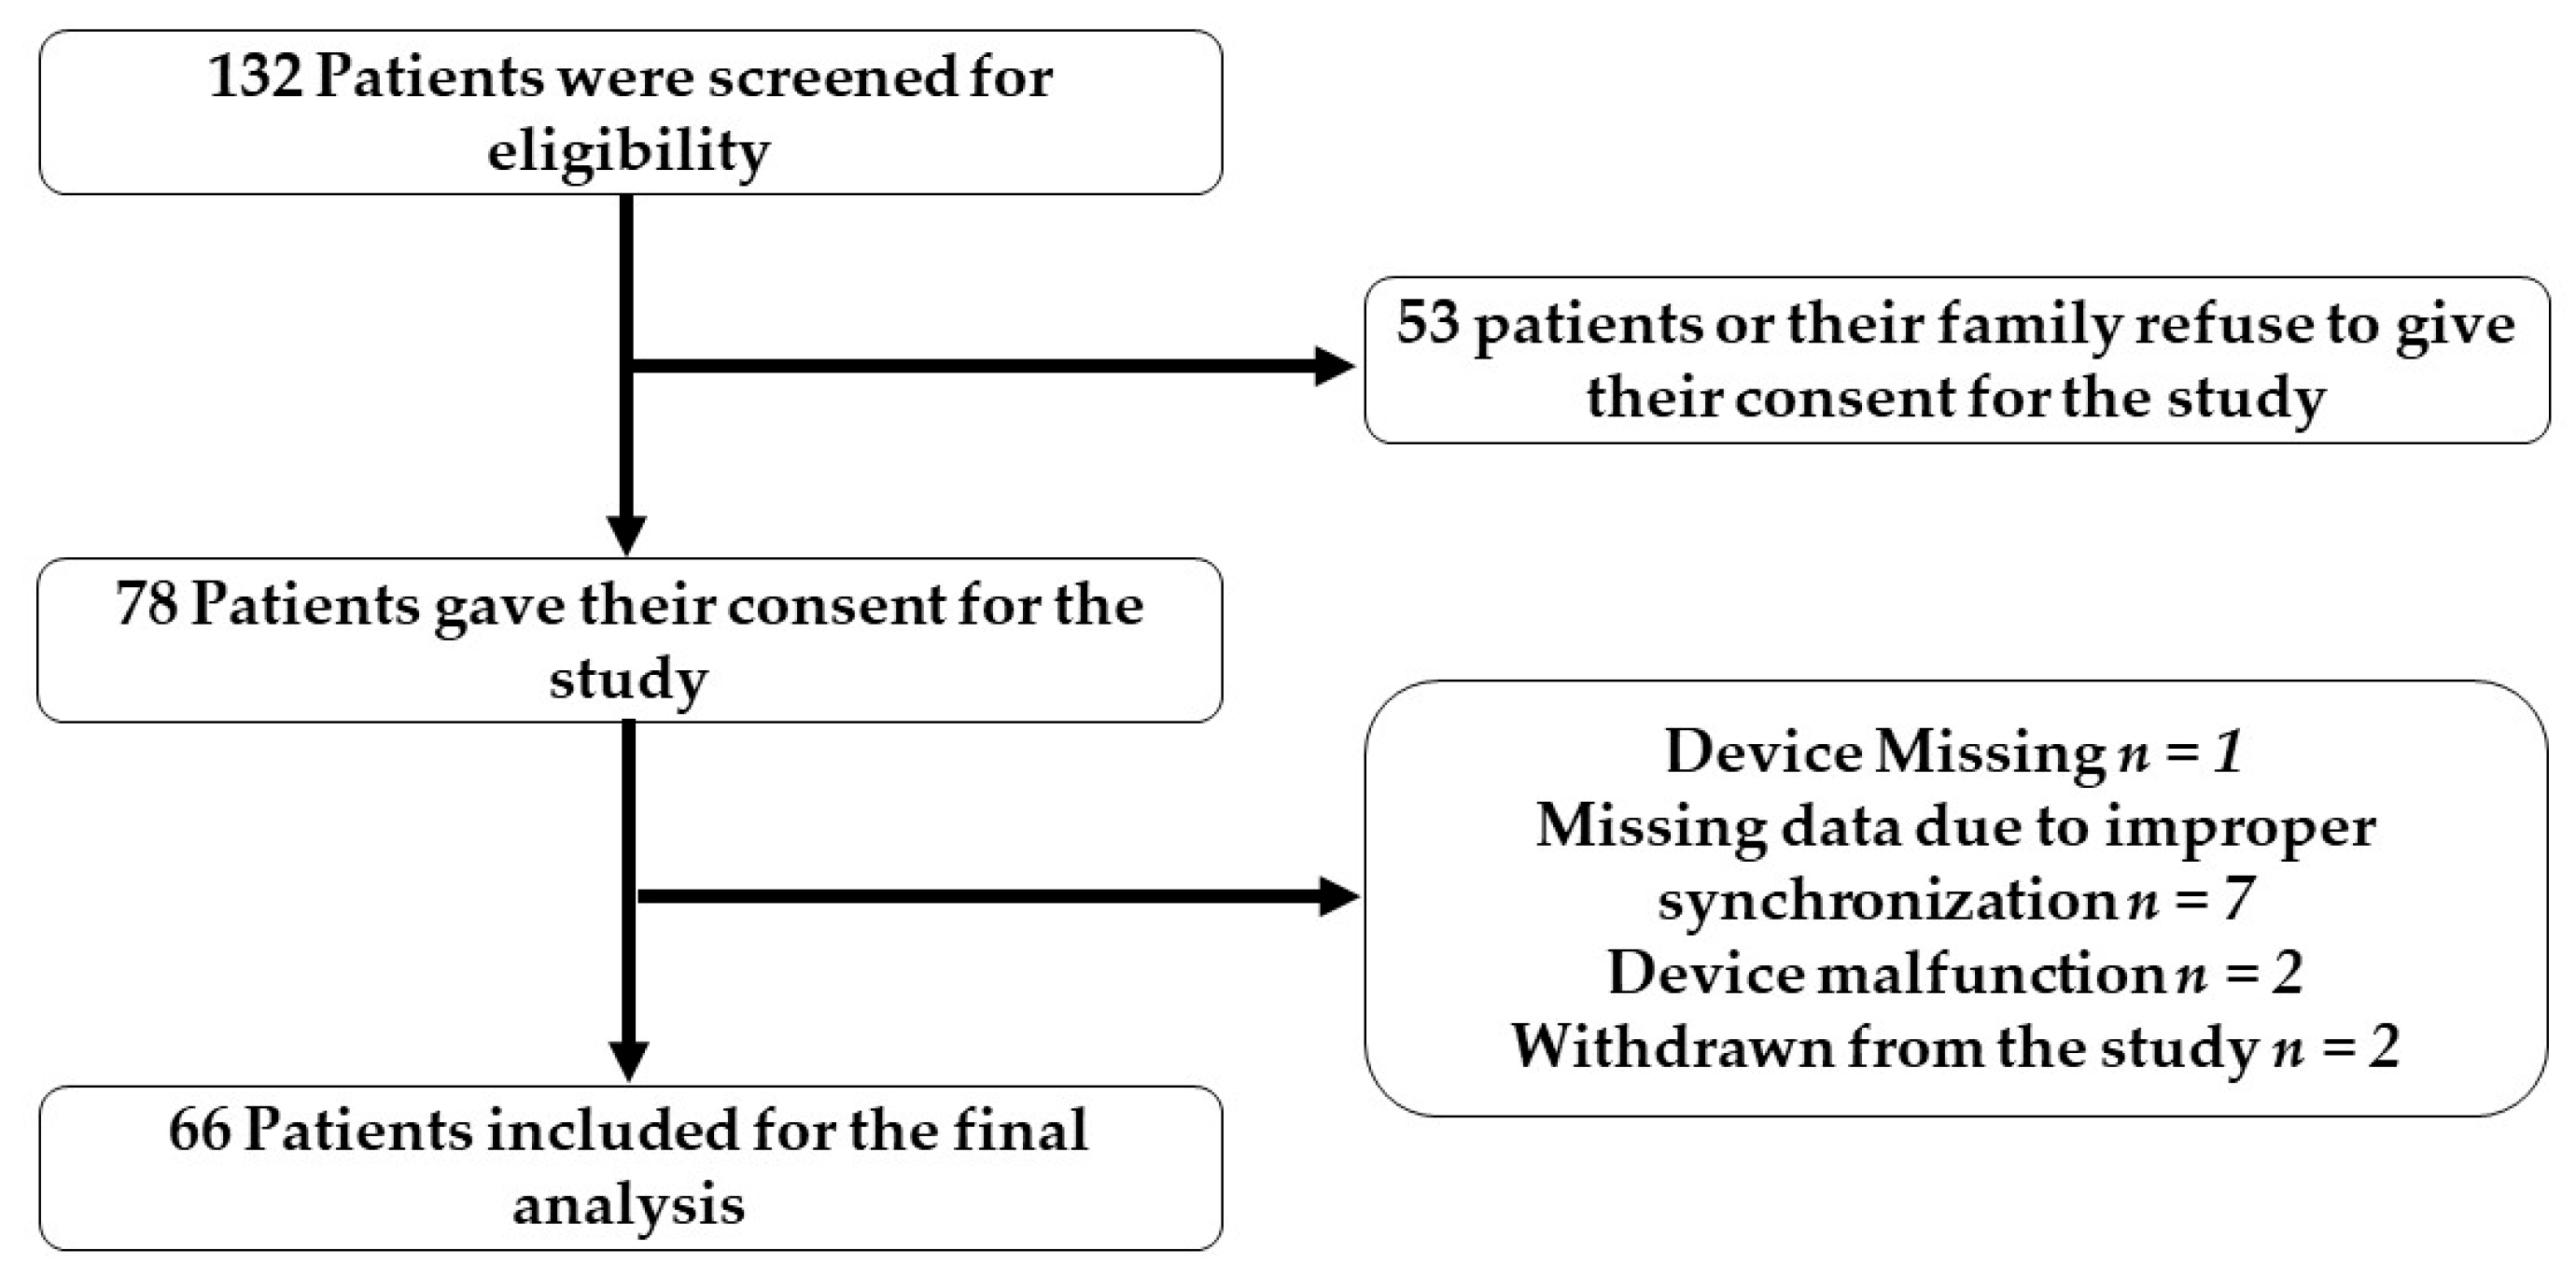
2.1. Study Design, Setting, and Recruitment
- (1)
- Patients above the age of 20;
- (2)
- Confirmed terminal-stage solid cancer diagnosis by two oncologists;
- (3)
- Patients who had given consent for hospice treatment and do-not-resuscitate consent.
- (1)
- Patients who had signs of dying within a day from admission;
- (2)
- Cancer of unknown origin;
- (3)
- Patients moved to another ward after admission.
2.2. Data Collection and Acquisition Using Wrist Actigraphy
2.3. Data Processing
2.3.1. For 48 h Data
2.3.2. For 24 h Data
2.3.3. For 12 h Data
2.4. Data Splitting
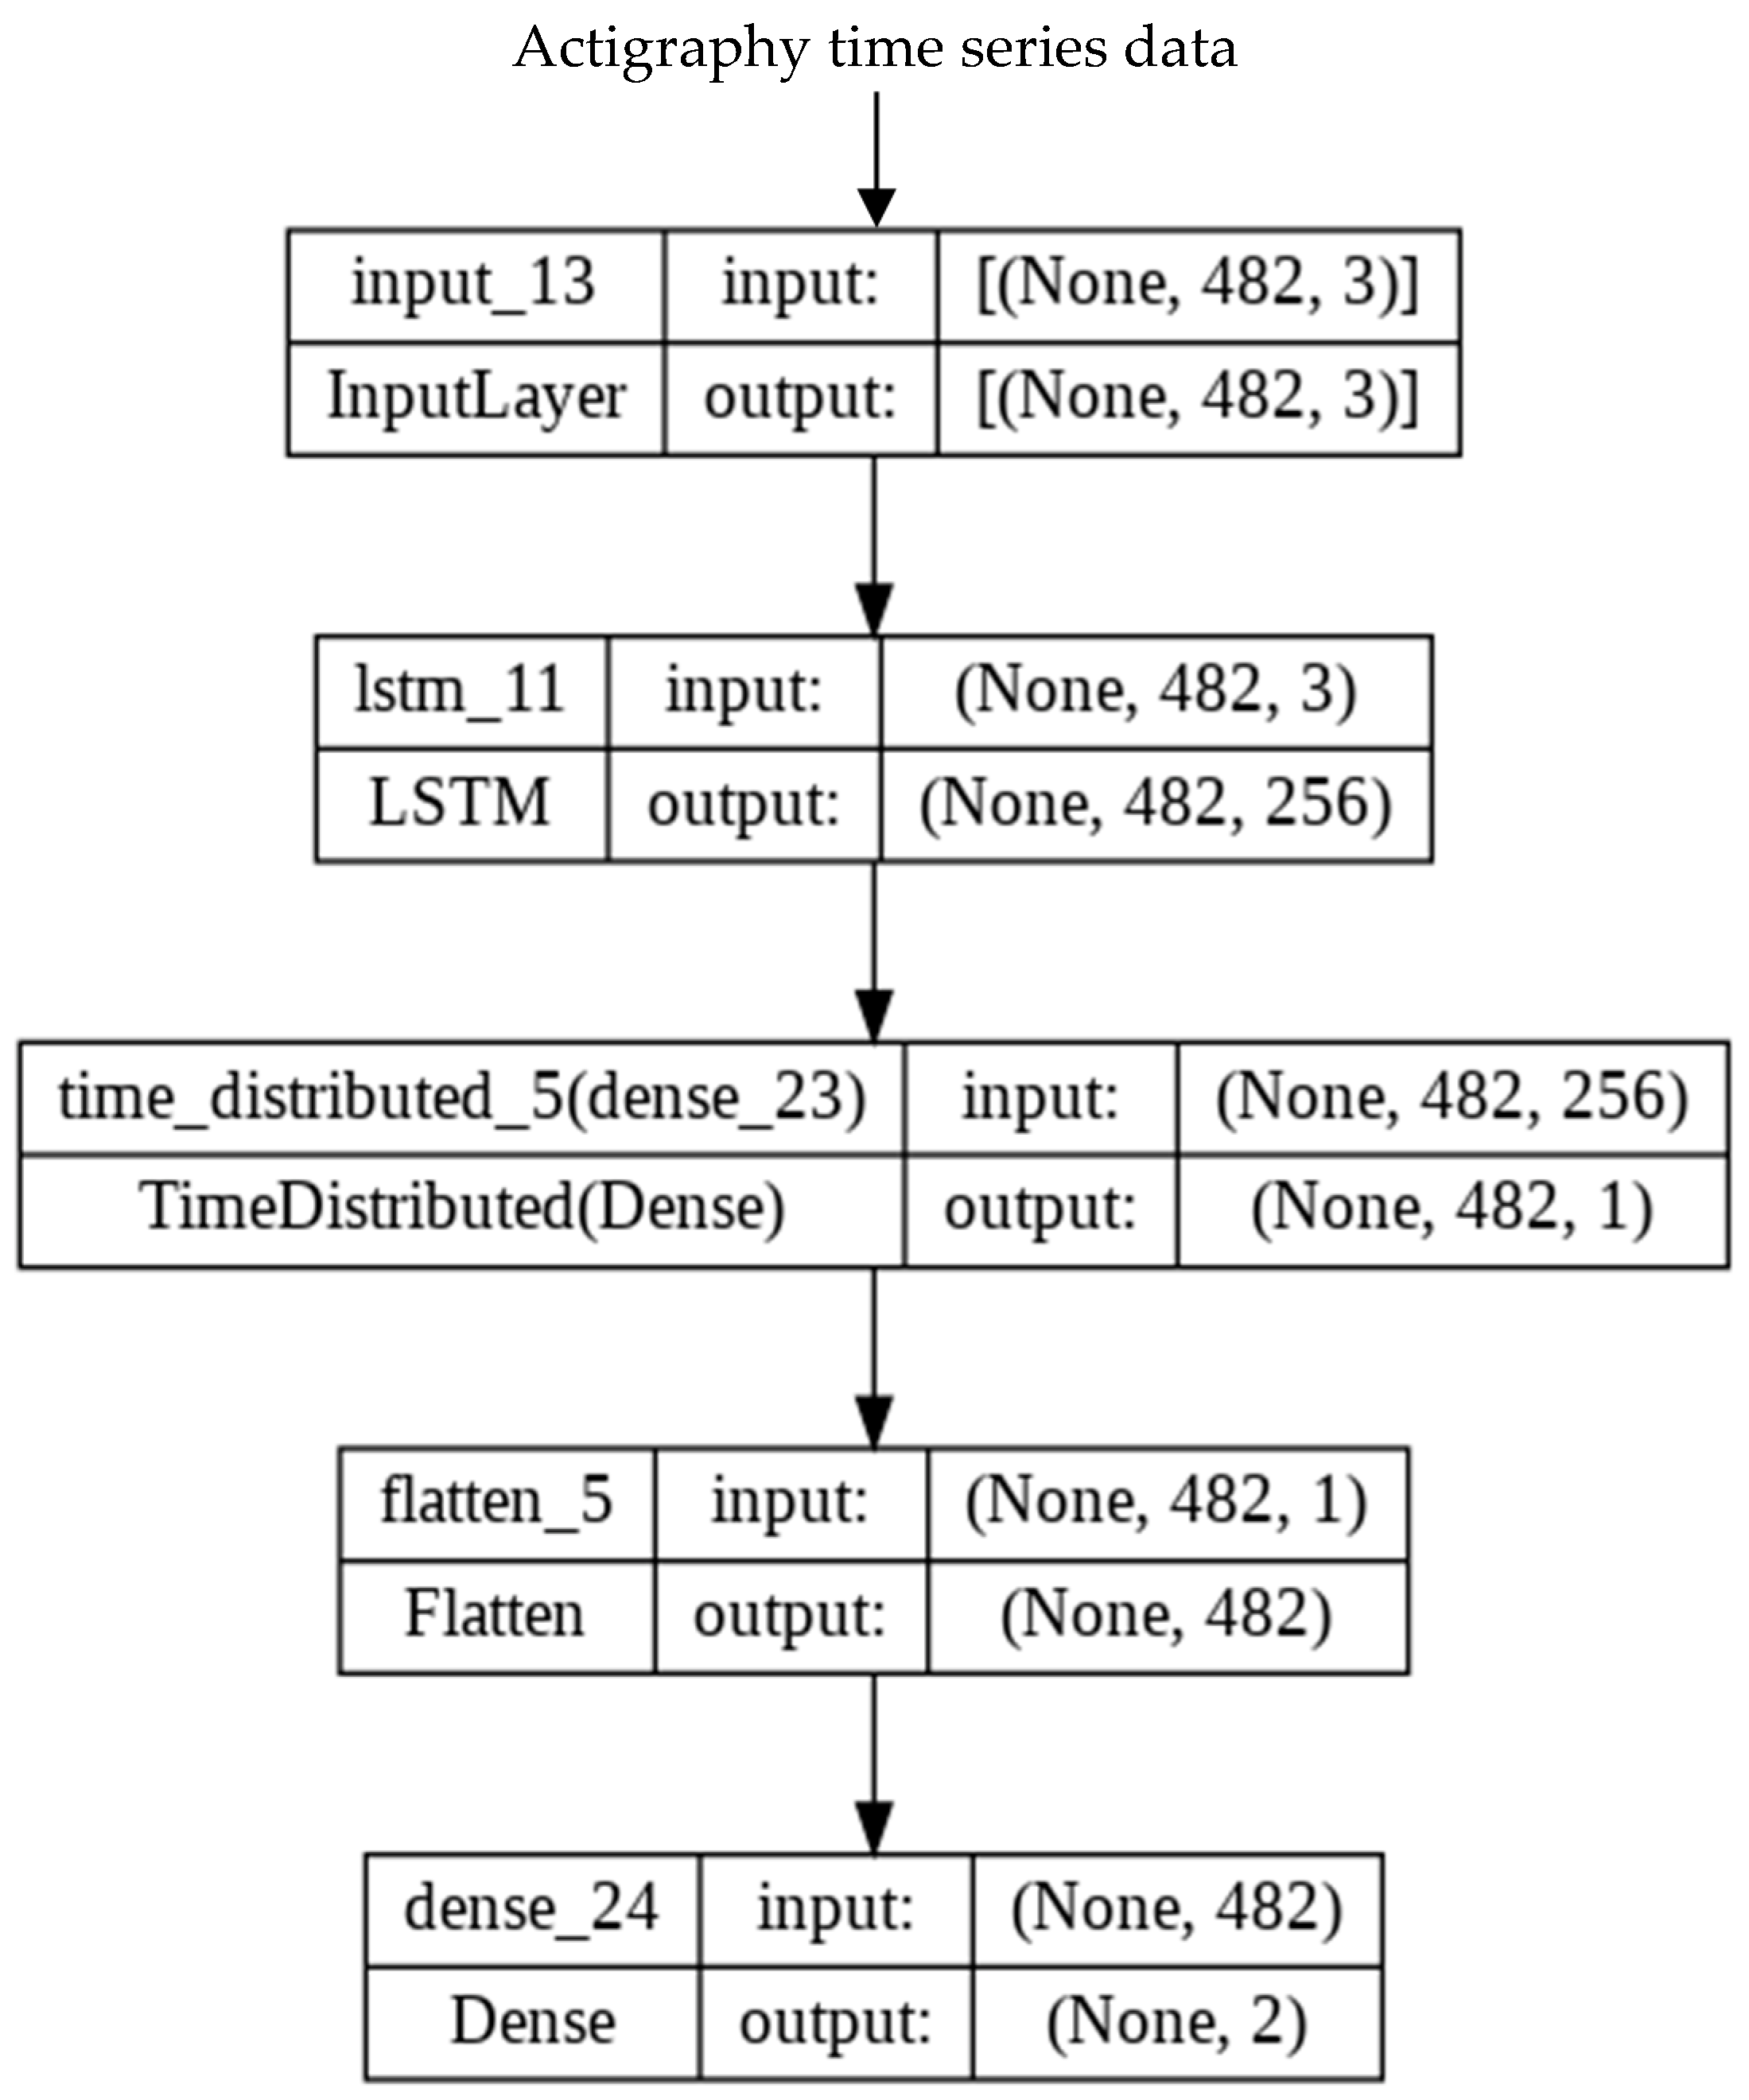
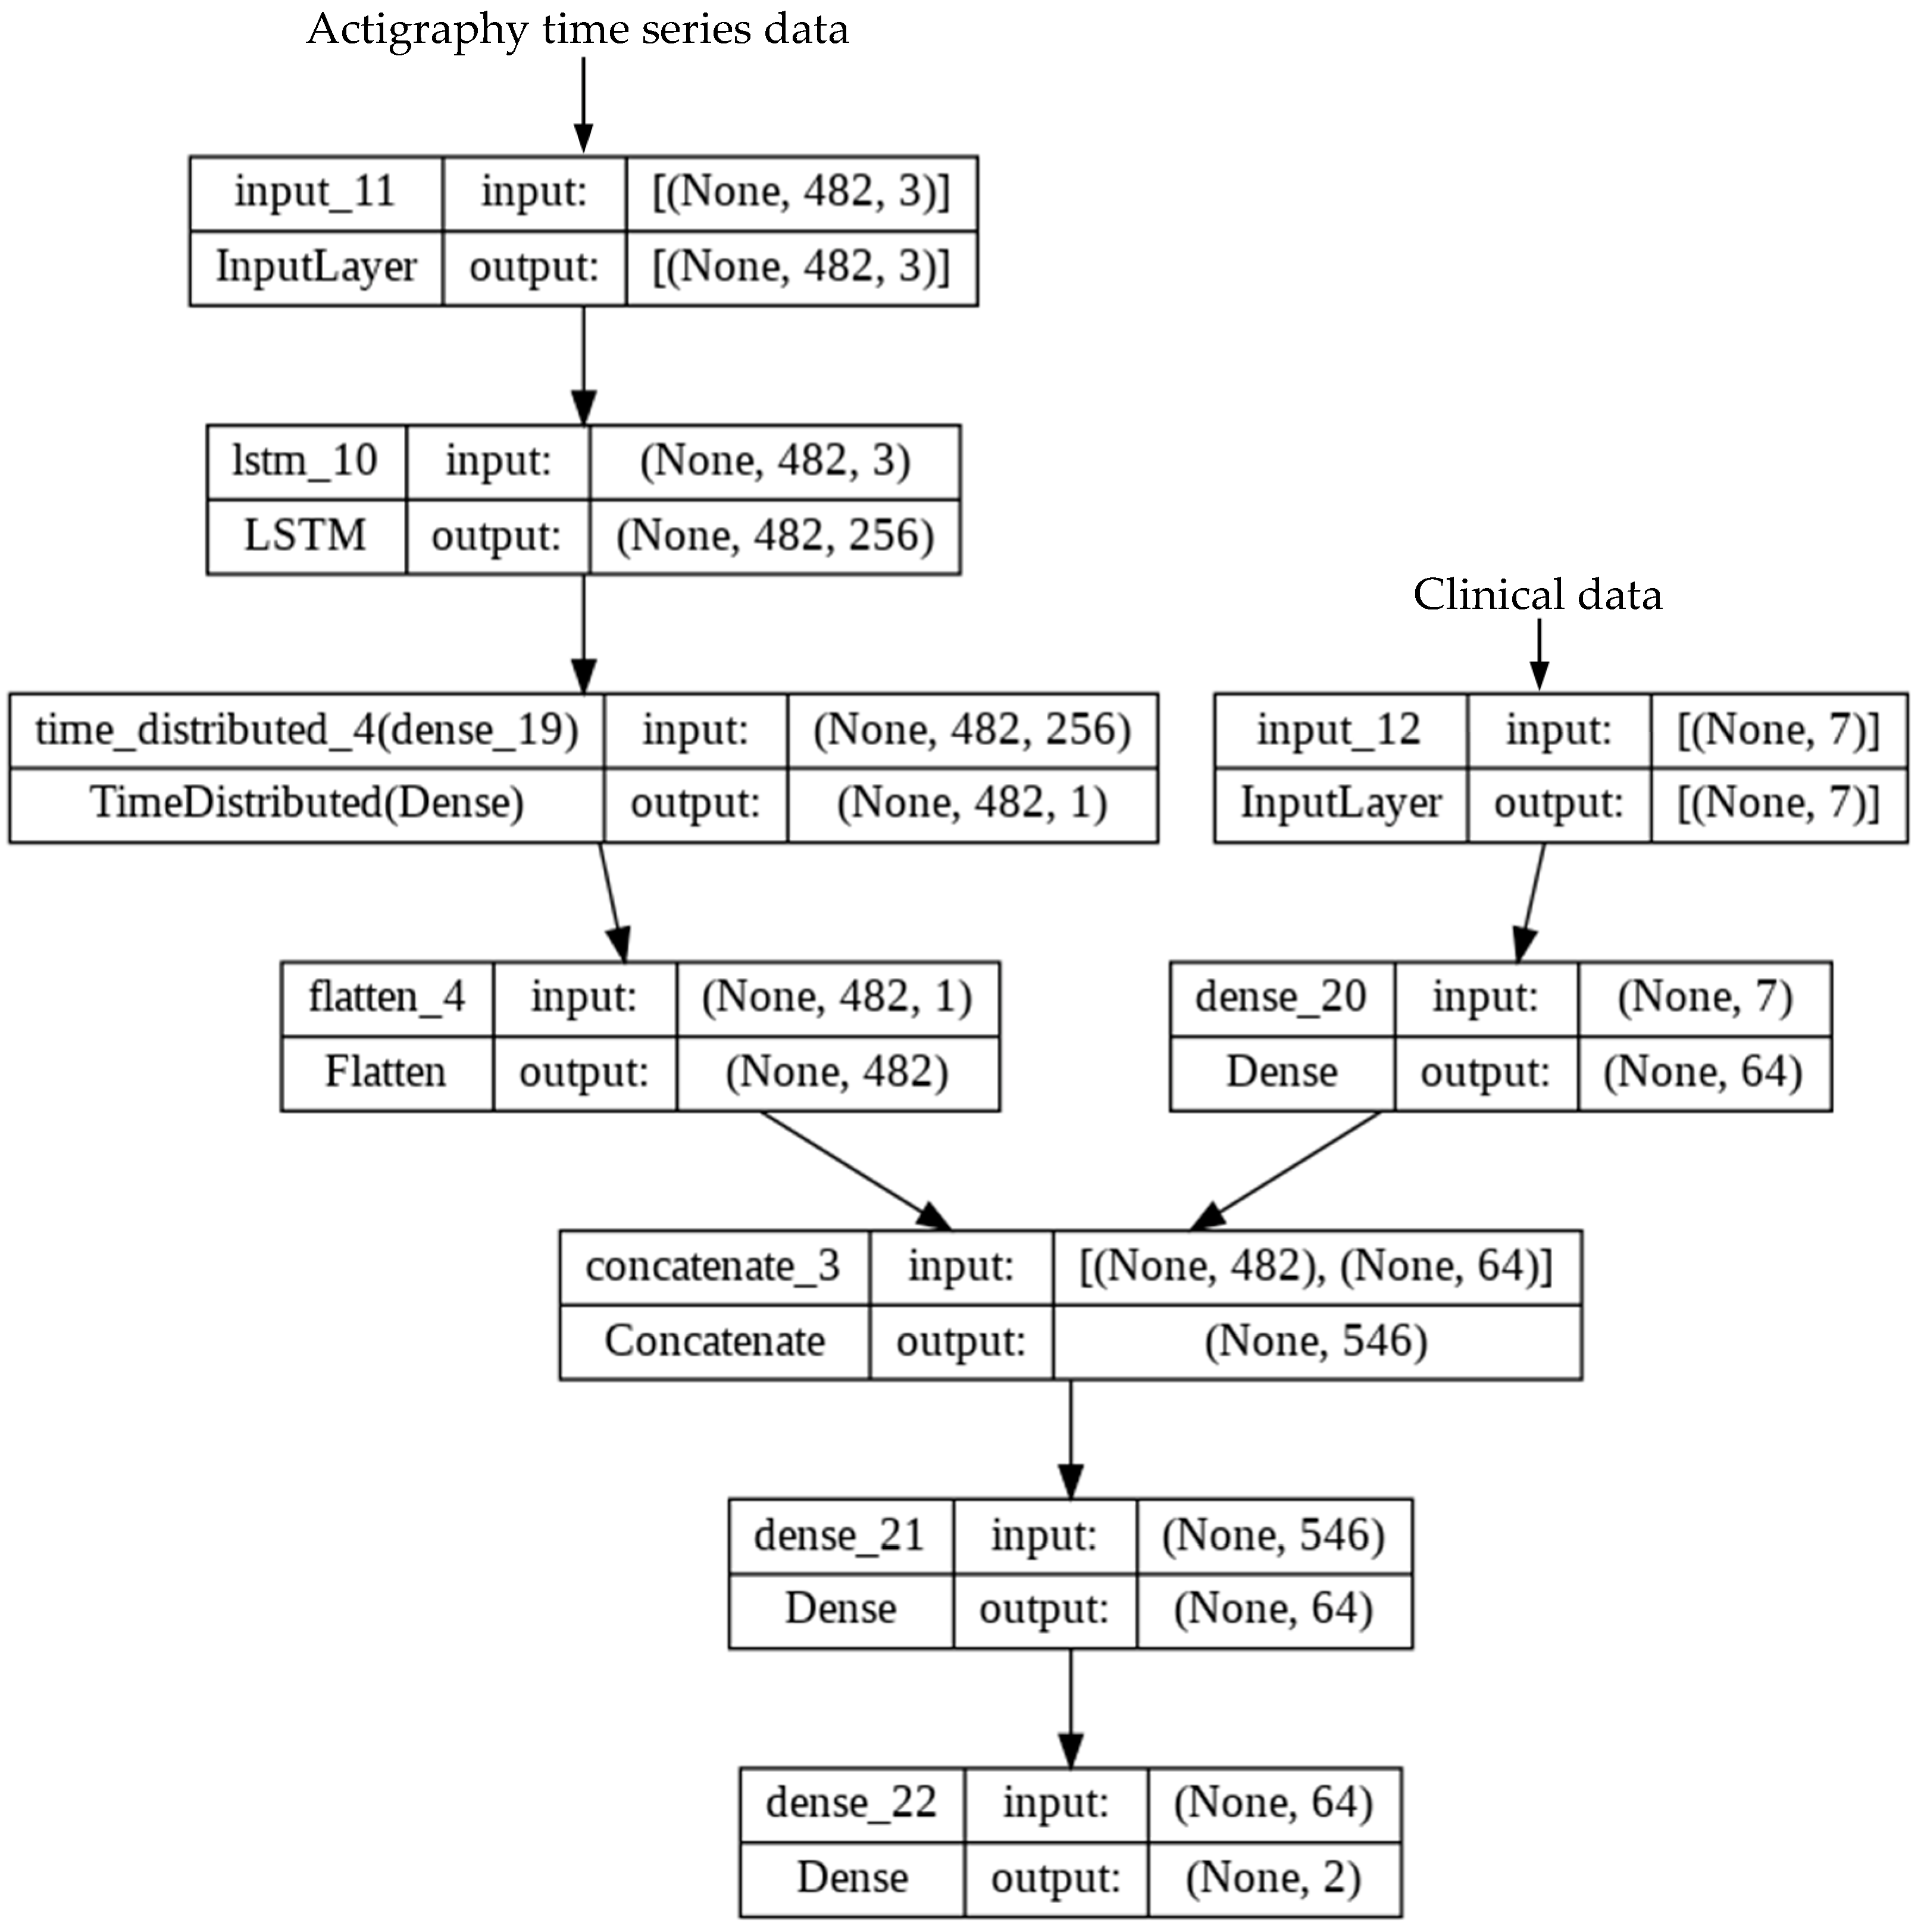
2.5. Development of Deep Learning (DL) Model
2.6. Experimental Setup
2.7. Statistical Analysis
3. Results
3.1. Demographics of the Study Population
3.2. Prognostic Accuracy of KPS and PPI
3.3. Training of Survival Prediction Models
3.4. Impact of Time Frame on Transformer Model Performance
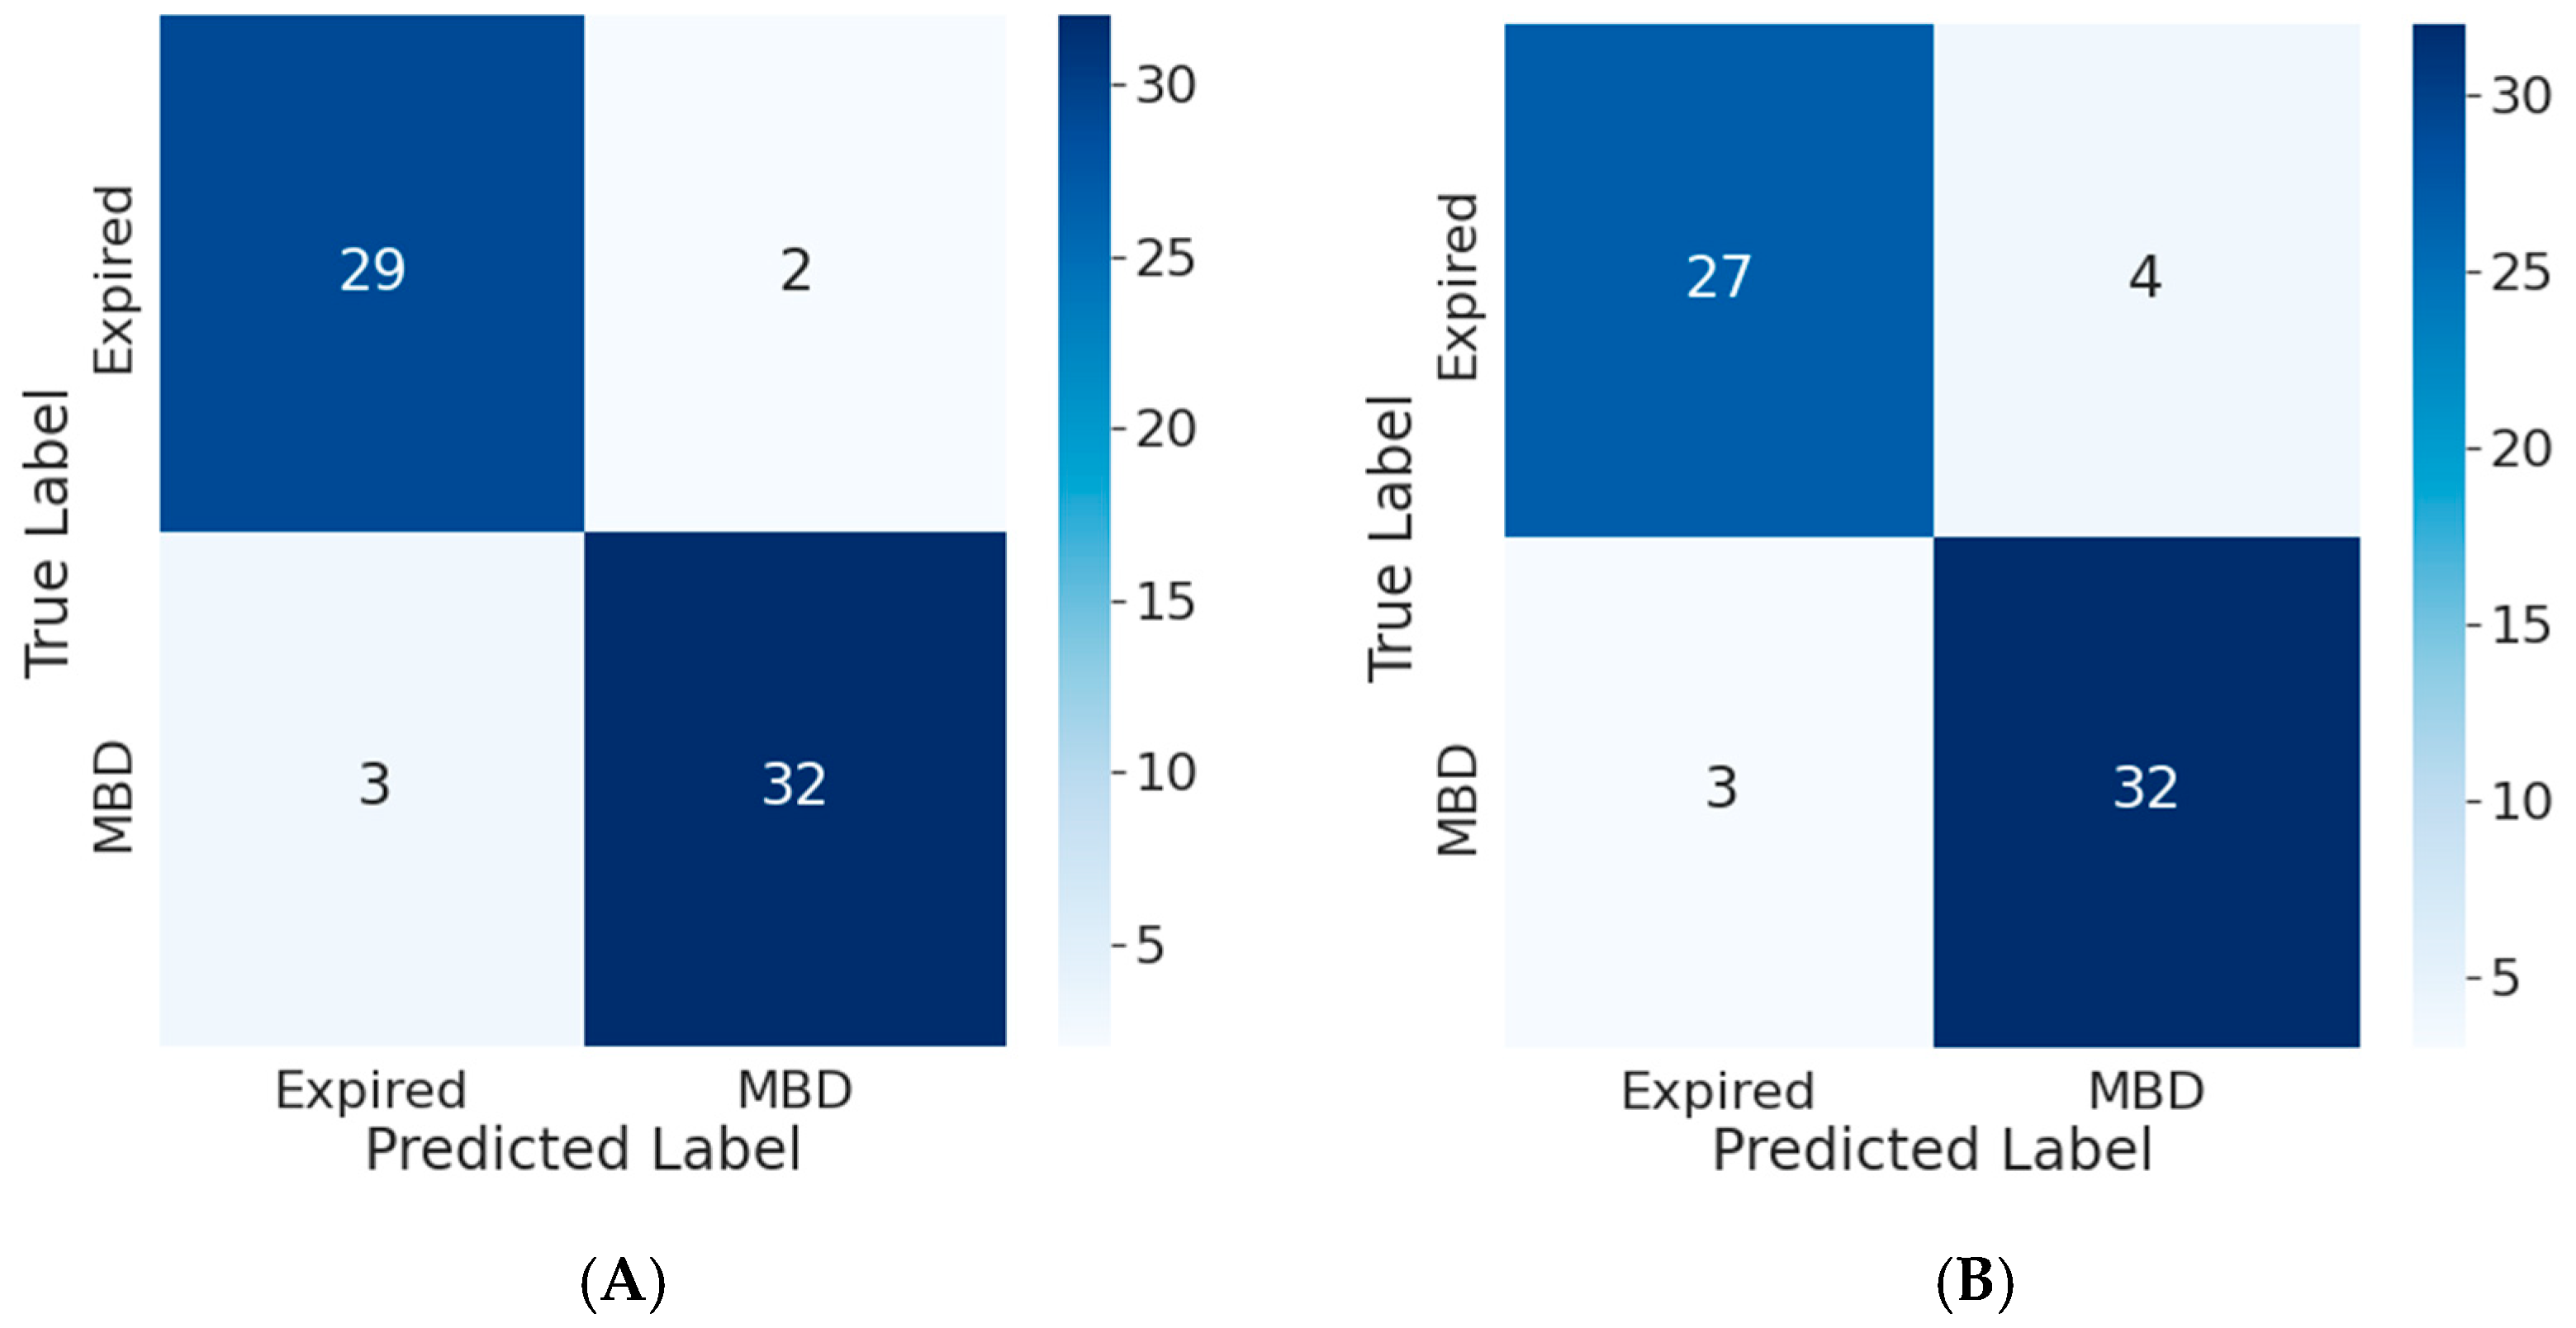
3.5. Comparison between the Accuracy of Traditional Prognostic Tools and Wearable Data
4. Discussion
5. Conclusions
Author Contributions
Funding
Institutional Review Board Statement
Informed Consent Statement
Data Availability Statement
Conflicts of Interest
Appendix A
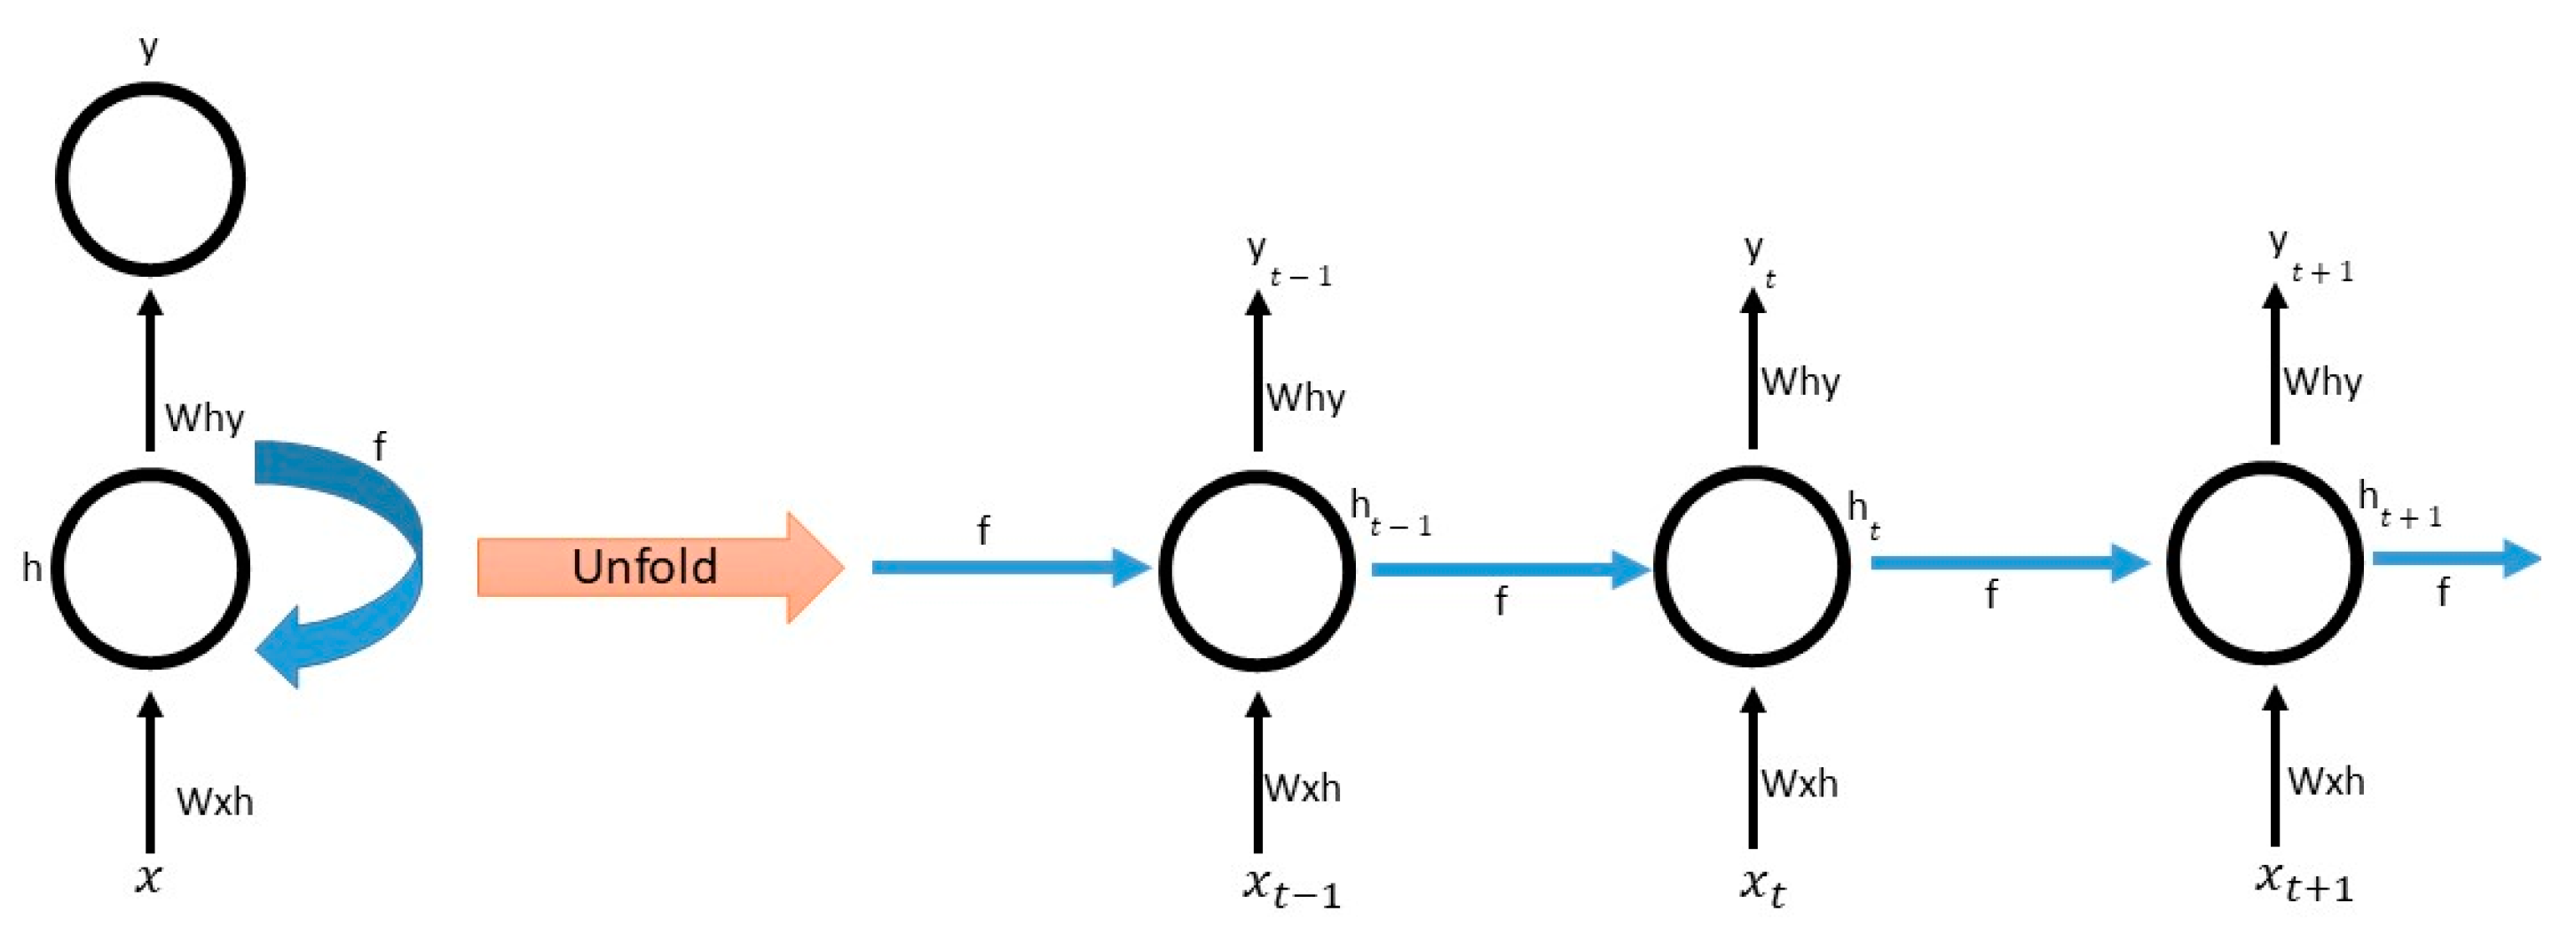
Appendix A.1. LSTM


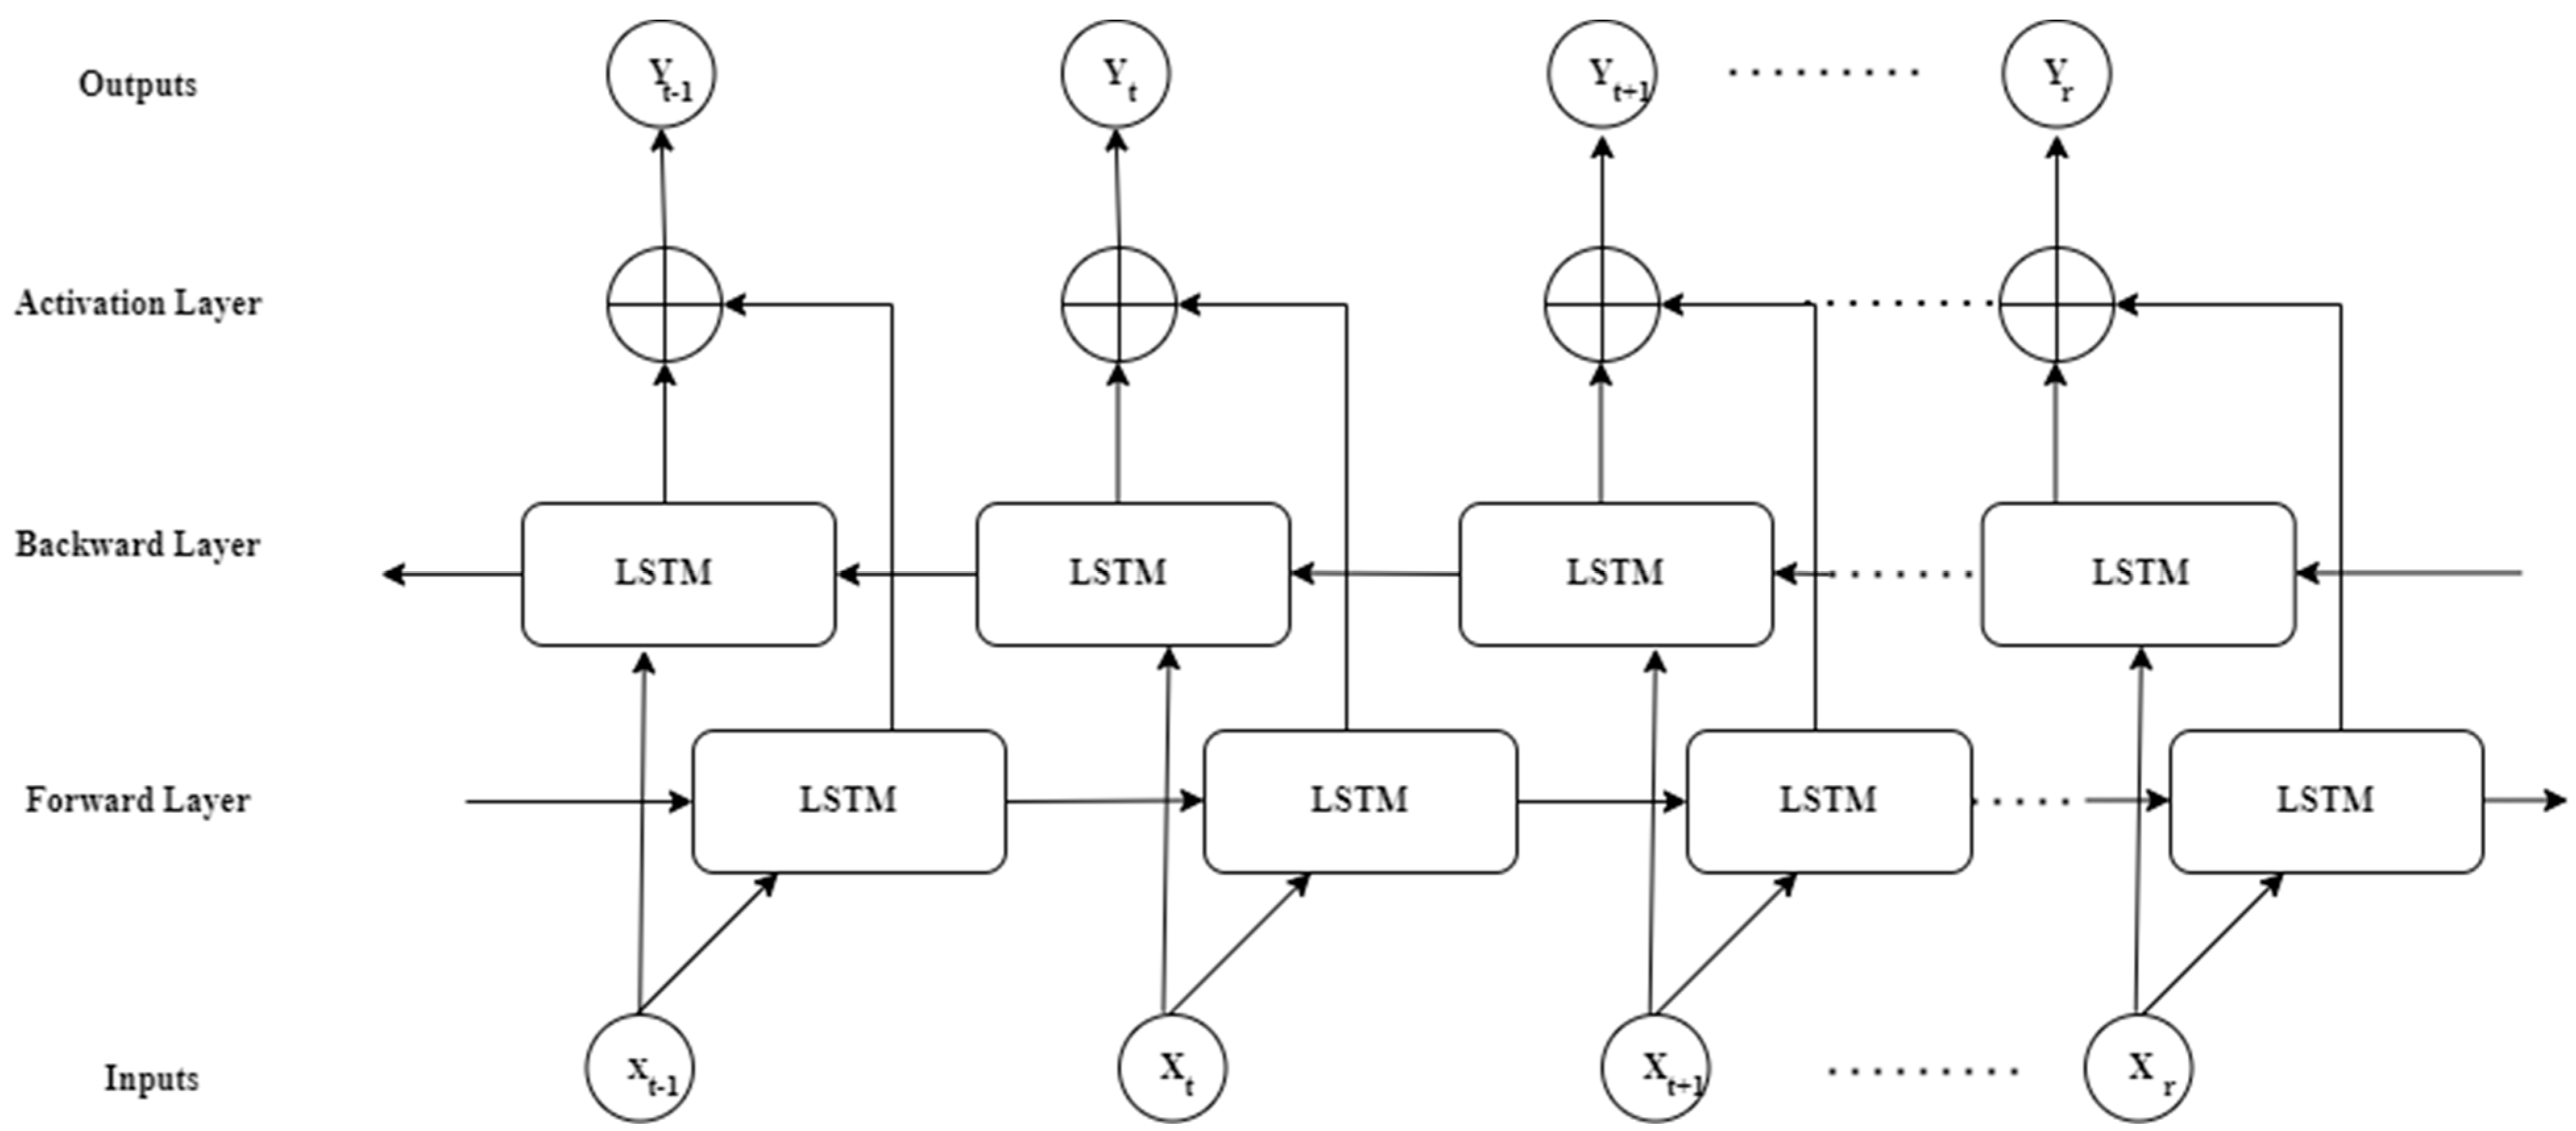
Appendix A.2. BiLSTM


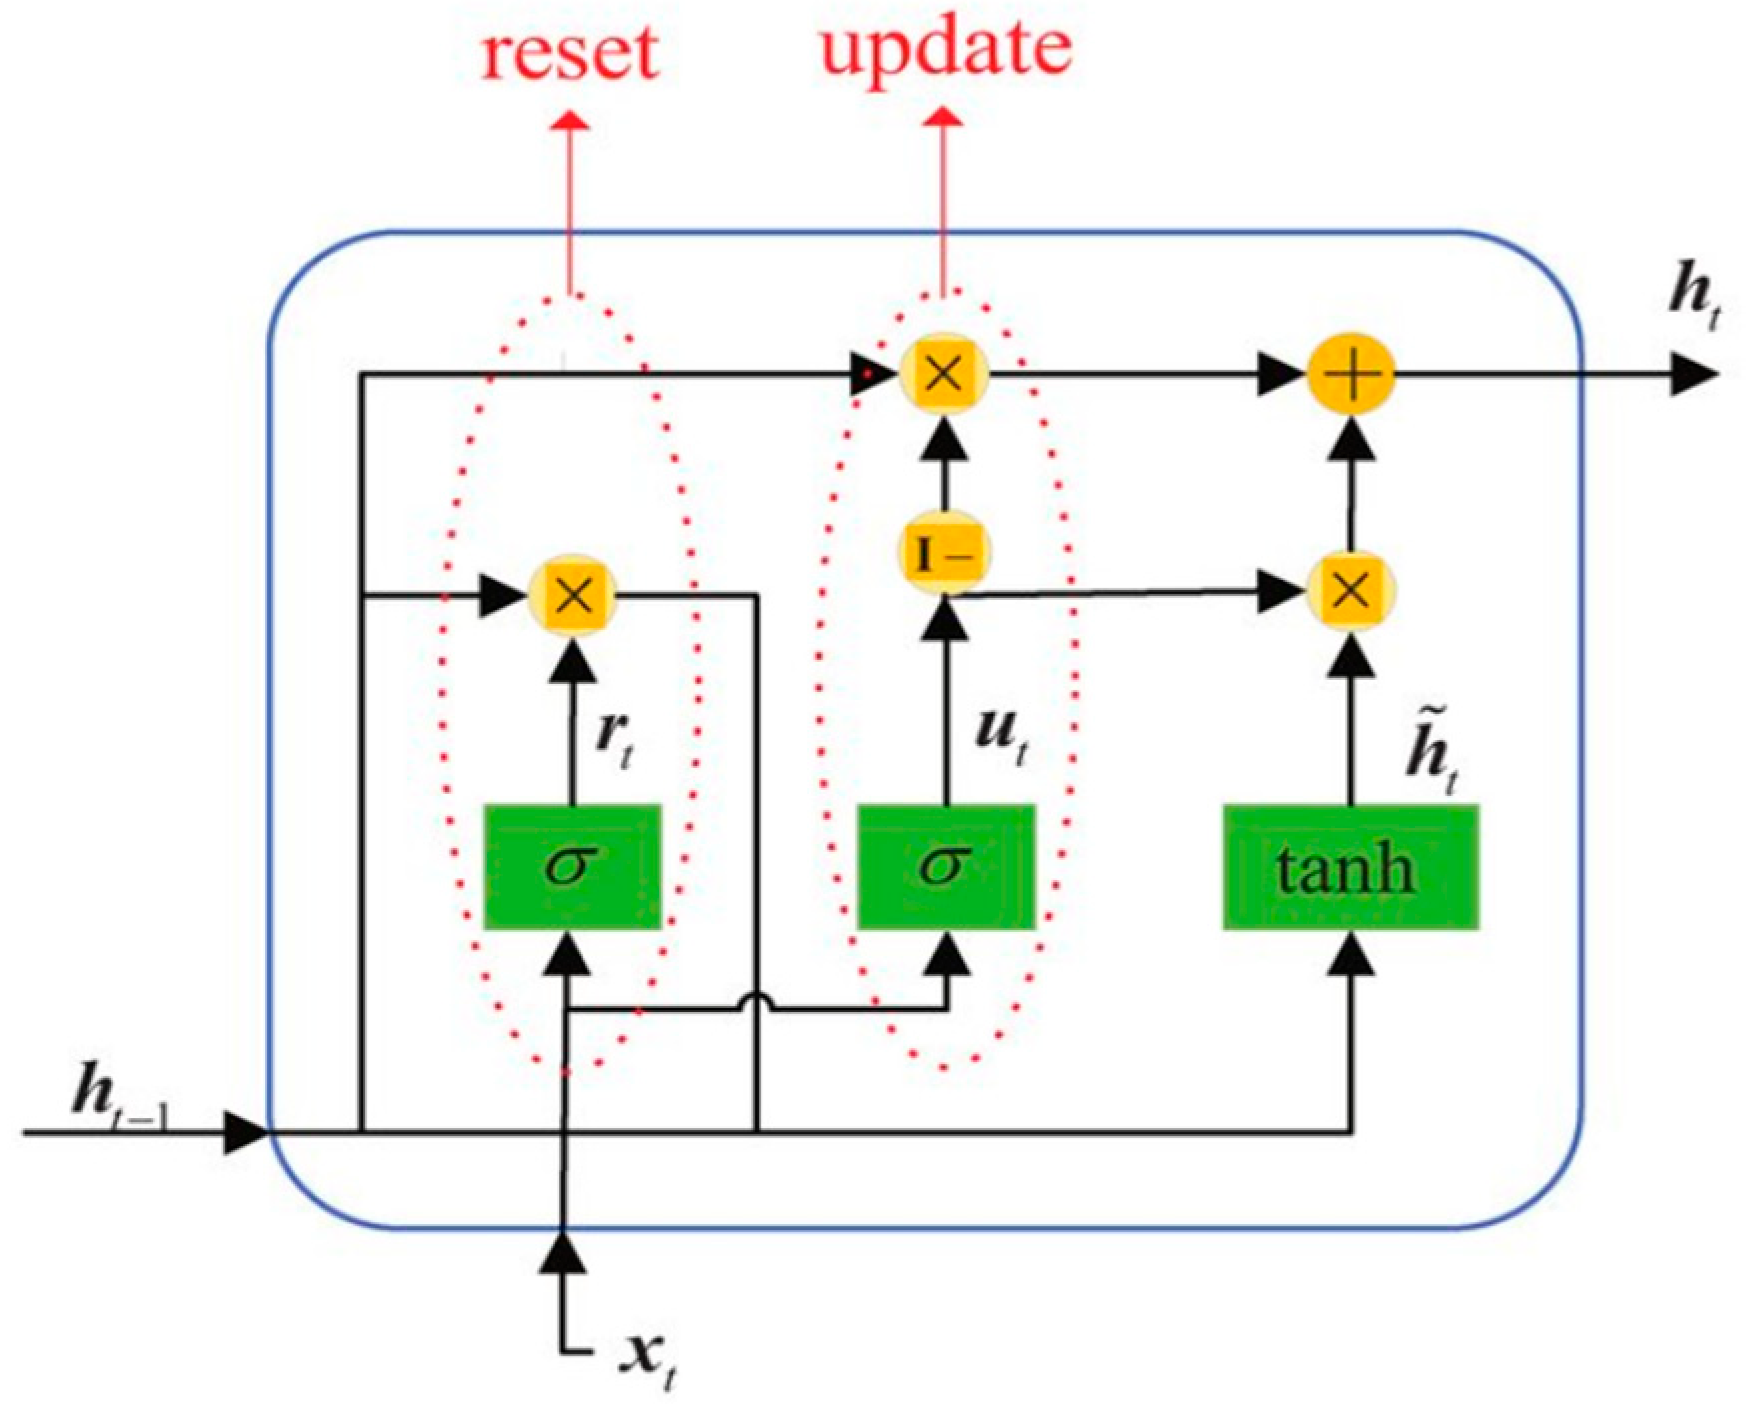
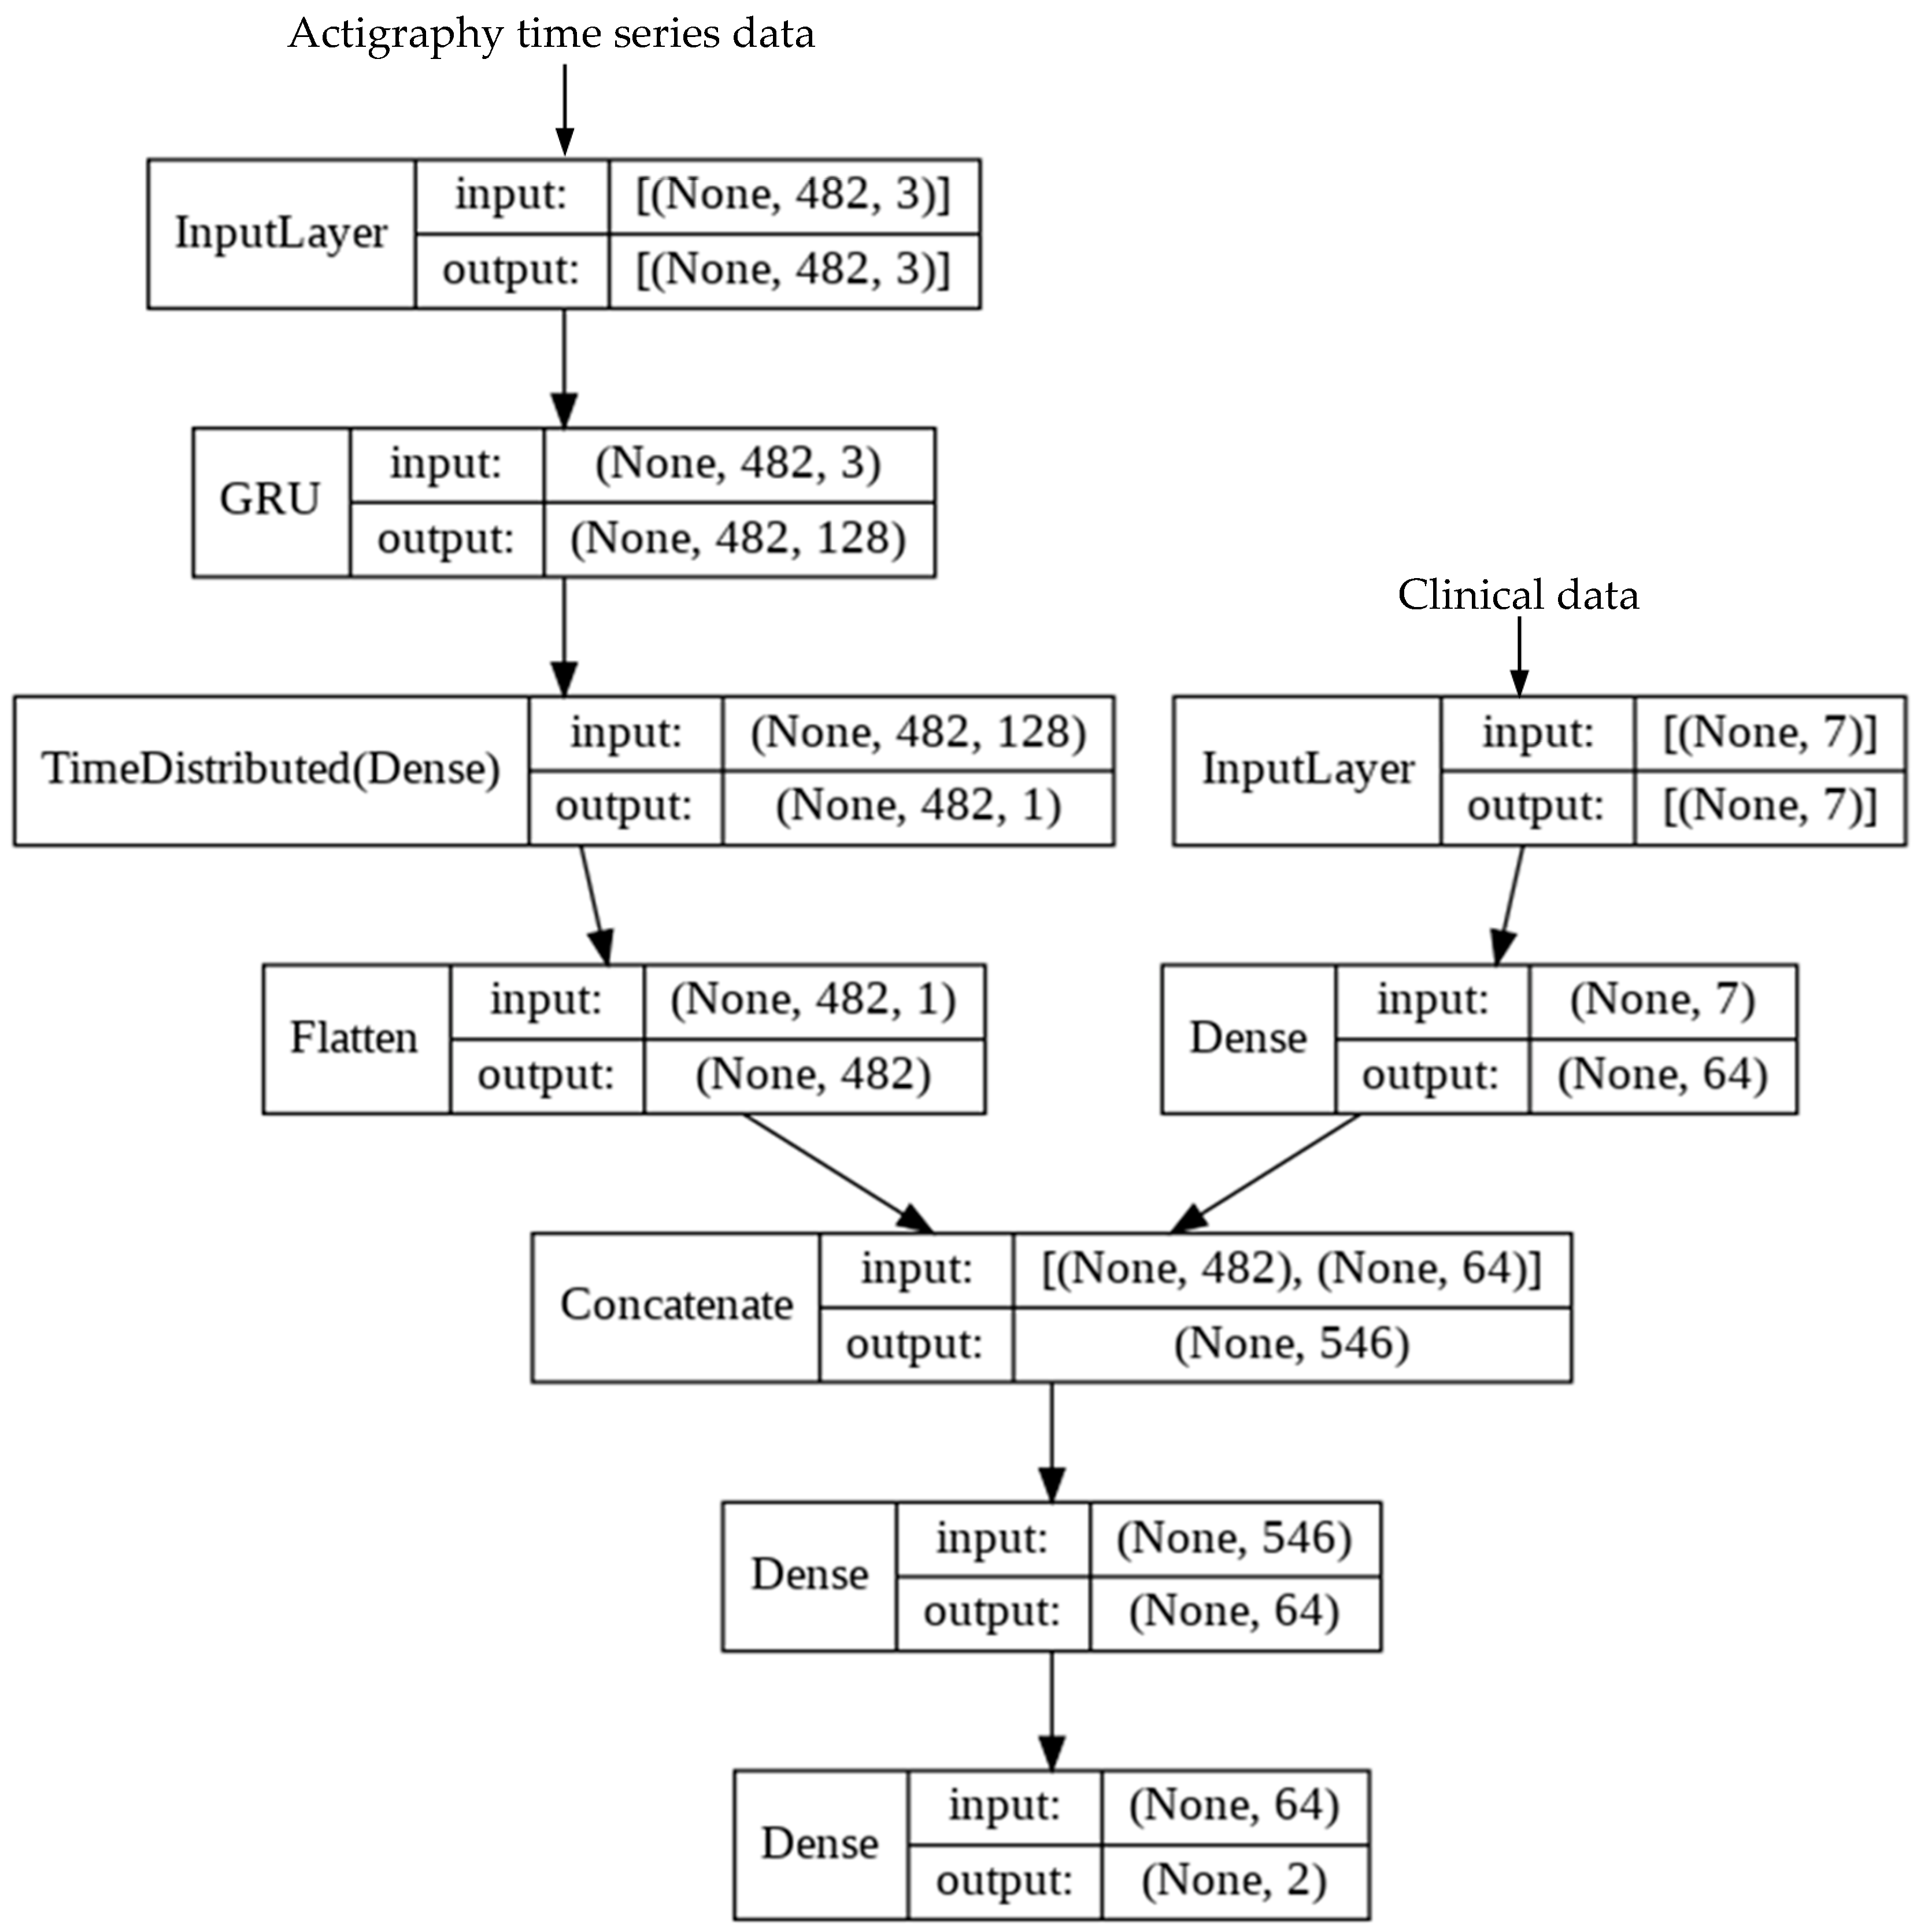
Appendix A.3. GRU


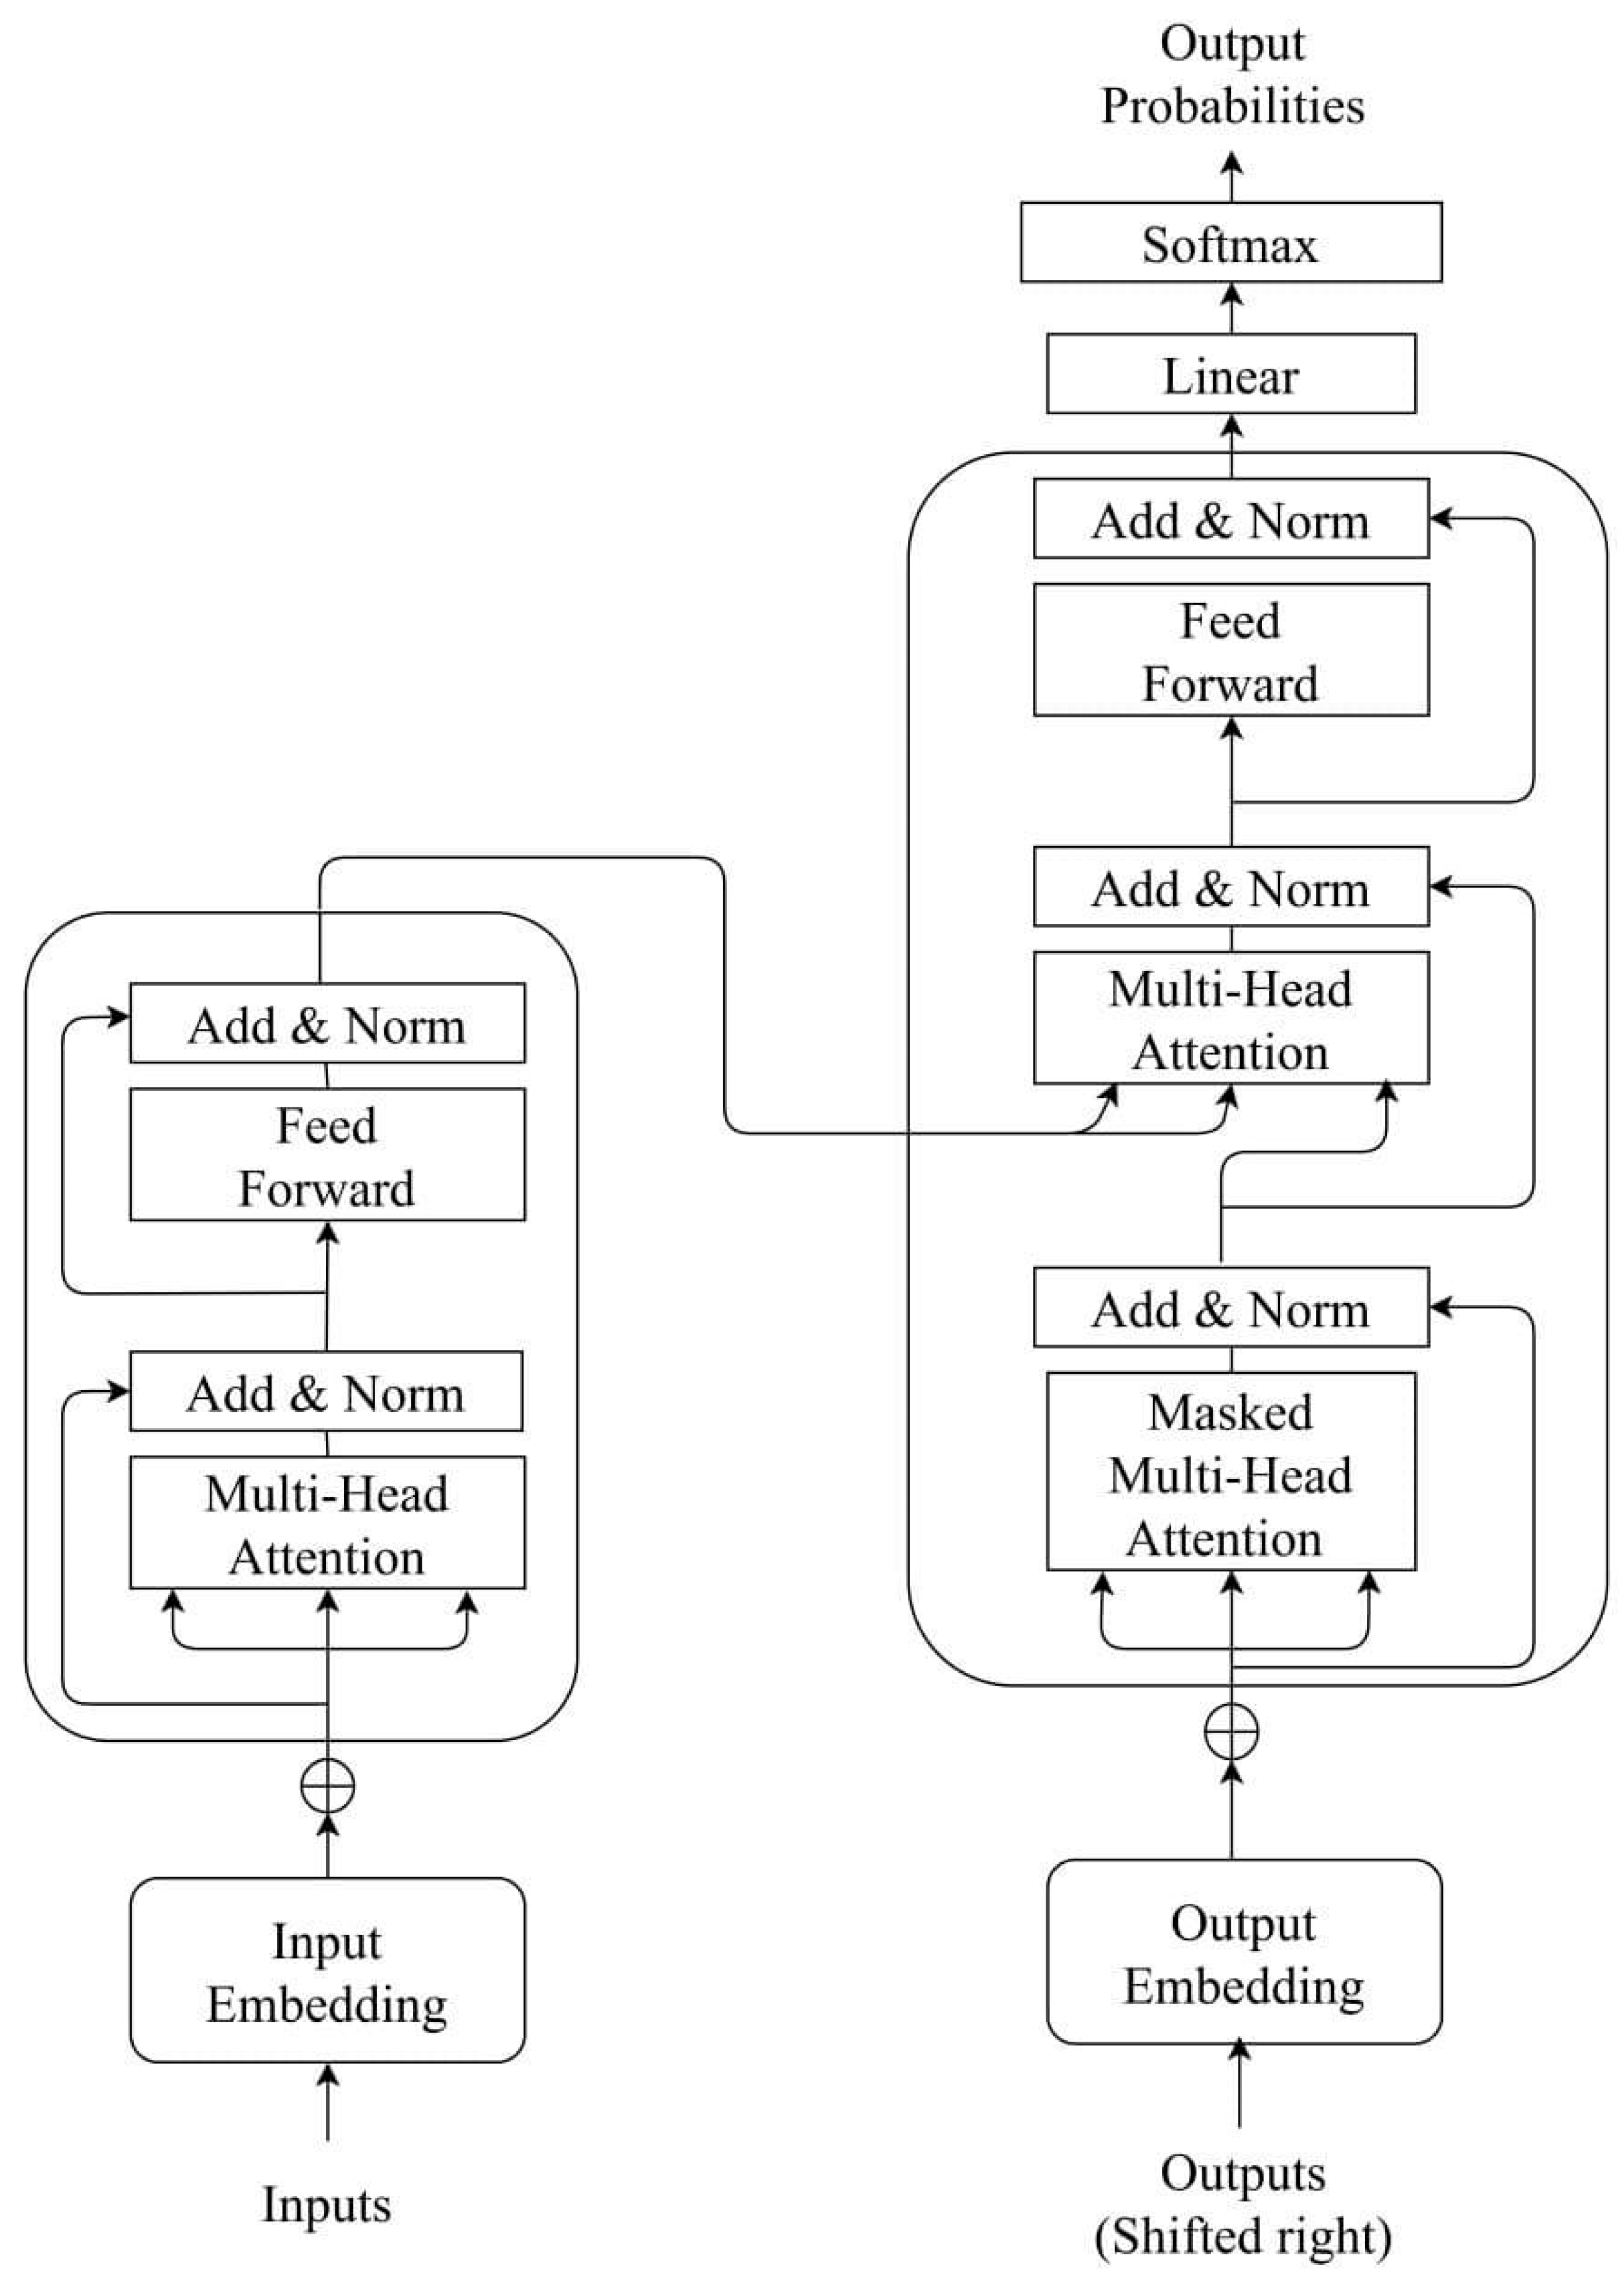
Appendix A.4. Transformer Model


- Results


References
- Sepúlveda, C.; Marlin, A.; Yoshida, T.; Ullrich, A. Palliative care: The World Health Organization’s global perspective. J. Pain Symptom Manag. 2002, 24, 91–96. [Google Scholar] [CrossRef]
- World Health Organization. Palliative Care. Available online: https://www.who.int/news-room/fact-sheets/detail/palliative-care (accessed on 6 February 2023).
- National Hospice and Palliative Care Organization. Hospice Facts & Figures. Available online: https://www.nhpco.org/hospice-facts-figures/ (accessed on 6 February 2023).
- Patel, S.D.; Davies, A.; Laing, E.; Wu, H.; Mendis, J.; Dijk, D.-J. Prognostication in Advanced Cancer by Combining Actigraphy-Derived Rest-Activity and Sleep Parameters with Routine Clinical Data: An Exploratory Machine Learning Study. Cancers 2023, 15, 503. [Google Scholar] [CrossRef]
- White, N.; Reid, F.; Harris, A.; Harries, P.; Stone, P. A systematic review of predictions of survival in palliative care: How accurate are clinicians and who are the experts? PLoS ONE 2016, 11, e0161407. [Google Scholar] [CrossRef]
- Butow, P.N.; Clayton, J.M.; Epstein, R.M. Prognostic awareness in adult oncology and palliative care. J. Clin. Oncol. 2020, 38, 877–884. [Google Scholar] [CrossRef]
- West, H.J.; Jin, J.O. Performance status in patients with cancer. JAMA Oncol. 2015, 1, 998. [Google Scholar] [CrossRef]
- Azam, F.; Latif, M.F.; Farooq, A.; Tirmazy, S.H.; AlShahrani, S.; Bashir, S.; Bukhari, N. Performance status assessment by using ECOG (Eastern Cooperative Oncology Group) score for cancer patients by oncology healthcare professionals. Case Rep. Oncol. 2019, 12, 728–736. [Google Scholar] [CrossRef]
- Cheng, S.; Qureshi, M.; Pullenayegum, E.; Haynes, A.; Chan, K.K. Do patients with reduced or excellent performance status derive the same clinical benefit from novel systemic cancer therapies? A systematic review and meta-analysis. ESMO Open 2017, 2, e000225. [Google Scholar] [CrossRef]
- Hansen, M.B.; Nylandsted, L.R.; Petersen, M.A.; Adsersen, M.; Rojas-Concha, L.; Groenvold, M. Patient-reported symptoms and problems at admission to specialized palliative care improved survival prediction in 30,969 cancer patients: A nationwide register-based study. Palliat. Med. 2020, 34, 795–805. [Google Scholar] [CrossRef]
- Hui, D.; Paiva, C.E.; Del Fabbro, E.G.; Steer, C.; Naberhuis, J.; van de Wetering, M.; Fernández-Ortega, P.; Morita, T.; Suh, S.-Y.; Bruera, E. Prognostication in advanced cancer: Update and directions for future research. Support. Care Cancer 2019, 27, 1973–1984. [Google Scholar] [CrossRef]
- Patil, R.; Pandit, P.; Palwe, V.; Kate, S.; Gandhe, S.; Patil, R.; Ramesh, Y.V.; Nagarkar, R. Evaluation of prognostic factors that affect survival outcomes of breast cancer patients with brain metastases: A single institutional experience. Eur. J. Breast Health 2021, 17, 62. [Google Scholar] [CrossRef]
- Zeng, Y.; Cao, W.; Wu, C.; Wang, M.; Xie, Y.; Chen, W.; Hu, X.; Zhou, Y.; Jing, X.; Cai, X. Survival Prediction in Home Hospice Care Patients with Lung Cancer Based on LASSO Algorithm. Cancer Control 2022, 29, 10732748221124519. [Google Scholar] [CrossRef]
- Jang, R.W.; Caraiscos, V.B.; Swami, N.; Banerjee, S.; Mak, E.; Kaya, E.; Rodin, G.; Bryson, J.; Ridley, J.Z.; Le, L.W. Simple prognostic model for patients with advanced cancer based on performance status. J. Oncol. Pract. 2014, 10, e335–e341. [Google Scholar] [CrossRef]
- Chuang, R.-B.; Hu, W.-Y.; Chiu, T.-Y.; Chen, C.-Y. Prediction of survival in terminal cancer patients in Taiwan: Constructing a prognostic scale. J. Pain Symptom Manag. 2004, 28, 115–122. [Google Scholar] [CrossRef]
- Allende-Pérez, S.; Rodríguez-Mayoral, O.; Peña-Nieves, A.; Bruera, E. Performance status and survival in cancer patients undergoing palliative care: Retrospective study. BMJ Support. Palliat. Care 2022. [Google Scholar] [CrossRef]
- Chow, R.; Chiu, N.; Bruera, E.; Krishnan, M.; Chiu, L.; Lam, H.; DeAngelis, C.; Pulenzas, N.; Vuong, S.; Chow, E. Inter-rater reliability in performance status assessment among health care professionals: A systematic review. Ann. Palliat. Med. 2016, 5, 83–92. [Google Scholar] [CrossRef]
- Chu, C.; White, N.; Stone, P. Prognostication in palliative care. Clin. Med. 2019, 19, 306. [Google Scholar] [CrossRef]
- Makar, M.; Ghassemi, M.; Cutler, D.M.; Obermeyer, Z. Short-term mortality prediction for elderly patients using medicare claims data. Int. J. Mach. Learn. Comput. 2015, 5, 192. [Google Scholar] [CrossRef]
- Lee, S.F.; Luk, H.; Wong, A.; Ng, C.K.; Wong, F.C.S.; Luque-Fernandez, M.A. Prediction model for short-term mortality after palliative radiotherapy for patients having advanced cancer: A cohort study from routine electronic medical data. Sci. Rep. 2020, 10, 5779. [Google Scholar] [CrossRef]
- Elfiky, A.A.; Pany, M.J.; Parikh, R.B.; Obermeyer, Z. Development and application of a machine learning approach to assess short-term mortality risk among patients with cancer starting chemotherapy. JAMA Netw. Open 2018, 1, e180926. [Google Scholar] [CrossRef]
- Bertsimas, D.; Dunn, J.; Pawlowski, C.; Silberholz, J.; Weinstein, A.; Zhuo, Y.D.; Chen, E.; Elfiky, A.A. Applied informatics decision support tool for mortality predictions in patients with cancer. JCO Clin. Cancer Inform. 2018, 2, 1–11. [Google Scholar] [CrossRef]
- Parikh, R.B.; Manz, C.; Chivers, C.; Regli, S.H.; Braun, J.; Draugelis, M.E.; Schuchter, L.M.; Shulman, L.N.; Navathe, A.S.; Patel, M.S. Machine learning approaches to predict 6-month mortality among patients with cancer. JAMA Netw. Open 2019, 2, e1915997. [Google Scholar] [CrossRef]
- Arkin, F.S.; Aras, G.; Dogu, E. Comparison of artificial neural networks and logistic regression for 30-days survival prediction of cancer patients. Acta Inform. Med. 2020, 28, 108. [Google Scholar] [CrossRef]
- Manz, C.R.; Chen, J.; Liu, M.; Chivers, C.; Regli, S.H.; Braun, J.; Draugelis, M.; Hanson, C.W.; Shulman, L.N.; Schuchter, L.M. Validation of a machine learning algorithm to predict 180-day mortality for outpatients with cancer. JAMA Oncol. 2020, 6, 1723–1730. [Google Scholar] [CrossRef]
- Ajay, P.; Huang, R. Wearable Sensor Data for Classification and Analysis of Functional Fitness Exercises Using Unsupervised Deep Learning Methodologies. Secur. Commun. Netw. 2022, 2022, 8706784. [Google Scholar] [CrossRef]
- Vijayan, V.; Connolly, J.P.; Condell, J.; McKelvey, N.; Gardiner, P. Review of Wearable Devices and Data Collection Considerations for Connected Health. Sensors 2021, 21, 5589. [Google Scholar] [CrossRef]
- Huang, Y.; Kabir, M.A.; Upadhyay, U.; Dhar, E.; Uddin, M.; Syed-Abdul, S. Exploring the Potential Use of Wearable Devices as a Prognostic Tool among Patients in Hospice Care. Medicina 2022, 58, 1824. [Google Scholar] [CrossRef]
- Yang, T.Y.; Kuo, P.-Y.; Huang, Y.; Lin, H.-W.; Malwade, S.; Lu, L.-S.; Tsai, L.-W.; Syed-Abdul, S.; Sun, C.-W.; Chiou, J.-F. Deep-Learning Approach to Predict Survival Outcomes Using Wearable Actigraphy Device Among End-Stage Cancer Patients. Front. Public Health 2021, 9, 730150. [Google Scholar] [CrossRef]
- Sabry, F.; Eltaras, T.; Labda, W.; Alzoubi, K.; Malluhi, Q. Machine Learning for Healthcare Wearable Devices: The Big Picture. J. Healthc. Eng. 2022, 2022, 4653923. [Google Scholar] [CrossRef]
- Junaid, S.B.; Imam, A.A.; Abdulkarim, M.; Surakat, Y.A.; Balogun, A.O.; Kumar, G.; Shuaibu, A.N.; Garba, A.; Sahalu, Y.; Mohammed, A.; et al. Recent Advances in Artificial Intelligence and Wearable Sensors in Healthcare Delivery. Appl. Sci. 2022, 12, 10271. [Google Scholar] [CrossRef]
- Wilmink, G.; Dupey, K.; Alkire, S.; Grote, J.; Zobel, G.; Fillit, H.M.; Movva, S. Artificial Intelligence-Powered Digital Health Platform and Wearable Devices Improve Outcomes for Older Adults in Assisted Living Communities: Pilot Intervention Study. JMIR Aging 2020, 3, e19554. [Google Scholar] [CrossRef]
- Wang, H.; Pujos-Guillot, E.; Comte, B.; de Miranda, J.L.; Spiwok, V.; Chorbev, I.; Castiglione, F.; Tieri, P.; Watterson, S.; McAllister, R.; et al. Deep learning in systems medicine. Brief. Bioinform. 2020, 22, 1543–1559. [Google Scholar] [CrossRef]
- Tedesco, S.; Andrulli, M.; Larsson, M.Å.; Kelly, D.; Timmons, S.; Alamäki, A.; Barton, J.; Condell, J.; O’Flynn, B.; Nordström, A. Investigation of the analysis of wearable data for cancer-specific mortality prediction in older adults. In Proceedings of the 2021 43rd Annual International Conference of the IEEE Engineering in Medicine & Biology Society (EMBC), Guadalajara, Mexico, 1–5 November 2021; pp. 1848–1851. [Google Scholar]
- Burnham, J.P.; Lu, C.; Yaeger, L.H.; Bailey, T.C.; Kollef, M.H. Using wearable technology to predict health outcomes: A literature review. J. Am. Med. Inform. Assoc. 2018, 25, 1221–1227. [Google Scholar] [CrossRef]
- Castelli Gattinara Di Zubiena, F.; Menna, G.; Mileti, I.; Zampogna, A.; Asci, F.; Paoloni, M.; Suppa, A.; Del Prete, Z.; Palermo, E. Machine Learning and Wearable Sensors for the Early Detection of Balance Disorders in Parkinson’s Disease. Sensors 2022, 22, 9903. [Google Scholar] [CrossRef]
- Kuo, T.B.; Li, J.-Y.; Chen, C.-Y.; Lin, Y.-C.; Tsai, M.-W.; Lin, S.-P.; Yang, C.C. Influence of accelerometer placement and/or heart rate on energy expenditure prediction during uphill exercise. J. Mot. Behav. 2018, 50, 127–133. [Google Scholar] [CrossRef]
- Vaswani, A.; Shazeer, N.; Parmar, N.; Uszkoreit, J.; Jones, L.; Gomez, A.N.; Kaiser, Ł.; Polosukhin, I. Attention is all you need. arXiv 2017. [Google Scholar] [CrossRef]
- Hochreiter, S.; Schmidhuber, J. Long Short-Term Memory. Neural Comput. 1997, 9, 1735–1780. [Google Scholar] [CrossRef]
- Graves, A.; Schmidhuber, J. Framewise phoneme classification with bidirectional LSTM and other neural network architectures. Neural Netw. 2005, 18, 602–610. [Google Scholar] [CrossRef]
- Gao, Y.; Glowacka, D. Deep Gate Recurrent Neural Network. In Proceedings of the 8th Asian Conference on Machine Learning, Hamilton, New Zealand, 16–18 November 2016; pp. 350–365. [Google Scholar]
- Fallon, M.; Giusti, R.; Aielli, F.; Hoskin, P.; Rolke, R.; Sharma, M.; Ripamonti, C. Management of cancer pain in adult patients: ESMO Clinical Practice Guidelines. Ann. Oncol. 2018, 29, iv166–iv191. [Google Scholar] [CrossRef]
- Swarm, R.A.; Paice, J.A.; Anghelescu, D.L.; Are, M.; Bruce, J.Y.; Buga, S.; Chwistek, M.; Cleeland, C.; Craig, D.; Gafford, E. Adult cancer pain, version 3.2019, NCCN clinical practice guidelines in oncology. J. Natl. Compr. Cancer Netw. 2019, 17, 977–1007. [Google Scholar] [CrossRef]
- Huang, Y.; Upadhyay, U.; Dhar, E.; Kuo, L.-J.; Syed-Abdul, S. A Scoping Review to Assess Adherence to and Clinical Outcomes of Wearable Devices in the Cancer Population. Cancers 2022, 14, 4437. [Google Scholar] [CrossRef]
- She, Y.; Jin, Z.; Wu, J.; Deng, J.; Zhang, L.; Su, H.; Jiang, G.; Liu, H.; Xie, D.; Cao, N. Development and validation of a deep learning model for non–small cell lung cancer survival. JAMA Netw. Open 2020, 3, e205842. [Google Scholar] [CrossRef]
- Dai, X.; Park, J.H.; Yoo, S.; D’Imperio, N.; McMahon, B.H.; Rentsch, C.T.; Tate, J.P.; Justice, A.C. Survival analysis of localized prostate cancer with deep learning. Sci. Rep. 2022, 12, 17821. [Google Scholar] [CrossRef]
- Yang, L.; Fan, X.; Qin, W.; Xu, Y.; Zou, B.; Fan, B.; Wang, S.; Dong, T.; Wang, L. A novel deep learning prognostic system improves survival predictions for stage III non-small cell lung cancer. Cancer Med. 2022, 11, 4246–4255. [Google Scholar] [CrossRef]
- Vu, E.; Steinmann, N.; Schröder, C.; Förster, R.; Aebersold, D.M.; Eychmüller, S.; Cihoric, N.; Hertler, C.; Windisch, P.; Zwahlen, D.R. Applications of Machine Learning in Palliative Care: A Systematic Review. Cancers 2023, 15, 1596. [Google Scholar] [CrossRef]
- Chung, J.; Gulcehre, C.; Cho, K.; Bengio, Y. Gated Feedback Recurrent Neural Networks. In Proceedings of the 32nd International Conference on Machine Learning, Lille, France, 6–11 July 2015; pp. 2067–2075. [Google Scholar]
- Chandra, N.; Ahuja, L.; Khatri, S.K.; Monga, H. Utilizing Gated Recurrent Units to Retain Long Term Dependencies with Recurrent Neural Network in Text Classification. J. Inf. Syst. Telecommun. 2021, 2, 89. [Google Scholar]


| Total recruited patients, n = | 78 | |
| Patients analyzed, n = | 66 | |
| Age (years); mean (range) | 71.42 (39–92) | |
| Gender, n = (%) | ||
| Male | 39 (59.09%) | |
| Female | 27 (40.90%) | |
| Primary site of cancer, n = | ||
| Bladder cancer | 1 | |
| Brain cancer | 2 | |
| Breast cancer | 3 | |
| Cervical cancer | 2 | |
| Cholangiocarcinoma | 1 | |
| Colorectal cancer | 15 | |
| Duodenal cancer | 1 | |
| Endometrial cancer | 1 | |
| Esophageal cancer | 3 | |
| Gastric cancer | 5 | |
| Hepatocellular carcinoma | 2 | |
| Head and neck cancer | 3 | |
| Lung cancer (non-small-cell) | 13 | |
| Small-cell lung cancer | 1 | |
| Ovarian cancer | 2 | |
| Pancreatic cancer | 2 | |
| Prostate cancer | 8 | |
| Vaginal cancer | 1 | |
| Admission cause; n = (%) | ||
| Concomitant diseases | 26 (39.39%) | |
| Cancer-related symptoms | 40 (60.60%) | |
| Duration (days); mean (range) | 11.59 (0–41) | |
| Outcome, n = (%) | ||
| Discharge | 35 (53.03%) | |
| Death | 31 (46.96%) | |
| KPS score, n = | ||
| Positive (KPS ≥ 50%) | TP (29) | FN (5) |
| Negative (KPS < 50%) | FP (6) | TN (26) |
| PPI score, n = | ||
| Positive (PPI ≤ 6) | TP (22) | FN (10) |
| Negative (PPI > 6) | TP (3) | FN (21) |
| Use of sedatives (time of study days), n = | ||
| <30% | 36 | |
| 30–70% | 8 | |
| >70% | 22 | |
| Status of using opioids, n = | ||
| Decreasing use | 2 | |
| Stable | 24 | |
| Increasing use | 40 | |
| Use of antipyretics (time of study days), n = | ||
| <30% | 51 | |
| 30–70% | 12 | |
| >70% | 3 | |
| Model | Dataset | Accuracy | Sensitivity | Specificity | PPV | NPV | AUC |
|---|---|---|---|---|---|---|---|
| LSTM | Wearable only | 0.878 | 0.885 | 0.87 | 0.885 | 0.870 | 0.920 |
| Wearable + clinical | 0.909 | 0.885 | 0.935 | 0.939 | 0.878 | 0.947 | |
| Transformer | Wearable only | 0.893 | 0.914 | 0.87 | 0.888 | 0.9 | 0.919 |
| Wearable + clinical | 0.924 | 0.914 | 0.935 | 0.941 | 0.906 | 0.927 | |
| BiLSTM | Wearable only | 0.636 | 0.828 | 0.419 | 0.617 | 0.684 | 0.795 |
| Wearable + clinical | 0.666 | 0.857 | 0.451 | 0.638 | 0.736 | 0.791 | |
| GRU | Wearable only | 0.893 | 0.885 | 0.903 | 0.911 | 0.875 | 0.877 |
| Wearable + clinical | 0.909 | 0.914 | 0.903 | 0.914 | 0.903 | 0.940 |
| Transformer Model | Accuracy | Sensitivity | Specificity | PPV | NPV | AUC | |
|---|---|---|---|---|---|---|---|
| 12 h | Wearable only | 0.848 | 0.881 | 0.806 | 0.837 | 0.862 | 0.884 |
| Clinical + wearable | 0.878 | 0.914 | 0.838 | 0.864 | 0.896 | 0.934 | |
| 24 h | Wearable only | 0.893 | 0.857 | 0.935 | 0.937 | 0.852 | 0.929 |
| Clinical + wearable | 0.924 | 0.971 | 0.870 | 0.894 | 0.964 | 0.956 | |
| Prognostic Tool | Accuracy | Sensitivity | Specificity | PPV | NPV | AUC | |
|---|---|---|---|---|---|---|---|
| KPS | 0.8333 | 0.853 | 0.813 | 0.829 | 0.839 | 0.9 | |
| PPI | 0.6515 | 0.688 | 0.875 | 0.880 | 0.677 | 0.87 | |
| Transformer model | Wearable only | 0.893 | 0.914 | 0.87 | 0.888 | 0.9 | 0.919 |
| Wearable + clinical | 0.924 | 0.914 | 0.935 | 0.941 | 0.906 | 0.927 | |
Disclaimer/Publisher’s Note: The statements, opinions and data contained in all publications are solely those of the individual author(s) and contributor(s) and not of MDPI and/or the editor(s). MDPI and/or the editor(s) disclaim responsibility for any injury to people or property resulting from any ideas, methods, instructions or products referred to in the content. |
© 2023 by the authors. Licensee MDPI, Basel, Switzerland. This article is an open access article distributed under the terms and conditions of the Creative Commons Attribution (CC BY) license (https://creativecommons.org/licenses/by/4.0/).
Share and Cite
Huang, Y.; Roy, N.; Dhar, E.; Upadhyay, U.; Kabir, M.A.; Uddin, M.; Tseng, C.-L.; Syed-Abdul, S. Deep Learning Prediction Model for Patient Survival Outcomes in Palliative Care Using Actigraphy Data and Clinical Information. Cancers 2023, 15, 2232. https://doi.org/10.3390/cancers15082232
Huang Y, Roy N, Dhar E, Upadhyay U, Kabir MA, Uddin M, Tseng C-L, Syed-Abdul S. Deep Learning Prediction Model for Patient Survival Outcomes in Palliative Care Using Actigraphy Data and Clinical Information. Cancers. 2023; 15(8):2232. https://doi.org/10.3390/cancers15082232
Chicago/Turabian StyleHuang, Yaoru, Nidita Roy, Eshita Dhar, Umashankar Upadhyay, Muhammad Ashad Kabir, Mohy Uddin, Ching-Li Tseng, and Shabbir Syed-Abdul. 2023. "Deep Learning Prediction Model for Patient Survival Outcomes in Palliative Care Using Actigraphy Data and Clinical Information" Cancers 15, no. 8: 2232. https://doi.org/10.3390/cancers15082232
APA StyleHuang, Y., Roy, N., Dhar, E., Upadhyay, U., Kabir, M. A., Uddin, M., Tseng, C.-L., & Syed-Abdul, S. (2023). Deep Learning Prediction Model for Patient Survival Outcomes in Palliative Care Using Actigraphy Data and Clinical Information. Cancers, 15(8), 2232. https://doi.org/10.3390/cancers15082232