
Dexamethasone Selectively Inhibits Detachment of Metastatic Thyroid Cancer Cells during Random Positioning


 , ,
, ,  and
and 
Simple Summary
Abstract
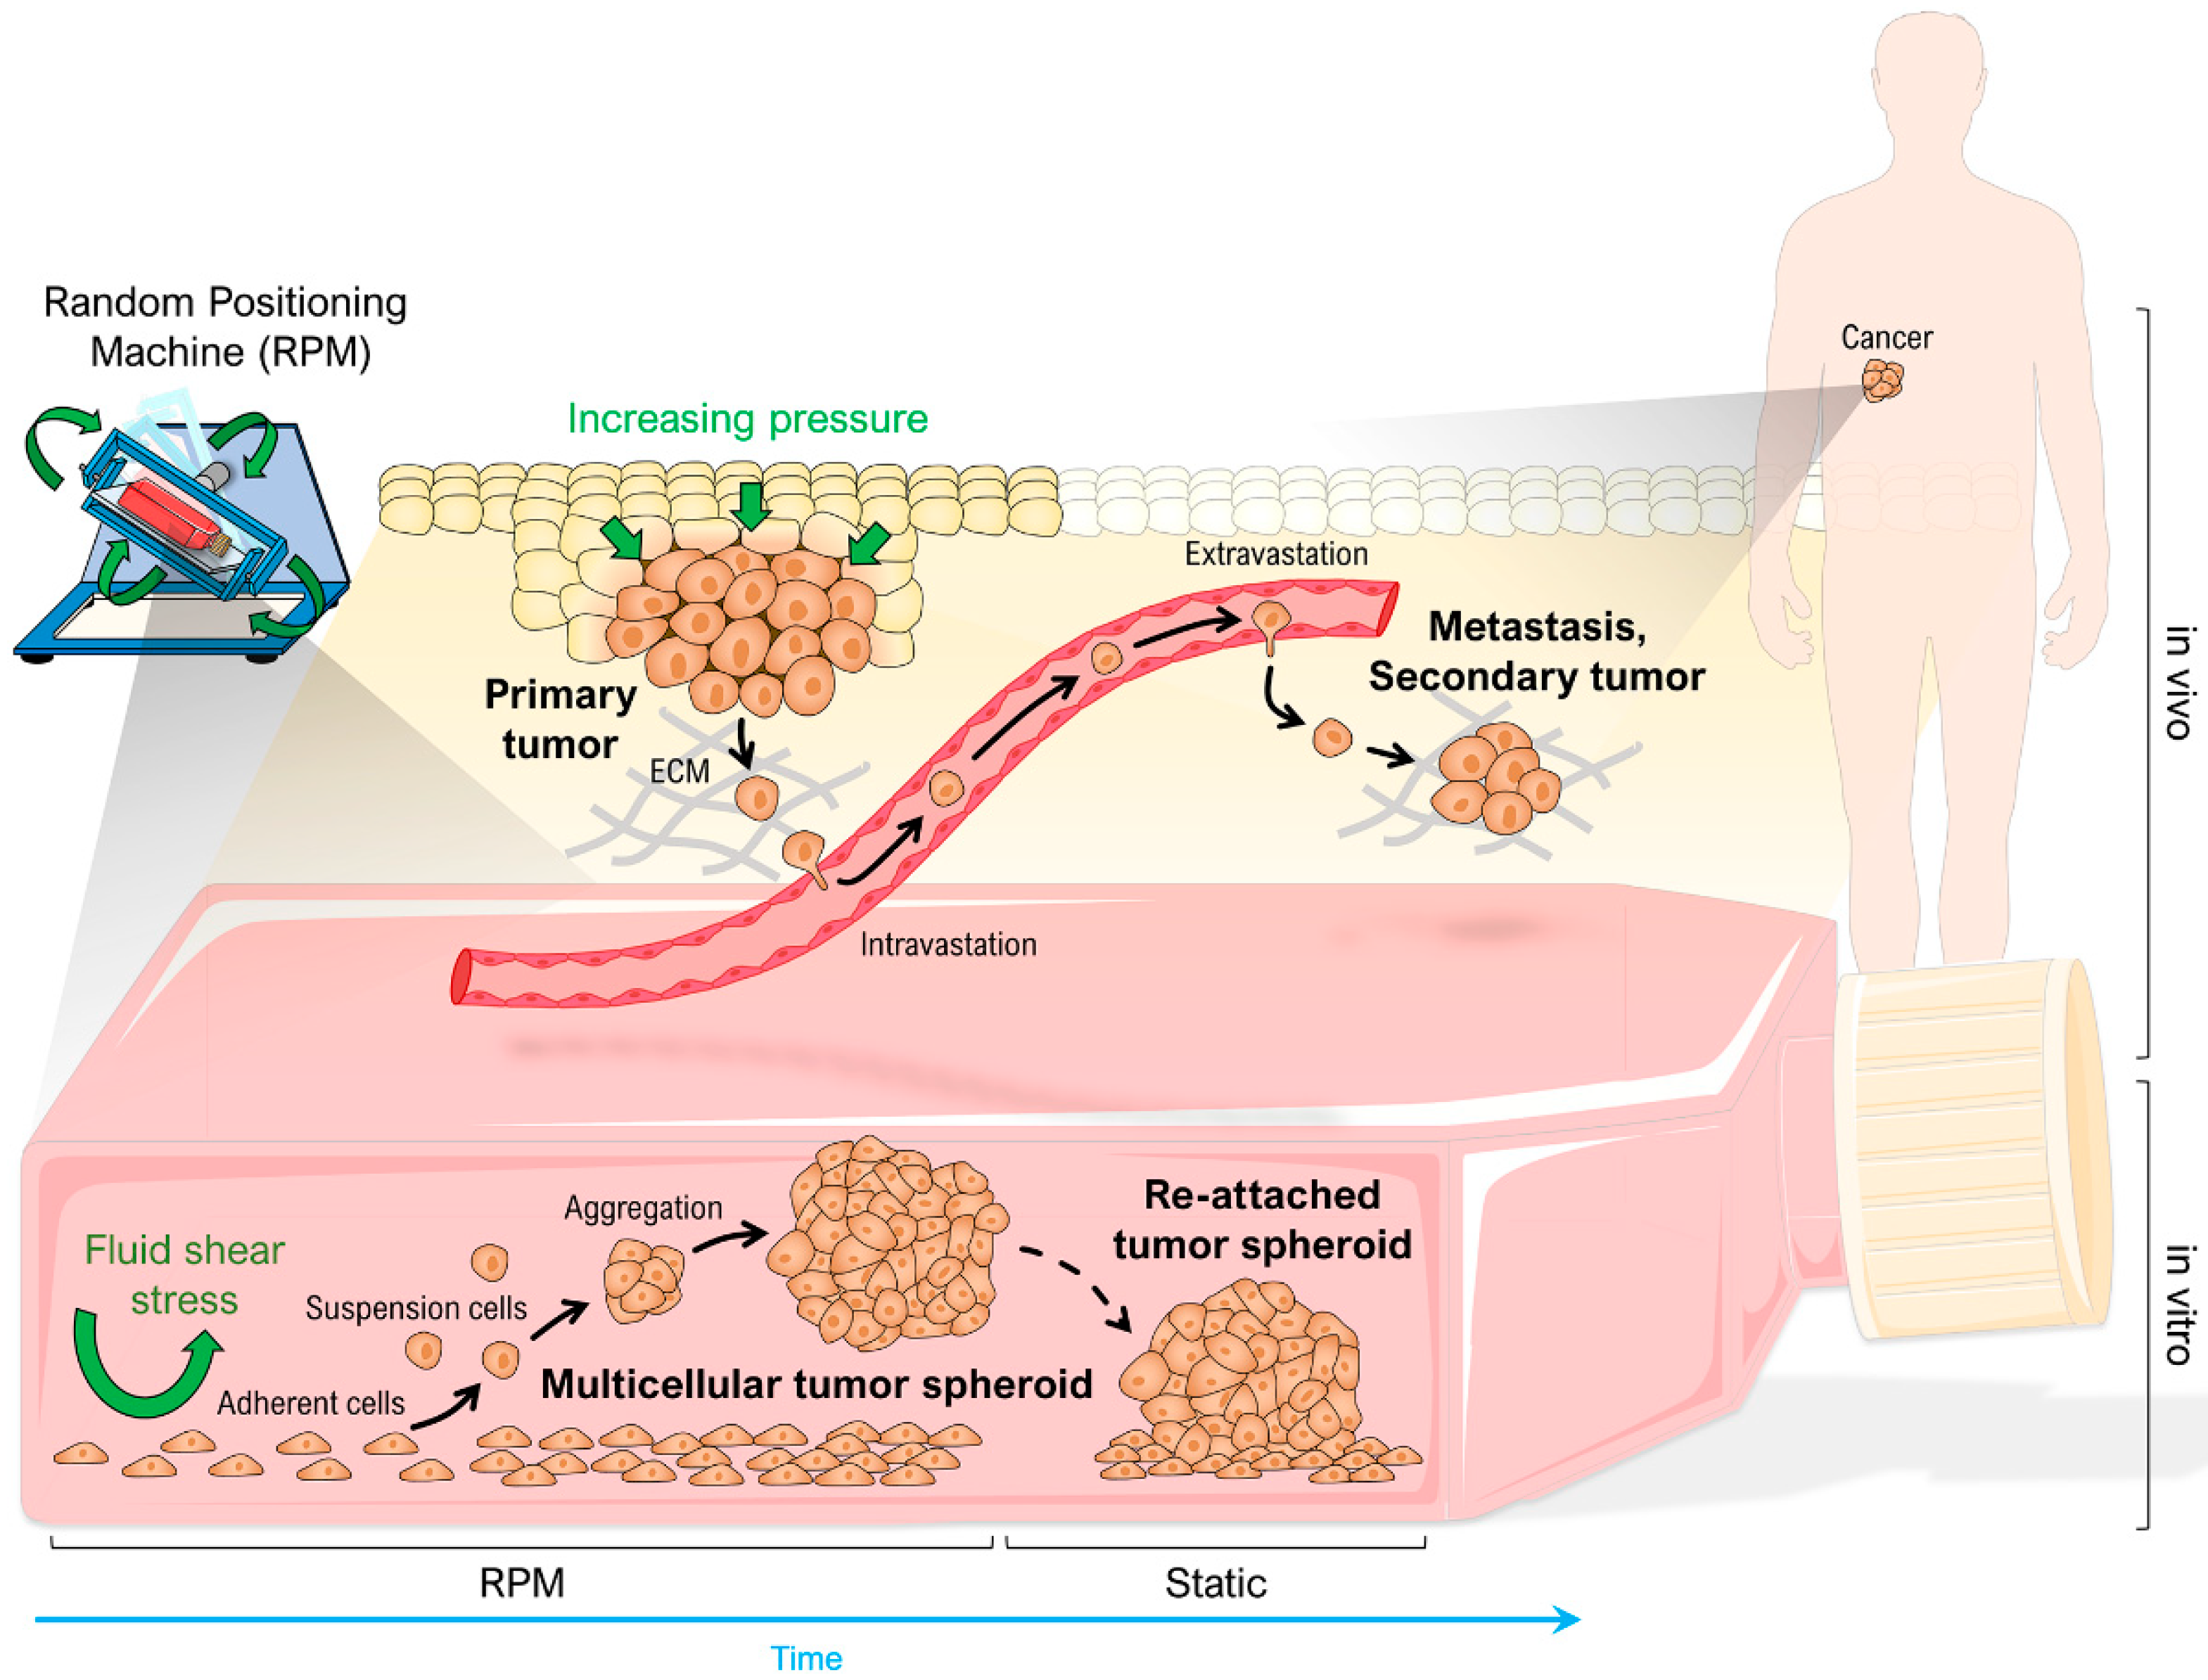
1. Introduction
2. Materials and Methods
2.1. Cell Lines and Cell Culture
2.2. Dexamethasone and Drug Treatment
2.3. Random Positioning
2.4. Static Forced Floating Spheroid Formation
2.5. Trypsin Digestion Adhesion Assay
2.6. Phase Contrast Microscopy
2.7. Immunofluorescence Microscopy
2.8. mRNA Isolation and Quantitative Real-Time PCR
2.9. Protein Isolation and Western Blot Analysis
2.10. Cell Culture Supernatant Analyses
2.11. Spheroid Measurement and Quantification
2.12. Statistics
3. Results
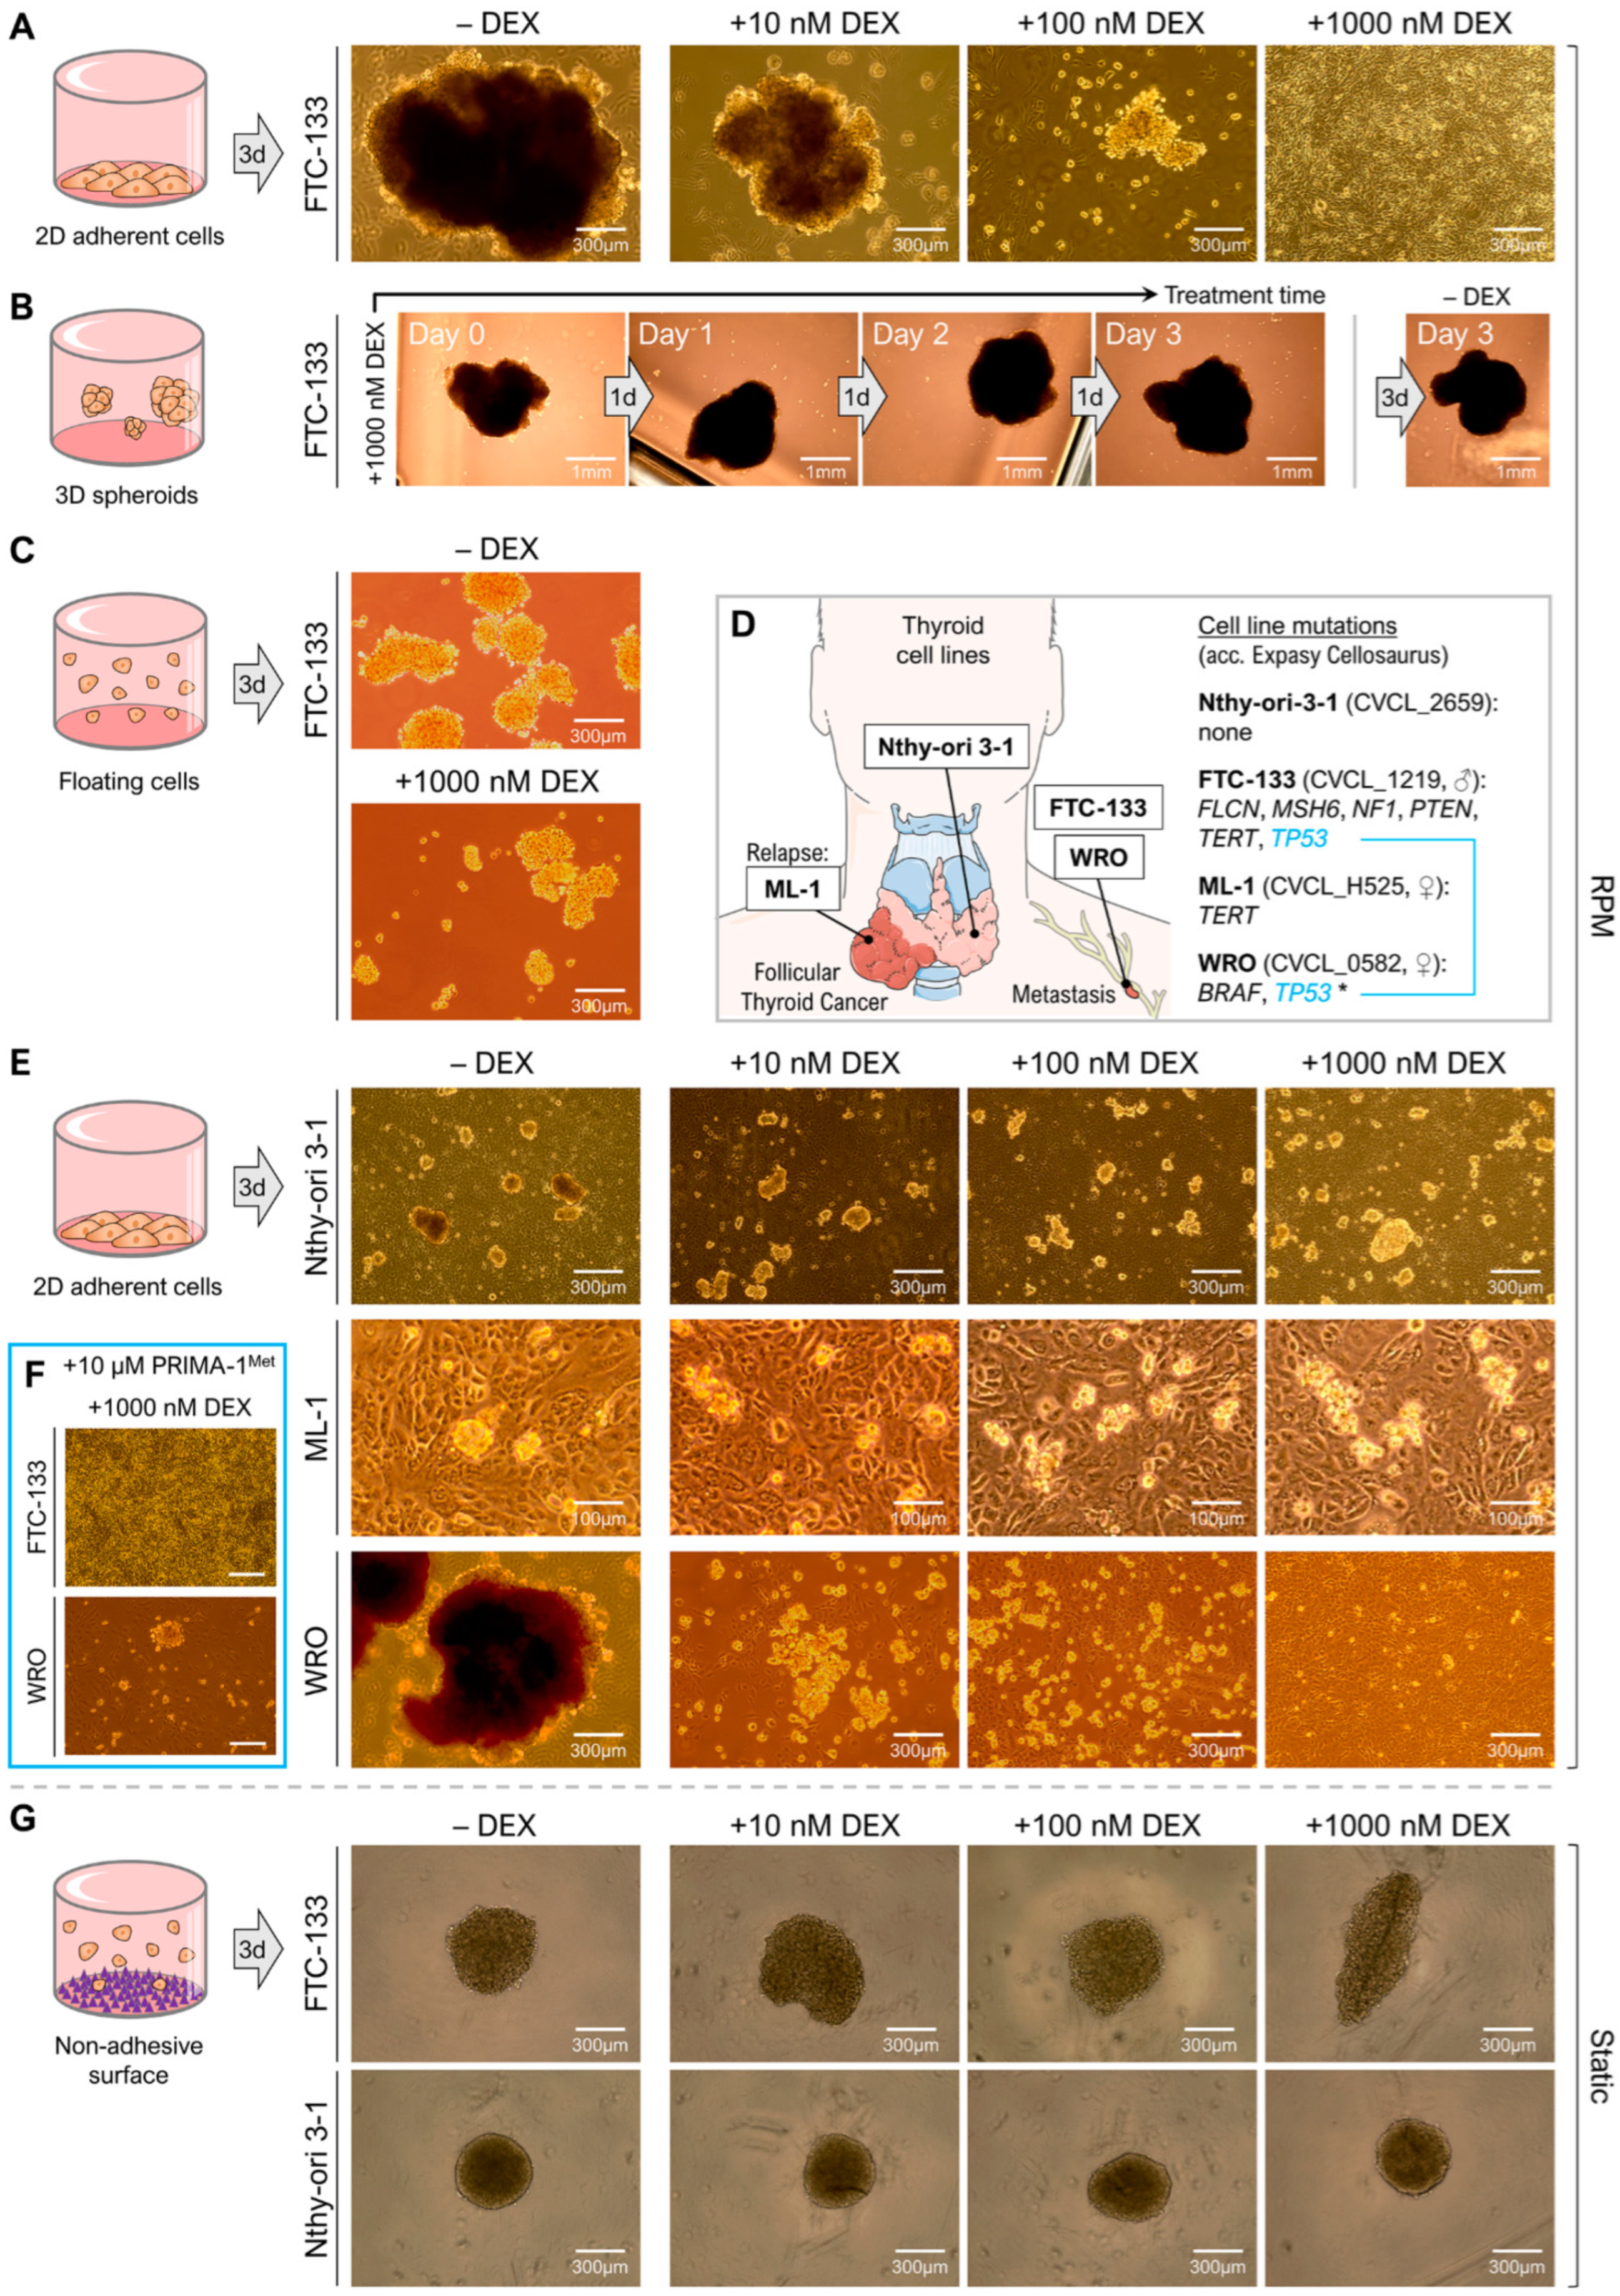
3.1. Dexamethasone Inhibits Formation but Not Stability of Multicellular Tumor Spheroids
3.2. Dexamethasone Selectively Affects Spheroid Formation of Metastatic Thyroid Cancer Cells
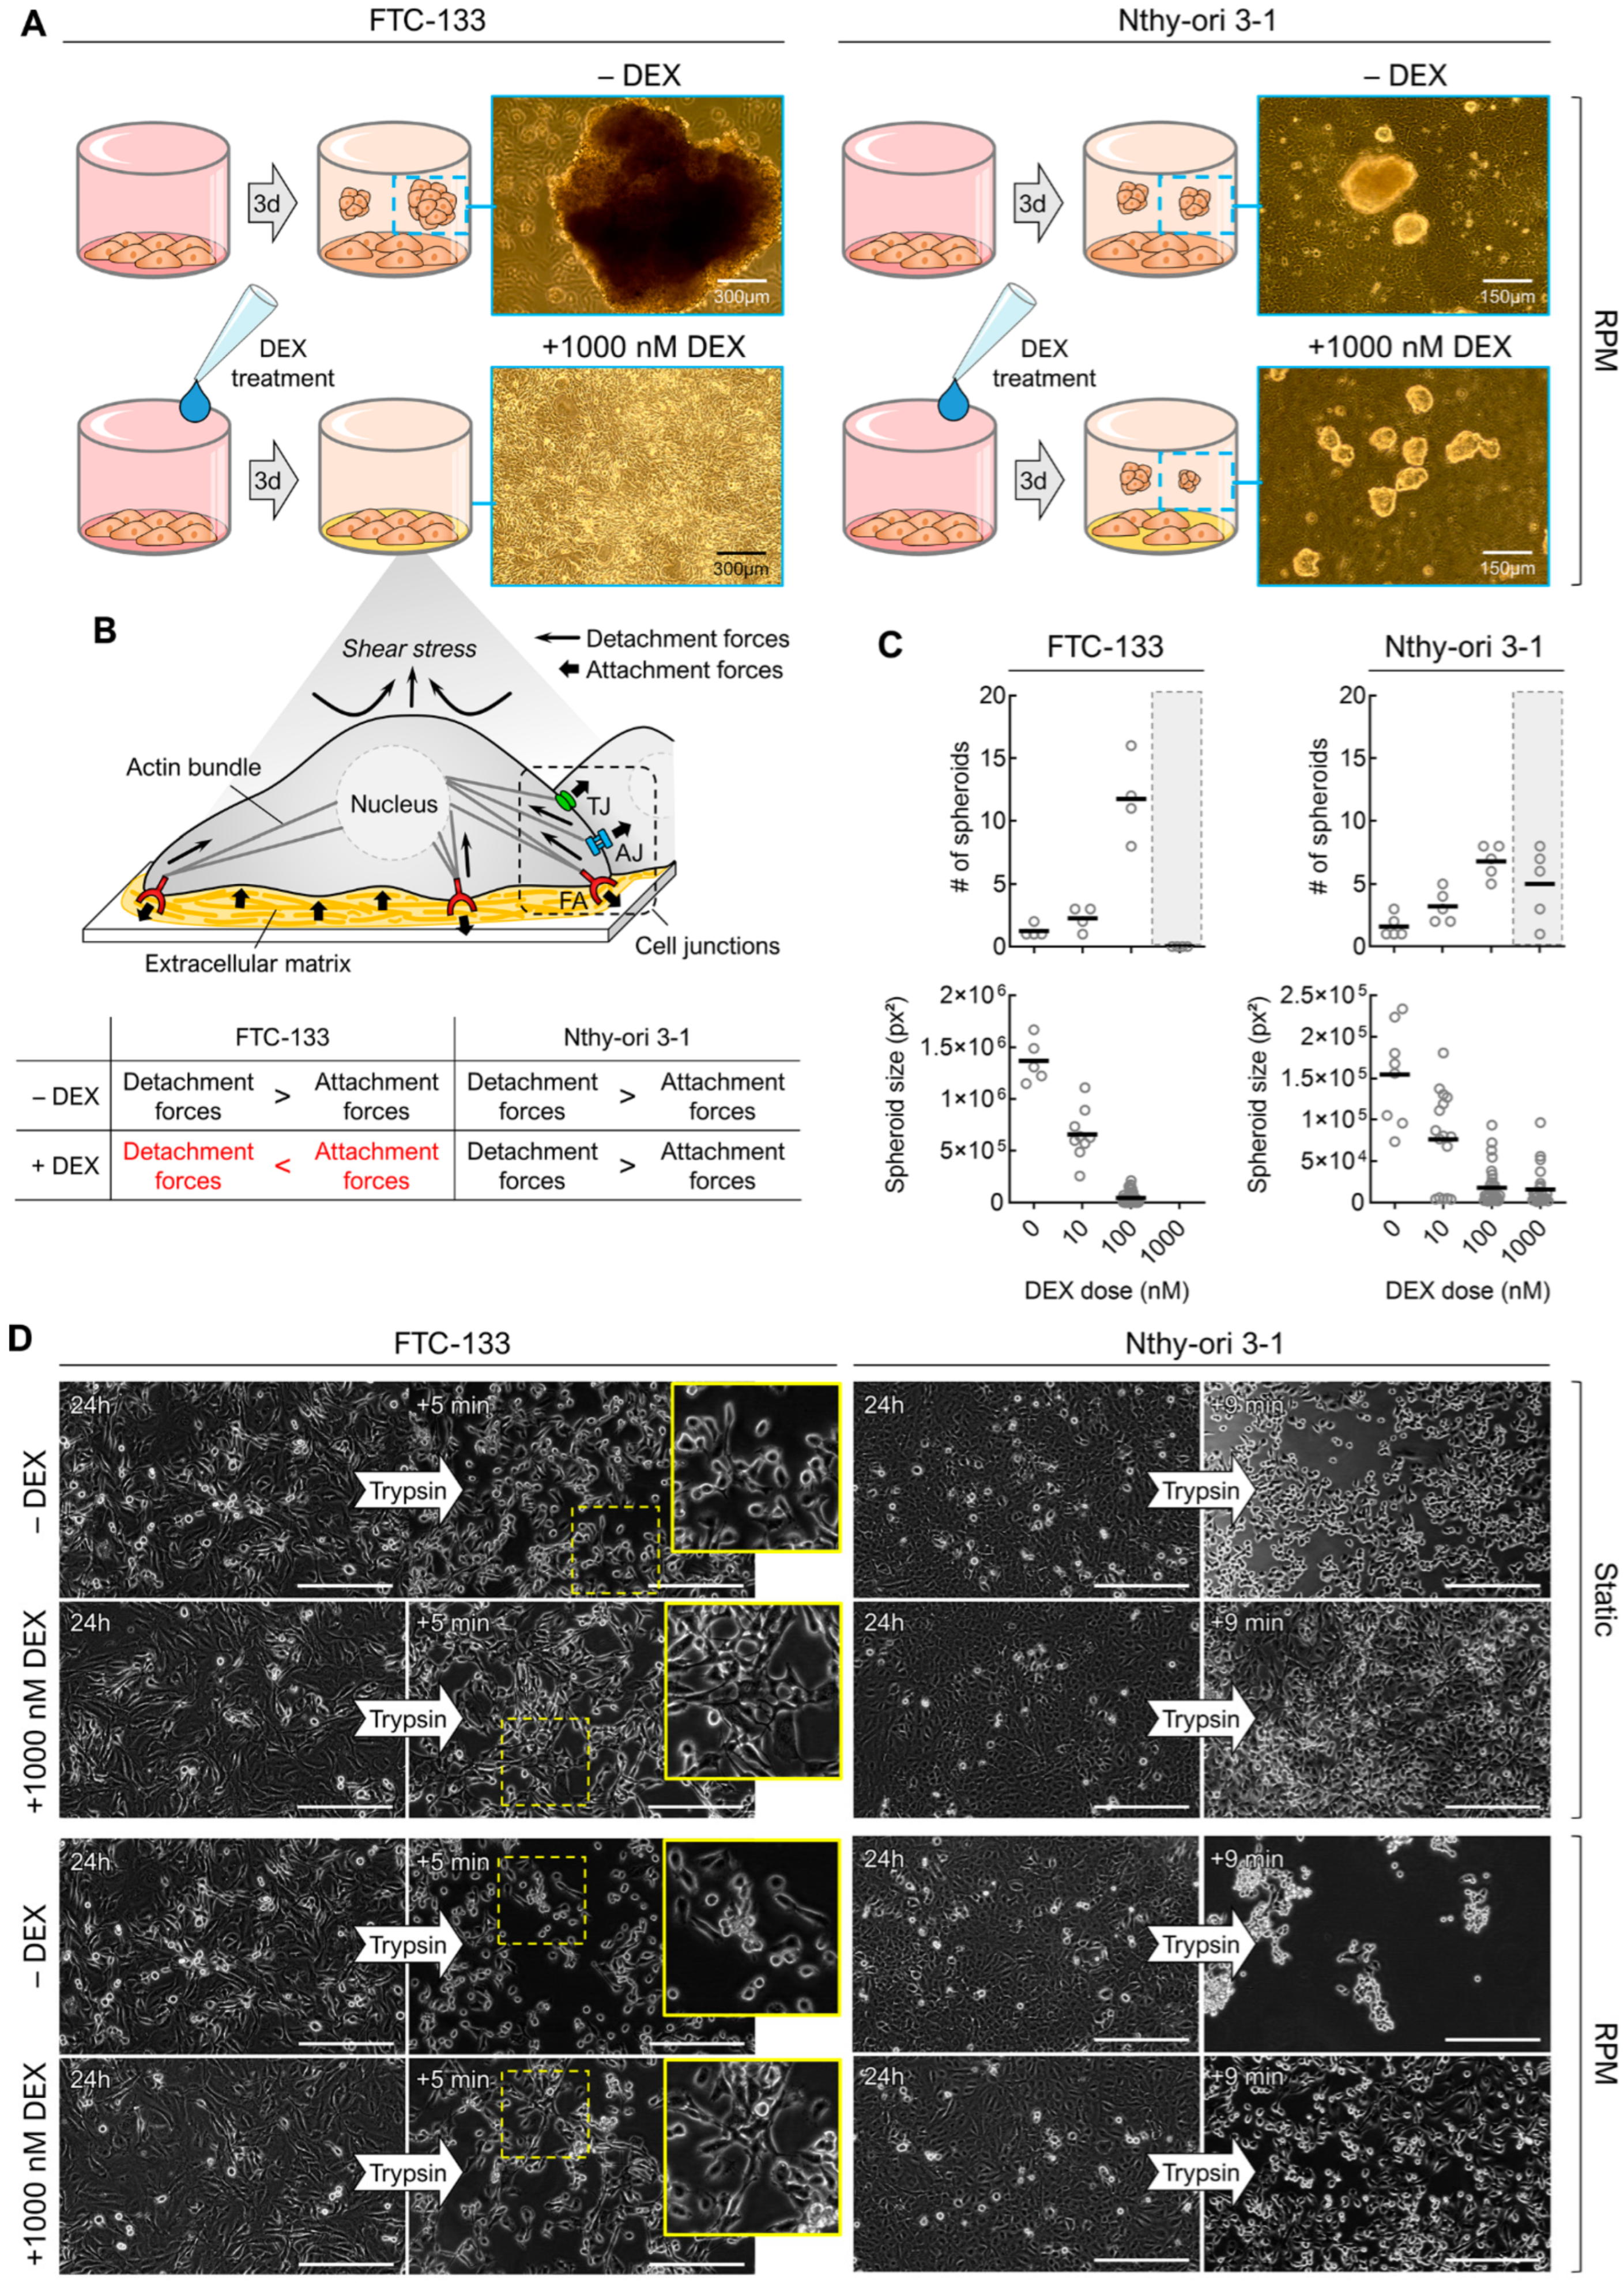
3.3. Dexamethasone Supresses RPM-Induced Cell Detachment but Not 3D Growth in General
3.4. Dexamethasone Treatment Alters ‘Stickiness’ of the Cells
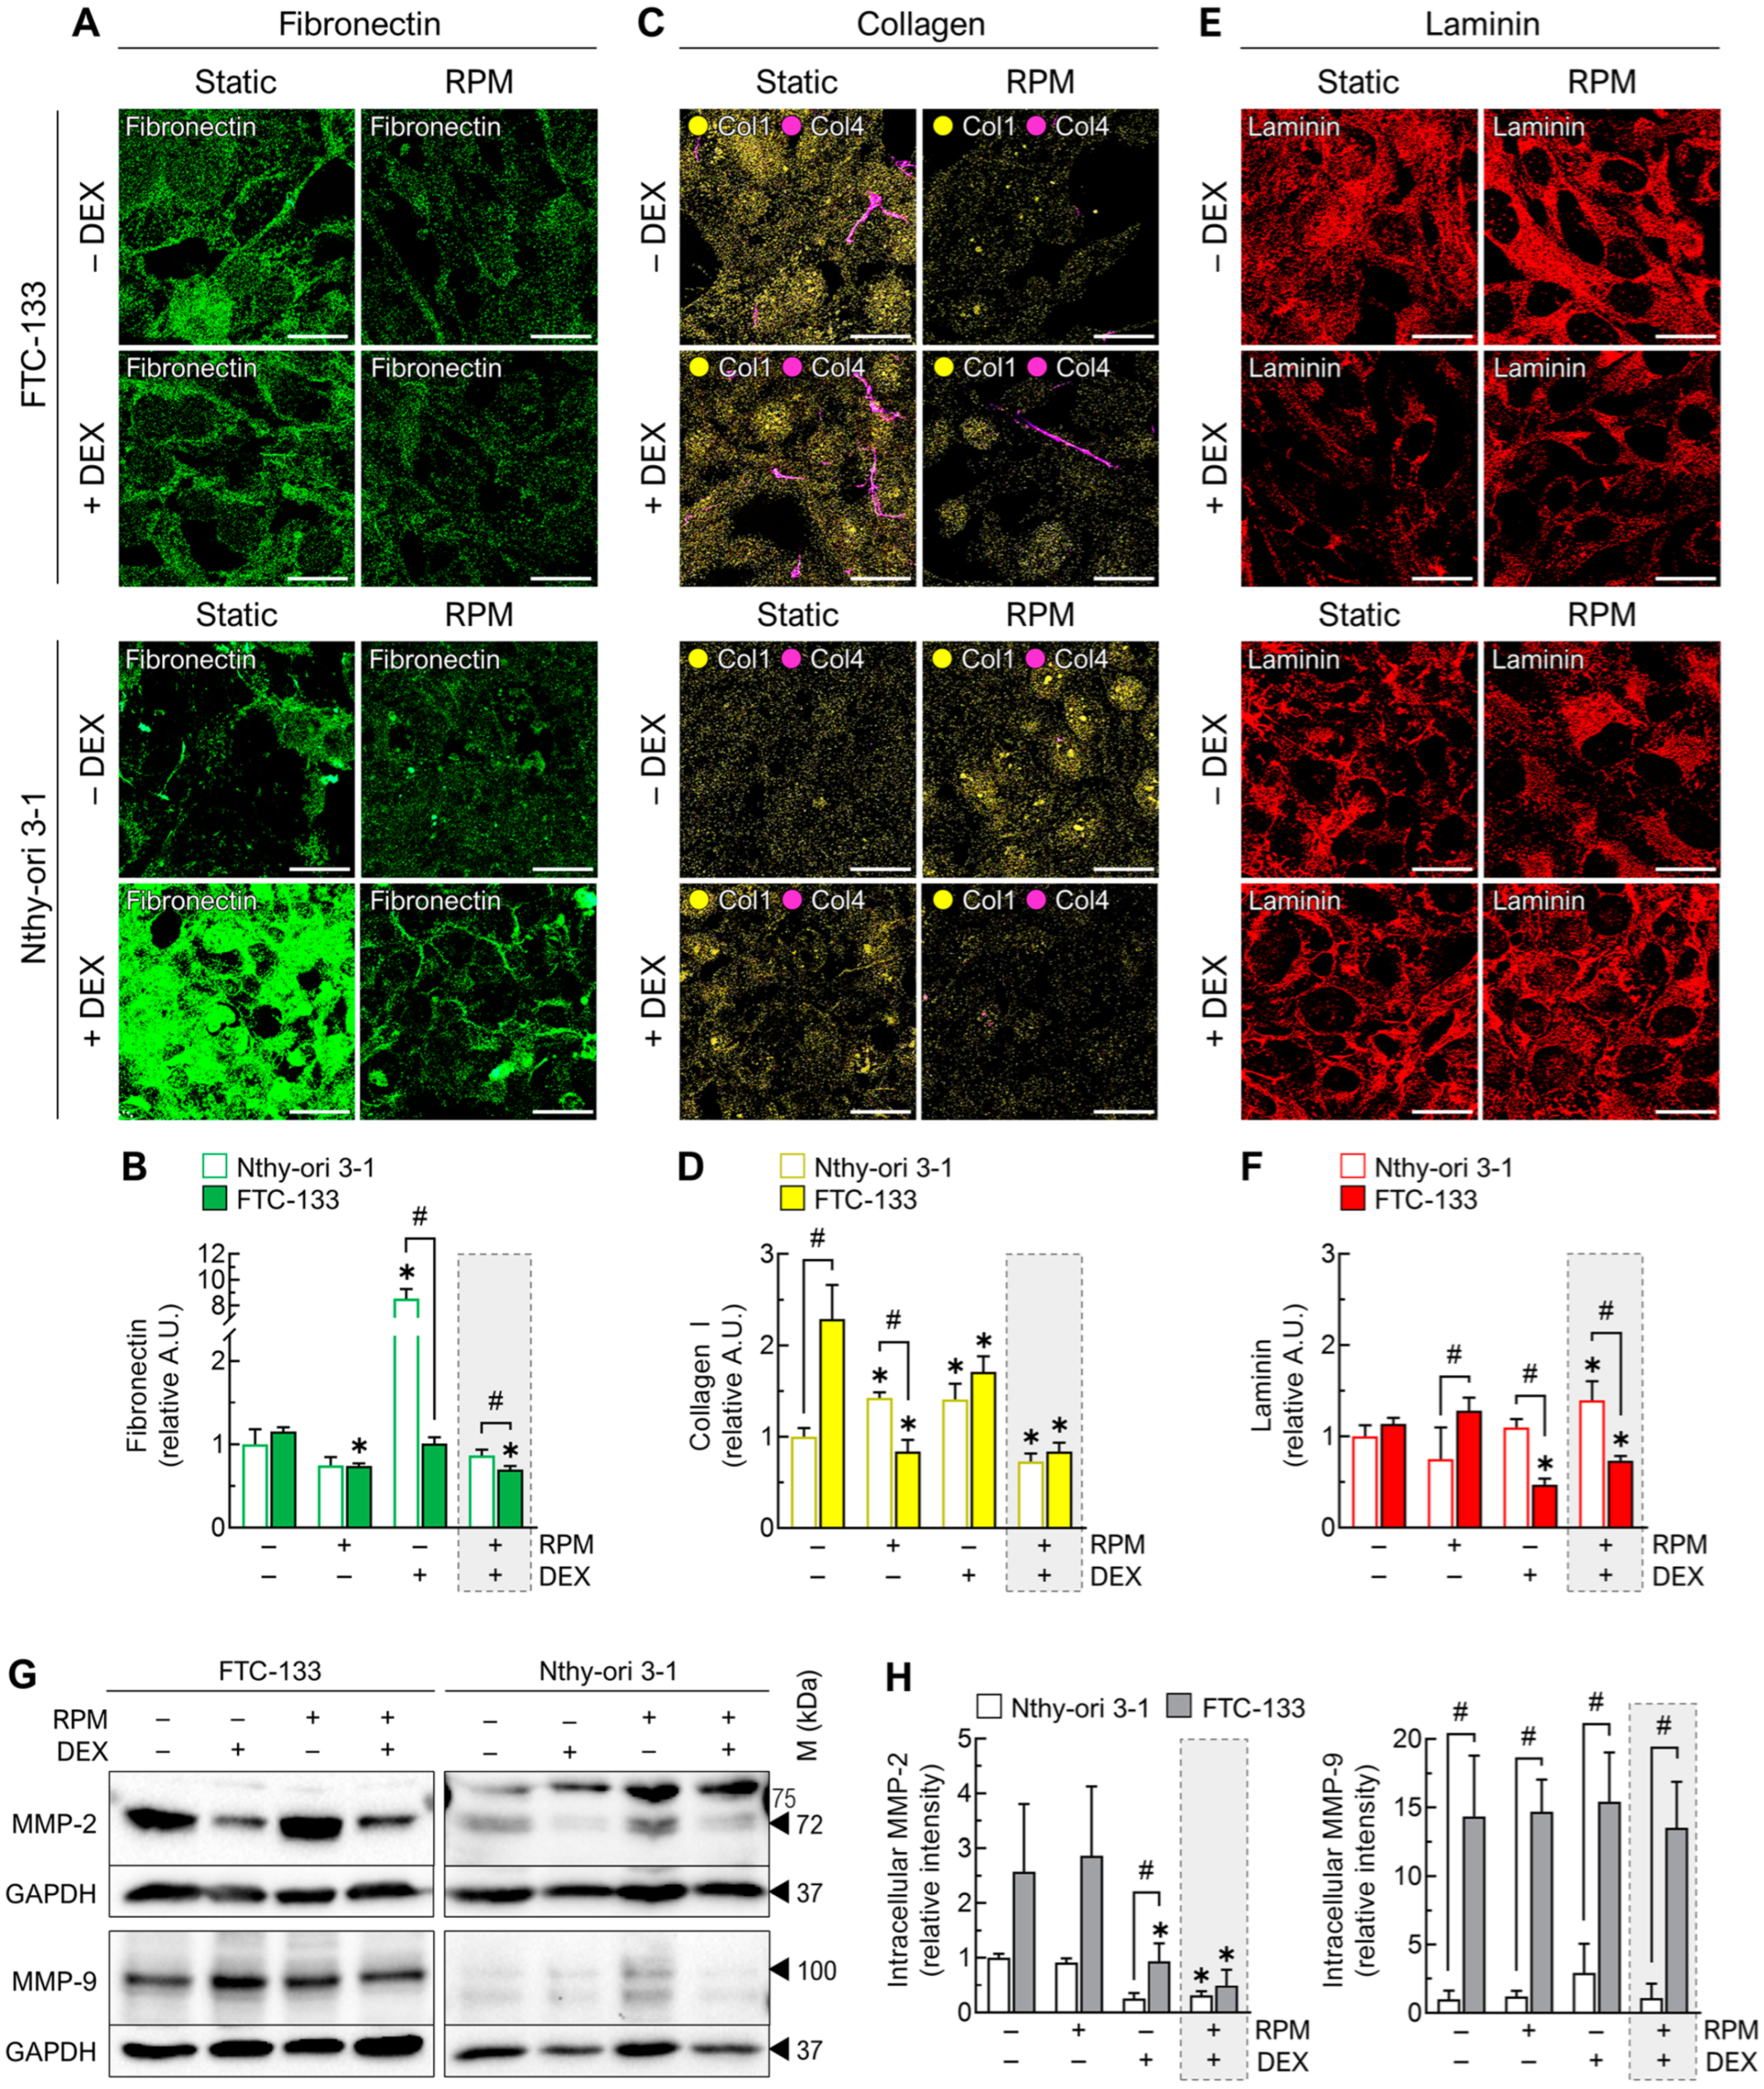
3.4.1. Extracellular Matrix
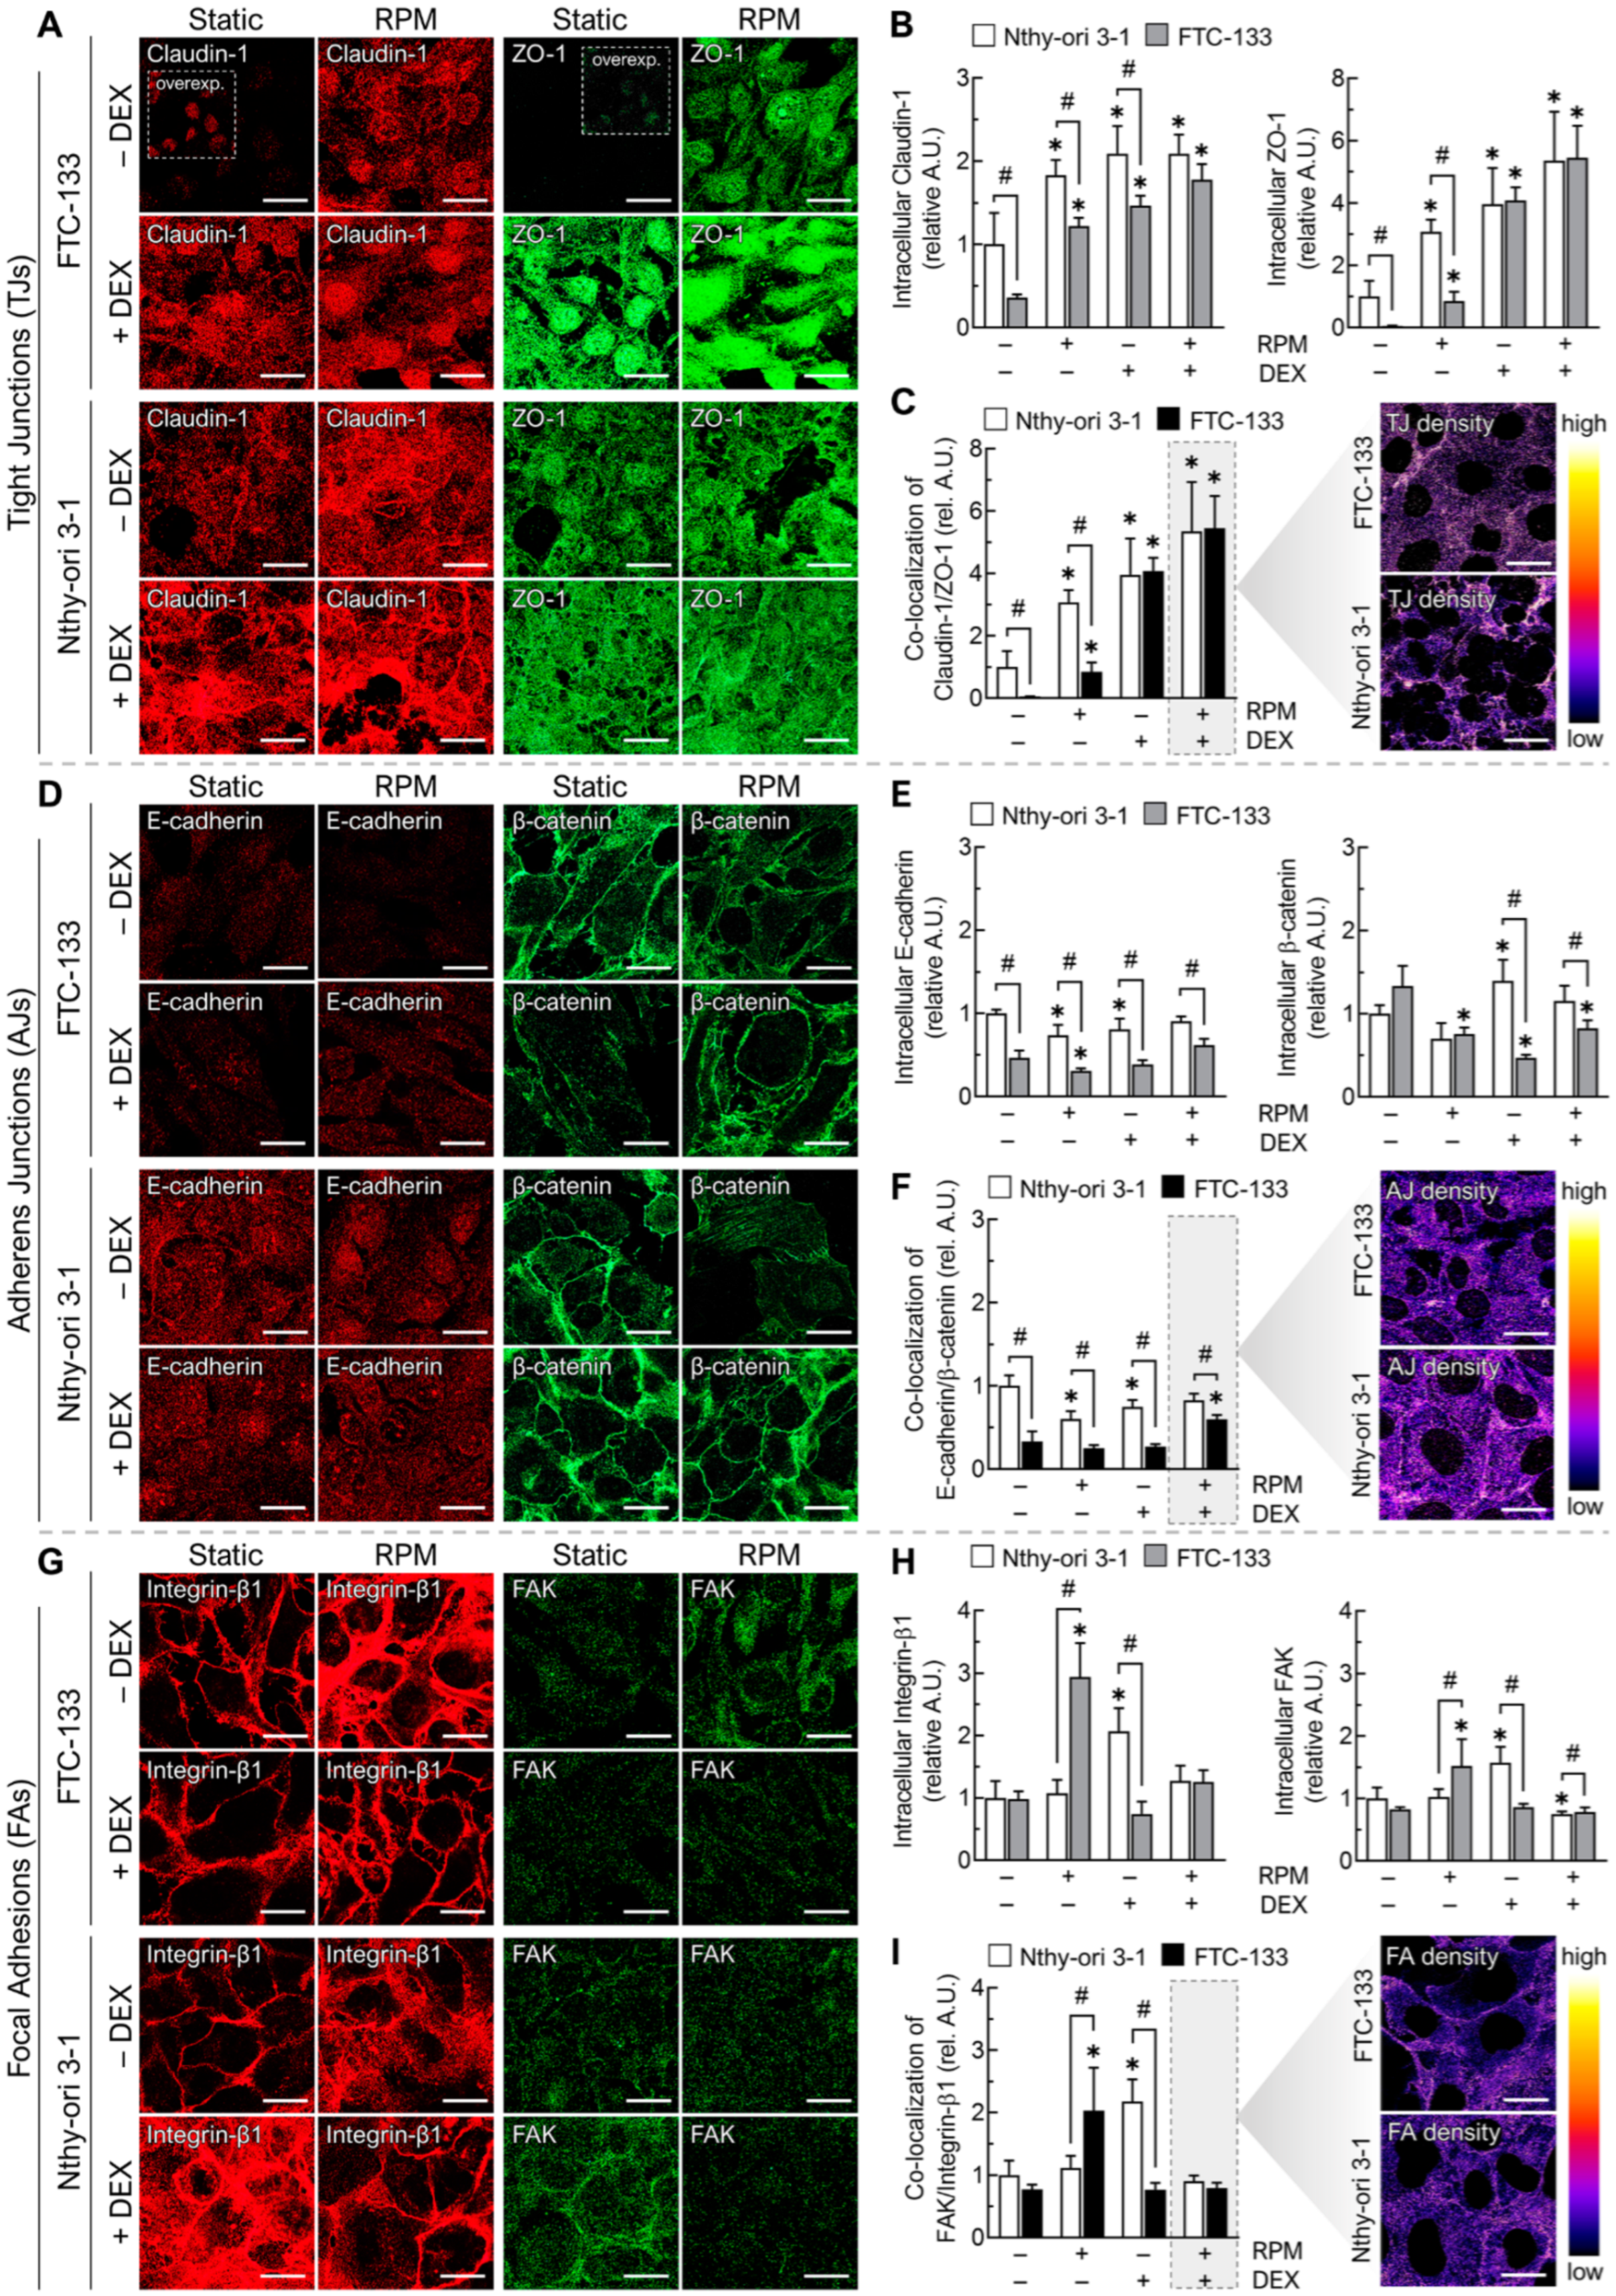
3.4.2. Cell Junctions
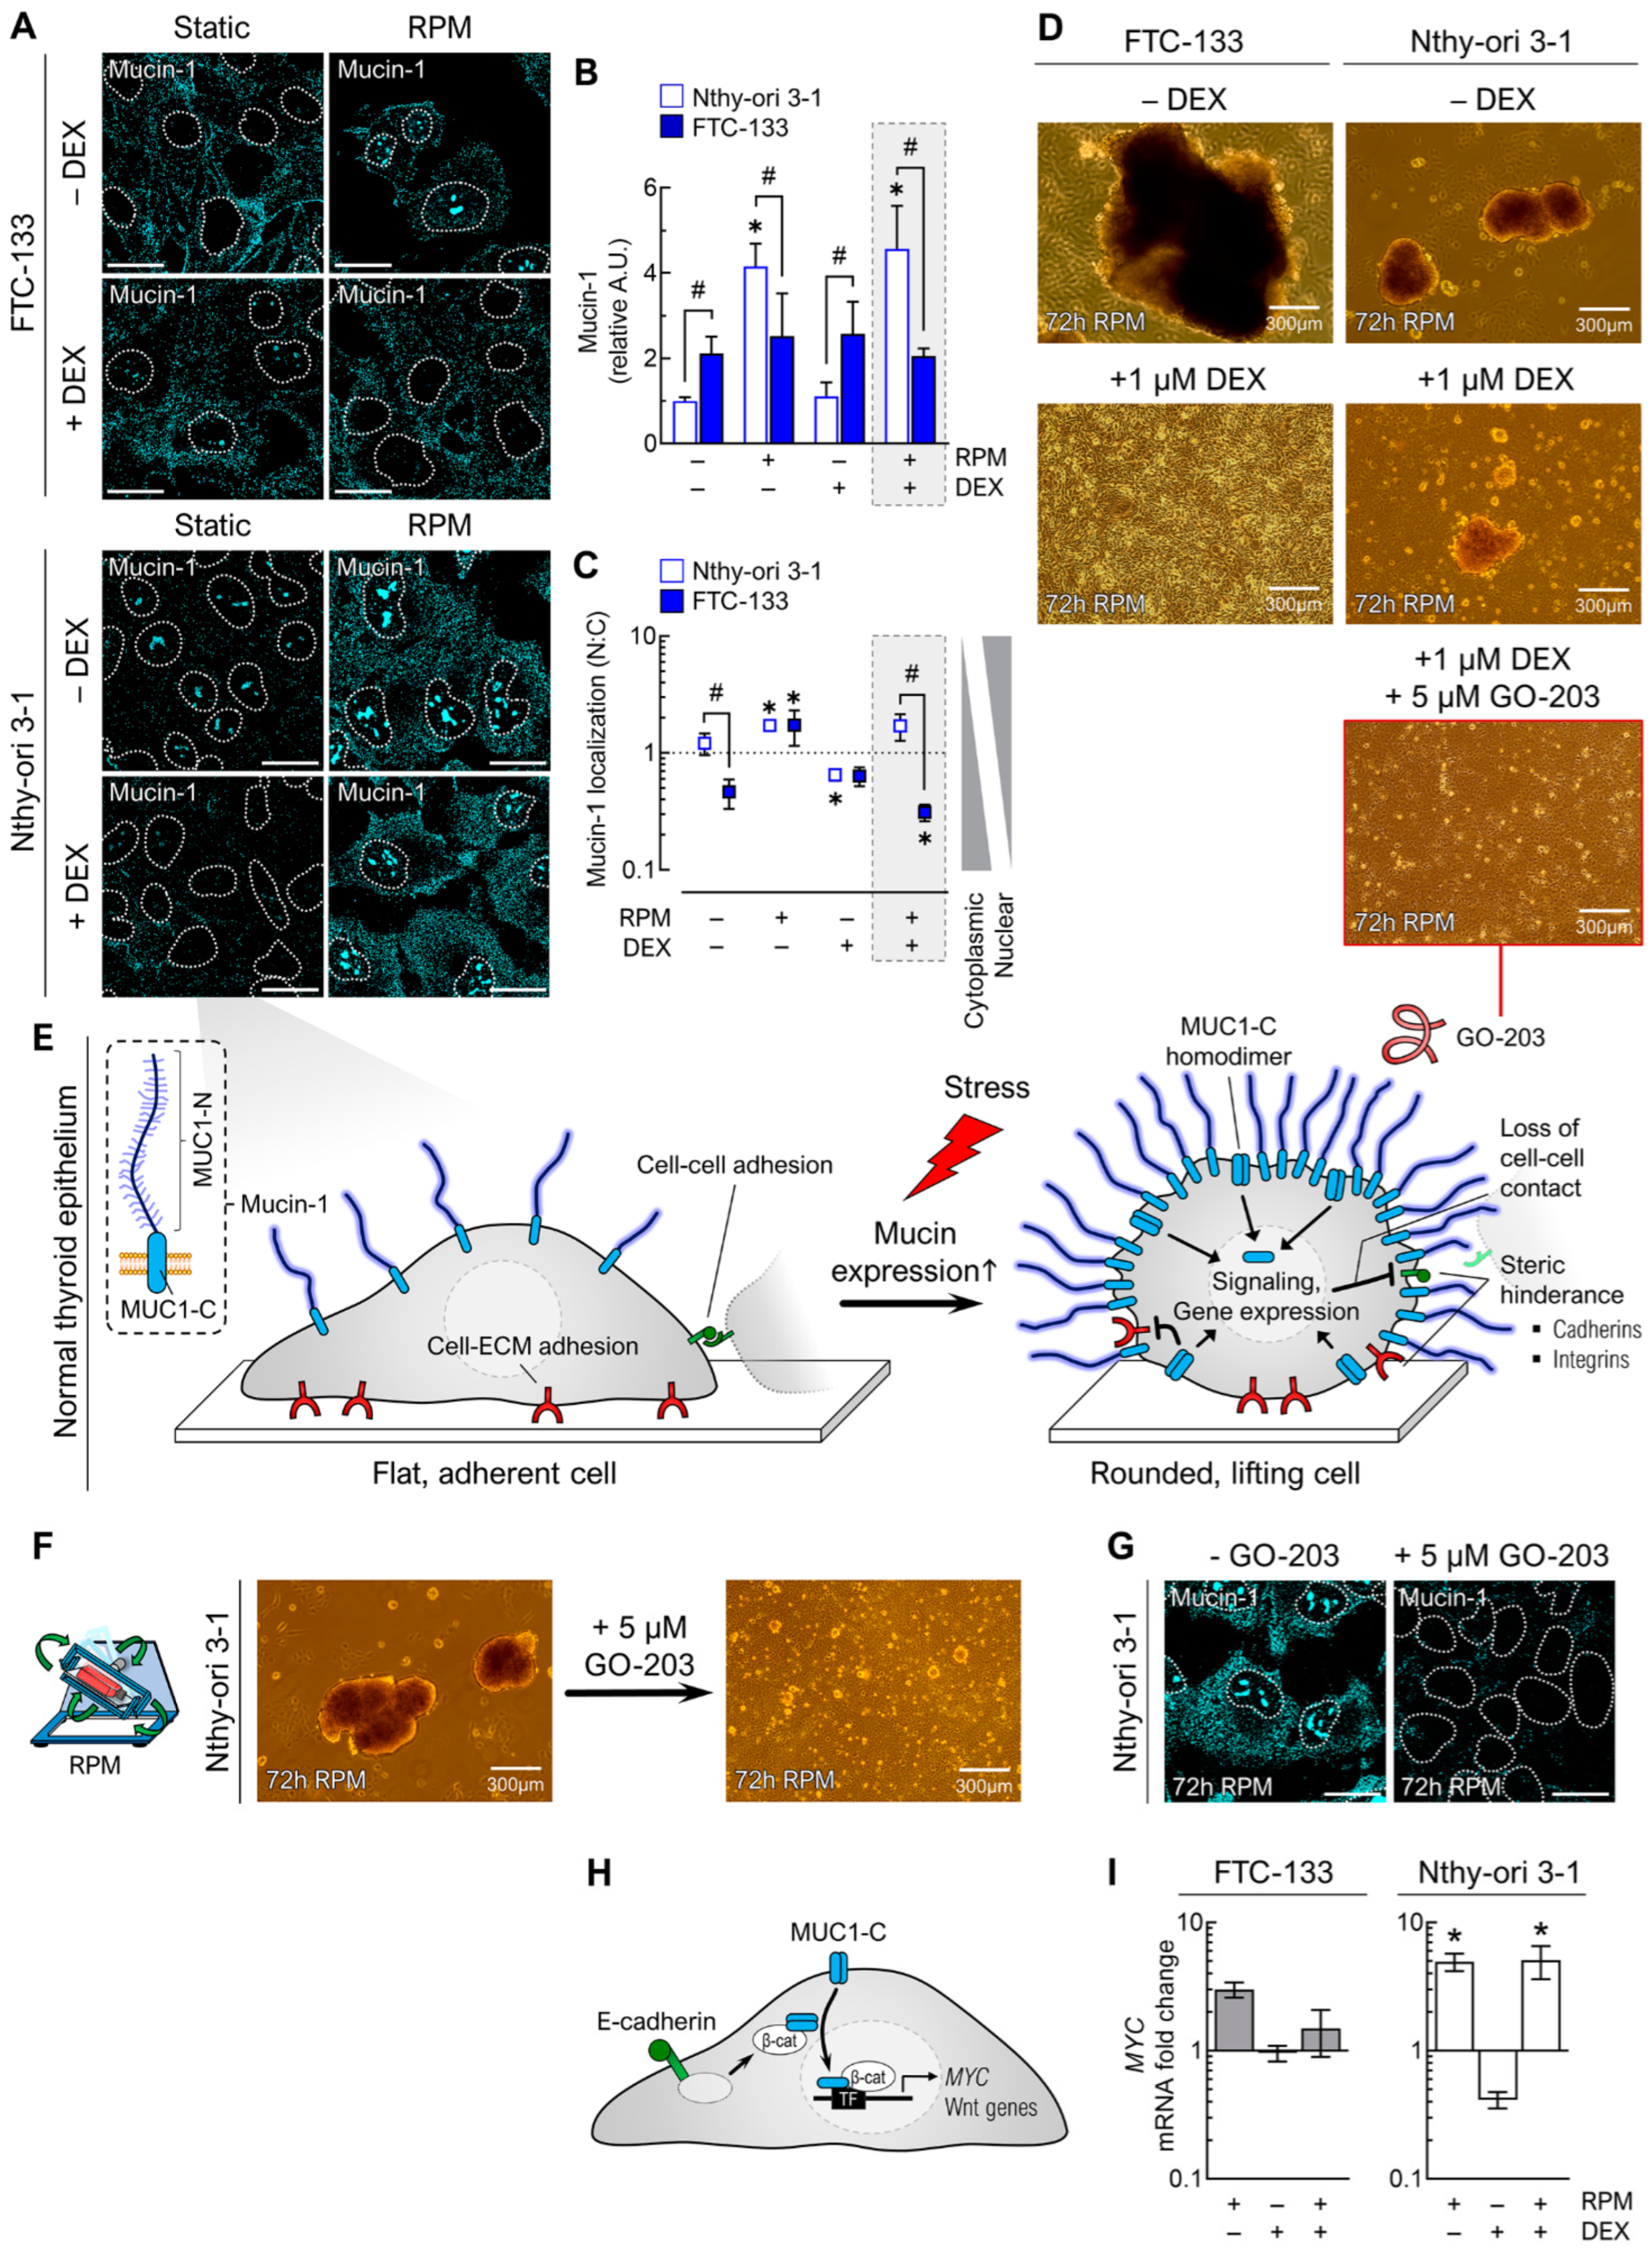
3.4.3. Anti-Adhesion Molecules
3.5. Dexamethasone Influences Signal Transduction Pathways
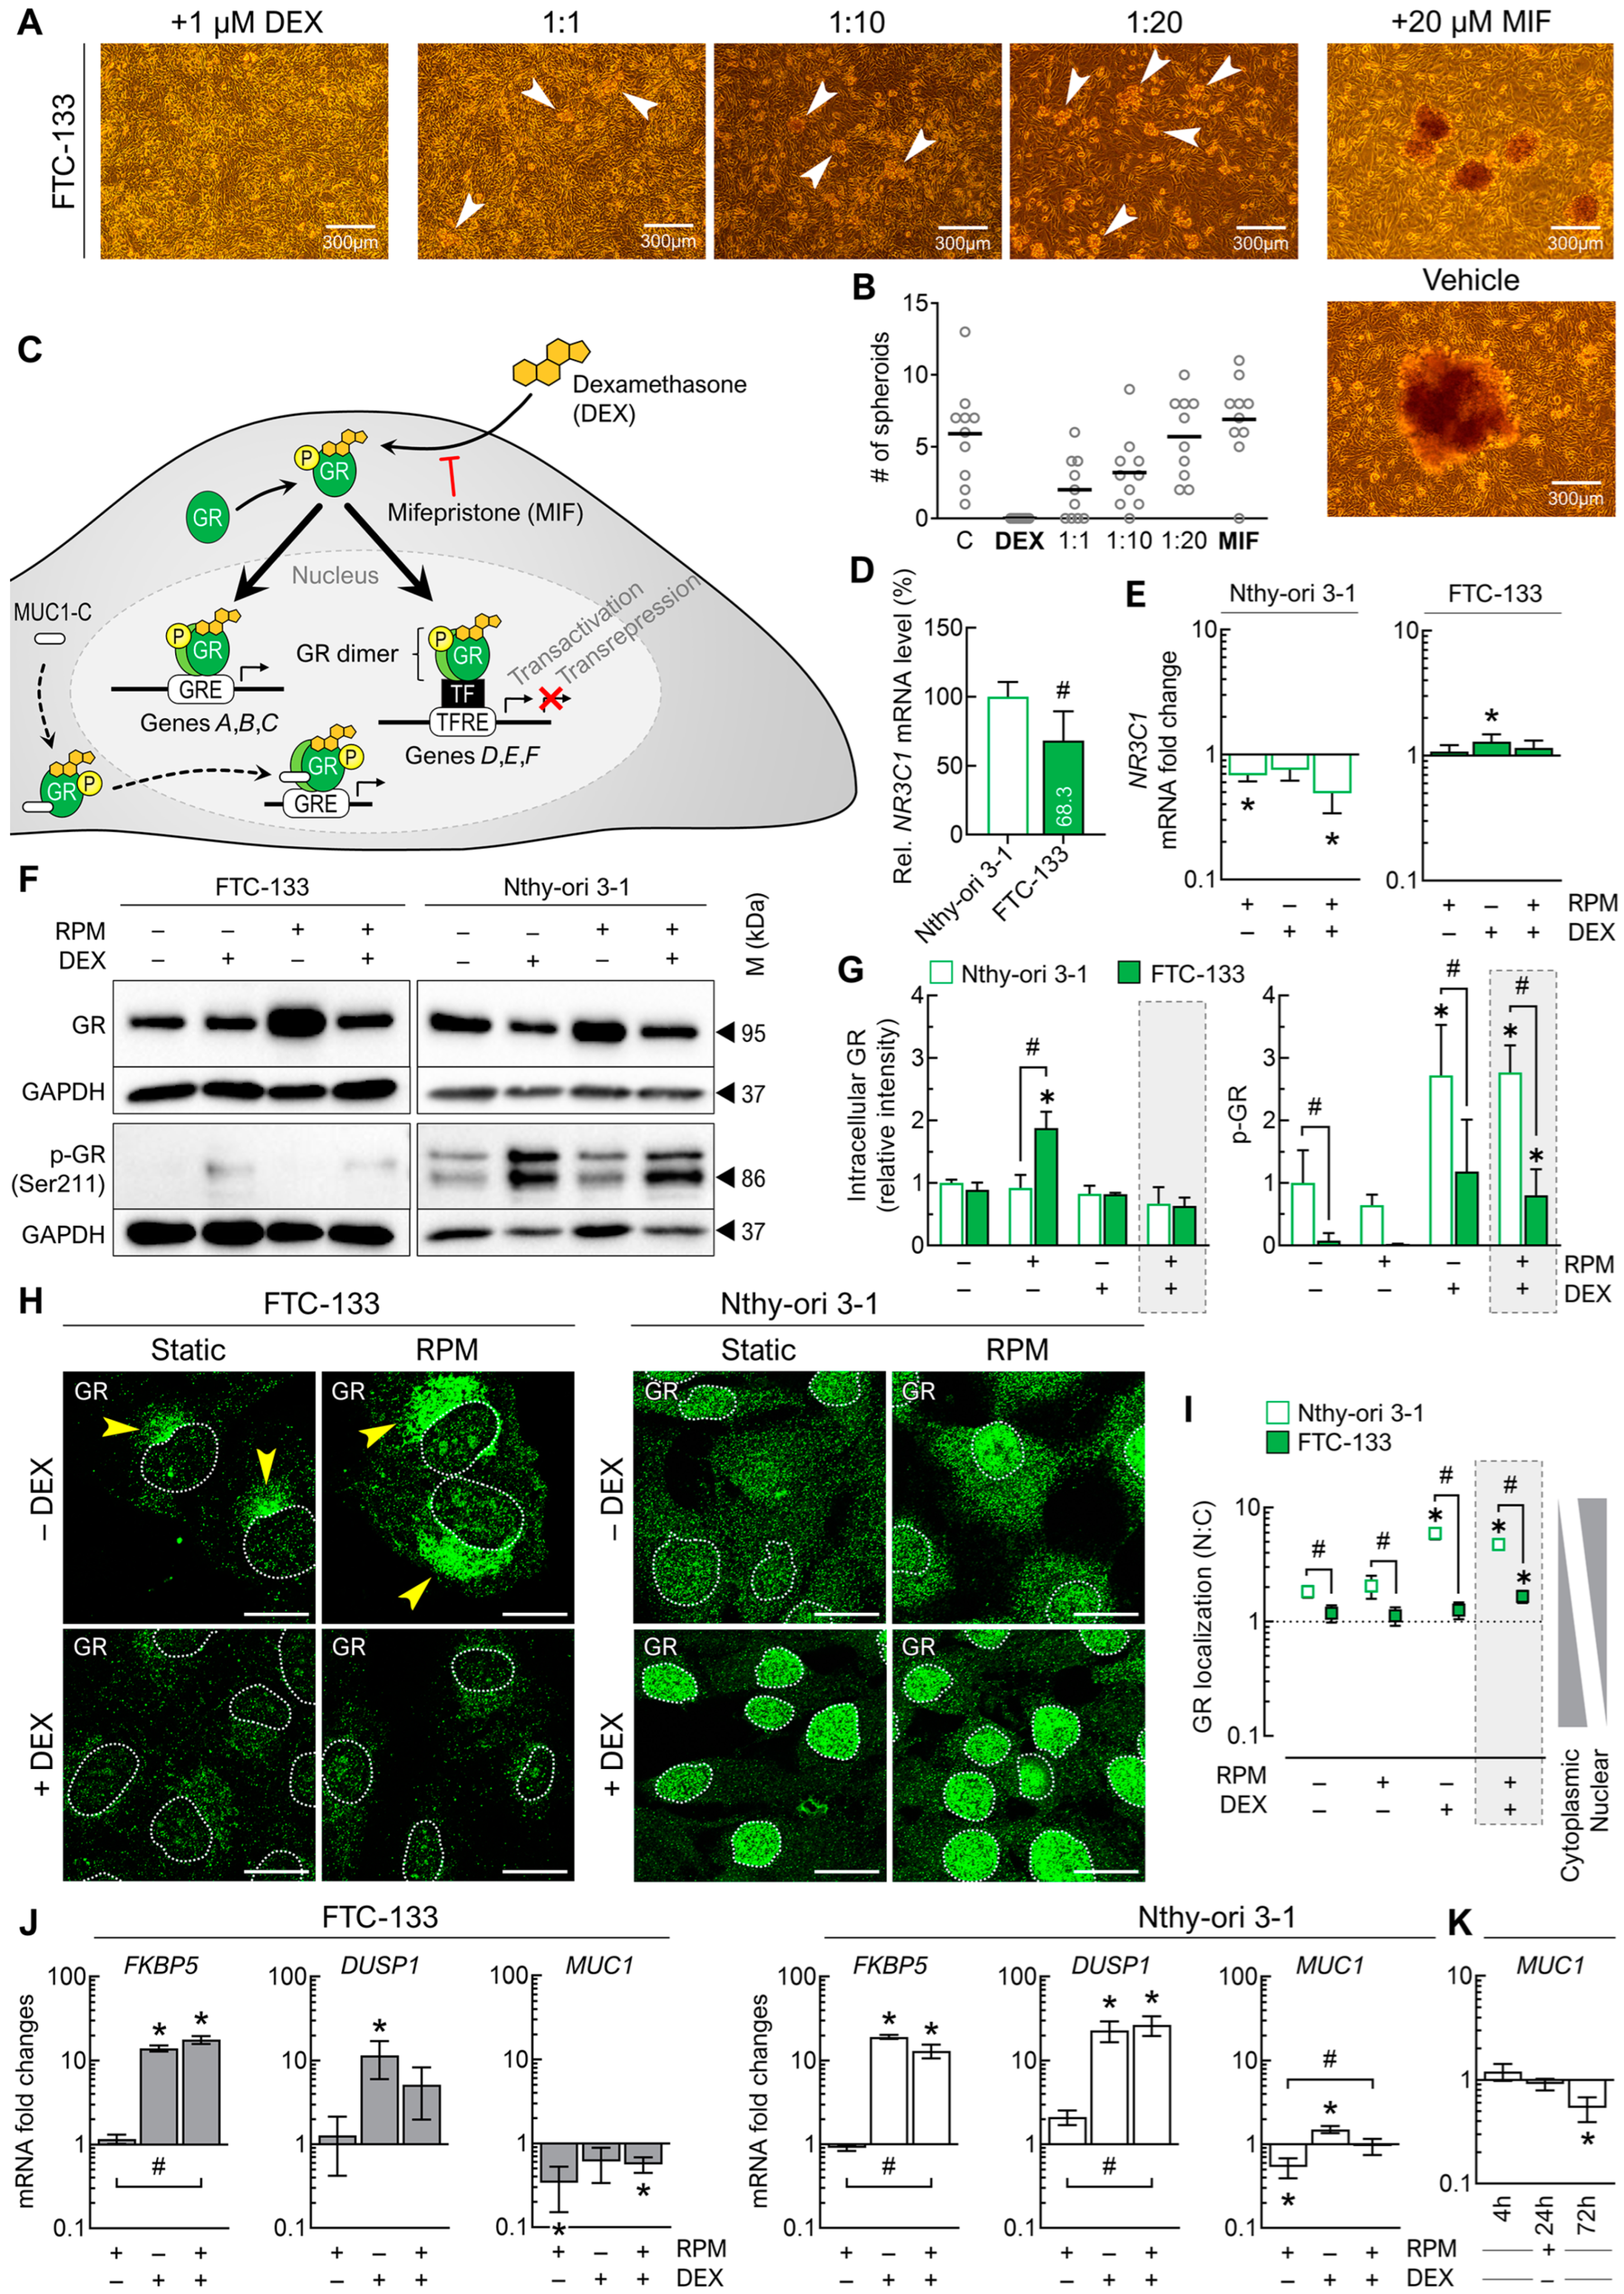
3.5.1. Glucocorticoid Receptor Signaling
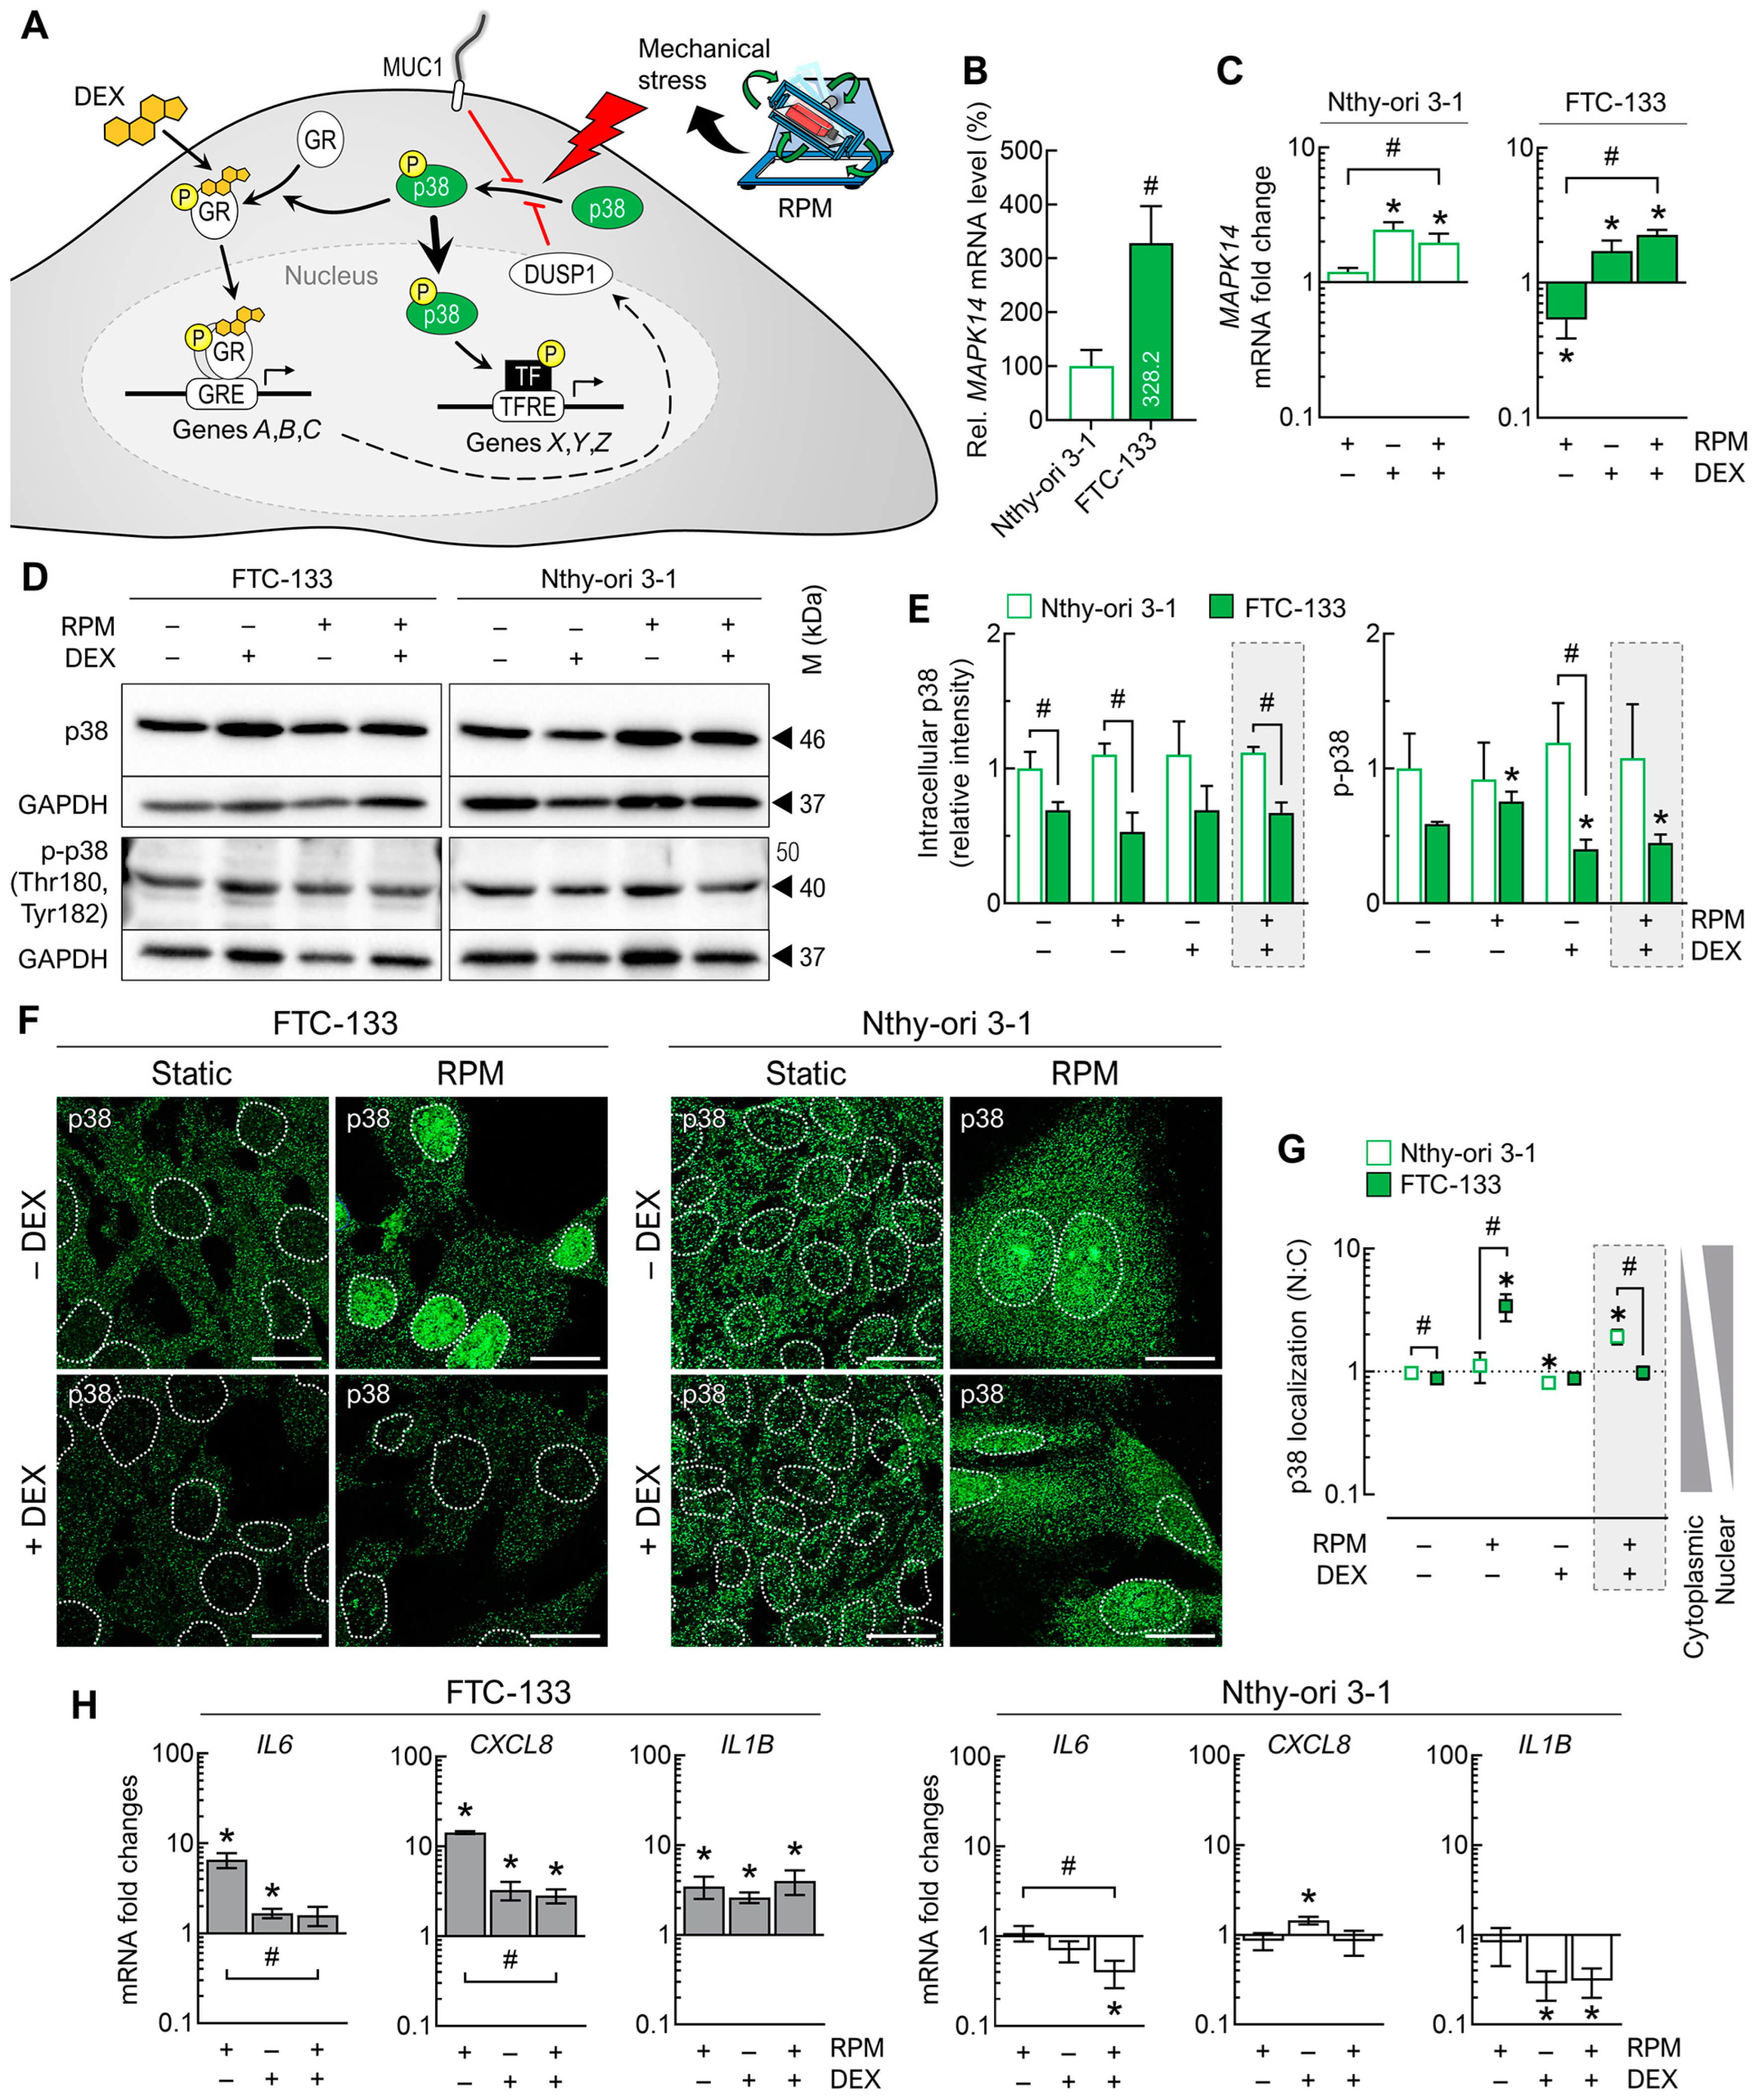
3.5.2. Cell Stress Signaling
4. Discussion
4.1. Effects of Dexamethasone
4.2. RPM-Induced Spheroid Formation and Its Inhibition by Dexamethasone
4.3. Spheroids from Healthy Cells on the RPM—A Question of Anti-Adhesion?
5. Conclusions
Supplementary Materials
Author Contributions
Funding
Institutional Review Board Statement
Informed Consent Statement
Data Availability Statement
Acknowledgments
Conflicts of Interest
References
- Steeg, P.S. Targeting metastasis. Nat. Rev. Cancer 2016, 16, 201–218. [Google Scholar] [CrossRef] [PubMed]
- Hapach, L.A.; Mosier, J.A.; Wang, W.; Reinhart-King, C.A. Engineered models to parse apart the metastatic cascade. NPJ Precis. Oncol. 2019, 3, 20. [Google Scholar] [CrossRef]
- Lara, O.D.; Wang, Y.; Asare, A.; Xu, T.; Chiu, H.-S.; Liu, Y.; Hu, W.; Sumazin, P.; Uppal, S.; Zhang, L.; et al. Pan-cancer clinical and molecular analysis of racial disparities. Cancer 2020, 126, 800–807. [Google Scholar] [CrossRef]
- Galle, E.; Thienpont, B.; Cappuyns, S.; Venken, T.; Busschaert, P.; Van Haele, M.; Van Cutsem, E.; Roskams, T.; van Pelt, J.; Verslype, C.; et al. DNA methylation-driven EMT is a common mechanism of resistance to various therapeutic agents in cancer. Clin. Epigenet. 2020, 12, 27. [Google Scholar] [CrossRef]
- Wirtz, D.; Konstantopoulos, K.; Searson, P.C. The physics of cancer: The role of physical interactions and mechanical forces in metastasis. Nat. Rev. Cancer 2011, 11, 512–522. [Google Scholar] [CrossRef]
- Northcott, J.M.; Dean, I.S.; Mouw, J.K.; Weaver, V.M. Feeling Stress: The Mechanics of Cancer Progression and Aggression. Front. Cell Dev. Biol. 2018, 6, 17. [Google Scholar] [CrossRef]
- Kumar, S.; Weaver, V.M. Mechanics, malignancy, and metastasis: The force journey of a tumor cell. Cancer Metastasis Rev. 2009, 28, 113–127. [Google Scholar] [CrossRef] [PubMed]
- Kalluri, R.; Weinberg, R.A. The basics of epithelial-mesenchymal transition. J. Clin. Investig. 2009, 119, 1420–1428. [Google Scholar] [CrossRef]
- Guck, J.; Schinkinger, S.; Lincoln, B.; Wottawah, F.; Ebert, S.; Romeyke, M.; Lenz, D.; Erickson, H.M.; Ananthakrishnan, R.; Mitchell, D.; et al. Optical deformability as an inherent cell marker for testing malignant transformation and metastatic competence. Biophys. J. 2005, 88, 3689–3698. [Google Scholar] [CrossRef] [PubMed]
- Yan, Z.; Xia, X.; Cho, W.C.; Au, D.W.; Shao, X.; Fang, C.; Tian, Y.; Lin, Y. Rapid Plastic Deformation of Cancer Cells Correlates with High Metastatic Potential. Adv. Healthc. Mater. 2022, 11, 2101657. [Google Scholar] [CrossRef]
- Baker, E.L.; Lu, J.; Yu, D.; Bonnecaze, R.T.; Zaman, M.H. Cancer Cell Stiffness: Integrated Roles of Three-Dimensional Matrix Stiffness and Transforming Potential. Biophys. J. 2010, 99, 2048–2057. [Google Scholar] [CrossRef] [PubMed]
- Wullkopf, L.; West, A.-K.V.; Leijnse, N.; Cox, T.R.; Madsen, C.D.; Oddershede, L.B.; Erler, J.T. Cancer cells’ ability to mechanically adjust to extracellular matrix stiffness correlates with their invasive potential. Mol. Biol. Cell 2018, 29, 2378–2385. [Google Scholar] [CrossRef]
- Gensbittel, V.; Kräter, M.; Harlepp, S.; Busnelli, I.; Guck, J.; Goetz, J.G. Mechanical Adaptability of Tumor Cells in Metastasis. Dev. Cell 2021, 56, 164–179. [Google Scholar] [CrossRef] [PubMed]
- Borst, A.G.; van Loon, J.J.W.A. Technology and Developments for the Random Positioning Machine, RPM. Microgravity Sci. Technol. 2008, 21, 287. [Google Scholar] [CrossRef]
- van Loon, J.J.W.A. Some history and use of the random positioning machine, RPM, in gravity related research. Adv. Space Res. 2007, 39, 1161–1165. [Google Scholar] [CrossRef]
- Hauslage, J.; Cevik, V.; Hemmersbach, R. Pyrocystis noctiluca represents an excellent bioassay for shear forces induced in ground-based microgravity simulators (clinostat and random positioning machine). NPJ Microgravity 2017, 3, 12. [Google Scholar] [CrossRef] [PubMed]
- Leguy, C.A.D.; Delfos, R.; Pourquie, M.J.B.M.; Poelma, C.; Westerweel, J.; van Loon, J.J.W.A. Fluid dynamics during Random Positioning Machine micro-gravity experiments. Adv. Space Res. 2017, 59, 3045–3057. [Google Scholar] [CrossRef]
- Wuest, S.L.; Stern, P.; Casartelli, E.; Egli, M. Fluid Dynamics Appearing during Simulated Microgravity Using Random Positioning Machines. PLoS ONE 2017, 12, e0170826. [Google Scholar] [CrossRef]
- Cortés-Sánchez, J.L.; Callant, J.; Krüger, M.; Sahana, J.; Kraus, A.; Baselet, B.; Infanger, M.; Baatout, S.; Grimm, D. Cancer Studies under Space Conditions: Finding Answers Abroad. Biomedicines 2021, 10, 25. [Google Scholar] [CrossRef]
- Krüger, M.; Melnik, D.; Kopp, S.; Buken, C.; Sahana, J.; Bauer, J.; Wehland, M.; Hemmersbach, R.; Corydon, T.J.; Infanger, M.; et al. Fighting Thyroid Cancer with Microgravity Research. Int. J. Mol. Sci. 2019, 20, 2553. [Google Scholar] [CrossRef]
- Grimm, D.; Schulz, H.; Krüger, M.; Cortés-Sánchez, J.L.; Egli, M.; Kraus, A.; Sahana, J.; Corydon, T.J.; Hemmersbach, R.; Wise, P.M.; et al. The Fight against Cancer by Microgravity: The Multicellular Spheroid as a Metastasis Model. Int. J. Mol. Sci. 2022, 23, 3073. [Google Scholar] [CrossRef]
- Riehl, B.D.; Kim, E.; Lee, J.S.; Duan, B.; Yang, R.; Donahue, H.J.; Lim, J.Y. The Role of Fluid Shear and Metastatic Potential in Breast Cancer Cell Migration. J. Biomech. Eng. 2020, 142, 101001. [Google Scholar] [CrossRef] [PubMed]
- Qazi, H.; Palomino, R.; Shi, Z.D.; Munn, L.L.; Tarbell, J.M. Cancer cell glycocalyx mediates mechanotransduction and flow-regulated invasion. Integr. Biol. 2013, 5, 1334–1343. [Google Scholar] [CrossRef] [PubMed]
- Rizvi, I.; Gurkan, U.A.; Tasoglu, S.; Alagic, N.; Celli, J.P.; Mensah, L.B.; Mai, Z.; Demirci, U.; Hasan, T. Flow induces epithelial-mesenchymal transition, cellular heterogeneity and biomarker modulation in 3D ovarian cancer nodules. Proc. Natl. Acad. Sci. USA 2013, 110, E1974–E1983. [Google Scholar] [CrossRef] [PubMed]
- Liu, S.; Zhou, F.; Shen, Y.; Zhang, Y.; Yin, H.; Zeng, Y.; Liu, J.; Yan, Z.; Liu, X. Fluid shear stress induces epithelial-mesenchymal transition (EMT) in Hep-2 cells. Oncotarget 2016, 7, 32876–32892. [Google Scholar] [CrossRef] [PubMed]
- Choi, H.Y.; Yang, G.M.; Dayem, A.A.; Saha, S.K.; Kim, K.; Yoo, Y.; Hong, K.; Kim, J.H.; Yee, C.; Lee, K.M.; et al. Hydrodynamic shear stress promotes epithelial-mesenchymal transition by downregulating ERK and GSK3β activities. Breast Cancer Res. 2019, 21, 6. [Google Scholar] [CrossRef]
- Ahn, C.B.; Lee, J.-H.; Han, D.G.; Kang, H.-W.; Lee, S.-H.; Lee, J.-I.; Son, K.H.; Lee, J.W. Simulated microgravity with floating environment promotes migration of non-small cell lung cancers. Sci. Rep. 2019, 9, 14553. [Google Scholar] [CrossRef]
- Wehland, M.; Steinwerth, P.; Aleshcheva, G.; Sahana, J.; Hemmersbach, R.; Lützenberg, R.; Kopp, S.; Infanger, M.; Grimm, D. Tissue Engineering of Cartilage Using a Random Positioning Machine. Int. J. Mol. Sci. 2020, 21, 9596. [Google Scholar] [CrossRef]
- Grimm, D.; Infanger, M.; Westphal, K.; Ulbrich, C.; Pietsch, J.; Kossmehl, P.; Vadrucci, S.; Baatout, S.; Flick, B.; Paul, M.; et al. A Delayed Type of Three-Dimensional Growth of Human Endothelial Cells Under Simulated Weightlessness. Tissue Eng. Part A 2009, 15, 2267–2275. [Google Scholar] [CrossRef]
- Buken, C.; Sahana, J.; Corydon, T.J.; Melnik, D.; Bauer, J.; Wehland, M.; Krüger, M.; Balk, S.; Abuagela, N.; Infanger, M.; et al. Morphological and Molecular Changes in Juvenile Normal Human Fibroblasts Exposed to Simulated Microgravity. Sci. Rep. 2019, 9, 11882. [Google Scholar] [CrossRef]
- Melnik, D.; Sahana, J.; Corydon, T.J.; Kopp, S.; Nassef, M.Z.; Wehland, M.; Infanger, M.; Grimm, D.; Krüger, M. Dexamethasone Inhibits Spheroid Formation of Thyroid Cancer Cells Exposed to Simulated Microgravity. Cells 2020, 9, 367. [Google Scholar] [CrossRef] [PubMed]
- Schönberger, J.; Bauer, J.; Spruss, T.; Weber, G.; Chahoud, I.; Eilles, C.; Grimm, D. Establishment and characterization of the follicular thyroid carcinoma cell line ML-1. J. Mol. Med. 2000, 78, 102–110. [Google Scholar] [CrossRef] [PubMed]
- Benavides Damm, T.; Walther, I.; Wüest, S.L.; Sekler, J.; Egli, M. Cell cultivation under different gravitational loads using a novel random positioning incubator. Biotechnol. Bioeng. 2014, 111, 1180–1190. [Google Scholar] [CrossRef]
- Shihan, M.H.; Novo, S.G.; Le Marchand, S.J.; Wang, Y.; Duncan, M.K. A simple method for quantitating confocal fluorescent images. Biochem. Biophys. Rep. 2021, 25, 100916. [Google Scholar] [CrossRef] [PubMed]
- Gottardi, C.J.; Arpin, M.; Fanning, A.S.; Louvard, D. The junction-associated protein, zonula occludens-1, localizes to the nucleus before the maturation and during the remodeling of cell-cell contacts. Proc. Natl. Acad. Sci. USA 1996, 93, 10779–10784. [Google Scholar] [CrossRef]
- Wesseling, J.; van der Valk, S.W.; Hilkens, J. A mechanism for inhibition of E-cadherin-mediated cell-cell adhesion by the membrane-associated mucin episialin/MUC1. Mol. Biol. Cell 1996, 7, 565–577. [Google Scholar] [CrossRef]
- Wesseling, J.; van der Valk, S.W.; Vos, H.L.; Sonnenberg, A.; Hilkens, J. Episialin (MUC1) overexpression inhibits integrin-mediated cell adhesion to extracellular matrix components. J. Cell Biol. 1995, 129, 255–265. [Google Scholar] [CrossRef]
- Nath, S.; Mukherjee, P. MUC1: A multifaceted oncoprotein with a key role in cancer progression. Trends Mol. Med. 2014, 20, 332–342. [Google Scholar] [CrossRef]
- Scheschowitsch, K.; Leite, J.; Assreuy, J. New insights in glucocorticoid receptor signaling—More than just a ligand binding receptor. Front. Endocrinol. 2017, 8, 16. [Google Scholar] [CrossRef]
- Vanderhaeghen, T.; Timmermans, S.; Watts, D.; Paakinaho, V.; Eggermont, M.; Vandewalle, J.; Wallaeys, C.; Van Wyngene, L.; Van Looveren, K.; Nuyttens, L.; et al. Reprogramming of glucocorticoid receptor function by hypoxia. EMBO Rep. 2022, 23, e53083. [Google Scholar] [CrossRef]
- Vanderhaeghen, T.; Beyaert, R.; Libert, C. Bidirectional Crosstalk Between Hypoxia Inducible Factors and Glucocorticoid Signalling in Health and Disease. Front. Immunol. 2021, 12, 684085. [Google Scholar] [CrossRef]
- Yang, N.; Berry, A.; Sauer, C.; Baxter, M.; Donaldson, I.J.; Forbes, K.; Donn, R.; Matthews, L.; Ray, D. Hypoxia regulates GR function through multiple mechanisms involving microRNAs 103 and 107. Mol. Cell. Endocrinol. 2020, 518, 111007. [Google Scholar] [CrossRef] [PubMed]
- Lea, S.; Li, J.; Plumb, J.; Gaffey, K.; Mason, S.; Gaskell, R.; Harbron, C.; Singh, D. P38 MAPK and glucocorticoid receptor crosstalk in bronchial epithelial cells. J. Mol. Med. 2020, 98, 361–374. [Google Scholar] [CrossRef]
- Szatmáry, Z.; Garabedian, M.J.; Vilček, J. Inhibition of Glucocorticoid Receptor-mediated Transcriptional Activation by p38 Mitogen-activated Protein (MAP) Kinase. J. Biol. Chem. 2004, 279, 43708–43715. [Google Scholar] [CrossRef]
- Irusen, E.; Matthews, J.G.; Takahashi, A.; Barnes, P.J.; Chung, K.F.; Adcock, I.M. p38 Mitogen-activated protein kinase–induced glucocorticoid receptor phosphorylation reduces its activity: Role in steroid-insensitive asthma. J. Allergy Clin. Immunol. 2002, 109, 649–657. [Google Scholar] [CrossRef]
- Hoffman, L.; Jensen, C.C.; Yoshigi, M.; Beckerle, M. Mechanical signals activate p38 MAPK pathway-dependent reinforcement of actin via mechanosensitive HspB1. Mol. Biol. Cell 2017, 28, 2661–2675. [Google Scholar] [CrossRef]
- Wu, Y.; Xia, R.; Dai, C.; Yan, S.; Xie, T.; Liu, B.; Gan, L.; Zhuang, Z.; Huang, Q. Dexamethasone inhibits the proliferation of tumor cells. Cancer Manag. Res. 2019, 11, 1141–1154. [Google Scholar] [CrossRef] [PubMed]
- Mohammadi, L.; Mosayyebi, B.; Imani, M.; Rahmati, M. Dexamethasone Reduces Cell Adhesion and Migration of T47D Breast Cancer Cell Line. Anticancer Agents Med. Chem. 2022, 22, 2494–2501. [Google Scholar] [CrossRef] [PubMed]
- Meng, X.G.; Yue, S.W. Dexamethasone disrupts cytoskeleton organization and migration of T47D Human breast cancer cells by modulating the AKT/mTOR/RhoA pathway. Asian Pac. J. Cancer Prev. 2014, 15, 10245–10250. [Google Scholar] [CrossRef] [PubMed]
- Lin, K.-T.; Sun, S.-P.; Wu, J.-I.; Wang, L.-H. Low-dose glucocorticoids suppresses ovarian tumor growth and metastasis in an immunocompetent syngeneic mouse model. PLoS ONE 2017, 12, e0178937. [Google Scholar] [CrossRef]
- Lin, K.-T.; Yeh, Y.-M.; Chuang, C.-M.; Yang, S.Y.; Chang, J.-W.; Sun, S.-P.; Wang, Y.-S.; Chao, K.-C.; Wang, L.-H. Glucocorticoids mediate induction of microRNA-708 to suppress ovarian cancer metastasis through targeting Rap1B. Nat. Commun. 2015, 6, 5917. [Google Scholar] [CrossRef]
- Zheng, Y.; Izumi, K.; Li, Y.; Ishiguro, H.; Miyamoto, H. Contrary Regulation of Bladder Cancer Cell Proliferation and Invasion by Dexamethasone-Mediated Glucocorticoid Receptor Signals. Mol. Cancer Ther. 2012, 11, 2621–2632. [Google Scholar] [CrossRef]
- Yip, H.Y.K.; Chee, A.; Ang, C.-S.; Shin, S.-Y.; Ooms, L.M.; Mohammadi, Z.; Phillips, W.A.; Daly, R.J.; Cole, T.J.; Bronson, R.T.; et al. Control of Glucocorticoid Receptor Levels by PTEN Establishes a Failsafe Mechanism for Tumor Suppression. Mol. Cell 2020, 80, 279–295.e8. [Google Scholar] [CrossRef] [PubMed]
- Ji, J.Y.; Jing, H.; Diamond, S.L. Shear Stress Causes Nuclear Localization of Endothelial Glucocorticoid Receptor and Expression From the GRE Promoter. Circ. Res. 2003, 92, 279–285. [Google Scholar] [CrossRef] [PubMed]
- Nayebosadri, A.; Christopher, L.; Ji, J.Y. Bayesian Image Analysis of Dexamethasone and Shear Stress-Induced Glucocorticoid Receptor Intracellular Movement. Ann. Biomed. Eng. 2012, 40, 1508–1519. [Google Scholar] [CrossRef] [PubMed]
- Whitmarsh, A.J. A central role for p38 MAPK in the early transcriptional response to stress. BMC Biology 2010, 8, 47. [Google Scholar] [CrossRef] [PubMed]
- Kopp, S.; Warnke, E.; Wehland, M.; Aleshcheva, G.; Magnusson, N.E.; Hemmersbach, R.; Corydon, T.J.; Bauer, J.; Infanger, M.; Grimm, D. Mechanisms of three-dimensional growth of thyroid cells during long-term simulated microgravity. Sci. Rep. 2015, 5, 16691. [Google Scholar] [CrossRef]
- Warnke, E.; Pietsch, J.; Kopp, S.; Bauer, J.; Sahana, J.; Wehland, M.; Krüger, M.; Hemmersbach, R.; Infanger, M.; Lützenberg, R.; et al. Cytokine Release and Focal Adhesion Proteins in Normal Thyroid Cells Cultured on the Random Positioning Machine. Cell. Physiol. Biochem. 2017, 43, 257–270. [Google Scholar] [CrossRef]
- Warnke, E.; Pietsch, J.; Wehland, M.; Bauer, J.; Infanger, M.; Görög, M.; Hemmersbach, R.; Braun, M.; Ma, X.; Sahana, J.; et al. Spheroid formation of human thyroid cancer cells under simulated microgravity: A possible role of CTGF and CAV1. Cell Commun. Signal. 2014, 12, 32. [Google Scholar] [CrossRef]
- Svejgaard, B.; Wehland, M.; Ma, X.; Kopp, S.; Sahana, J.; Warnke, E.; Aleshcheva, G.; Hemmersbach, R.; Hauslage, J.; Grosse, J.; et al. Common Effects on Cancer Cells Exerted by a Random Positioning Machine and a 2D Clinostat. PLoS ONE 2015, 10, e0135157. [Google Scholar] [CrossRef]
- Grosse, J.; Wehland, M.; Pietsch, J.; Schulz, H.; Saar, K.; Hübner, N.; Elles, C.; Bauer, J.; Abou-El-Ardat, K.; Baatout, S.; et al. Gravity-sensitive signaling drives 3-dimensional formation of multicellular thyroid cancer spheroids. FASEB J. 2012, 26, 5124–5140. [Google Scholar] [CrossRef]
- Grimm, D.; Bauer, J.; Kossmehl, P.; Shakibaei, M.; Schöberger, J.; Pickenhahn, H.; Schulze-Tanzil, G.; Vetter, R.; Eilles, C.; Paul, M.; et al. Simulated microgravity alters differentiation and increases apoptosis in human follicular thyroid carcinoma cells. FASEB J. 2002, 16, 604–606. [Google Scholar] [CrossRef]
- Kopp, S.; Sahana, J.; Islam, T.; Petersen, A.G.; Bauer, J.; Corydon, T.J.; Schulz, H.; Saar, K.; Huebner, N.; Slumstrup, L.; et al. The role of NFκB in spheroid formation of human breast cancer cells cultured on the Random Positioning Machine. Sci. Rep. 2018, 8, 921. [Google Scholar] [CrossRef]
- Sahana, J.; Nassef, M.Z.; Wehland, M.; Kopp, S.; Krüger, M.; Corydon, T.J.; Infanger, M.; Bauer, J.; Grimm, D. Decreased E-Cadherin in MCF7 Human Breast Cancer Cells Forming Multicellular Spheroids Exposed to Simulated Microgravity. Proteomics 2018, 18, 1800015. [Google Scholar] [CrossRef]
- Lin, K.T.; Wang, L.H. New dimension of glucocorticoids in cancer treatment. Steroids 2016, 111, 84–88. [Google Scholar] [CrossRef]
- Calvaruso, M.; Militello, C.; Minafra, L.; La Regina, V.; Torrisi, F.; Pucci, G.; Cammarata, F.P.; Bravatà, V.; Forte, G.I.; Russo, G. Biological and Mechanical Characterization of the Random Positioning Machine (RPM) for Microgravity Simulations. Life 2021, 11, 1190. [Google Scholar] [CrossRef]
- Wuest, S.L.; Richard, S.; Kopp, S.; Grimm, D.; Egli, M. Simulated microgravity: Critical review on the use of random positioning machines for mammalian cell culture. Biomed. Res. Int. 2015, 2015, 971474. [Google Scholar] [CrossRef] [PubMed]
- Nassef, M.Z.; Melnik, D.; Kopp, S.; Sahana, J.; Infanger, M.; Lützenberg, R.; Relja, B.; Wehland, M.; Grimm, D.; Krüger, M. Breast Cancer Cells in Microgravity: New Aspects for Cancer Research. Int. J. Mol. Sci. 2020, 21, 7345. [Google Scholar] [CrossRef] [PubMed]
- Zettl, K.S.; Sjaastad, M.D.; Riskin, P.M.; Parry, G.; Machen, T.E.; Firestone, G.L. Glucocorticoid-induced formation of tight junctions in mouse mammary epithelial cells in vitro. Proc. Natl. Acad. Sci. USA 1992, 89, 9069–9073. [Google Scholar] [CrossRef] [PubMed]
- Woo, P.L.; Cercek, A.; Desprez, P.Y.; Firestone, G.L. Involvement of the helix-loop-helix protein Id-1 in the glucocorticoid regulation of tight junctions in mammary epithelial cells. J. Biol. Chem. 2000, 275, 28649–28658. [Google Scholar] [CrossRef]
- Tena-Garitaonaindia, M.; Arredondo-Amador, M.; Mascaraque, C.; Asensio, M.; Marin, J.J.G.; Martínez-Augustin, O.; Sánchez de Medina, F. Modulation of intestinal barrier function by glucocorticoids: Lessons from preclinical models. Pharmacol. Res. 2022, 177, 106056. [Google Scholar] [CrossRef]
- Adamian, M.; Hekmat, A.; Hajebrahimi, Z. The Impacts of Simulated Microgravity on The Cell Viability and Claudin-1 and Claudin-3 Expression of MCF-7 Breast Cancer Cells. J. Sci. Islam. Repub. Iran 2021, 32, 105–114. [Google Scholar] [CrossRef]
- Martin, T.A. The role of tight junctions in cancer metastasis. Semin. Cell Dev. Biol. 2014, 36, 224–231. [Google Scholar] [CrossRef] [PubMed]
- Salvador, E.; Burek, M.; Förster, C.Y. Tight Junctions and the Tumor Microenvironment. Curr. Pathobiol. Rep. 2016, 4, 135–145. [Google Scholar] [CrossRef] [PubMed]
- Tzelepi, V.N.; Tsamandas, A.C.; Vlotinou, H.D.; Vagianos, C.E.; Scopa, C.D. Tight junctions in thyroid carcinogenesis: Diverse expression of claudin-1, claudin-4, claudin-7 and occludin in thyroid neoplasms. Mod. Pathol. 2008, 21, 22–30. [Google Scholar] [CrossRef] [PubMed]
- Zwanziger, D.; Badziong, J.; Ting, S.; Moeller, L.C.; Schmid, K.W.; Siebolts, U.; Wickenhauser, C.; Dralle, H.; Fuehrer, D. The impact of CLAUDIN-1 on follicular thyroid carcinoma aggressiveness. Endocr.-Relat. Cancer 2015, 22, 819–830. [Google Scholar] [CrossRef] [PubMed]
- Na, T.-Y.; Schecterson, L.; Mendonsa, A.M.; Gumbiner, B.M. The functional activity of E-cadherin controls tumor cell metastasis at multiple steps. Proc. Natl. Acad. Sci. USA 2020, 117, 5931–5937. [Google Scholar] [CrossRef]
- Zhou, C.; Yang, C.; Chong, D. E-cadherin expression is associated with susceptibility and clinicopathological characteristics of thyroid cancer: A PRISMA-compliant meta-analysis. Medicine 2019, 98, e16187. [Google Scholar] [CrossRef]
- Huang, S.H.; Wu, J.C.; Chang, K.J.; Liaw, K.Y.; Wang, S.M. Distribution of the cadherin-catenin complex in normal human thyroid epithelium and a thyroid carcinoma cell line. J. Cell. Biochem. 1998, 70, 330–337. [Google Scholar] [CrossRef]
- Singh, P.K.; Hollingsworth, M.A. Cell surface-associated mucins in signal transduction. Trends Cell Biol. 2006, 16, 467–476. [Google Scholar] [CrossRef] [PubMed]
- Zhou, X.; Tu, J.; Li, Q.; Kolosov, V.P.; Perelman, J.M. Hypoxia induces mucin expression and secretion in human bronchial epithelial cells. Transl. Res. 2012, 160, 419–427. [Google Scholar] [CrossRef]
- Nakamura, Y.; Saitou, M.; Komura, S.; Matsumoto, K.; Ogawa, H.; Miyagawa, T.; Saitou, T.; Imamura, T.; Imai, Y.; Takayanagi, H.; et al. Reduced dynamic loads due to hip dislocation induce acetabular cartilage degeneration by IL-6 and MMP3 via the STAT3/periostin/NF-κB axis. Sci. Rep. 2022, 12, 12207. [Google Scholar] [CrossRef]
- van Putten, J.P.M.; Strijbis, K. Transmembrane Mucins: Signaling Receptors at the Intersection of Inflammation and Cancer. J Innate Immun. 2017, 9, 281–299. [Google Scholar] [CrossRef]
- Hollingsworth, M.A.; Swanson, B.J. Mucins in cancer: Protection and control of the cell surface. Nat. Rev. Cancer 2004, 4, 45–60. [Google Scholar] [CrossRef] [PubMed]
- Wi, D.H.; Cha, J.H.; Jung, Y.S. Mucin in cancer: A stealth cloak for cancer cells. BMB Rep. 2021, 54, 344–355. [Google Scholar] [CrossRef] [PubMed]
- Monti, N.; Masiello, M.G.; Proietti, S.; Catizone, A.; Ricci, G.; Harrath, A.H.; Alwasel, S.H.; Cucina, A.; Bizzarri, M. Survival Pathways Are Differently Affected by Microgravity in Normal and Cancerous Breast Cells. Int. J. Mol. Sci. 2021, 22, 862. [Google Scholar] [CrossRef] [PubMed]
- Wu, G.; Kim, D.; Kim, J.N.; Park, S.; Maharjan, S.; Koh, H.; Moon, K.; Lee, Y.; Kwon, H.J. A Mucin1 C-terminal Subunit-directed Monoclonal Antibody Targets Overexpressed Mucin1 in Breast Cancer. Theranostics 2018, 8, 78–91. [Google Scholar] [CrossRef]
- Rajabi, H.; Joshi, M.D.; Jin, C.; Ahmad, R.; Kufe, D. Androgen receptor regulates expression of the MUC1-C oncoprotein in human prostate cancer cells. Prostate 2011, 71, 1299–1308. [Google Scholar] [CrossRef]
- Krüger, M.; Kopp, S.; Wehland, M.; Bauer, J.; Baatout, S.; Moreels, M.; Egli, M.; Corydon, T.J.; Infanger, M.; Grimm, D. Growing blood vessels in space: Preparation studies of the SPHEROIDS project using related ground-based studies. Acta Astronaut. 2019, 159, 267–272. [Google Scholar] [CrossRef]
- Porowska, H.; Paszkiewicz-Gadek, A.; Wosek, J.; Wnuczko, K.; Rusak, M.; Szczepański, M. Expression of MUC1 mucin in human umbilical vein endothelial cells (HUVEC). Folia Histochem. Cytobiol. 2010, 48, 417–424. [Google Scholar] [CrossRef]
- Kufe, D.W. MUC1-C oncoprotein as a target in breast cancer: Activation of signaling pathways and therapeutic approaches. Oncogene 2013, 32, 1073–1081. [Google Scholar] [CrossRef] [PubMed]


| Cell Line | Drug | Main Findings | Reference |
|---|---|---|---|
| FTC-133 | Dexamethasone | Inhibition of spheroid formation. | [31] |
| MCF-7 | Dexamethasone | Reduced spheroid formation. | [63] |
| Rolipram | No effects. | ||
| Olaparib | No effects. | ||
| MCF-7 | PP2 | Inhibition of spheroid formation. | [64] |
| anti-E-cadherin | Increased spheroid formation. |
Disclaimer/Publisher’s Note: The statements, opinions and data contained in all publications are solely those of the individual author(s) and contributor(s) and not of MDPI and/or the editor(s). MDPI and/or the editor(s) disclaim responsibility for any injury to people or property resulting from any ideas, methods, instructions or products referred to in the content. |
© 2023 by the authors. Licensee MDPI, Basel, Switzerland. This article is an open access article distributed under the terms and conditions of the Creative Commons Attribution (CC BY) license (https://creativecommons.org/licenses/by/4.0/).
Share and Cite
Melnik, D.; Cortés-Sánchez, J.L.; Sandt, V.; Kahlert, S.; Kopp, S.; Grimm, D.; Krüger, M. Dexamethasone Selectively Inhibits Detachment of Metastatic Thyroid Cancer Cells during Random Positioning. Cancers 2023, 15, 1641. https://doi.org/10.3390/cancers15061641
Melnik D, Cortés-Sánchez JL, Sandt V, Kahlert S, Kopp S, Grimm D, Krüger M. Dexamethasone Selectively Inhibits Detachment of Metastatic Thyroid Cancer Cells during Random Positioning. Cancers. 2023; 15(6):1641. https://doi.org/10.3390/cancers15061641
Chicago/Turabian StyleMelnik, Daniela, José Luis Cortés-Sánchez, Viviann Sandt, Stefan Kahlert, Sascha Kopp, Daniela Grimm, and Marcus Krüger. 2023. "Dexamethasone Selectively Inhibits Detachment of Metastatic Thyroid Cancer Cells during Random Positioning" Cancers 15, no. 6: 1641. https://doi.org/10.3390/cancers15061641
APA StyleMelnik, D., Cortés-Sánchez, J. L., Sandt, V., Kahlert, S., Kopp, S., Grimm, D., & Krüger, M. (2023). Dexamethasone Selectively Inhibits Detachment of Metastatic Thyroid Cancer Cells during Random Positioning. Cancers, 15(6), 1641. https://doi.org/10.3390/cancers15061641