

Improving the Post-Operative Prediction of BCR-Free Survival Time with mRNA Variables and Machine Learning


Abstract
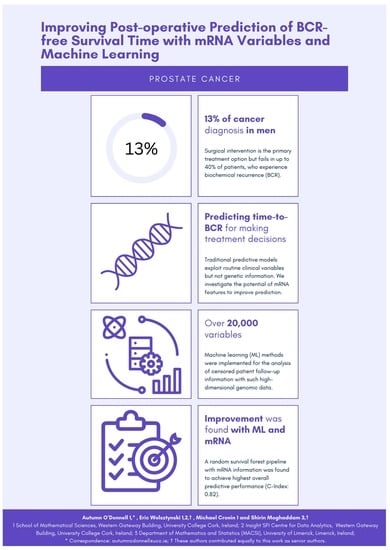
Simple Summary
Abstract
1. Introduction
2. Materials and Methods
2.1. Data
2.2. Statistical Analysis
2.3. Evaluation Framework
3. Results
3.1. Discrimination
3.2. Calibration
3.3. Prediction Performance
3.4. Model Stability and Feature Selection
4. Discussion
4.1. Key Findings
4.2. Other Markers of Interest
4.3. Model Performance and Key Feature Identification
5. Conclusions
Author Contributions
Funding
Data Availability Statement
Conflicts of Interest
Abbreviations
| BCR | Biochemical recurrence |
| mRNA | Messenger ribonucleic acid |
| RP | Radical prostatectomy |
| PSA | Prostate specific antigen |
| CPH | Cox proportional hazard |
| ECE | Extracapsular Extension |
| SVI | Seminal vesicle invasion |
| LNI | Lymph node involvement |
| MSKCC | Memorial Sloan Kettering Cancer Centre |
References
- Sanda, M.G.; Cadeddu, J.A.; Kirkby, E.; Chen, R.C.; Crispino, T.; Fontanarosa, J.; Freedland, S.J.; Greene, K.; Klotz, L.H.; Makarov, D.V.; et al. Clinically localized prostate cancer: AUA/ASTRO/SUO guideline. Part II: Recommended approaches and details of specific care options. J. Urol. 2018, 199, 990–997. [Google Scholar] [CrossRef] [PubMed]
- Wang, J.; Xia, H.H.X.; Zhang, Y.; Zhang, L. Trends in treatments for prostate cancer in the United States, 2010–2015. Am. J. Cancer Res. 2021, 11, 2351. [Google Scholar] [PubMed]
- John Hopkins Medicine. Prostate Cancer Prognosis. 2022. Available online: https://www.hopkinsmedicine.org/health/conditions-and-diseases/prostate-cancer/prostate-cancer-prognosis (accessed on 30 November 2022).
- Tourinho-Barbosa, R.; Srougi, V.; Nunes-Silva, I.; Baghdadi, M.; Rembeyo, G.; Eiffel, S.S.; Barret, E.; Rozet, F.; Galiano, M.; Cathelineau, X.; et al. Biochemical recurrence after radical prostatectomy: What does it mean? Int. Braz. Urol. 2018, 44, 14–21. [Google Scholar] [CrossRef]
- Walz, J.; Chun, F.K.H.; Klein, E.A.; Reuther, A.; Saad, F.; Graefen, M.; Huland, H.; Karakiewicz, P.I. Nomogram predicting the probability of early recurrence after radical prostatectomy for prostate cancer. J. Urol. 2009, 181, 601–608. [Google Scholar] [CrossRef] [PubMed]
- Shariat, S.F.; Karakiewicz, P.I.; Roehrborn, C.G.; Kattan, M.W. An updated catalog of prostate cancer predictive tools. Cancer 2008, 113, 3075–3099. [Google Scholar] [CrossRef] [PubMed]
- Moghaddam, S.; Jalali, A.; O’Neill, A.; Murphy, L.; Gorman, L.; Reilly, A.M.; Heffernan, Á.; Lynch, T.; Power, R.; O’malley, K.J.; et al. Integrating serum biomarkers into prediction models for biochemical recurrence following radical prostatectomy. Cancers 2021, 13, 4162. [Google Scholar] [CrossRef]
- Diblasio, C.J.; Kattan, M.W. Use of nomograms to predict the risk of disease recurrence after definitive local therapy for prostate cancer. Urology 2003, 62, 9–18. [Google Scholar] [CrossRef]
- Memorial Sloan Kettering Cancer Center. Prostate Cancer Nomograms. 2022. Available online: https://www.mskcc.org/nomograms/prostate (accessed on 30 November 2022).
- Kattan, M.W.; Wheeler, T.M.; Scardino, P.T. Postoperative nomogram for disease recurrence after radical prostatectomy for prostate cancer. J. Clin. Oncol. 1999, 17, 1499. [Google Scholar] [CrossRef]
- Stephenson, A.J.; Scardino, P.T.; Eastham, J.A.; Bianco Jr, F.J.; Dotan, Z.A.; DiBlasio, C.J.; Reuther, A.; Klein, E.A.; Kattan, M.W. Postoperative nomogram predicting the 10-year probability of prostate cancer recurrence after radical prostatectomy. J. Clin. Oncol. 2005, 23, 7005. [Google Scholar] [CrossRef]
- Kattan, M.W.; Vickers, A.J.; Yu, C.; Bianco, F.J.; Cronin, A.M.; Eastham, J.A.; Klein, E.A.; Reuther, A.M.; Edson Pontes, J.; Scardino, P.T. Preoperative and postoperative nomograms incorporating surgeon experience for clinically localized prostate cancer. Cancer 2009, 115, 1005–1010. [Google Scholar] [CrossRef]
- Cox, D.R. Regression models and life-tables. J. R. Stat. Soc. Ser. (Methodol.) 1972, 34, 187–202. [Google Scholar] [CrossRef]
- Kattan, M.W.; Eastham, J.A.; Stapleton, A.M.; Wheeler, T.M.; Scardino, P.T. A preoperative nomogram for disease recurrence following radical prostatectomy for prostate cancer. JNCI J. Natl. Cancer Inst. 1998, 90, 766–771. [Google Scholar] [CrossRef] [PubMed]
- Tibshirani, R. The lasso method for variable selection in the Cox model. Stat. Med. 1997, 16, 385–395. [Google Scholar] [CrossRef]
- Sohn, I.; Kim, J.; Jung, S.H.; Park, C. Gradient lasso for Cox proportional hazards model. Bioinformatics 2009, 25, 1775–1781. [Google Scholar] [CrossRef]
- Joffe, E.; Coombes, K.R.; Qiu, Y.H.; Yoo, S.Y.; Zhang, N.; Bernstam, E.V.; Kornblau, S.M. Survival prediction in high dimensional datasets–Comparative evaluation of lasso regularization and random survival forests. Blood 2013, 122, 1728. [Google Scholar] [CrossRef]
- De Bin, R. Boosting in Cox regression: A comparison between the likelihood-based and the model-based approaches with focus on the R-packages CoxBoost and mboost. Comput. Stat. 2016, 31, 513–531. [Google Scholar] [CrossRef]
- Binder, H.; Schumacher, M. Allowing for mandatory covariates in boosting estimation of sparse high-dimensional survival models. BMC Bioinform. 2008, 9, 14. [Google Scholar] [CrossRef]
- Ishwaran, H.; Kogalur, U.B.; Blackstone, E.H.; Lauer, M.S. Random survival forests. Ann. Appl. Stat. 2008, 2, 841–860. [Google Scholar] [CrossRef]
- Sager, M.; Yeat, N.C.; Pajaro-Van der Stadt, S.; Lin, C.; Ren, Q.; Lin, J. Transcriptomics in cancer diagnostics: Developments in technology, clinical research and commercialization. Expert Rev. Mol. Diagn. 2015, 15, 1589–1603. [Google Scholar] [CrossRef]
- Erho, N.; Crisan, A.; Vergara, I.A.; Mitra, A.P.; Ghadessi, M.; Buerki, C.; Bergstralh, E.J.; Kollmeyer, T.; Fink, S.; Haddad, Z.; et al. Discovery and validation of a prostate cancer genomic classifier that predicts early metastasis following radical prostatectomy. PLoS ONE 2013, 8, e66855. [Google Scholar] [CrossRef]
- Cuzick, J.; Berney, D.; Fisher, G.; Mesher, D.; Møller, H.; Reid, J.; Perry, M.; Park, J.; Younus, A.; Gutin, A.; et al. Prognostic value of a cell cycle progression signature for prostate cancer death in a conservatively managed needle biopsy cohort. Br. J. Cancer 2012, 106, 1095–1099. [Google Scholar] [CrossRef] [PubMed]
- Klein, E.A.; Cooperberg, M.R.; Magi-Galluzzi, C.; Simko, J.P.; Falzarano, S.M.; Maddala, T.; Chan, J.M.; Li, J.; Cowan, J.E.; Tsiatis, A.C.; et al. A 17-gene assay to predict prostate cancer aggressiveness in the context of Gleason grade heterogeneity, tumor multifocality, and biopsy undersampling. Eur. Urol. 2014, 66, 550–560. [Google Scholar] [CrossRef]
- Taylor, B.S.; Schultz, N.; Hieronymus, H.; Gopalan, A.; Xiao, Y.; Carver, B.S.; Arora, V.K.; Kaushik, P.; Cerami, E.; Reva, B.; et al. Integrative genomic profiling of human prostate cancer. Cancer Cell 2010, 18, 11–22. [Google Scholar] [CrossRef] [PubMed]
- Kryvenko, O.N.; Epstein, J.I. Prostate cancer grading: A decade after the 2005 modified Gleason grading system. Arch. Pathol. Lab. Med. 2016, 140, 1140–1152. [Google Scholar] [CrossRef]
- Wittekind, C.; Asamura, H.; Sobin, L.H. TNM Atlas: Illustrated Guide to the TNM Classification of Malignant Tumours; Wiley-Blackwell: Hoboken, NJ, USA, 2014. [Google Scholar]
- Simon, N.; Friedman, J.; Hastie, T.; Tibshirani, R. Regularization paths for Cox’s proportional hazards model via coordinate descent. J. Stat. Softw. 2011, 39, 1. [Google Scholar] [CrossRef]
- Hothorn, T.; Buehlmann, P.; Kneib, T.; Schmid, M.; Hofner, B. mboost: Model-Based Boosting; R Package Version 2.9-7; 2022. Available online: https://cran.r-project.org/package=mboost (accessed on 30 January 2023).
- Goh, L.; Song, Q.; Kasabov, N. A novel feature selection method to improve classification of gene expression data. In Proceedings of the Second Conference on Asia-Pacific Bioinformatics, Dunedin, New Zealand, 18–22 January 2004; Volume 29, pp. 161–166. [Google Scholar]
- Benjamini, Y.; Hochberg, Y. Controlling the false discovery rate: A practical and powerful approach to multiple testing. J. R. Stat. Soc. Ser. (Methodol.) 1995, 57, 289–300. [Google Scholar] [CrossRef]
- Beer, D.G.; Kardia, S.L.; Huang, C.C.; Giordano, T.J.; Levin, A.M.; Misek, D.E.; Lin, L.; Chen, G.; Gharib, T.G.; Thomas, D.G.; et al. Gene-expression profiles predict survival of patients with lung adenocarcinoma. Nat. Med. 2002, 8, 816–824. [Google Scholar] [CrossRef]
- Witten, D.M.; Tibshirani, R. Survival analysis with high-dimensional covariates. Stat. Methods Med. Res. 2010, 19, 29–51. [Google Scholar] [CrossRef]
- Hastie, T.; R, T.; J, F. The Elements of Statistical Learning; Springer: Berlin, Germany, 2009. [Google Scholar]
- Harrell, F.E.; Califf, R.M.; Pryor, D.B.; Lee, K.L.; Rosati, R.A. Evaluating the yield of medical tests. JAMA 1982, 247, 2543–2546. [Google Scholar] [CrossRef]
- Hanley, J.A.; McNeil, B.J. The meaning and use of the area under a receiver operating characteristic (ROC) curve. Radiology 1982, 143, 29–36. [Google Scholar] [CrossRef]
- R Core Team. R: A Language and Environment for Statistical Computing; R Foundation for Statistical Computing: Vienna, Austria, 2021. [Google Scholar]
- Friedman, J.; Hastie, T.; Tibshirani, R. Regularization paths for generalized linear models via coordinate descent. J. Stat. Softw. 2010, 33, 1–22. [Google Scholar] [CrossRef] [PubMed]
- Ishwaran, H.; Kogalur, U. Fast Unified Random Forests for Survival, Regression, and Classification (RF-SRC); R Package Version 2.13.0; 2021. Available online: https://github.com/kogalur/randomForestSRC/issues/ (accessed on 30 January 2023).
- Harrell, F.E., Jr.; Lee, K.L.; Mark, D.B. Multivariable prognostic models: Issues in developing models, evaluating assumptions and adequacy, and measuring and reducing errors. Stat. Med. 1996, 15, 361–387. [Google Scholar] [CrossRef]
- Remmers, S.; Verbeek, J.F.; Nieboer, D.; van der Kwast, T.; Roobol, M.J. Predicting biochemical recurrence and prostate cancer-specific mortality after radical prostatectomy: Comparison of six prediction models in a cohort of patients with screening-and clinically detected prostate cancer. BJU Int. 2019, 124, 635–642. [Google Scholar] [CrossRef]
- Royston, P. Tools for checking calibration of a Cox model in external validation: Prediction of population-averaged survival curves based on risk groups. Stata J. 2015, 15, 275–291. [Google Scholar] [CrossRef]
- Bewick, V.; Cheek, L.; Ball, J. Statistics review 13: Receiver operating characteristic curves. Crit. Care 2004, 8, 1–5. [Google Scholar]
- Vickers, A.J.; Elkin, E.B. Decision curve analysis: A novel method for evaluating prediction models. Med. Decis. Mak. 2006, 26, 565–574. [Google Scholar] [CrossRef]
- Khaire, U.M.; Dhanalakshmi, R. Stability of feature selection algorithm: A review. J. King Saud-Univ.-Comput. Inf. Sci. 2022, 34, 1060–1073. [Google Scholar] [CrossRef]
- Davis, C.A.; Gerick, F.; Hintermair, V.; Friedel, C.C.; Fundel, K.; Küffner, R.; Zimmer, R. Reliable gene signatures for microarray classification: Assessment of stability and performance. Bioinformatics 2006, 22, 2356–2363. [Google Scholar] [CrossRef]
- Bommert, A.; Lang, M. stabm: Stability measures for feature selection. J. Open Source Softw. 2021, 6, 3010. [Google Scholar] [CrossRef]
- Breiman, L. Out-of-bag estimation. Mach. Learn. 1996, 26, 123–140. [Google Scholar] [CrossRef]
- Wang, Y.; Ledet, R.J.; Imberg-Kazdan, K.; Logan, S.K.; Garabedian, M.J. Dynein axonemal heavy chain 8 promotes androgen receptor activity and associates with prostate cancer progression. Oncotarget 2016, 7, 49268. [Google Scholar] [CrossRef]
- Pan, K.F.; Lee, W.J.; Chou, C.C.; Yang, Y.C.; Chang, Y.C.; Chien, M.H.; Hsiao, M.; Hua, K.T. Direct interaction of β-catenin with nuclear ESM1 supports stemness of metastatic prostate cancer. EMBO J. 2021, 40, e105450. [Google Scholar] [CrossRef]
- Jeffers, A.; Sochat, V.; Kattan, M.W.; Yu, C.; Melcon, E.; Yamoah, K.; Rebbeck, T.R.; Whittemore, A.S. Predicting prostate cancer recurrence after radical prostatectomy. Prostate 2017, 77, 291–298. [Google Scholar] [CrossRef]
- Liu, C.; Miyata, H.; Gao, Y.; Sha, Y.; Tang, S.; Xu, Z.; Whitfield, M.; Patrat, C.; Wu, H.; Dulioust, E.; et al. Bi-allelic DNAH8 variants lead to multiple morphological abnormalities of the sperm flagella and primary male infertility. Am. J. Hum. Genet. 2020, 107, 330–341. [Google Scholar] [CrossRef]
- Song, F.; Zhang, Y.; Pan, Z.; Hu, X.; Yi, Y.; Zheng, X.; Wei, H.; Huang, P. Identification of novel key genes associated with the metastasis of prostate cancer based on bioinformatics prediction and validation. Cancer Cell Int. 2021, 21, 1–16. [Google Scholar] [CrossRef]
- Lai, C.Y.; Chen, C.M.; Hsu, W.H.; Hsieh, Y.H.; Liu, C.J. Overexpression of endothelial cell-specific molecule 1 correlates with Gleason score and expression of androgen receptor in prostate carcinoma. Int. J. Med. Sci. 2017, 14, 1263. [Google Scholar] [CrossRef]
- Bahig, H.; Taussky, D.; Delouya, G.; Nadiri, A.; Gagnon-Jacques, A.; Bodson-Clermont, P.; Soulieres, D. Neutrophil count is associated with survival in localized prostate cancer. BMC Cancer 2015, 15, 594. [Google Scholar] [CrossRef]
- Jang, W.; Cho, K.; Kim, K.; Yoon, C.; Kang, Y.; Lee, J.; Ham, W.; Rha, K.; Hong, S.; Choi, Y. Prognostic impact of preoperative neutrophil-to-lymphocyte ratio after radical prostatectomy in localized prostate cancer. Prostate Cancer Prostatic Dis. 2016, 19, 298–304. [Google Scholar] [CrossRef]
- Kwon, Y.S.; Han, C.S.; Yu, J.W.; Kim, S.; Modi, P.; Davis, R.; Park, J.H.; Lee, P.; Ha, Y.S.; Kim, W.J.; et al. Neutrophil and lymphocyte counts as clinical markers for stratifying low-risk prostate cancer. Clin. Genitourin. Cancer 2016, 14, e1–e8. [Google Scholar] [CrossRef]
- Lee, H.; Jeong, S.J.; Hong, S.K.; Byun, S.S.; Lee, S.E.; Oh, J.J. High preoperative neutrophil–lymphocyte ratio predicts biochemical recurrence in patients with localized prostate cancer after radical prostatectomy. World J. Urol. 2016, 34, 821–827. [Google Scholar] [CrossRef]
- Poyet, C.; Adank, J.P.; Keller, E.; Mortezavi, A.; Rabgang, T.; Pfister, B.; Sulser, T.; Hermanns, T. Mp66-05 pretreatment systemic inflamatory response parameters do not predict the outcome in men with prostate cancer undergoing radical prostatectomy. J. Urol. 2015, 193, e817. [Google Scholar] [CrossRef]
- Sharma, V.; Cockerill, P.A.; Viers, B.R.; Rangel, L.J.; Carlson, R.E.; Karnes, R.J.; Tollefson, M.K. Mp6-05 the association of preoperative neutrophil to lymphocyte ratio with oncologic outcomes following radical prostatectomy for prostate cancer. J. Urol. 2015, 193, e55–e56. [Google Scholar] [CrossRef]
- Zhang, G.M.; Zhu, Y.; Ma, X.C.; Qin, X.J.; Wan, F.N.; Dai, B.; Sun, L.J.; Ye, D.W. Pretreatment neutrophil-to-lymphocyte ratio: A predictor of advanced prostate cancer and biochemical recurrence in patients receiving radical prostatectomy. Medicine 2015, 94. [Google Scholar] [CrossRef] [PubMed]
- Hao, L.; Kim, J.; Kwon, S.; Ha, I.D. Deep learning-based survival analysis for high-dimensional survival data. Mathematics 2021, 9, 1244. [Google Scholar] [CrossRef]
- Gade, S.; Porzelius, C.; Fälth, M.; Brase, J.C.; Wuttig, D.; Kuner, R.; Binder, H.; Sültmann, H.; Beißbarth, T. Graph based fusion of miRNA and mRNA expression data improves clinical outcome prediction in prostate cancer. BMC Bioinform. 2011, 12, 488. [Google Scholar] [CrossRef]


| Variable | N | % |
|---|---|---|
| BCR-free Survival | ||
| Censored | 135 | 72 |
| BCR | 52 | 28 |
| Ethnicity | ||
| White | 147 | 79 |
| Black | 30 | 16 |
| Asian | 4 | 2 |
| Unknown | 6 | 3 |
| Pathological Gleason Score | ||
| 6 | 52 | 28 |
| 7 | 103 | 55 |
| 8 | 17 | 9 |
| 9 | 15 | 8 |
| Extracapsular Extension (ECE) | ||
| Absent | 52 | 28 |
| Present | 135 | 72 |
| Seminal Vesicle Invasion (SVI) | ||
| Negative | 156 | 83 |
| Positive | 31 | 17 |
| Lymph Node Involvement (LNI) | ||
| Normal | 140 | 75 |
| Abnormal | 19 | 10 |
| Not Done | 28 | 15 |
| Surgical Marginal Status (SMS) | ||
| Negative | 137 | 73 |
| Positive | 50 | 27 |
| Model | C-Index | 95% Confidence Interval |
|---|---|---|
| Memorial Sloan Kettering (MSKCC) | 0.770 | (0.675, 0.844) |
| Clinical Variables Only | ||
| Cox | 0.798 | (0.724, 0.857) |
| LASSO | 0.761 | (0.710, 0.824) |
| Boosted | 0.770 | (0.709, 0.829) |
| RSF | 0.795 | (0.727, 0.852) |
| Clinical Variable and Correlation Prefiltered mRNA variables | ||
| Cox | 0.828 | (0.720, 0.909) |
| LASSO | 0.762 | (0.696, 0.826) |
| Boosted | 0.816 | (0.757, 0.866) |
| RSF | 0.749 | (0.695, 0.811) |
| Clinical Variables and Univariate Cox Feature Selected mRNA variables | ||
| Cox | 0.765 | (0.688, 0.827) |
| LASSO | 0.768 | (0.703, 0.835) |
| Boosted | 0.798 | (0.737, 0.845) |
| RSF | 0.782 | (0.730, 0.846) |
| Clinical Variables and Correlation Prefiltered and Univariate Cox Feature Selected mRNA variables | ||
| Cox | 0.792 | (0.671, 0.865) |
| LASSO | 0.763 | (0.464, 0.918) |
| Boosted | 0.814 | (0.753, 0.863) |
| RSF | 0.821 | (0.747, 0.874) |
| Mean | Median | SD | CoV | Overall | |
|---|---|---|---|---|---|
| Clinical-only | |||||
| Cox | 4.55 | 5 | 1.250 | 27.5% | 8 |
| LASSO | 3.51 | 3 | 1.541 | 43.9% | 14 |
| Boosted | 5.10 | 5 | 0.870 | 17.1% | 14 |
| RSF | 4.96 | 5 | 1.524 | 30.7% | 8 |
| Top performing pipelines | |||||
| Cox | 9.46 | 10 | 0.926 | 9.8% | 623 |
| LASSO | 11.88 | 12 | 3.891 | 32.8% | 343 |
| Boosted | 14.98 | 15 | 3.052 | 20.4% | 323 |
| RSF | 17.85 | 16 | 9.057 | 50.7 % | 335 |
| Pathological Gleason Sum Score | LNI | SVI | PSA | DNAH8 | ESM1 | |
|---|---|---|---|---|---|---|
| Cox | 56% | 16% | 5% | 4% | 9% | 10% |
| LASSO | 60% | 9% | 64% | 34% | 55% | 29% |
| Boosted | 67% | 2% | 65% | 34% | 64% | 62% |
| RSF | 86% | 88% | 31% | 62% | 59% | 50% |
Disclaimer/Publisher’s Note: The statements, opinions and data contained in all publications are solely those of the individual author(s) and contributor(s) and not of MDPI and/or the editor(s). MDPI and/or the editor(s) disclaim responsibility for any injury to people or property resulting from any ideas, methods, instructions or products referred to in the content. |
© 2023 by the authors. Licensee MDPI, Basel, Switzerland. This article is an open access article distributed under the terms and conditions of the Creative Commons Attribution (CC BY) license (https://creativecommons.org/licenses/by/4.0/).
Share and Cite
O’Donnell, A.; Wolsztynski, E.; Cronin, M.; Moghaddam, S. Improving the Post-Operative Prediction of BCR-Free Survival Time with mRNA Variables and Machine Learning. Cancers 2023, 15, 1276. https://doi.org/10.3390/cancers15041276
O’Donnell A, Wolsztynski E, Cronin M, Moghaddam S. Improving the Post-Operative Prediction of BCR-Free Survival Time with mRNA Variables and Machine Learning. Cancers. 2023; 15(4):1276. https://doi.org/10.3390/cancers15041276
Chicago/Turabian StyleO’Donnell, Autumn, Eric Wolsztynski, Michael Cronin, and Shirin Moghaddam. 2023. "Improving the Post-Operative Prediction of BCR-Free Survival Time with mRNA Variables and Machine Learning" Cancers 15, no. 4: 1276. https://doi.org/10.3390/cancers15041276
APA StyleO’Donnell, A., Wolsztynski, E., Cronin, M., & Moghaddam, S. (2023). Improving the Post-Operative Prediction of BCR-Free Survival Time with mRNA Variables and Machine Learning. Cancers, 15(4), 1276. https://doi.org/10.3390/cancers15041276