
Taxifolin Inhibits the Growth of Non-Small-Cell Lung Cancer via Downregulating Genes Displaying Novel and Robust Associations with Immune Evasion Factors

 and
and 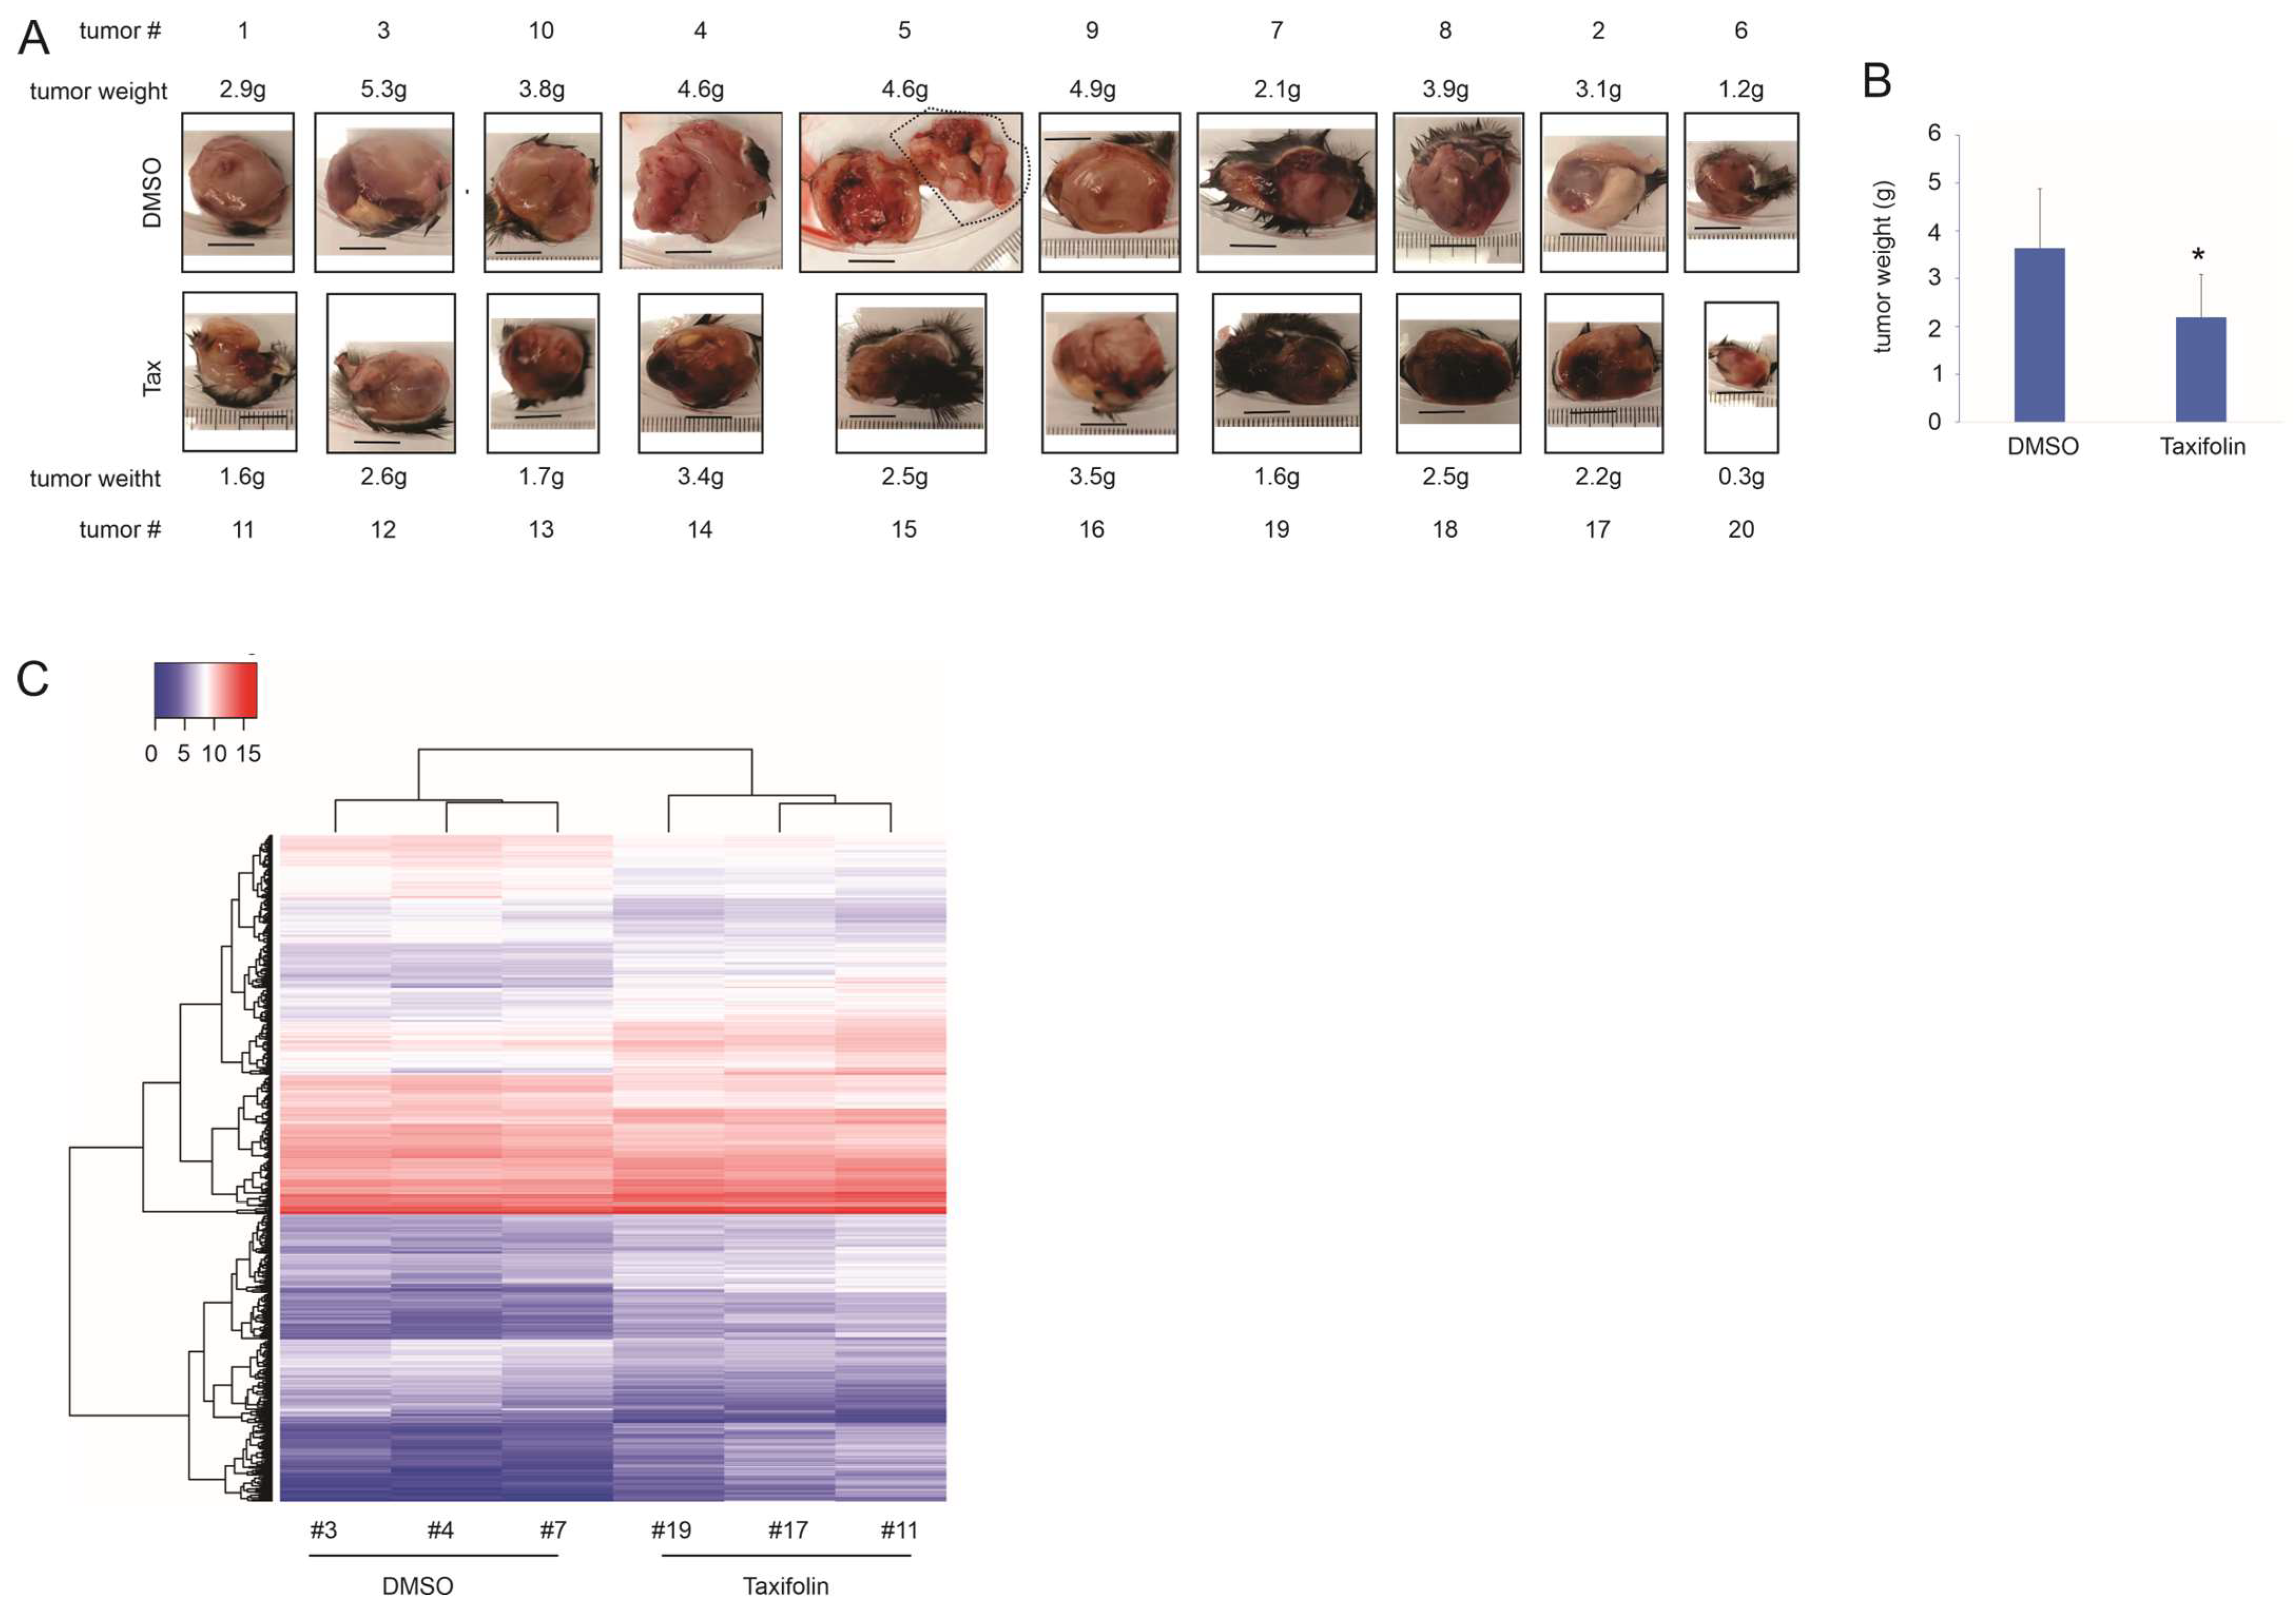
Abstract
:Simple Summary
Abstract
1. Introduction
2. Materials and Methods
2.1. Data Sources
2.2. Programs and Websites
2.3. Signature Score Assignment for Individual Tumors
2.4. Generation of LL2 Tumors and Taxifolin Treatment
2.5. RNA Sequencing Analysis
2.6. Immunohistochemistry (IHC)
2.7. Statistical Analysis
3. Results
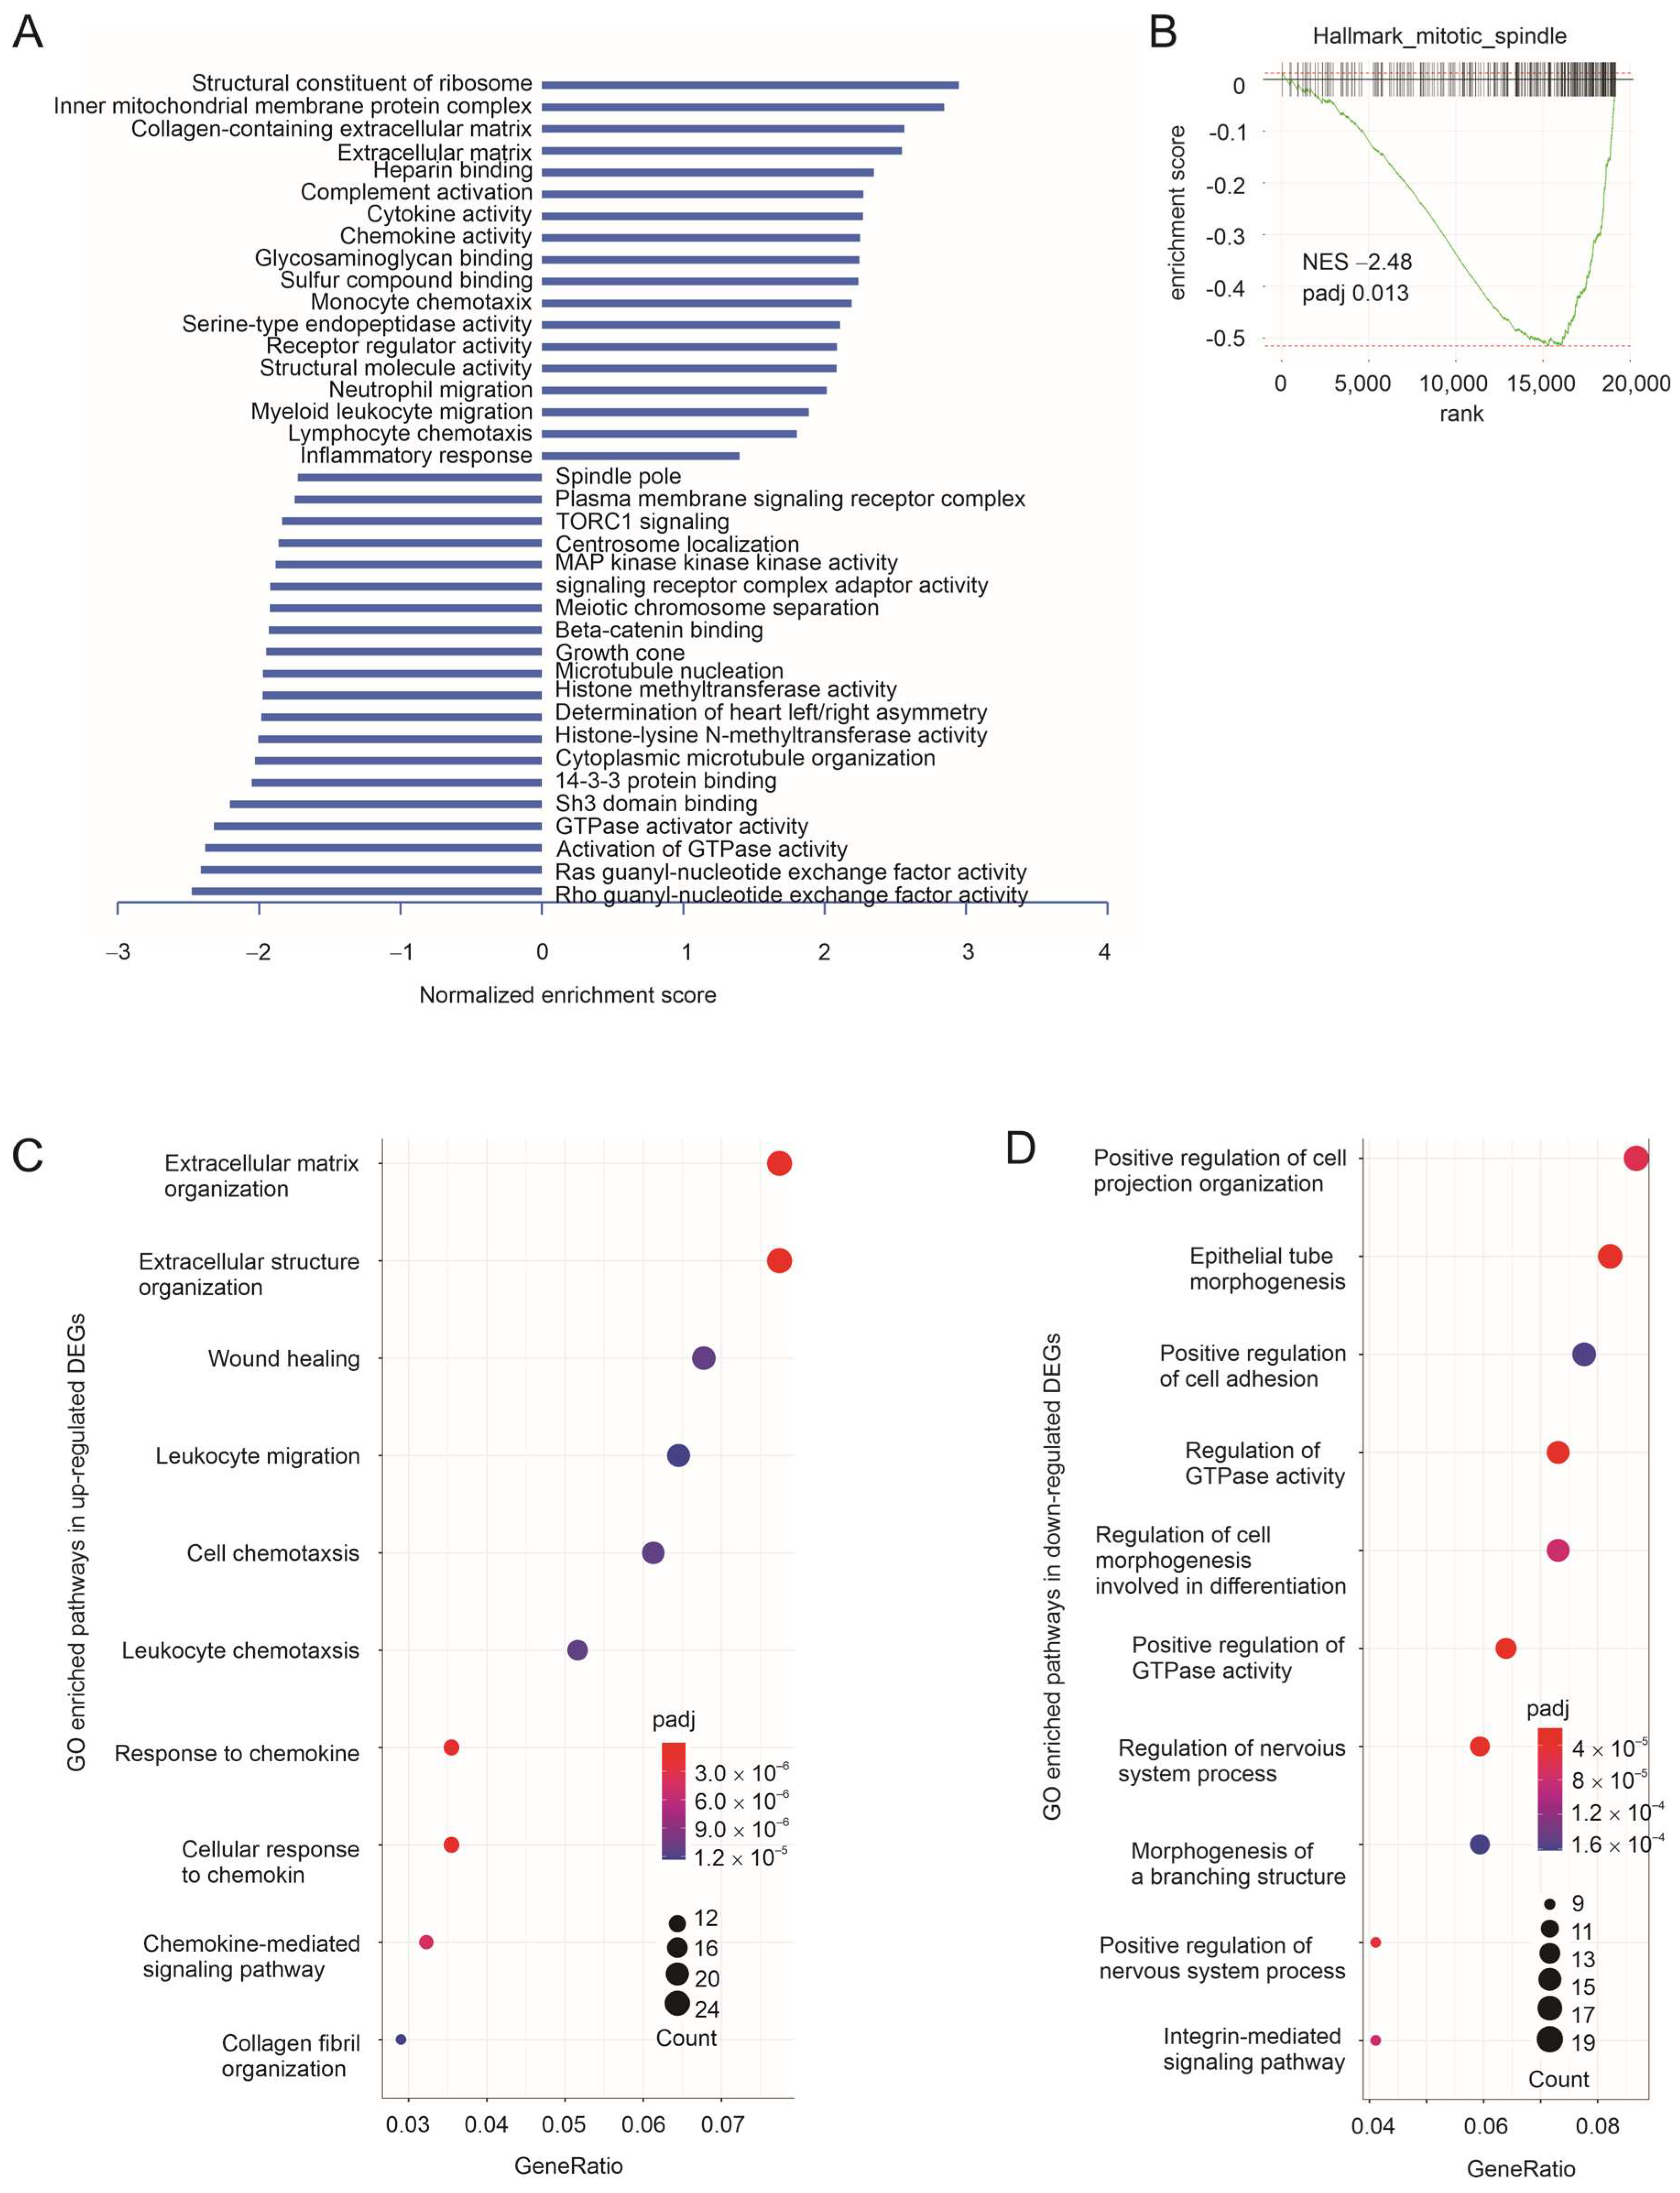
3.1. Taxifolin Inhibits Lung Cancer Growth with a Network Action
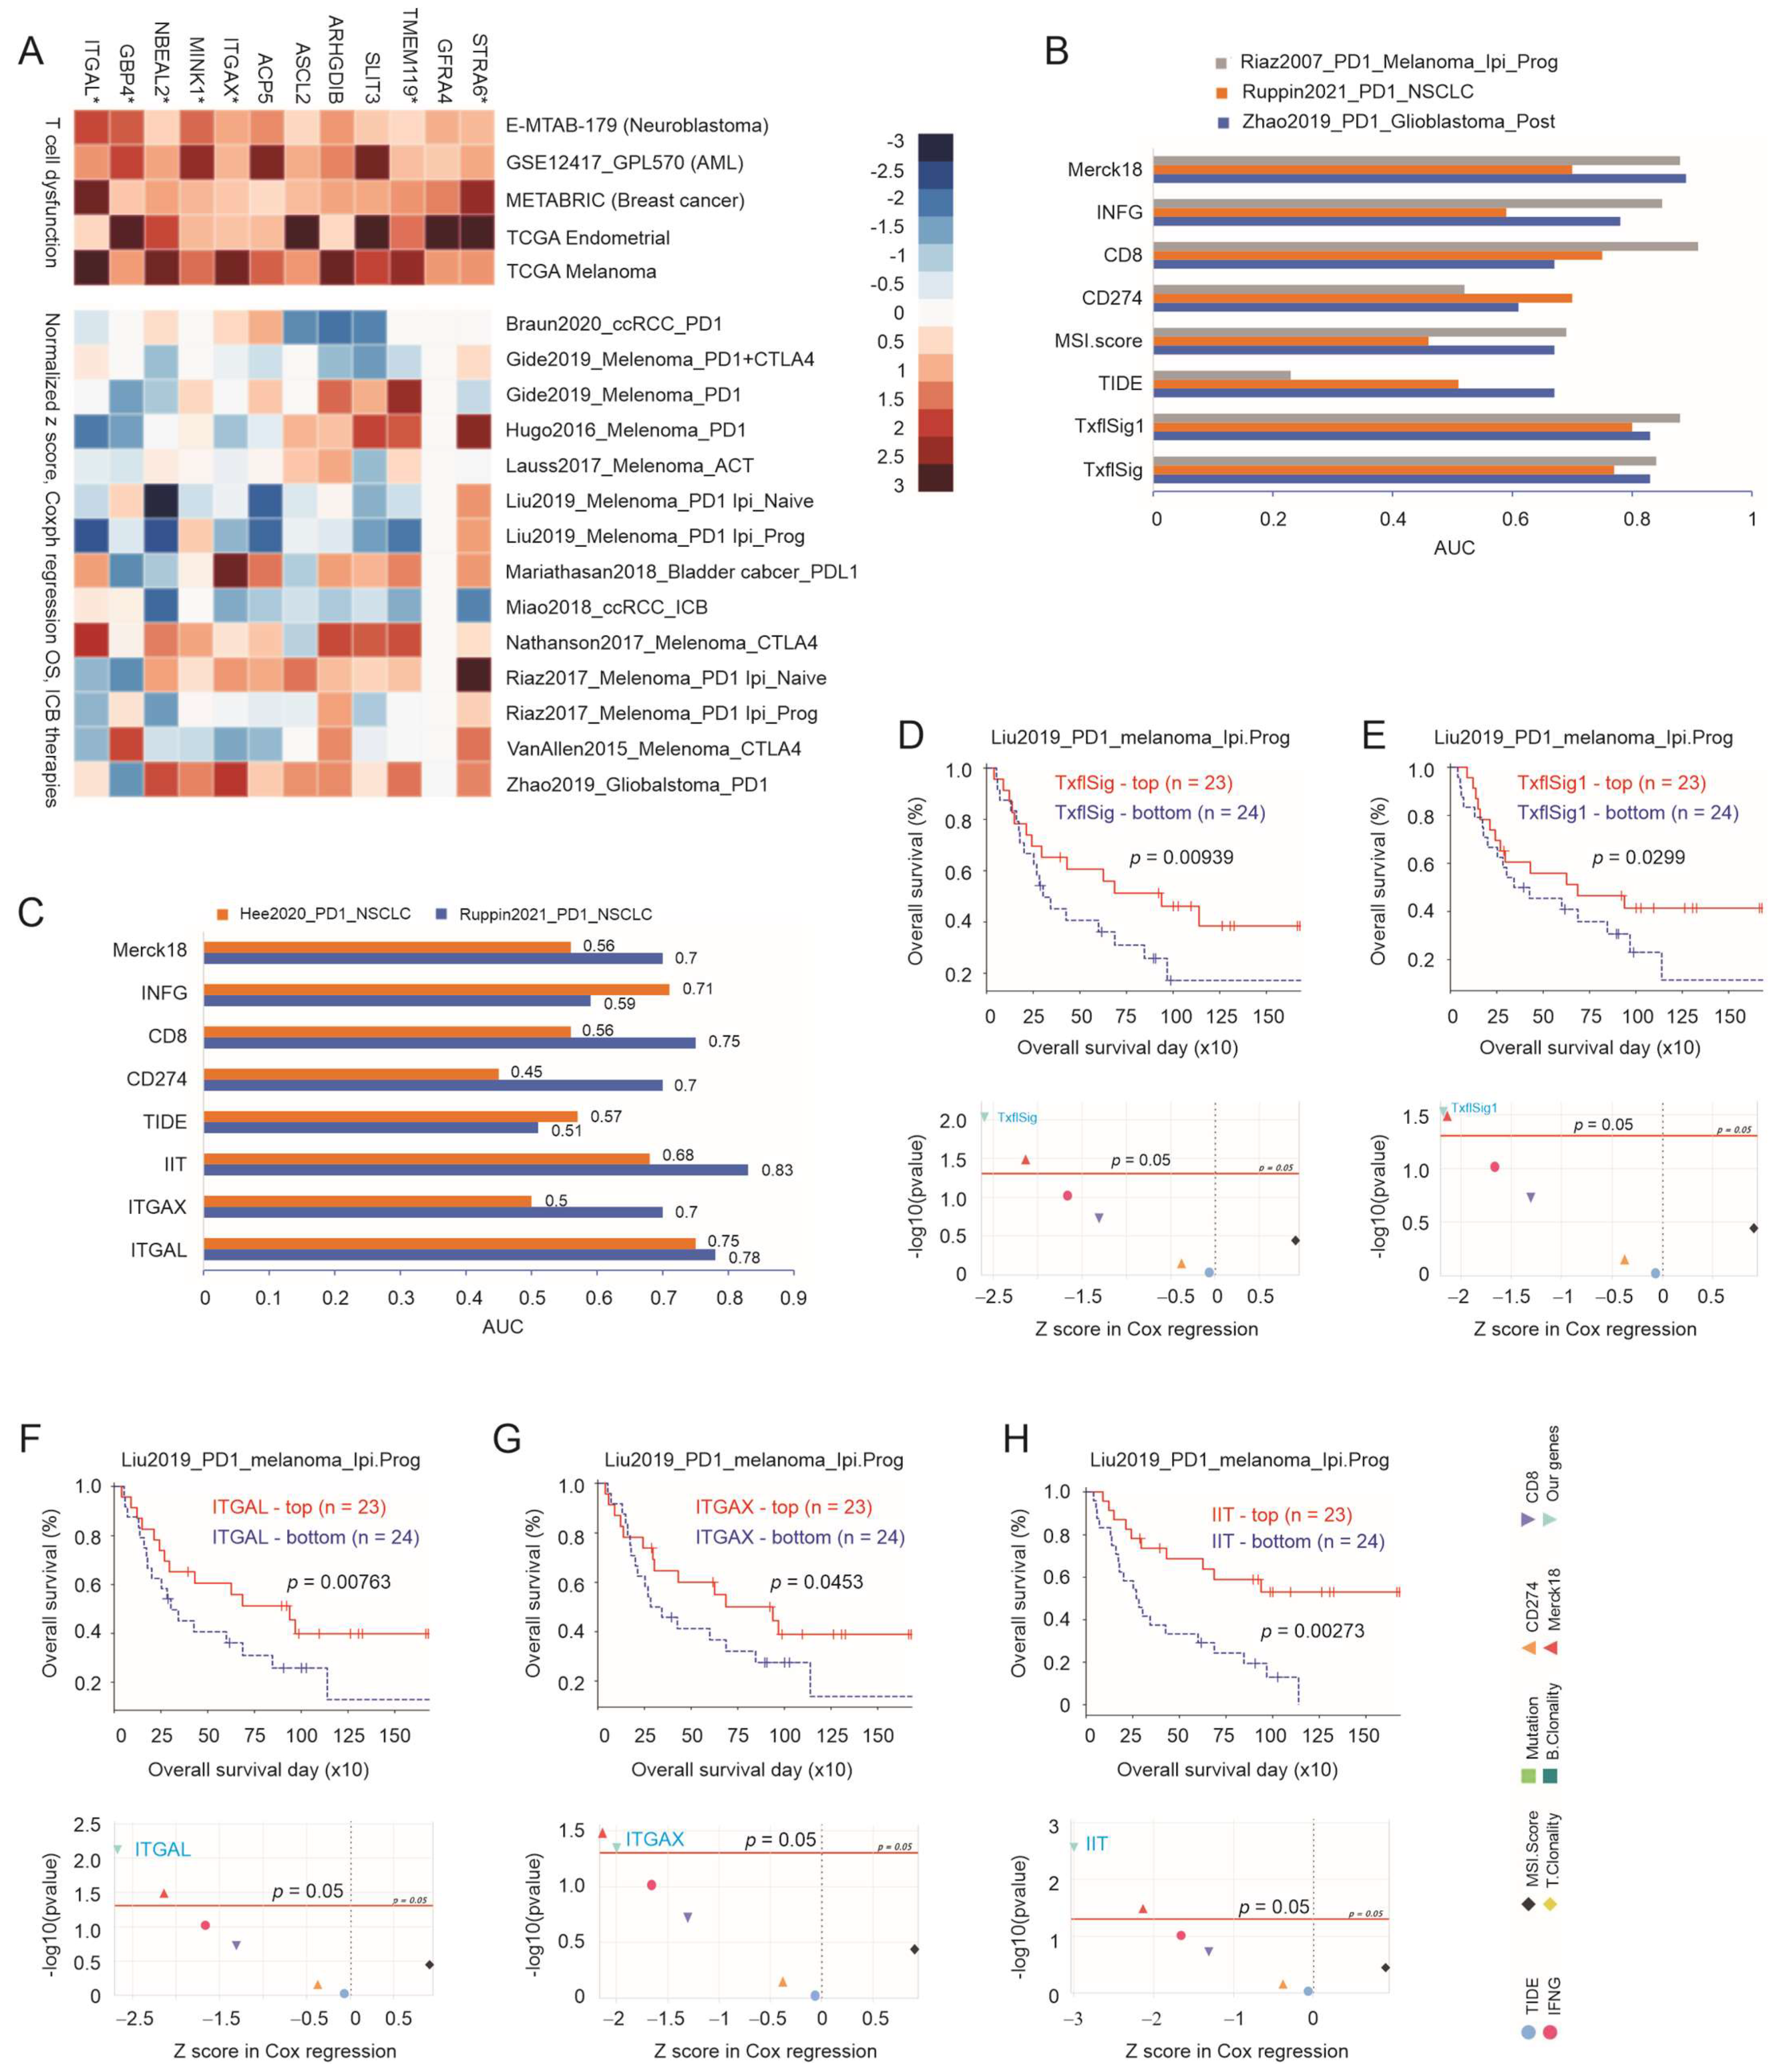
3.2. The Immune Component of Taxifolin-Induced DEGs in Predicting NSCLC Response to ICB Therapy
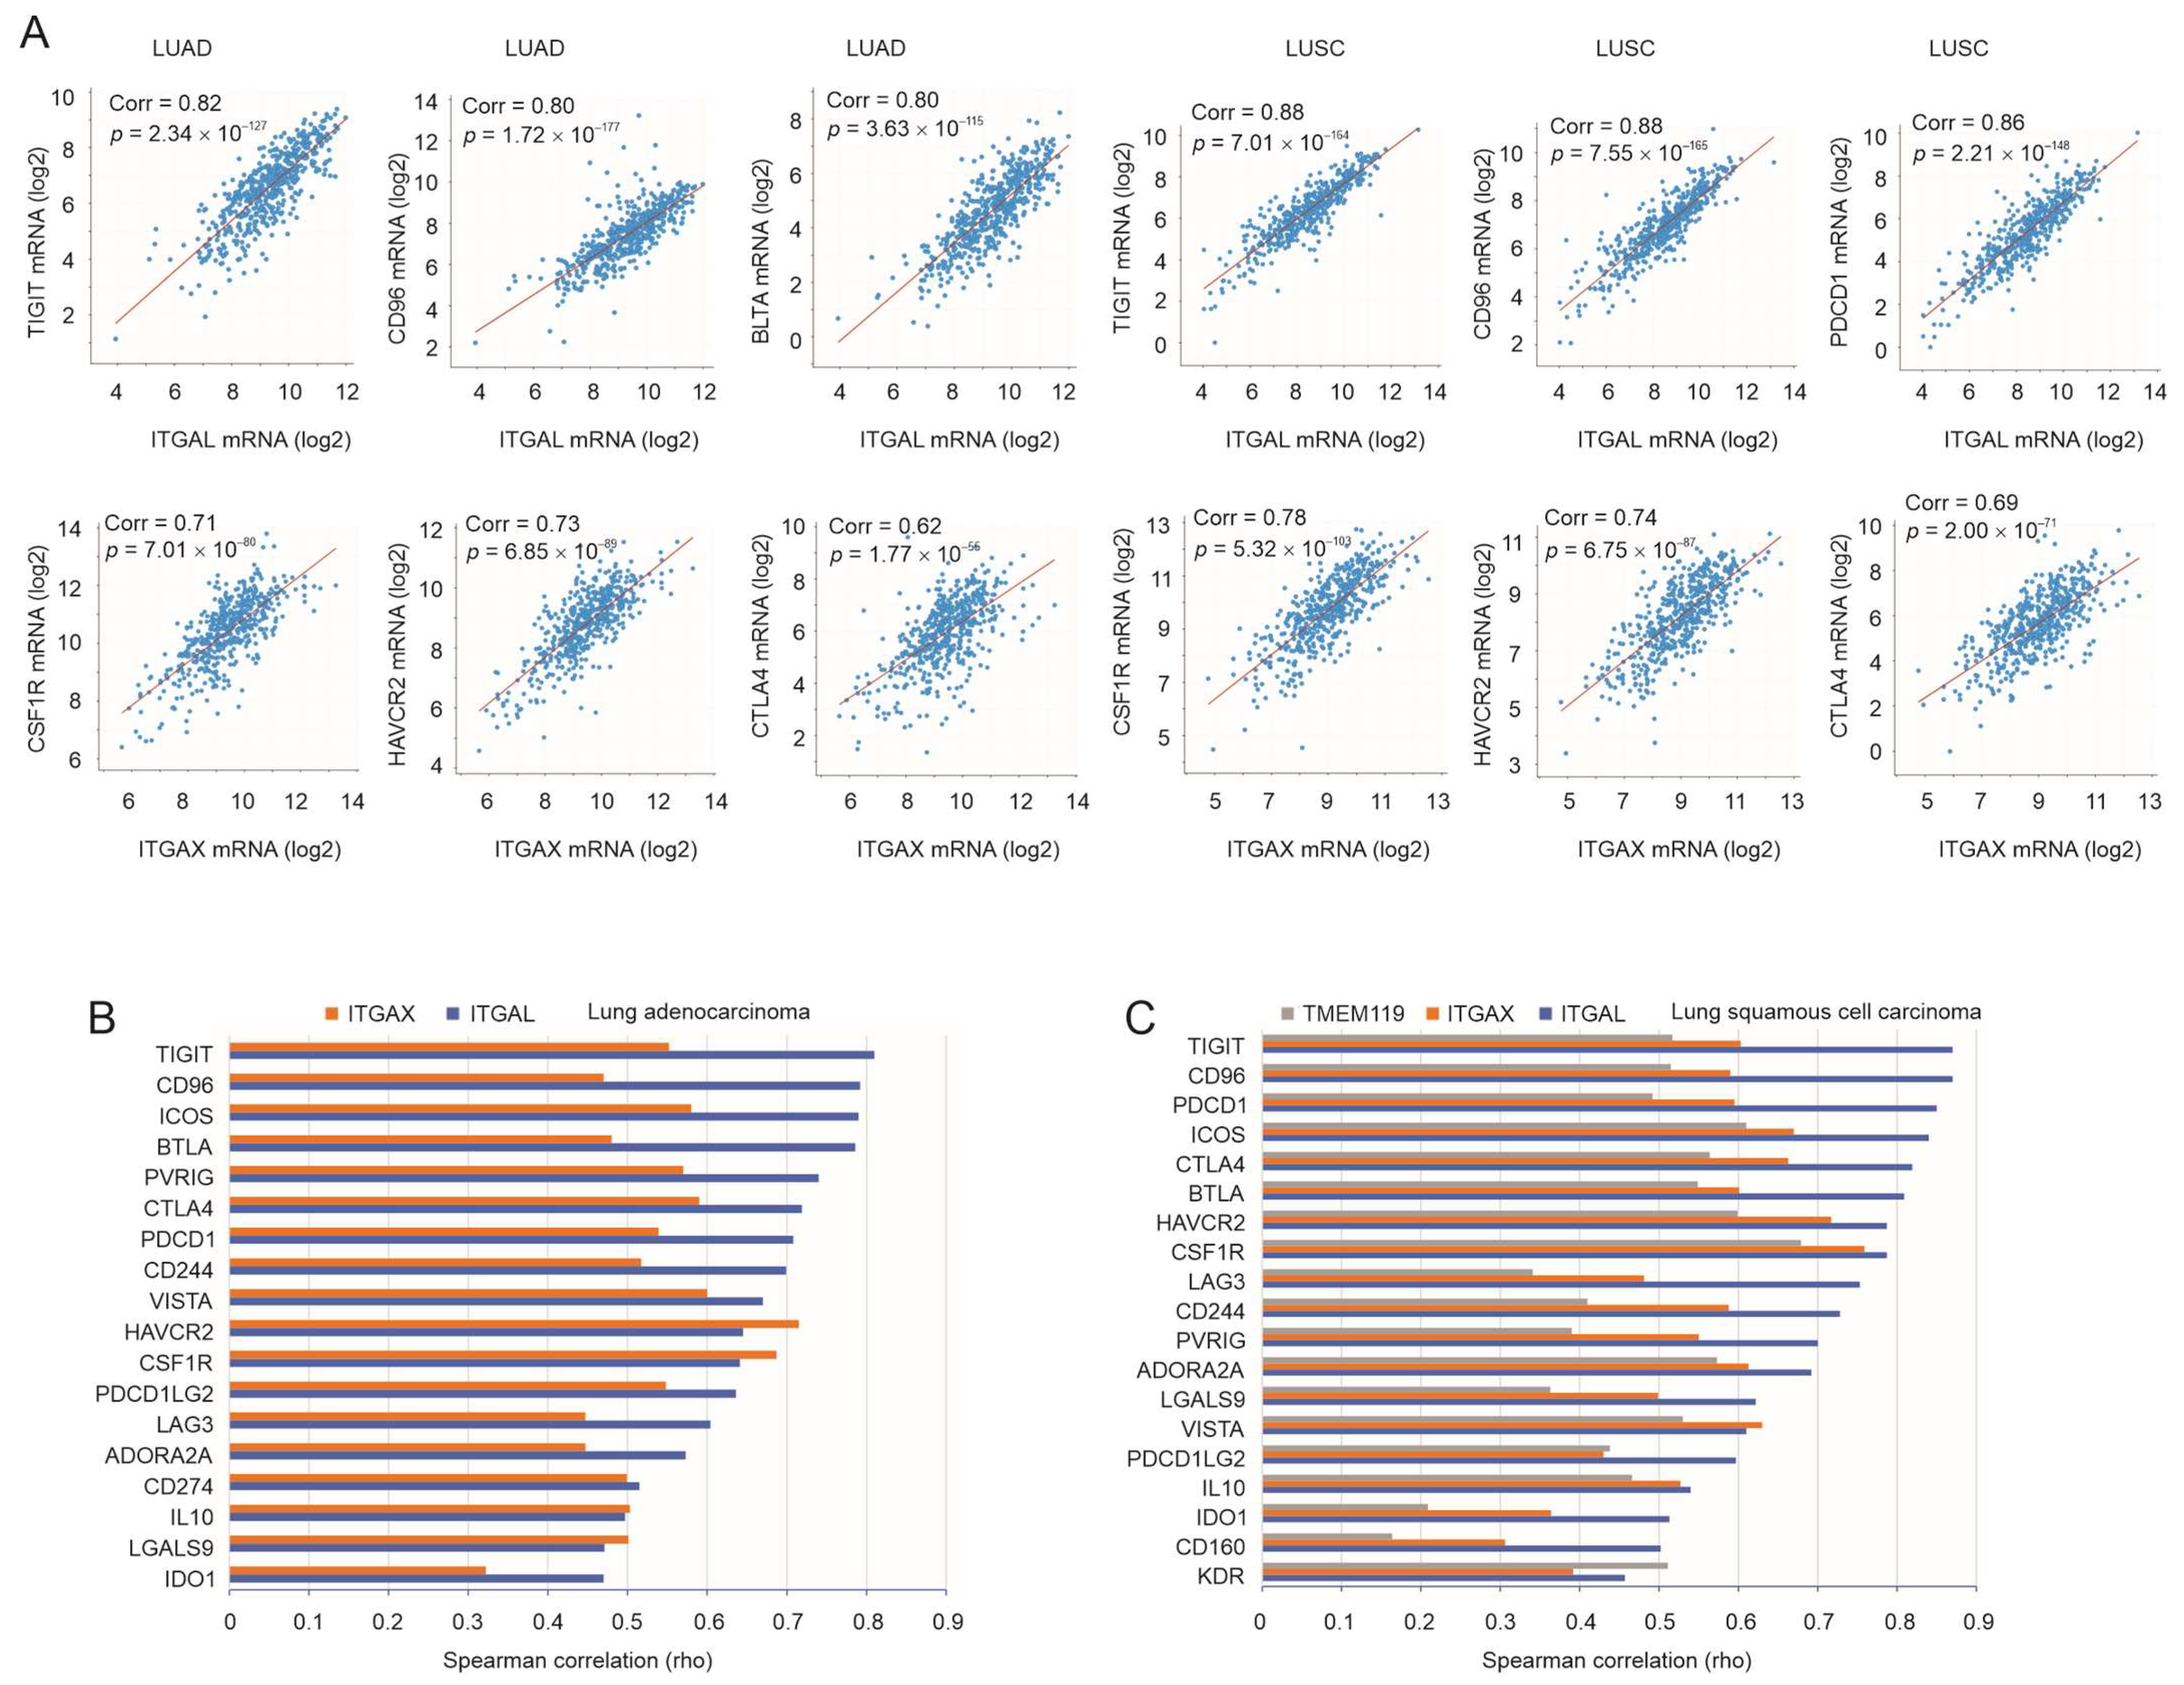
3.3. Robust Correlation of ITGAL, ITGAX, and TMEM119 with Immune Checkpoints
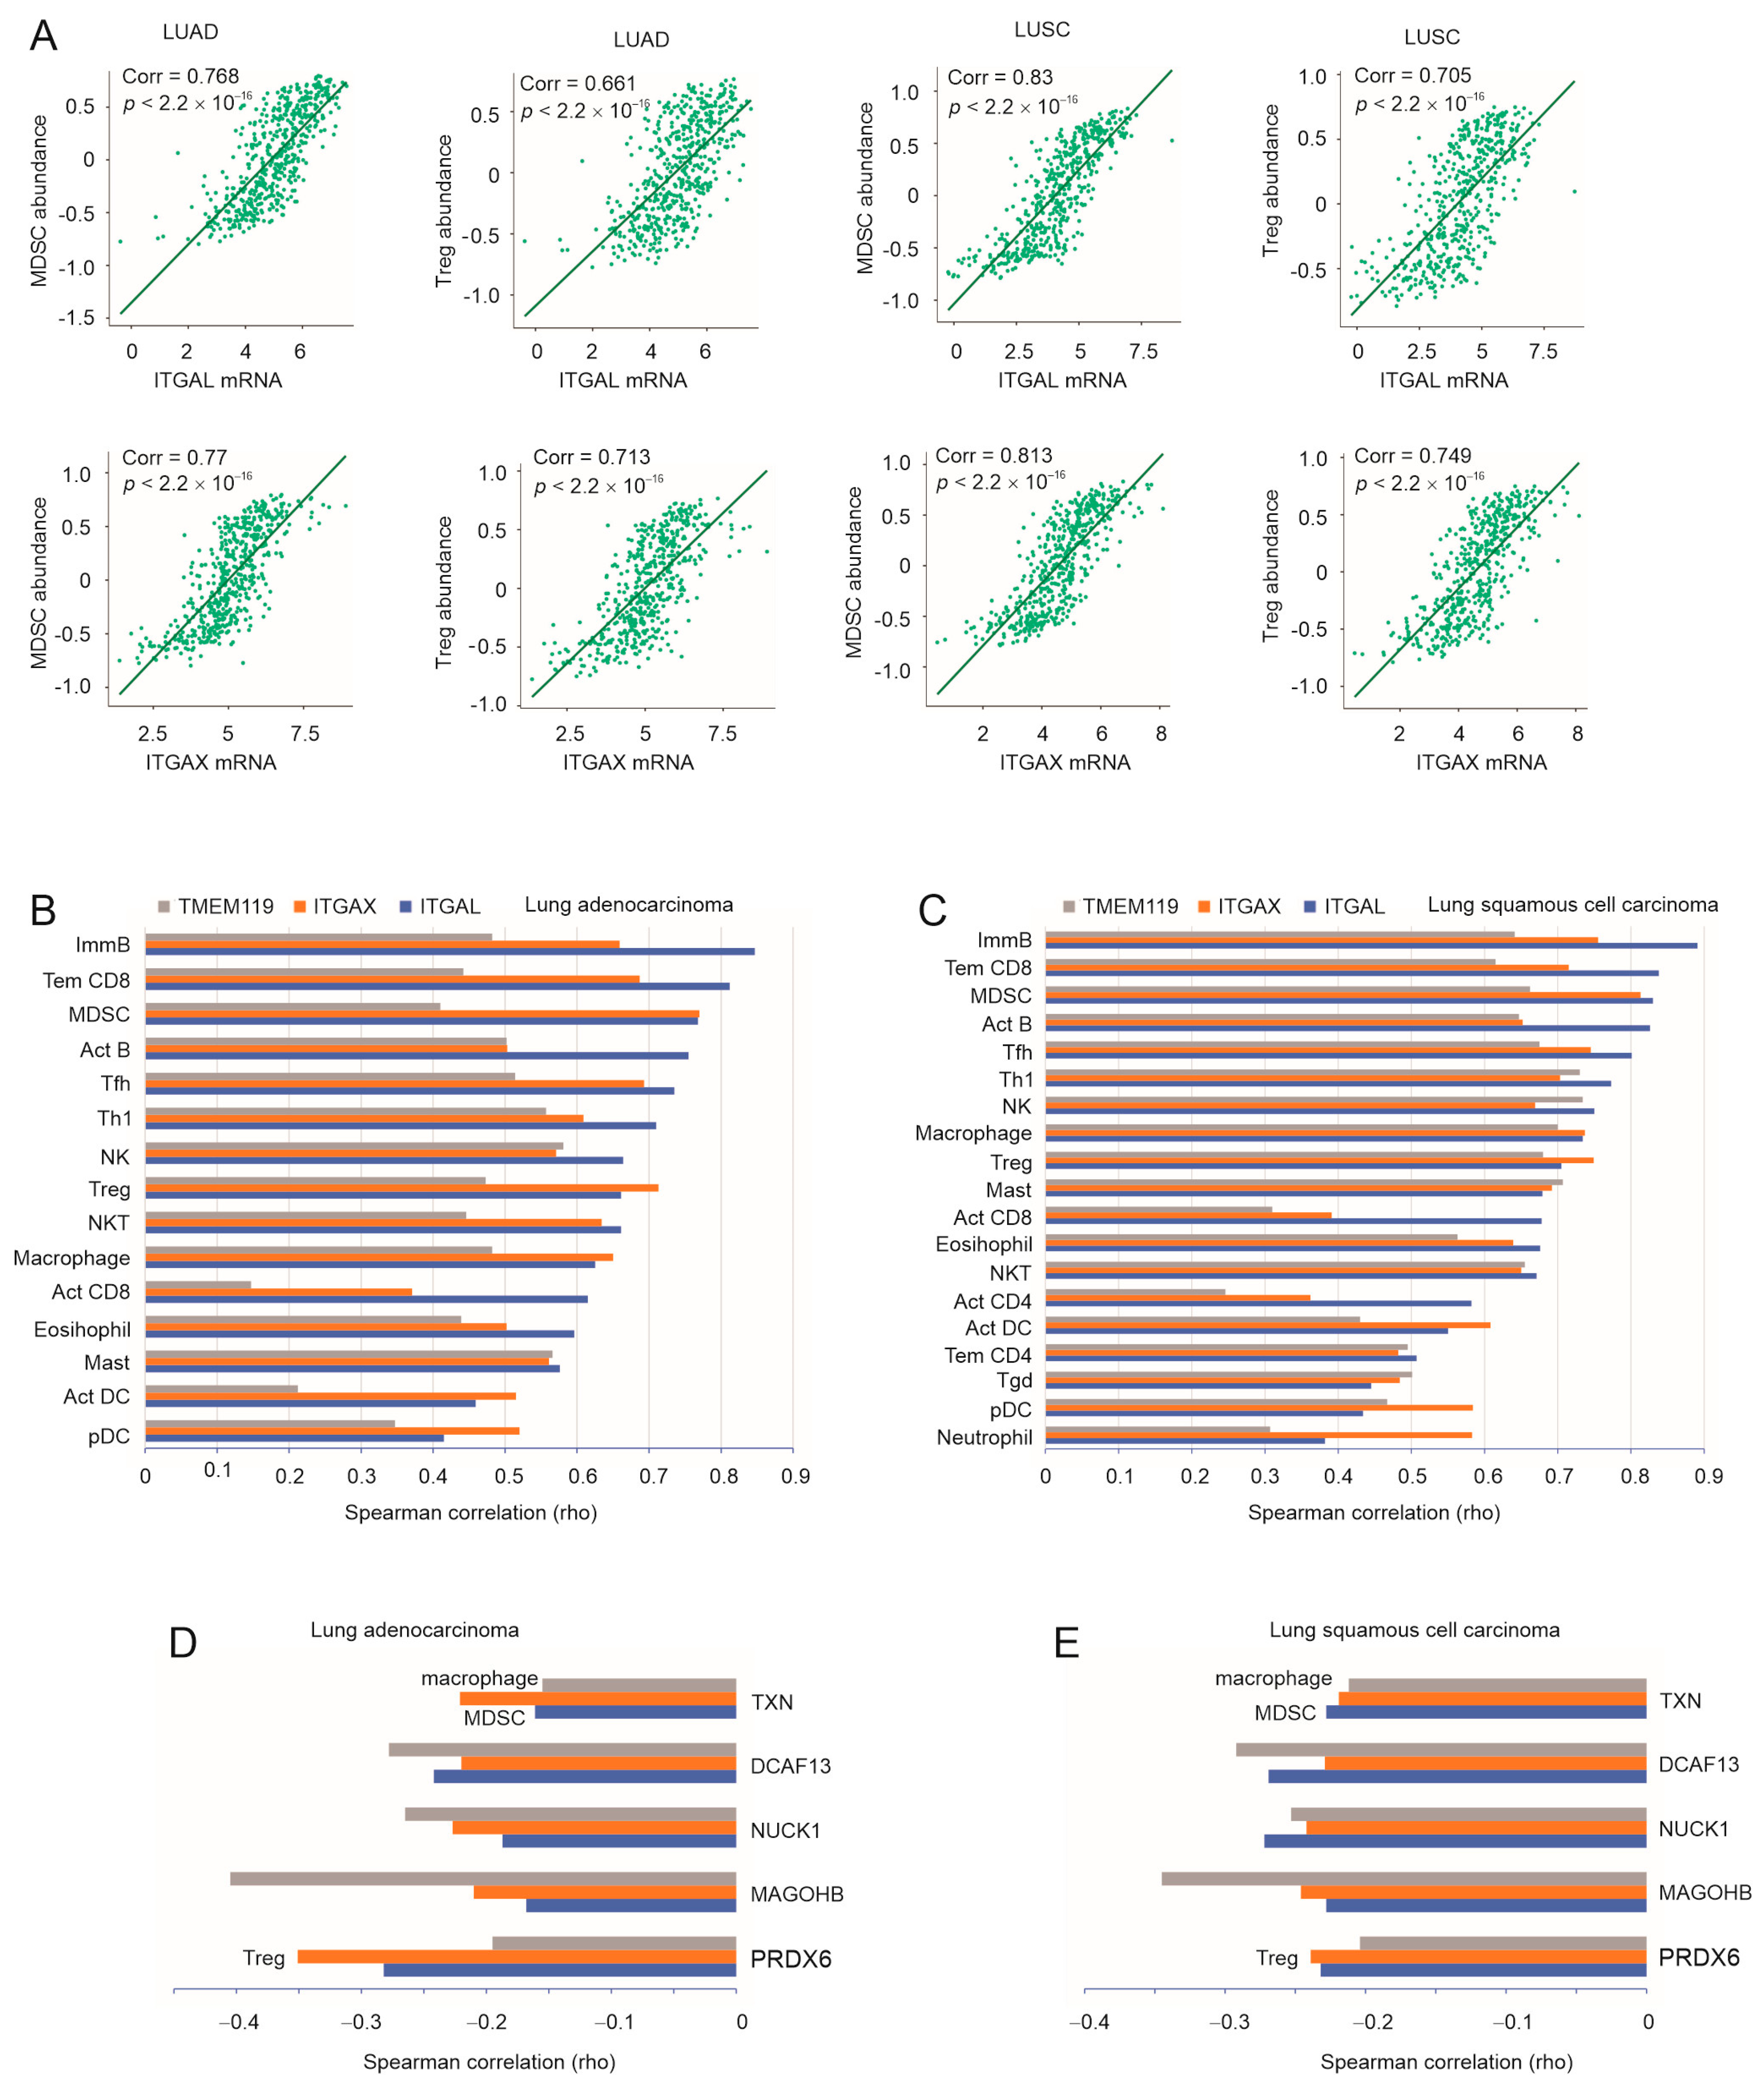
3.4. A Substantial Correlation of ITGAL, ITGAX, and TMEM119 with LC-Associated MDSC, Treg, and Macrophages
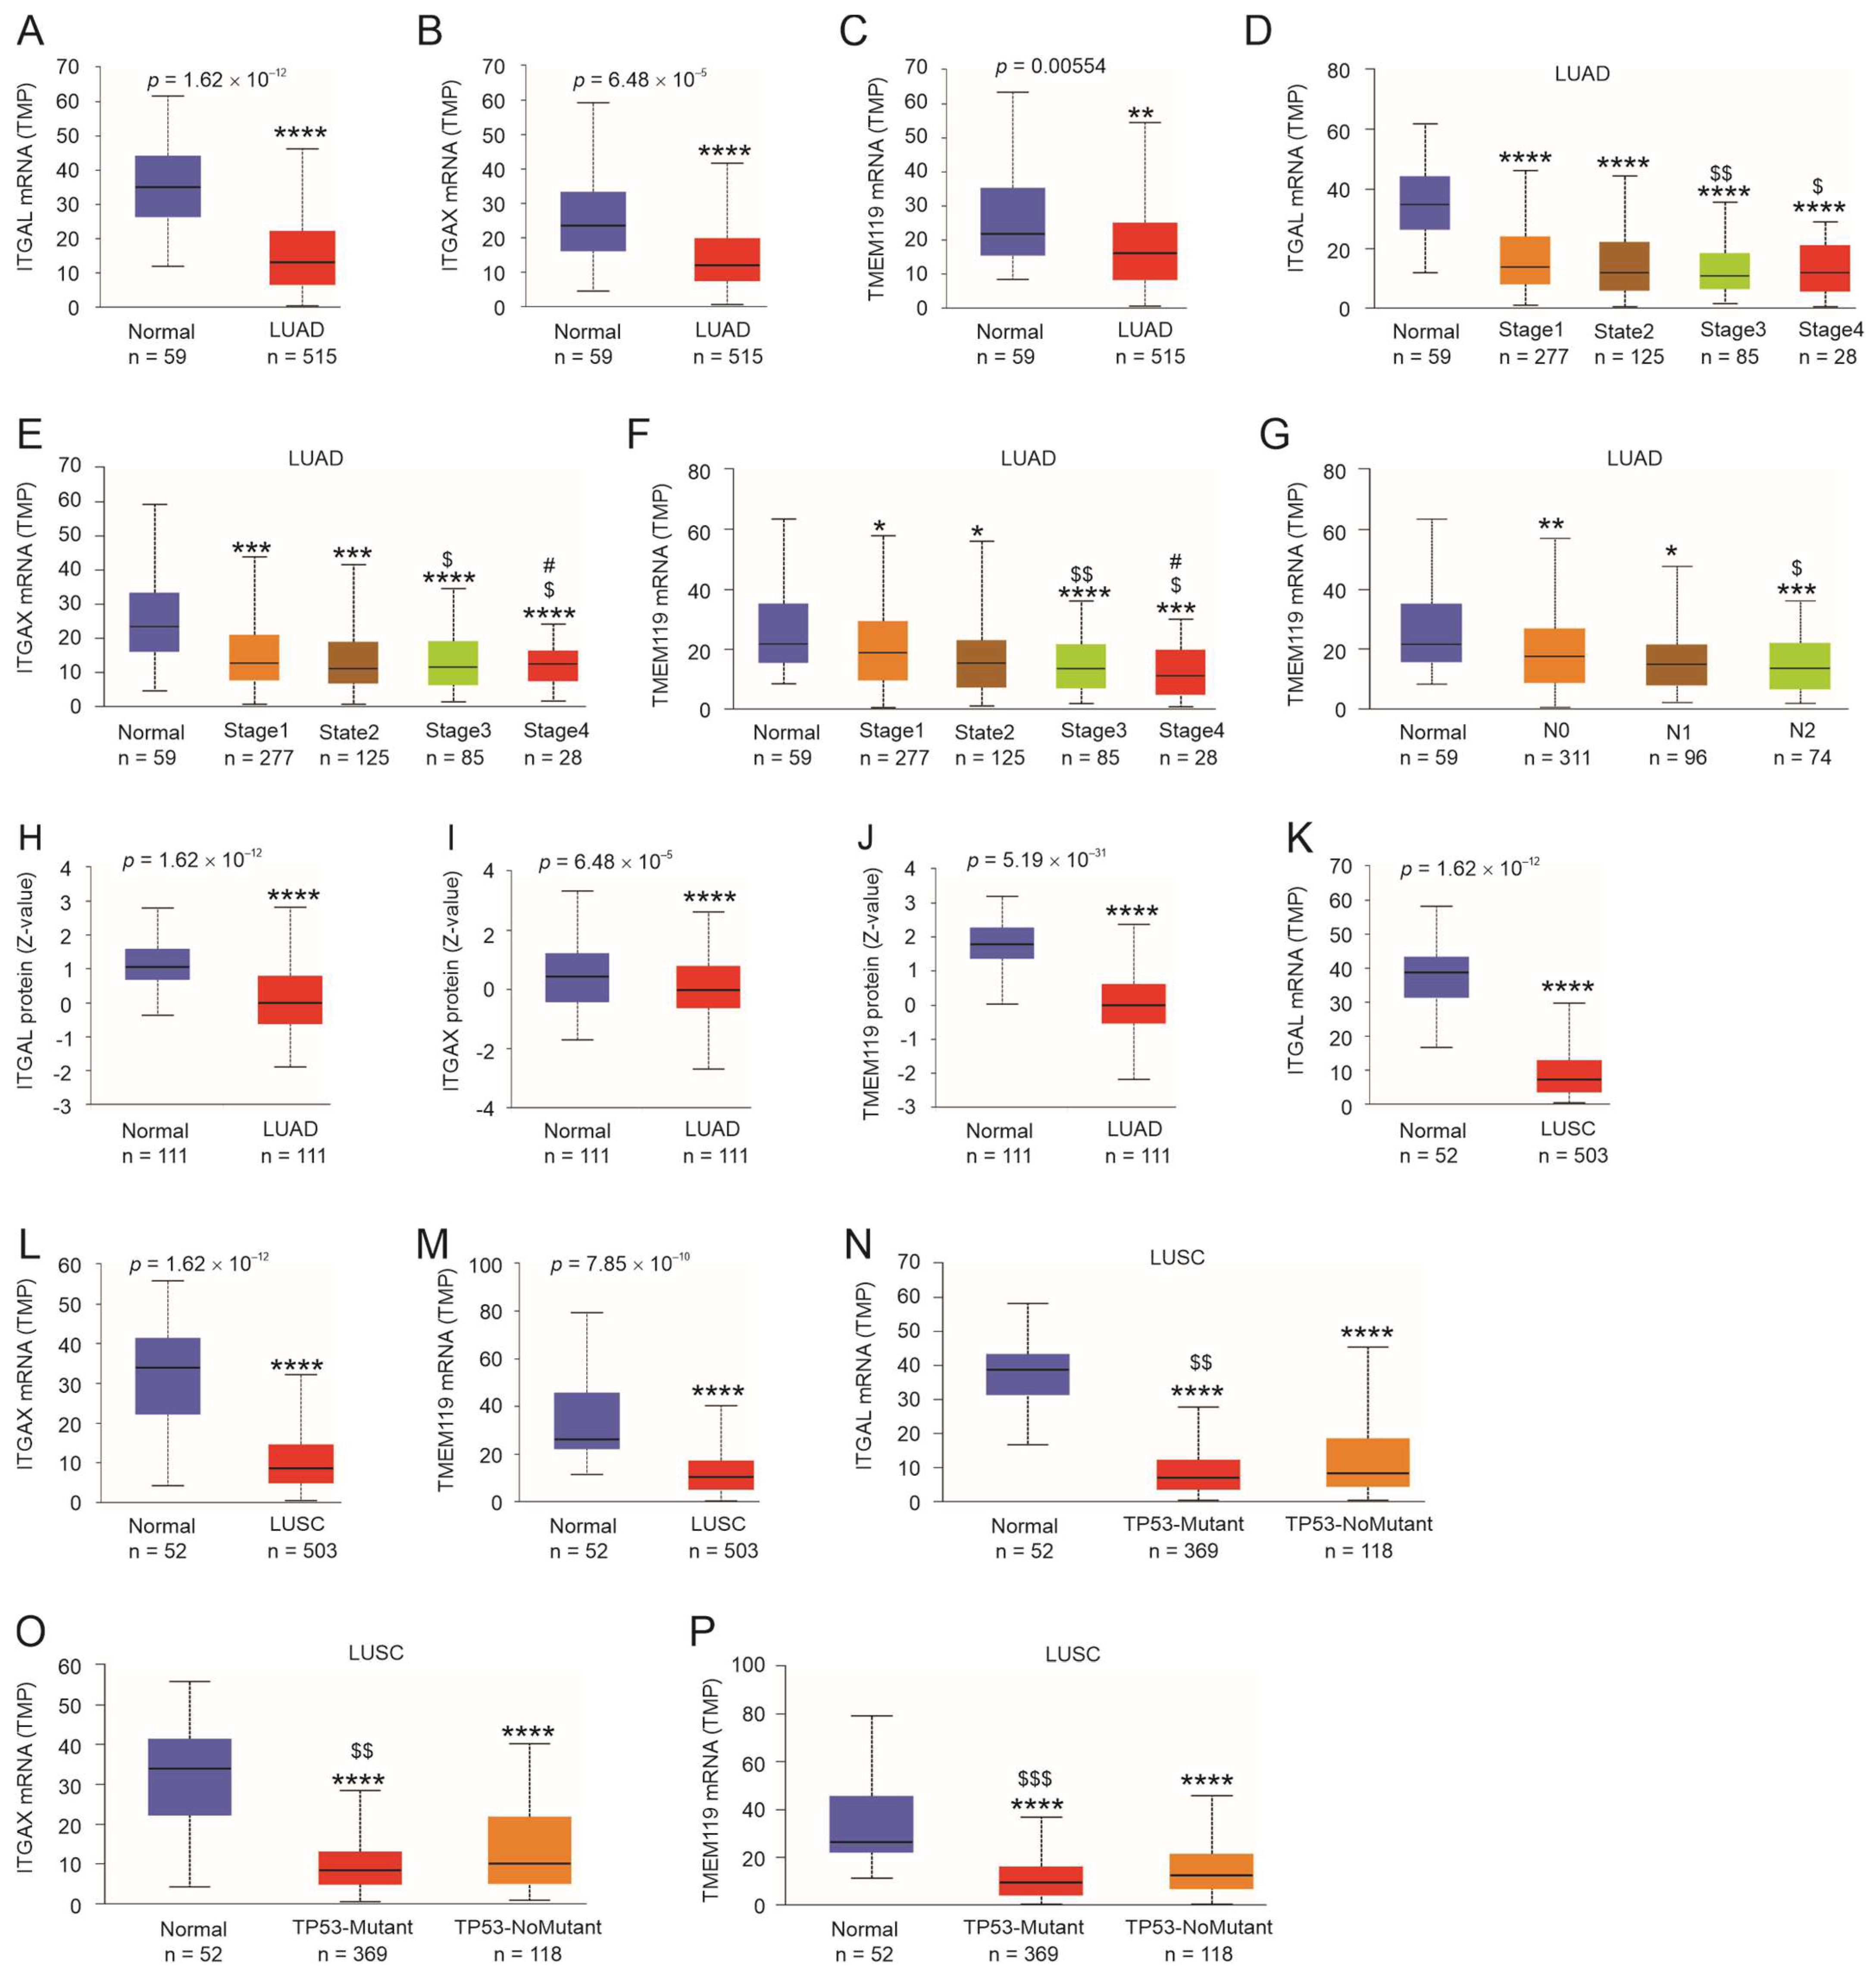
3.5. Expression Status of ITGAL, ITGAX, and TMEM119 in LC
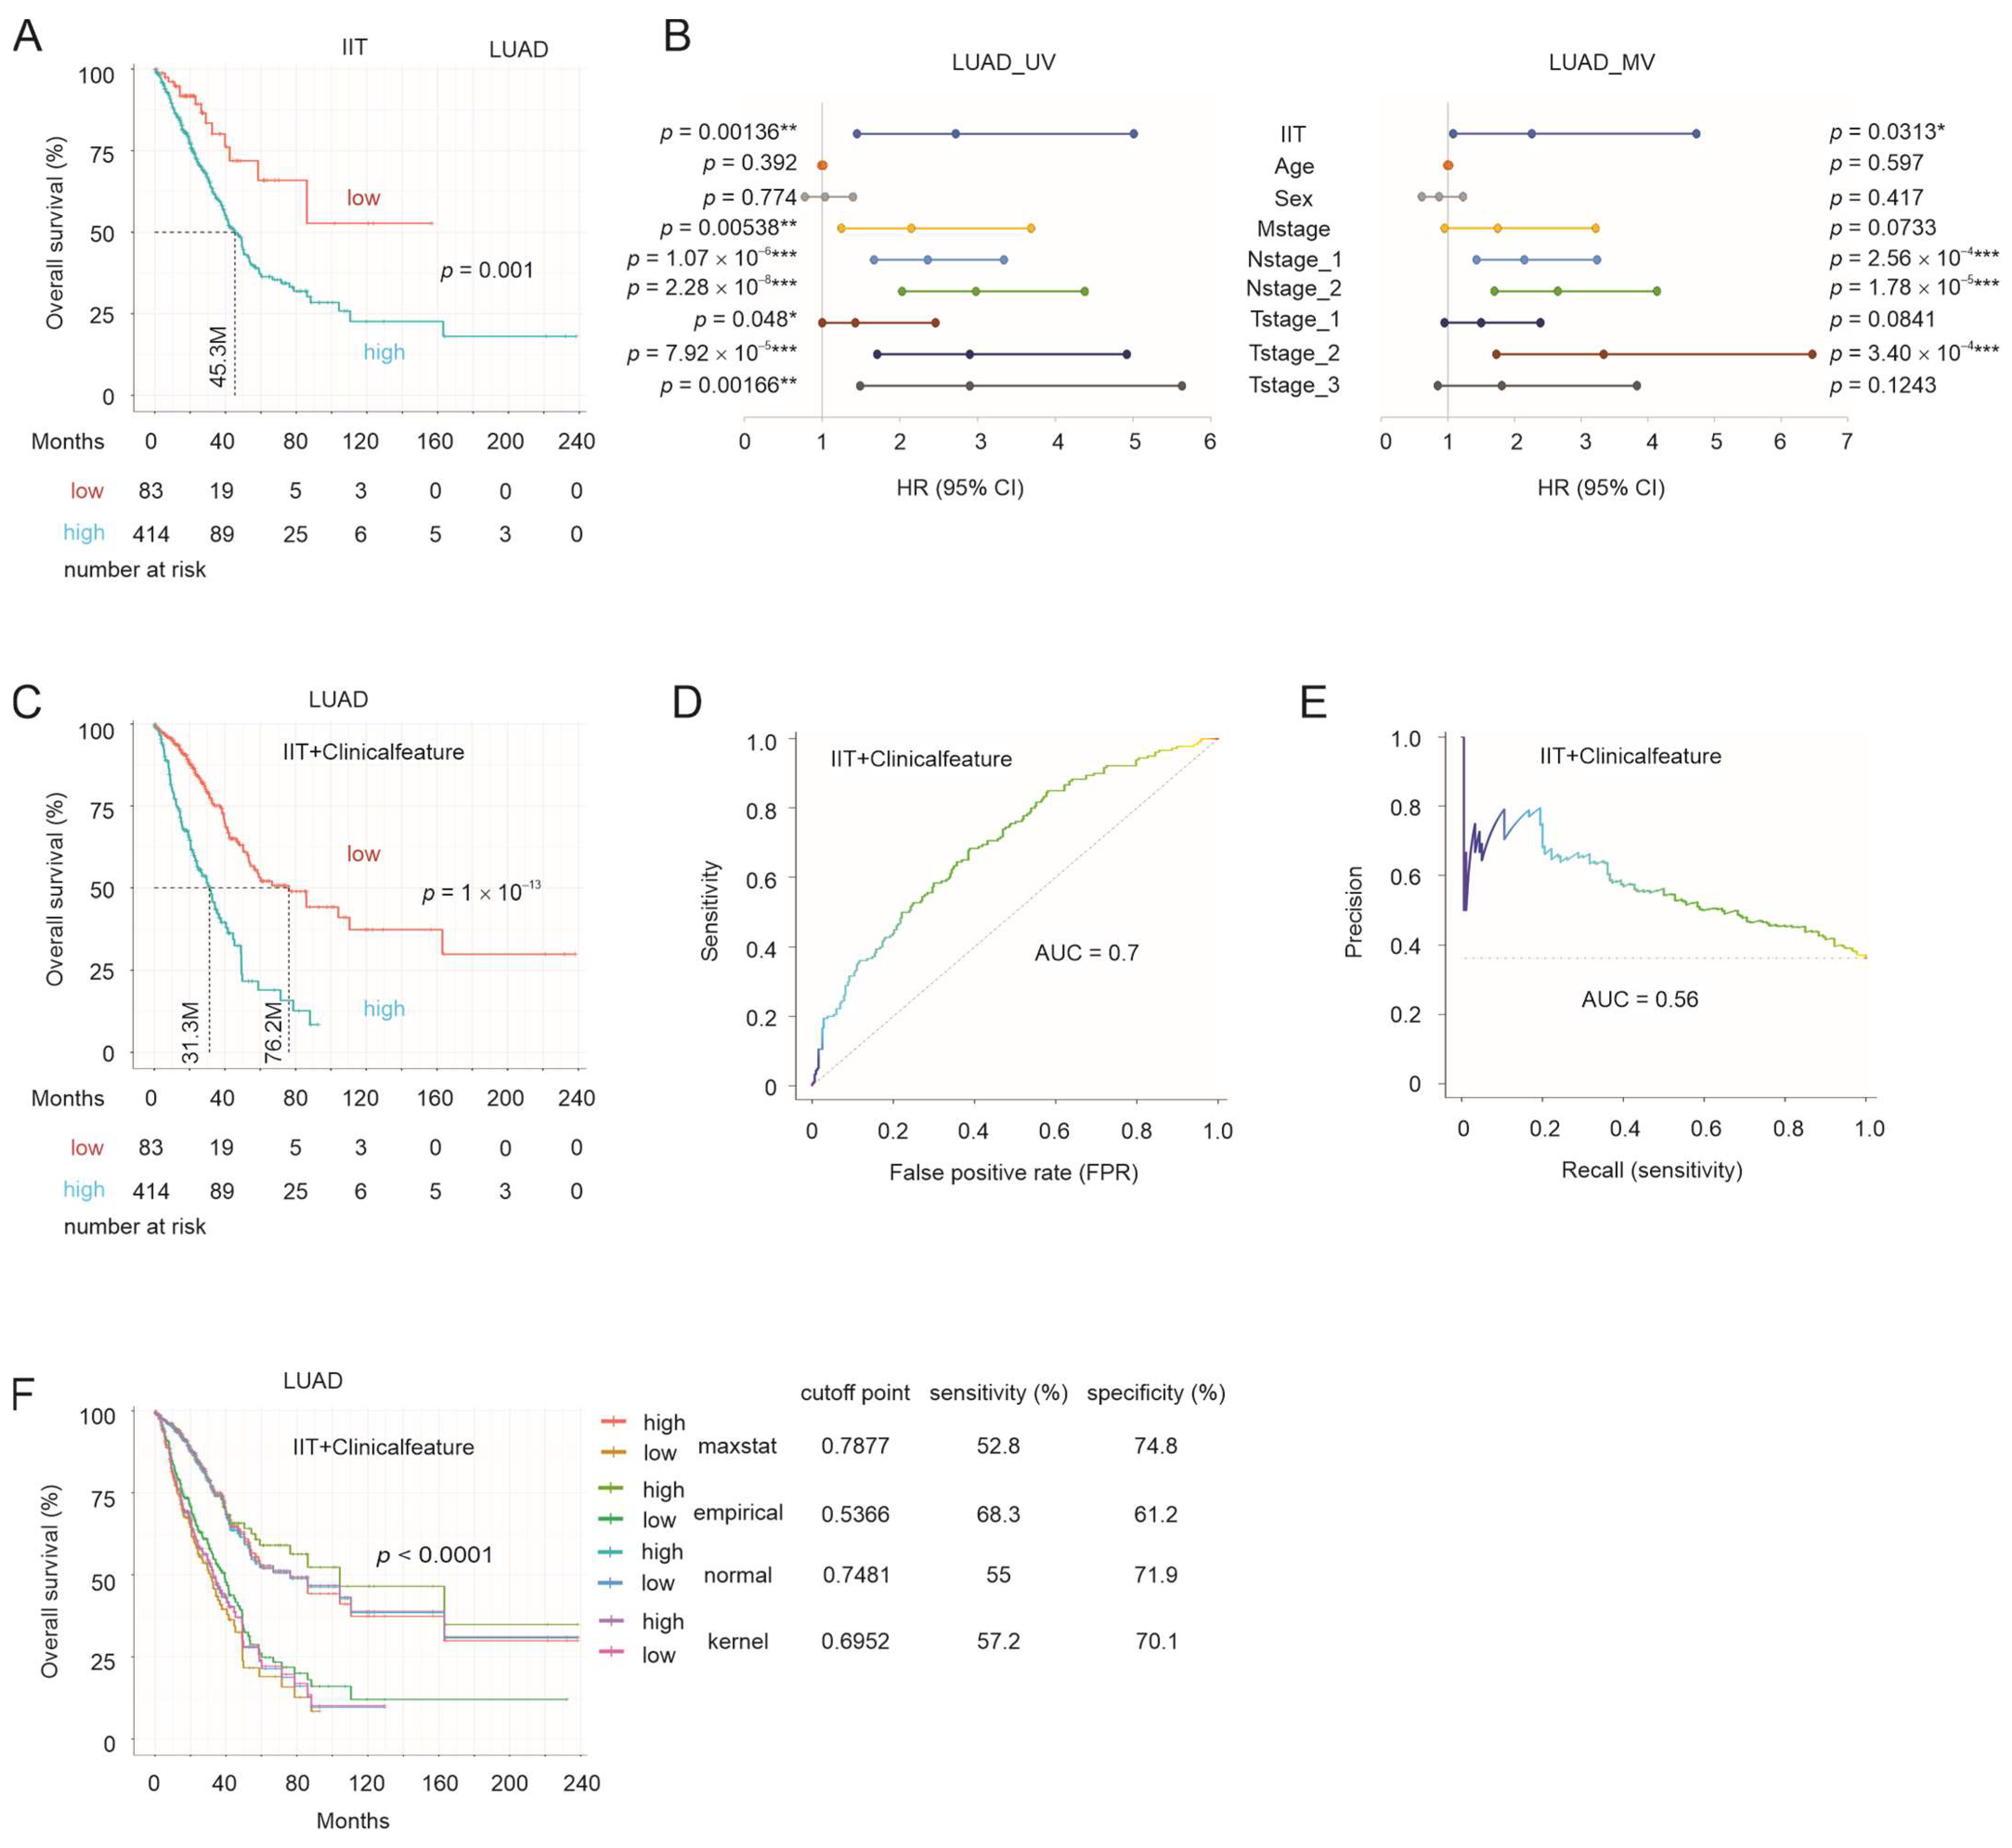
3.6. IIT-Mediated Stratification of NSCLC OS Probabilities
4. Discussion
5. Conclusions
Supplementary Materials
Author Contributions
Funding
Institutional Review Board Statement
Informed Consent Statement
Data Availability Statement
Acknowledgments
Conflicts of Interest
References
- Sung, H.; Ferlay, J.; Siegel, R.L.; Laversanne, M.; Soerjomataram, I.; Jemal, A.; Bray, F. Global cancer statistics 2020: Globocan estimates of incidence and mortality worldwide for 36 cancers in 185 countries. CA A Cancer J. Clin. 2021, 71, 209–249. [Google Scholar] [CrossRef] [PubMed]
- Inamura, K. Lung cancer: Understanding its molecular pathology and the 2015 who classification. Front. Oncol. 2017, 7, 193. [Google Scholar] [CrossRef] [PubMed]
- Chen, Z.; Fillmore, C.M.; Hammerman, P.S.; Kim, C.F.; Wong, K.K. Non-small-cell lung cancers: A heterogeneous set of diseases. Nat. Rev. Cancer 2014, 14, 535–546. [Google Scholar] [CrossRef] [PubMed]
- Heist, R.S.; Sequist, L.V.; Engelman, J.A. Genetic changes in squamous cell lung cancer: A review. J. Thorac. Oncol. 2012, 7, 924–933. [Google Scholar] [CrossRef]
- Tartarone, A.; Lerose, R.; Tartarone, M.; Aieta, M. Potential role of tumor-derived exosomes in non-small-cell lung cancer in the era of immunotherapy. Life 2022, 12, 2104. [Google Scholar] [CrossRef]
- Herbst, R.S.; Morgensztern, D.; Boshoff, C. The biology and management of non-small cell lung cancer. Nature 2018, 553, 446–454. [Google Scholar] [CrossRef]
- Lynch, T.J.; Bell, D.W.; Sordella, R.; Gurubhagavatula, S.; Okimoto, R.A.; Brannigan, B.W.; Harris, P.L.; Haserlat, S.M.; Supko, J.G.; Haluska, F.G.; et al. Activating mutations in the epidermal growth factor receptor underlying responsiveness of non-small-cell lung cancer to gefitinib. N. Engl. J. Med. 2004, 350, 2129–2139. [Google Scholar] [CrossRef]
- Paez, J.G.; Janne, P.A.; Lee, J.C.; Tracy, S.; Greulich, H.; Gabriel, S.; Herman, P.; Kaye, F.J.; Lindeman, N.; Boggon, T.J.; et al. Egfr mutations in lung cancer: Correlation with clinical response to gefitinib therapy. Science 2004, 304, 1497–1500. [Google Scholar] [CrossRef]
- Lee, J.; Piotrowska, Z.; Soo, R.; Cho, B.C.; Lim, S.M. Combatting acquired resistance to osimertinib in egfr-mutant lung cancer. Ther. Adv. Med. Oncol. 2022, 14, 17588359221144099. [Google Scholar] [CrossRef]
- Reck, M.; Rabe, K.F. Precision diagnosis and treatment for advanced non-small-cell lung cancer. N. Engl. J. Med. 2017, 377, 849–861. [Google Scholar] [CrossRef]
- Niu, Z.; Jin, R.; Zhang, Y.; Li, H. Signaling pathways and targeted therapies in lung squamous cell carcinoma: Mechanisms and clinical trials. Signal Transduct. Target. Ther. 2022, 7, 353. [Google Scholar] [CrossRef]
- Catalano, M.; Shabani, S.; Venturini, J.; Ottanelli, C.; Voltolini, L.; Roviello, G. Lung cancer immunotherapy: Beyond common immune checkpoints inhibitors. Cancers 2022, 14, 6145. [Google Scholar] [CrossRef] [PubMed]
- Gadgeel, S.; Rodriguez-Abreu, D.; Speranza, G.; Esteban, E.; Felip, E.; Domine, M.; Hui, R.; Hochmair, M.J.; Clingan, P.; Powell, S.F.; et al. Updated analysis from keynote-189: Pembrolizumab or placebo plus pemetrexed and platinum for previously untreated metastatic nonsquamous non-small-cell lung cancer. J. Clin. Oncol. 2020, 38, 1505–1517. [Google Scholar] [CrossRef] [PubMed]
- Meri-Abad, M.; Moreno-Manuel, A.; Garcia, S.G.; Calabuig-Farinas, S.; Perez, R.S.; Herrero, C.C.; Jantus-Lewintre, E. Clinical and technical insights of tumour mutational burden in non-small cell lung cancer. Crit. Rev. Oncol./Hematol. 2022, 182, 103891. [Google Scholar] [CrossRef] [PubMed]
- Bernatova, I.; Liskova, S. Mechanisms modified by (−)-epicatechin and taxifolin relevant for the treatment of hypertension and viral infection: Knowledge from preclinical studies. Antioxidants 2021, 10, 467. [Google Scholar] [CrossRef]
- Razak, S.; Afsar, T.; Ullah, A.; Almajwal, A.; Alkholief, M.; Alshamsan, A.; Jahan, S. Taxifolin, a natural flavonoid interacts with cell cycle regulators causes cell cycle arrest and causes tumor regression by activating wnt/ beta-catenin signaling pathway. BMC Cancer 2018, 18, 1043. [Google Scholar] [CrossRef]
- Woo, Y.; Shin, S.Y.; Hyun, J.; Lee, S.D.; Lee, Y.H.; Lim, Y. Flavanones inhibit the clonogenicity of hct116 cololectal cancer cells. Int. J. Mol. Med. 2012, 29, 403–408. [Google Scholar]
- Lee, S.B.; Cha, K.H.; Selenge, D.; Solongo, A.; Nho, C.W. The chemopreventive effect of taxifolin is exerted through are-dependent gene regulation. Biol. Pharm. Bull. 2007, 30, 1074–1079. [Google Scholar] [CrossRef]
- Dostal, Z.; Sebera, M.; Srovnal, J.; Staffova, K.; Modriansky, M. Dual effect of taxifolin on zeb2 cancer signaling in hepg2 cells. Molecules 2021, 26, 1476. [Google Scholar] [CrossRef]
- Oi, N.; Chen, H.; Ok Kim, M.; Lubet, R.A.; Bode, A.M.; Dong, Z. Taxifolin suppresses uv-induced skin carcinogenesis by targeting egfr and pi3k. Cancer Prev. Res. 2012, 5, 1103–1114. [Google Scholar] [CrossRef]
- Chen, X.; Gu, N.; Xue, C.; Li, B.R. Plant flavonoid taxifolin inhibits the growth, migration and invasion of human osteosarcoma cells. Mol. Med. Rep. 2018, 17, 3239–3245. [Google Scholar] [CrossRef] [PubMed]
- Xie, J.; Pang, Y.; Wu, X. Taxifolin suppresses the malignant progression of gastric cancer by regulating the ahr/cyp1a1 signaling pathway. Int. J. Mol. Med. 2021, 48, 197. [Google Scholar] [CrossRef] [PubMed]
- Yao, W.; Gong, H.; Mei, H.; Shi, L.; Yu, J.; Hu, Y. Taxifolin targets pi3k and mtor and inhibits glioblastoma multiforme. J. Oncol. 2021, 2021, 5560915. [Google Scholar] [CrossRef] [PubMed]
- Zhang, Z.R.; Al Zaharna, M.; Wong, M.M.; Chiu, S.K.; Cheung, H.Y. Taxifolin enhances andrographolide-induced mitotic arrest and apoptosis in human prostate cancer cells via spindle assembly checkpoint activation. PLoS ONE 2013, 8, e54577. [Google Scholar] [CrossRef]
- Gomes, D.; Yaduvanshi, S.; Silvestre, S.; Duarte, A.P.; Santos, A.O.; Soares, C.P.; Kumar, V.; Passarinha, L.; Sousa, A. Taxifolin and lucidin as potential e6 protein inhibitors: P53 function re-establishment and apoptosis induction in cervical cancer cells. Cancers 2022, 14, 2834. [Google Scholar] [CrossRef]
- Alzaharna, M.; Alqouqa, I.; Cheung, H.Y. Taxifolin synergizes andrographolide-induced cell death by attenuation of autophagy and augmentation of caspase dependent and independent cell death in hela cells. PLoS ONE 2017, 12, e0171325. [Google Scholar] [CrossRef]
- Haque, M.W.; Pattanayak, S.P. Taxifolin inhibits 7,12-dimethylbenz(a)anthracene-induced breast carcinogenesis by regulating ahr/cyp1a1 signaling pathway. Pharmacogn. Mag. 2018, 13, S749–S755. [Google Scholar]
- Lin, X.; Dong, Y.; Gu, Y.; Kapoor, A.; Peng, J.; Su, Y.; Wei, F.; Wang, Y.; Yang, C.; Gill, A.; et al. Taxifolin inhibits breast cancer growth by facilitating cd8+ t cell infiltration and inducing a novel set of genes including potential tumor suppressor genes in 1q21.3. Cancers 2023, 15, 3203. [Google Scholar] [CrossRef]
- Wang, R.; Zhu, X.; Wang, Q.; Li, X.; Wang, E.; Zhao, Q.; Wang, Q.; Cao, H. The anti-tumor effect of taxifolin on lung cancer via suppressing stemness and epithelial-mesenchymal transition in vitro and oncogenesis in nude mice. Ann. Transl. Med. 2020, 8, 590. [Google Scholar] [CrossRef]
- Hossain, M.M.; Ray, S.K. Ews knockdown and taxifolin treatment induced differentiation and removed DNA methylation from p53 promoter to promote expression of puma and noxa for apoptosis in ewing’s sarcoma. J. Cancer Ther. 2014, 5, 1092–1113. [Google Scholar] [CrossRef]
- Li, J.; Hu, L.; Zhou, T.; Gong, X.; Jiang, R.; Li, H.; Kuang, G.; Wan, J.; Li, H. Taxifolin inhibits breast cancer cells proliferation, migration and invasion by promoting mesenchymal to epithelial transition via beta-catenin signaling. Life Sci. 2019, 232, 116617. [Google Scholar] [CrossRef] [PubMed]
- Weidmann, A.E. Dihydroquercetin: More than just an impurity? Eur. J. Pharmacol. 2012, 684, 19–26. [Google Scholar] [CrossRef] [PubMed]
- Sunil, C.; Xu, B. An insight into the health-promoting effects of taxifolin (dihydroquercetin). Phytochemistry 2019, 166, 112066. [Google Scholar] [CrossRef]
- Das, A.; Baidya, R.; Chakraborty, T.; Samanta, A.K.; Roy, S. Pharmacological basis and new insights of taxifolin: A comprehensive review. Biomed. Pharmacother.=Biomed. Pharmacother. 2021, 142, 112004. [Google Scholar] [CrossRef] [PubMed]
- Kellar, A.; Egan, C.; Morris, D. Preclinical murine models for lung cancer: Clinical trial applications. BioMed Res. Int. 2015, 2015, 621324. [Google Scholar] [CrossRef] [PubMed]
- Cerami, E.; Gao, J.; Dogrusoz, U.; Gross, B.E.; Sumer, S.O.; Aksoy, B.A.; Jacobsen, A.; Byrne, C.J.; Heuer, M.L.; Larsson, E.; et al. The cbio cancer genomics portal: An open platform for exploring multidimensional cancer genomics data. Cancer Discov. 2012, 2, 401–404. [Google Scholar] [CrossRef]
- Gao, J.; Aksoy, B.A.; Dogrusoz, U.; Dresdner, G.; Gross, B.; Sumer, S.O.; Sun, Y.; Jacobsen, A.; Sinha, R.; Larsson, E.; et al. Integrative analysis of complex cancer genomics and clinical profiles using the cbioportal. Sci. Signal. 2013, 6, pl1. [Google Scholar] [CrossRef]
- Chandrashekar, D.S.; Bashel, B.; Balasubramanya, S.A.H.; Creighton, C.J.; Ponce-Rodriguez, I.; Chakravarthi, B.; Varambally, S. Ualcan: A portal for facilitating tumor subgroup gene expression and survival analyses. Neoplasia 2017, 19, 649–658. [Google Scholar] [CrossRef]
- Zhou, Y.; Zhou, B.; Pache, L.; Chang, M.; Khodabakhshi, A.H.; Tanaseichuk, O.; Benner, C.; Chanda, S.K. Metascape provides a biologist-oriented resource for the analysis of systems-level datasets. Nat. Commun. 2019, 10, 1523. [Google Scholar] [CrossRef]
- Ru, B.; Wong, C.N.; Tong, Y.; Zhong, J.Y.; Zhong, S.S.W.; Wu, W.C.; Chu, K.C.; Wong, C.Y.; Lau, C.Y.; Chen, I.; et al. Tisidb: An integrated repository portal for tumor-immune system interactions. Bioinformatics 2019, 35, 4200–4202. [Google Scholar] [CrossRef]
- Yan, J.; Ojo, D.; Kapoor, A.; Lin, X.; Pinthus, J.H.; Aziz, T.; Bismar, T.A.; Wei, F.; Wong, N.; De Melo, J.; et al. Neural cell adhesion protein cntn1 promotes the metastatic progression of prostate cancer. Cancer Res. 2016, 76, 1603–1614. [Google Scholar] [CrossRef] [PubMed]
- Jiang, Y.; Lin, X.; Kapoor, A.; He, L.; Wei, F.; Gu, Y.; Mei, W.; Zhao, K.; Yang, H.; Tang, D. Fam84b promotes prostate tumorigenesis through a network alteration. Ther. Adv. Med. Oncol. 2019, 11, 1758835919846372. [Google Scholar] [CrossRef]
- Yu, G.; Wang, L.G.; Han, Y.; He, Q.Y. Clusterprofiler: An r package for comparing biological themes among gene clusters. OMICS 2012, 16, 284–287. [Google Scholar] [CrossRef] [PubMed]
- Tran, A.N.; Dussaq, A.M.; Kennell, T., Jr.; Willey, C.D.; Hjelmeland, A.B. Hpaanalyze: An r package that facilitates the retrieval and analysis of the human protein atlas data. BMC Bioinform. 2019, 20, 463. [Google Scholar] [CrossRef]
- Jiang, P.; Gu, S.; Pan, D.; Fu, J.; Sahu, A.; Hu, X.; Li, Z.; Traugh, N.; Bu, X.; Li, B.; et al. Signatures of t cell dysfunction and exclusion predict cancer immunotherapy response. Nat. Med. 2018, 24, 1550–1558. [Google Scholar] [CrossRef] [PubMed]
- Fu, J.; Li, K.; Zhang, W.; Wan, C.; Zhang, J.; Jiang, P.; Liu, X.S. Large-scale public data reuse to model immunotherapy response and resistance. Genome Med. 2020, 12, 21. [Google Scholar] [CrossRef]
- Huyghe, N.; Benidovskaya, E.; Stevens, P.; Van den Eynde, M. Biomarkers of response and resistance to immunotherapy in microsatellite stable colorectal cancer: Toward a new personalized medicine. Cancers 2022, 14, 2241. [Google Scholar] [CrossRef]
- Seo, M.K.; Kang, H.; Kim, S. Tumor microenvironment-aware, single-transcriptome prediction of microsatellite instability in colorectal cancer using meta-analysis. Sci. Rep. 2022, 12, 6283. [Google Scholar] [CrossRef]
- Nishino, M.; Ramaiya, N.H.; Hatabu, H.; Hodi, F.S. Monitoring immune-checkpoint blockade: Response evaluation and biomarker development. Nat. Rev. Clin. Oncol. 2017, 14, 655–668. [Google Scholar] [CrossRef]
- Chen, P.L.; Roh, W.; Reuben, A.; Cooper, Z.A.; Spencer, C.N.; Prieto, P.A.; Miller, J.P.; Bassett, R.L.; Gopalakrishnan, V.; Wani, K.; et al. Analysis of immune signatures in longitudinal tumor samples yields insight into biomarkers of response and mechanisms of resistance to immune checkpoint blockade. Cancer Discov. 2016, 6, 827–837. [Google Scholar] [CrossRef]
- Ayers, M.; Lunceford, J.; Nebozhyn, M.; Murphy, E.; Loboda, A.; Kaufman, D.R.; Albright, A.; Cheng, J.D.; Kang, S.P.; Shankaran, V.; et al. Ifn-gamma-related mrna profile predicts clinical response to pd-1 blockade. J. Clin. Investig. 2017, 127, 2930–2940. [Google Scholar] [CrossRef] [PubMed]
- Gu, Y.; Lin, X.; Dong, Y.; Wood, G.; Seidah, N.G.; Werstuck, G.; Major, P.; Bonert, M.; Kapoor, A.; Tang, D. Pcsk9 facilitates melanoma pathogenesis via a network regulating tumor immunity. J. Exp. Clin. Cancer Res. CR 2023, 42, 2. [Google Scholar] [CrossRef] [PubMed]
- Khong, H.T.; Rosenberg, S.A. The waardenburg syndrome type 4 gene, sox10, is a novel tumor-associated antigen identified in a patient with a dramatic response to immunotherapy. Cancer Res. 2002, 62, 3020–3023. [Google Scholar] [PubMed]
- Patel, S.J.; Sanjana, N.E.; Kishton, R.J.; Eidizadeh, A.; Vodnala, S.K.; Cam, M.; Gartner, J.J.; Jia, L.; Steinberg, S.M.; Yamamoto, T.N.; et al. Identification of essential genes for cancer immunotherapy. Nature 2017, 548, 537–542. [Google Scholar] [CrossRef]
- Yang, Y.; Neo, S.Y.; Chen, Z.; Cui, W.; Chen, Y.; Guo, M.; Wang, Y.; Xu, H.; Kurzay, A.; Alici, E.; et al. Thioredoxin activity confers resistance against oxidative stress in tumor-infiltrating nk cells. J. Clin. Investig. 2020, 130, 5508–5522. [Google Scholar] [CrossRef]
- Zhu, Y.; Paniccia, A.; Schulick, A.C.; Chen, W.; Koenig, M.R.; Byers, J.T.; Yao, S.; Bevers, S.; Edil, B.H. Identification of cd112r as a novel checkpoint for human t cells. J. Exp. Med. 2016, 213, 167–176. [Google Scholar] [CrossRef]
- De Sanctis, F.; Adamo, A.; Cane, S.; Ugel, S. Targeting tumour-reprogrammed myeloid cells: The new battleground in cancer immunotherapy. In Seminars in Immunopathology; Springer: Berlin/Heidelberg, Germany, 2022. [Google Scholar]
- Downs-Canner, S.M.; Meier, J.; Vincent, B.G.; Serody, J.S. B cell function in the tumor microenvironment. Annu. Rev. Immunol. 2022, 40, 169–193. [Google Scholar] [CrossRef]
- Demaria, O.; Cornen, S.; Daeron, M.; Morel, Y.; Medzhitov, R.; Vivier, E. Harnessing innate immunity in cancer therapy. Nature 2019, 574, 45–56. [Google Scholar] [CrossRef]
- Conner, M.; Hance, K.W.; Yadavilli, S.; Smothers, J.; Waight, J.D. Emergence of the cd226 axis in cancer immunotherapy. Front. Immunol. 2022, 13, 914406. [Google Scholar] [CrossRef]
- Dougall, W.C.; Kurtulus, S.; Smyth, M.J.; Anderson, A.C. Tigit and cd96: New checkpoint receptor targets for cancer immunotherapy. Immunol. Rev. 2017, 276, 112–120. [Google Scholar] [CrossRef]
- Smith, C.M.; Proulx, M.K.; Lai, R.; Kiritsy, M.C.; Bell, T.A.; Hock, P.; Pardo-Manuel de Villena, F.; Ferris, M.T.; Baker, R.E.; Behar, S.M.; et al. Functionally overlapping variants control tuberculosis susceptibility in collaborative cross mice. mBio 2019, 10, 10–1128. [Google Scholar] [CrossRef] [PubMed]
- Wang, Y.; Hou, K.; Jin, Y.; Bao, B.; Tang, S.; Qi, J.; Yang, Y.; Che, X.; Liu, Y.; Hu, X.; et al. Lung adenocarcinoma-specific three-integrin signature contributes to poor outcomes by metastasis and immune escape pathways. J. Transl. Intern. Med. 2021, 9, 249–263. [Google Scholar] [CrossRef] [PubMed]
- Gao, P.; Ren, G. Identification of potential target genes of non-small cell lung cancer in response to resveratrol treatment by bioinformatics analysis. Aging 2021, 13, 23245–23261. [Google Scholar] [CrossRef] [PubMed]
- Liu, L.; Xu, S.; Huang, L.; He, J.; Liu, G.; Ma, S.; Weng, Y.; Huang, S. Systemic immune microenvironment and regulatory network analysis in patients with lung adenocarcinoma. Transl. Cancer Res. 2021, 10, 2859–2872. [Google Scholar] [CrossRef]
- Ye, G.C.; Liu, Y.F.; Huang, L.; Zhang, C.Y.; Sheng, Y.L.; Wu, B.; Han, L.; Wu, C.L.; Dong, B.; Qi, Y. Key micrornas and hub genes associated with poor prognosis in lung adenocarcinoma. Aging 2021, 13, 3742–3762. [Google Scholar] [CrossRef]
- Ding, D.X.; Li, Q.; Shi, K.; Li, H.; Guo, Q.; Zhang, Y.Q. Lncrna neat1-mir-101-3p/mir-335-5p/mir-374a-3p/mir-628-5p-trim6 axis identified as the prognostic biomarker for lung adenocarcinoma via bioinformatics and meta-analysis. Transl. Cancer Res. 2021, 10, 4870–4883. [Google Scholar] [CrossRef]
- Codreanu, S.G.; Hoeksema, M.D.; Slebos, R.J.C.; Zimmerman, L.J.; Rahman, S.M.J.; Li, M.; Chen, S.C.; Chen, H.; Eisenberg, R.; Liebler, D.C.; et al. Identification of proteomic features to distinguish benign pulmonary nodules from lung adenocarcinoma. J. Proteome Res. 2017, 16, 3266–3276. [Google Scholar] [CrossRef]
- Jiao, D.; Cai, Z.; Choksi, S.; Ma, D.; Choe, M.; Kwon, H.J.; Baik, J.Y.; Rowan, B.G.; Liu, C.; Liu, Z.G. Necroptosis of tumor cells leads to tumor necrosis and promotes tumor metastasis. Cell Res. 2018, 28, 868–870. [Google Scholar] [CrossRef]
- Langner, C.; Hutterer, G.; Chromecki, T.; Leibl, S.; Rehak, P.; Zigeuner, R. Tumor necrosis as prognostic indicator in transitional cell carcinoma of the upper urinary tract. J. Urol. 2006, 176, 910–913, discussion 913–914. [Google Scholar] [CrossRef]
- Gerard, A.; Cope, A.P.; Kemper, C.; Alon, R.; Kochl, R. Lfa-1 in t cell priming, differentiation, and effector functions. Trends Immunol. 2021, 42, 706–722. [Google Scholar] [CrossRef]
- Erdei, A.; Kovacs, K.G.; Nagy-Balo, Z.; Lukacsi, S.; Macsik-Valent, B.; Kurucz, I.; Bajtay, Z. New aspects in the regulation of human b cell functions by complement receptors cr1, cr2, cr3 and cr4. Immunol. Lett. 2021, 237, 42–57. [Google Scholar] [CrossRef]
- Bennett, M.L.; Bennett, F.C.; Liddelow, S.A.; Ajami, B.; Zamanian, J.L.; Fernhoff, N.B.; Mulinyawe, S.B.; Bohlen, C.J.; Adil, A.; Tucker, A.; et al. New tools for studying microglia in the mouse and human cns. Proc. Natl. Acad. Sci. USA 2016, 113, E1738–E1746. [Google Scholar] [CrossRef] [PubMed]
- Satoh, J.; Kino, Y.; Asahina, N.; Takitani, M.; Miyoshi, J.; Ishida, T.; Saito, Y. Tmem119 marks a subset of microglia in the human brain. Neuropathology 2016, 36, 39–49. [Google Scholar] [CrossRef] [PubMed]
- Joshi, H.; Morley, S.C. Efficient t cell migration and activation require l-plastin. Front. Immunol. 2022, 13, 916137. [Google Scholar] [CrossRef] [PubMed]
- Thummler, K.; Leipe, J.; Ramming, A.; Schulze-Koops, H.; Skapenko, A. Immune regulation by peripheral suppressor t cells induced upon homotypic t cell/t cell interactions. J. Leukoc. Biol. 2010, 88, 1041–1050. [Google Scholar] [CrossRef] [PubMed]
- Suk Lee, Y.; Davila, E.; Zhang, T.; Milmoe, H.P.; Vogel, S.N.; Bromberg, J.S.; Scalea, J.R. Myeloid-derived suppressor cells are bound and inhibited by anti-thymocyte globulin. Innate Immun. 2019, 25, 46–59. [Google Scholar] [CrossRef] [PubMed]
- Li, J.X.; Tsai, Y.Y.; Lai, C.T.; Li, Y.L.; Wu, Y.H.; Chiang, C.C. Lifitegrast ophthalmic solution 5% is a safe and efficient eyedrop for dry eye disease: A systematic review and meta-analysis. J. Clin. Med. 2022, 11, 5014. [Google Scholar] [CrossRef]
- Niederkorn, J.Y. Corneal nerves, cd11c(+) dendritic cells and their impact on ocular immune privilege. Front. Immunol. 2021, 12, 701935. [Google Scholar] [CrossRef]
- Wang, L.; Li, Z.; Ciric, B.; Safavi, F.; Zhang, G.X.; Rostami, A. Selective depletion of cd11c(+) cd11b(+) dendritic cells partially abrogates tolerogenic effects of intravenous mog in murine eae. Eur. J. Immunol. 2016, 46, 2454–2466. [Google Scholar] [CrossRef]
- Huck, N.A.; Donovan, L.J.; Shen, H.; Jordan, C.E.; Muwanga, G.P.B.; Bridges, C.M.; Forman, T.E.; Cordonnier, S.A.; Haight, E.S.; Dale-Huang, F.; et al. Sex-distinct microglial activation and myeloid cell infiltration in the spinal cord after painful peripheral injury. Neurobiol. Pain 2022, 12, 100106. [Google Scholar] [CrossRef]
- Li, J.; Dong, J.; Ouyang, J.; Cui, J.; Chen, Y.; Wang, F.; Wang, J. Synthesis, characterization, solubilization, cytotoxicity and antioxidant activity of aminomethylated dihydroquercetin. MedChemComm 2017, 8, 353–363. [Google Scholar] [CrossRef] [PubMed]
- Zinchenko, V.P.; Kim Iu, A.; Tarakhovskii Iu, S.; Bronnikov, G.E. Biological activity of water-soluble nanostructures of dihydroquercetin with cyclodextrins. Biofizika 2011, 56, 433–438. [Google Scholar] [CrossRef] [PubMed]
- Varlamova, E.G.; Khabatova, V.V.; Gudkov, S.V.; Plotnikov, E.Y.; Turovsky, E.A. Cytoprotective properties of a new nanocomplex of selenium with taxifolin in the cells of the cerebral cortex exposed to ischemia/reoxygenation. Pharmaceutics 2022, 14, 2477. [Google Scholar] [CrossRef] [PubMed]
- Varlamova, E.G.; Uspalenko, N.I.; Khmil, N.V.; Shigaeva, M.I.; Stepanov, M.R.; Ananyan, M.A.; Timchenko, M.A.; Molchanov, M.V.; Mironova, G.D.; Turovsky, E.A. A comparative analysis of neuroprotective properties of taxifolin and its water-soluble form in ischemia of cerebral cortical cells of the mouse. Int. J. Mol. Sci. 2023, 24, 11436. [Google Scholar] [CrossRef] [PubMed]


Disclaimer/Publisher’s Note: The statements, opinions and data contained in all publications are solely those of the individual author(s) and contributor(s) and not of MDPI and/or the editor(s). MDPI and/or the editor(s) disclaim responsibility for any injury to people or property resulting from any ideas, methods, instructions or products referred to in the content. |
© 2023 by the authors. Licensee MDPI, Basel, Switzerland. This article is an open access article distributed under the terms and conditions of the Creative Commons Attribution (CC BY) license (https://creativecommons.org/licenses/by/4.0/).
Share and Cite
Lin, X.; Dong, Y.; Gu, Y.; Wei, F.; Peng, J.; Su, Y.; Wang, Y.; Yang, C.; Neira, S.V.; Kapoor, A.; et al. Taxifolin Inhibits the Growth of Non-Small-Cell Lung Cancer via Downregulating Genes Displaying Novel and Robust Associations with Immune Evasion Factors. Cancers 2023, 15, 4818. https://doi.org/10.3390/cancers15194818
Lin X, Dong Y, Gu Y, Wei F, Peng J, Su Y, Wang Y, Yang C, Neira SV, Kapoor A, et al. Taxifolin Inhibits the Growth of Non-Small-Cell Lung Cancer via Downregulating Genes Displaying Novel and Robust Associations with Immune Evasion Factors. Cancers. 2023; 15(19):4818. https://doi.org/10.3390/cancers15194818
Chicago/Turabian StyleLin, Xiaozeng, Ying Dong, Yan Gu, Fengxiang Wei, Jingyi Peng, Yingying Su, Yanjun Wang, Chengzhi Yang, Sandra Vega Neira, Anil Kapoor, and et al. 2023. "Taxifolin Inhibits the Growth of Non-Small-Cell Lung Cancer via Downregulating Genes Displaying Novel and Robust Associations with Immune Evasion Factors" Cancers 15, no. 19: 4818. https://doi.org/10.3390/cancers15194818
APA StyleLin, X., Dong, Y., Gu, Y., Wei, F., Peng, J., Su, Y., Wang, Y., Yang, C., Neira, S. V., Kapoor, A., & Tang, D. (2023). Taxifolin Inhibits the Growth of Non-Small-Cell Lung Cancer via Downregulating Genes Displaying Novel and Robust Associations with Immune Evasion Factors. Cancers, 15(19), 4818. https://doi.org/10.3390/cancers15194818